Embed Size (px)
Citation preview

GROCERY FEASIBILITY STUDYDecatur, Texas
Prepared forDecatur Economic Development CorporationJanuary 2016
B U S I N E S S . T E X A S S T Y L E .
D E C A T U RB u s i n e ss . T e xas sT y l e .
B U S I N E S S . T E X A S S T Y L E .
D E C A T U RB u s i n e ss . T e xas sT y l e .

2
Grocery Demand AnalysisDecatur, Texas
Population Per Capita Sales Income Index Grocery Demand
9,870 $2,124.58 1.030 $21,600,135
5-Mile Radial Grocery Demand
Population Per Capita Sales Income Index Grocery Demand
24,205 $2,124.58 1.017 $52,296,012
10-Mile Radial Grocery Demand
Population Per Capita Sales Income Index Grocery Demand
47,820 $2,124.58 0.987 $100,304,069
15-Mile Radial Grocery Demand
TRADE AREA POPULATIONA trade area is the largest distance consumers are willing to travel to purchase retail goods and services. Its size depends on the variety of retail goods and services offered in the community and proximity to competing retail in nearby communities. In this case, we are using radial dimensions as the trade area.
PER CAPITA SALESThe total retail grocery sales in Texas divided by the number of people who live in Texas .
[$57,443,809,000 / 27,037,673]
INCOME INDEXAn index used to determine the increase or decrease in trade area purchasing power.
The per capita income of the trade area divided by the per capita income for the State of Texas.
Texas: [$26,940]5-Mile: [$27,750]10-Mile: [$27,396]15-Mile: [$26,597]
GROCERY DEMANDAn estimate of the trade area’s spending potential for grocery store sales.
Ex. 5-Mile: [9,870 x $2,124.58 x 1.030]
Grocery Sales in Texas
$57,443,809,000

3
Population Growth Over 5 YearsDecatur, Texas
9,600
9,700
9,800
9,900
10,000
10,100
10,200
10,300
2015 2016 2017 2018 2019 2020
5-MileRadial|PopulationGrowthOver5Years
23,600
23,800
24,000
24,200
24,400
24,600
24,800
25,000
25,200
25,400
25,600
2015 2016 2017 2018 2019 2020
10-MileRadial|PopulationGrowthOver5Years
46,500
47,000
47,500
48,000
48,500
49,000
49,500
50,000
50,500
2015 2016 2017 2018 2019 2020
15-MileRadial|PopulationGrowthOver5Years
Population projections are based on a 3.87% increase for the 5-mile radial, 4.77% increase for the 10-mile radial, and 4.96% for the 15-mile radial. This percentage of increase is over a five-year span.
9,870
9,946
10,023
10,101
10,179
10,252
24,205
24,436
24,669
24,904
25,141
25,359
47,3820
48,295
48,774
49,259
49,748
50,194

4
Grocery Demand Growth Over 5 YearsDecatur, Texas
$21,000,000
$21,200,000
$21,400,000
$21,600,000
$21,800,000
$22,000,000
$22,200,000
$22,400,000
$22,600,000
2015 2016 2017 2018 2019 2020
5-MileRadial|GroceryDemandGrowthOver5Years
$51,000,000
$51,500,000
$52,000,000
$52,500,000
$53,000,000
$53,500,000
$54,000,000
$54,500,000
$55,000,000
$55,500,000
2015 2016 2017 2018 2019 2020
10-MileRadial|GroceryDemandGrowthOver5Years
$97,000,000
$98,000,000
$99,000,000
$100,000,000
$101,000,000
$102,000,000
$103,000,000
$104,000,000
$105,000,000
$106,000,000
2015 2016 2017 2018 2019 2020
15-MileRadial|GroceryDemandGrowthOver5Years
Demand projections are based on a 3.87% increase for the 5-mile radial, 4.77% increase for the 10-mile radi-al, and 4.96% for the 15-mile radial. This percentage of increase is over a five-year span.
$21,598,734
$21,765,922
$21,934,404
$22,104,190
$22,275,290
$22,447,715
$52,296,012
$52,794,666
$53,298,075
$53,806,284
$54,319,338
$54,837,285
$100,304,069
$101,299,978
$102,305,776
$103,321,559
$104,347,429
$105,383,484

5
Copyright © and (P) 1988–2012 Microsoft Corporation and/or its suppliers. All rights reserved. http://www.microsoft.com/mappoint/Certain mapping and direction data © 2012 NAVTEQ. All rights reserved. The Data for areas of Canada includes information taken with permission from Canadian authorities, including: © Her Majesty the Queen in Right of Canada, © Queen's Printer for Ontario. NAVTEQ and NAVTEQ ON BOARD are trademarks of NAVTEQ. © 2012 Tele Atlas North America, Inc. All rights reserved. Tele Atlas and Tele Atlas North America are trademarks of Tele Atlas, Inc. © 2012 by Applied Geographic Solutions. All rights reserved. Portions © Copyright 2012 by Woodall Publications Corp. All rights reserved.
Decatur, Texas, United States
0 mi 2 4 6Contact InformationThom Lambert, Executive DirectorDecatur Economic Development Corporation203 W. Walnut Suite 102Decatur, Texas 76234
Phone [email protected]
5-Mile RadialDecatur, Texas
DECATUR
B U S I N E S S . T E X A S S T Y L E .
D E C A T U RB u s i n e ss . T e xas sT y l e .
B U S I N E S S . T E X A S S T Y L E .
D E C A T U RB u s i n e ss . T e xas sT y l e .

6
DESCRIPTION DATA %
Population
2020 Projection 10,252
2015 Estimate 9,870
2010 Census 9,571
2000 Census 7,827
Growth 2015-2020 3.87%
Growth 2010-2015 3.13%
Growth 2000-2010 22.27%
2015 Est. Population by Single-Classification Race 9,870
White Alone 8,600 87.13
Black or African American Alone 171 1.73
Amer. Indian and Alaska Native Alone 66 0.67
Asian Alone 70 0.71
Native Hawaiian and Other Pac. Isl. Alone 2 0.02
Some Other Race Alone 803 8.14
Two or More Races 159 1.61
2015 Est. Population by Hispanic or Latino Origin 9,870
Not Hispanic or Latino 7,353 74.50
Hispanic or Latino: 2,517 25.50
Mexican 2,303 91.50
Puerto Rican 24 0.95
Cuban 15 0.60
All Other Hispanic or Latino 175 6.95
DESCRIPTION DATA %
2015 Est. Hisp. or Latino Pop by Single-Class. Race 2,517
White Alone 1,619 64.32
Black or African American Alone 14 0.56
American Indian and Alaska Native Alone 18 0.72
Asian Alone 1 0.04
Native Hawaiian and Other Pacific Islander Alone 0 0.00
Some Other Race Alone 797 31.66
Two or More Races 69 2.74
2015 Est. Pop by Race, Asian Alone, by Category 70
Chinese, except Taiwanese 2 2.86
Filipino 2 2.86
Japanese 41 58.57
Asian Indian 2 2.86
Korean 0 0.00
Vietnamese 0 0.00
Cambodian 13 18.57
Hmong 2 2.86
Laotian 0 0.00
Thai 0 0.00
All Other Asian Races Including 2+ Category 8 11.43
2015 Est. Population by Ancestry 9,870
Arab 0 0.00
Czech 15 0.15
Danish 6 0.06
Dutch 72 0.73
English 582 5.90
French (except Basque) 78 0.79
French Canadian 5 0.05
German 804 8.15
Greek 8 0.08
Radial Demographics | 5-Mile RadialDecatur, Texas

7
DESCRIPTION DATA %
Hungarian 0 0.00
Irish 475 4.81
Italian 96 0.97
Lithuanian 0 0.00
United States or American 693 7.02
Norwegian 29 0.29
Polish 36 0.36
Portuguese 7 0.07
Russian 0 0.00
Scottish 113 1.14
Scotch-Irish 66 0.67
Slovak 0 0.00
Subsaharan African 0 0.00
Swedish 6 0.06
Swiss 53 0.54
Ukrainian 0 0.00
Welsh 20 0.20
West Indian (except Hisp. groups) 27 0.27
Other ancestries 4,213 42.68
Ancestry Unclassified 2,466 24.98
2015 Est. Pop Age 5+ by Language Spoken at Home 9,194
Speak Only English at Home 6,980 75.92
Speak Asian/Pac. Isl. Lang. at Home 15 0.16
Speak IndoEuropean Language at Home 31 0.34
Speak Spanish at Home 2,151 23.40
Speak Other Language at Home 17 0.18
2015 Est. Population by Sex 9,870
Male 4,795 48.58
Female 5,075 51.42
DESCRIPTION DATA %
2015 Est. Population by Age 9,870
Age 0 - 4 676 6.85
Age 5 - 9 685 6.94
Age 10 - 14 736 7.46
Age 15 - 17 441 4.47
Age 18 - 20 397 4.02
Age 21 - 24 521 5.28
Age 25 - 34 1,244 12.60
Age 35 - 44 1,136 11.51
Age 45 - 54 1,333 13.51
Age 55 - 64 1,140 11.55
Age 65 - 74 809 8.20
Age 75 - 84 504 5.11
Age 85 and over 246 2.49
Age 16 and over 7,629 77.29
Age 18 and over 7,331 74.28
Age 21 and over 6,935 70.26
Age 65 and over 1,559 15.80
2015 Est. Median Age 37.1
2015 Est. Average Age 38.4
Radial Demographics | 5-Mile RadialDecatur, Texas

8
DESCRIPTION DATA %
2015 Est. Male Population by Age 4,795
Age 0 - 4 347 7.24
Age 5 - 9 342 7.13
Age 10 - 14 385 8.03
Age 15 - 17 218 4.55
Age 18 - 20 201 4.19
Age 21 - 24 270 5.63
Age 25 - 34 643 13.41
Age 35 - 44 561 11.70
Age 45 - 54 617 12.87
Age 55 - 64 569 11.87
Age 65 - 74 376 7.84
Age 75 - 84 202 4.21
Age 85 and over 62 1.29
2015 Est. Median Age, Male 34.8
2015 Est. Average Age, Male 36.8
2015 Est. Female Population by Age 5,075
Age 0 - 4 329 6.48
Age 5 - 9 343 6.76
Age 10 - 14 351 6.92
Age 15 - 17 223 4.39
Age 18 - 20 196 3.86
Age 21 - 24 251 4.95
Age 25 - 34 601 11.84
Age 35 - 44 575 11.33
Age 45 - 54 716 14.11
Age 55 - 64 571 11.25
Age 65 - 74 433 8.53
Age 75 - 84 302 5.95
Age 85 and over 184 3.63
DESCRIPTION DATA %
2015 Est. Median Age, Female 39.2
2015 Est. Average Age, Female 40.0
2015 Est. Pop Age 15+ by Marital Status 7,772
Total, Never Married 1,741 22.40
Males, Never Married 1,048 13.48
Females, Never Married 693 8.92
Married, Spouse present 4,309 55.44
Married, Spouse absent 233 3.00
Widowed 538 6.92
Males Widowed 72 0.93
Females Widowed 466 6.00
Divorced 952 12.25
Males Divorced 369 4.75
Females Divorced 582 7.49
2015 Est. Pop Age 25+ by Edu. Attainment 6,413
Less than 9th grade 748 11.66
Some High School, no diploma 592 9.23
High School Graduate (or GED) 2,127 33.17
Some College, no degree 1,316 20.52
Associate Degree 283 4.41
Bachelor's Degree 976 15.22
Master's Degree 273 4.26
Professional School Degree 62 0.97
Doctorate Degree 35 0.55
2015 Est. Pop Age 25+ by Edu. Attain., Hisp./Lat. 1,224
No High School Diploma 703 57.43
High School Graduate 337 27.53
Some College or Associate's Degree 77 6.29
Bachelor's Degree or Higher 106 8.66
Radial Demographics | 5-Mile RadialDecatur, Texas

9
DESCRIPTION DATA %
Households
2020 Projection 3,647
2015 Estimate 3,526
2010 Census 3,445
2000 Census 2,755
Growth 2015-2020 3.44%
Growth 2010-2015 2.35%
Growth 2000-2010 25.06%
2015 Est. Households by Household Type 3,526
Family Households 2,606 73.91
Nonfamily Households 920 26.09
2015 Est. Group Quarters Population 204
2015 HHs by Ethnicity, Hispanic/Latino 631 17.90
2015 Est. Households by HH Income 3,526
Income < $15,000 365 10.35
Income $15,000 - $24,999 309 8.76
Income $25,000 - $34,999 393 11.15
Income $35,000 - $49,999 597 16.93
Income $50,000 - $74,999 530 15.03
Income $75,000 - $99,999 496 14.07
Income $100,000 - $124,999 257 7.29
Income $125,000 - $149,999 183 5.19
Income $150,000 - $199,999 190 5.39
Income $200,000 - $249,999 76 2.16
Income $250,000 - $499,999 98 2.78
Income $500,000+ 32 0.91
2015 Est. Average Household Income $78,042
DESCRIPTION DATA %
2015 Est. Median Household Income $54,671
2015 Median HH Inc. by Single-Class. Race or Eth.
White Alone 53,533
Black or African American Alone 45,763
American Indian and Alaska Native Alone 98,297
Asian Alone 42,183
Native Hawaiian and Other Pacific Islander Alone 50,000
Some Other Race Alone 60,966
Two or More Races 34,255
Hispanic or Latino 40,837
Not Hispanic or Latino 61,341
2015 Est. Family HH Type by Presence of Own Child. 2,606
Married-Couple Family, own children 921 35.34
Married-Couple Family, no own children 1,127 43.25
Male Householder, own children 74 2.84
Male Householder, no own children 91 3.49
Female Householder, own children 227 8.71
Female Householder, no own children 166 6.37
2015 Est. Households by Household Size 3,526
1-person 784 22.23
2-person 1,126 31.93
3-person 596 16.90
4-person 540 15.31
5-person 296 8.39
6-person 123 3.49
7-or-more-person 61 1.73
2015 Est. Average Household Size 2.74
Radial Demographics | 5-Mile RadialDecatur, Texas
10
DESCRIPTION DATA %
2015 Est. Households by Presence of People Under 18 3,526
Households with 1 or More People under Age 18: 1,372 38.91
Married-Couple Family 990 72.16
Other Family, Male Householder 103 7.51
Other Family, Female Householder 272 19.83
Nonfamily, Male Householder 7 0.51
Nonfamily, Female Householder 0 0.00
Households with No People under Age 18: 2,154 61.09
Married-Couple Family 1,056 49.03
Other Family, Male Householder 63 2.92
Other Family, Female Householder 122 5.66
Nonfamily, Male Householder 398 18.48
Nonfamily, Female Householder 514 23.86
2015 Est. Households by Number of Vehicles 3,526
No Vehicles 119 3.37
1 Vehicle 1,041 29.52
2 Vehicles 1,521 43.14
3 Vehicles 641 18.18
4 Vehicles 146 4.14
5 or more Vehicles 57 1.62
2015 Est. Average Number of Vehicles 2.0
Family Households
2020 Projection 2,694
DESCRIPTION DATA %
2015 Estimate 2,606
2010 Census 2,548
2000 Census 2,075
Growth 2015-2020 3.40%
Growth 2010-2015 2.26%
Growth 2000-2010 22.81%
2015 Est. Families by Poverty Status 2,606
2015 Families at or Above Poverty 2,328 89.33
2015 Families at or Above Poverty with Children 1,080 41.44
2015 Families Below Poverty 278 10.67
2015 Families Below Poverty with Children 232 8.90
2015 Est. Pop Age 16+ by Employment Status 7,629
In Armed Forces 26 0.34
Civilian - Employed 4,236 55.52
Civilian - Unemployed 399 5.23
Not in Labor Force 2,968 38.90
2015 Est. Civ. Employed Pop 16+ by Class of Worker 4,267
For-Profit Private Workers 2,828 66.28
Non-Profit Private Workers 174 4.08
Local Government Workers 397 9.30
State Government Workers 167 3.91
Federal Government Workers 41 0.96
Self-Employed Workers 645 15.12
Unpaid Family Workers 15 0.35
2015 Est. Civ. Employed Pop 16+ by Occupation 4,267
Architect/Engineer 45 1.05
Radial Demographics | 5-Mile RadialDecatur, Texas
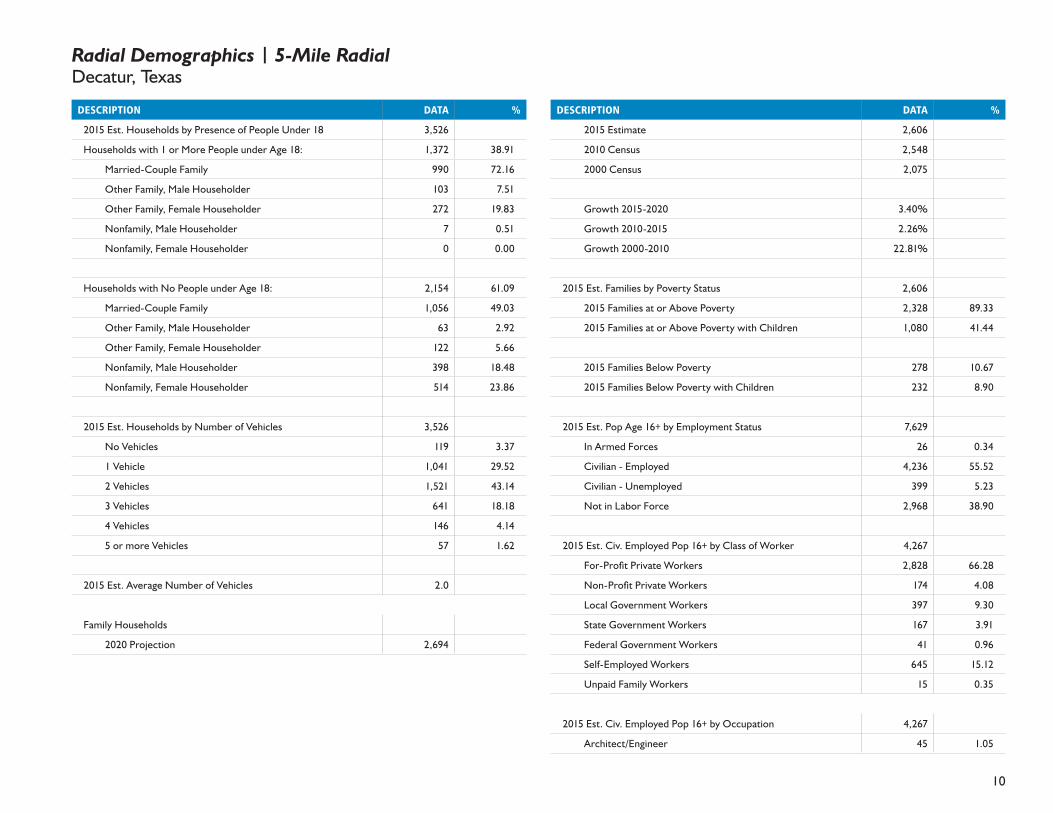
11
DESCRIPTION DATA %
Arts/Entertainment/Sports 77 1.80
Building Grounds Maintenance 148 3.47
Business/Financial Operations 81 1.90
Community/Social Services 48 1.12
Computer/Mathematical 29 0.68
Construction/Extraction 347 8.13
Education/Training/Library 315 7.38
Farming/Fishing/Forestry 120 2.81
Food Prep/Serving 193 4.52
Health Practitioner/Technician 232 5.44
Healthcare Support 92 2.16
Maintenance Repair 244 5.72
Legal 103 2.41
Life/Physical/Social Science 9 0.21
Management 407 9.54
Office/Admin. Support 485 11.37
Production 294 6.89
Protective Services 95 2.23
Sales/Related 404 9.47
Personal Care/Service 161 3.77
Transportation/Moving 337 7.90
2015 Est. Pop 16+ by Occupation Classification 4,267
Blue Collar 1,222 28.64
White Collar 2,235 52.38
Service and Farm 810 18.98
2015 Est. Workers Age 16+ by Transp. to Work 4,253
Drove Alone 3,353 78.84
DESCRIPTION DATA %
Car Pooled 606 14.25
Public Transportation 0 0.00
Walked 38 0.89
Bicycle 0 0.00
Other Means 20 0.47
Worked at Home 236 5.55
2015 Est. Workers Age 16+ by Travel Time to Work *
Less than 15 Minutes 1,791
15 - 29 Minutes 857
30 - 44 Minutes 586
45 - 59 Minutes 406
60 or more Minutes 384
2015 Est. Avg. Travel Time to Work in Minutes 26.25
2015 Est. Occupied Housing Units by Tenure 3,526
Owner Occupied 2,425 68.77
Renter Occupied 1,101 31.23
2015 Owner Occ. HUs: Avg. Length of Residence 15.2
2015 Renter Occ. HUs: Avg. Length of Residence 8.2
2015 Est. Owner-Occupied Housing Units by Value 2,425
Value Less than $20,000 75 3.09
Value $20,000 - $39,999 129 5.32
Radial Demographics | 5-Mile RadialDecatur, Texas
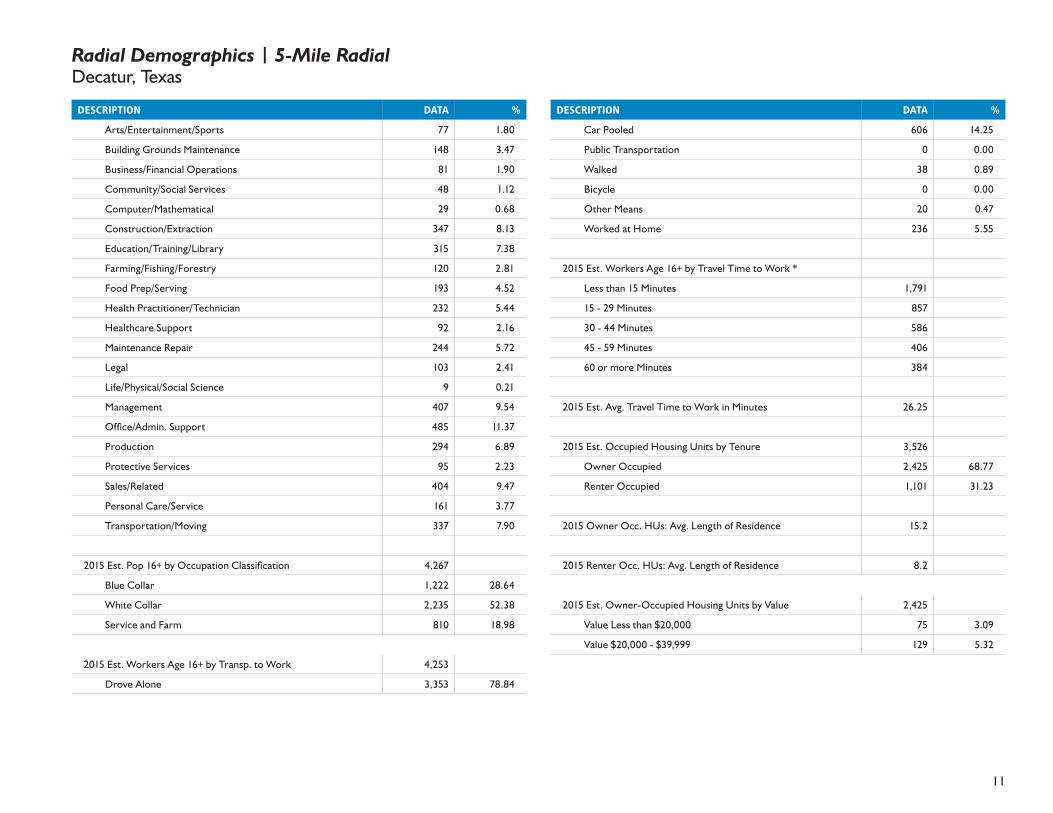
12
DESCRIPTION DATA %
Value $40,000 - $59,999 150 6.19
Value $60,000 - $79,999 205 8.45
Value $80,000 - $99,999 214 8.82
Value $100,000 - $149,999 386 15.92
Value $150,000 - $199,999 514 21.20
Value $200,000 - $299,999 411 16.95
Value $300,000 - $399,999 172 7.09
Value $400,000 - $499,999 87 3.59
Value $500,000 - $749,999 56 2.31
Value $750,000 - $999,999 16 0.66
Value $1,000,000 or more 9 0.37
2015 Est. Median All Owner-Occupied Housing Value $155,097
2015 Est. Housing Units by Units in Structure 3,896
1 Unit Attached 119 3.05
1 Unit Detached 2,776 71.25
2 Units 109 2.80
3 or 4 Units 173 4.44
5 to 19 Units 223 5.72
20 to 49 Units 27 0.69
50 or More Units 54 1.39
Mobile Home or Trailer 402 10.32
Boat, RV, Van, etc. 14 0.36
2015 Est. Housing Units by Year Structure Built 3,896
Housing Units Built 2010 or later 142 3.64
Housing Units Built 2000 to 2009 801 20.56
DESCRIPTION DATA %
Housing Units Built 1990 to 1999 940 24.13
Housing Units Built 1980 to 1989 696 17.86
Housing Units Built 1970 to 1979 478 12.27
Housing Units Built 1960 to 1969 184 4.72
Housing Units Built 1950 to 1959 205 5.26
Housing Units Built 1940 to 1949 212 5.44
Housing Unit Built 1939 or Earlier 237 6.08
2015 Est. Median Year Structure Built** 1989
Radial Demographics | 5-Mile RadialDecatur, Texas
13
Copyright © and (P) 1988–2012 Microsoft Corporation and/or its suppliers. All rights reserved. http://www.microsoft.com/mappoint/Certain mapping and direction data © 2012 NAVTEQ. All rights reserved. The Data for areas of Canada includes information taken with permission from Canadian authorities, including: © Her Majesty the Queen in Right of Canada, © Queen's Printer for Ontario. NAVTEQ and NAVTEQ ON BOARD are trademarks of NAVTEQ. © 2012 Tele Atlas North America, Inc. All rights reserved. Tele Atlas and Tele Atlas North America are trademarks of Tele Atlas, Inc. © 2012 by Applied Geographic Solutions. All rights reserved. Portions © Copyright 2012 by Woodall Publications Corp. All rights reserved.
Decatur, Texas, United States
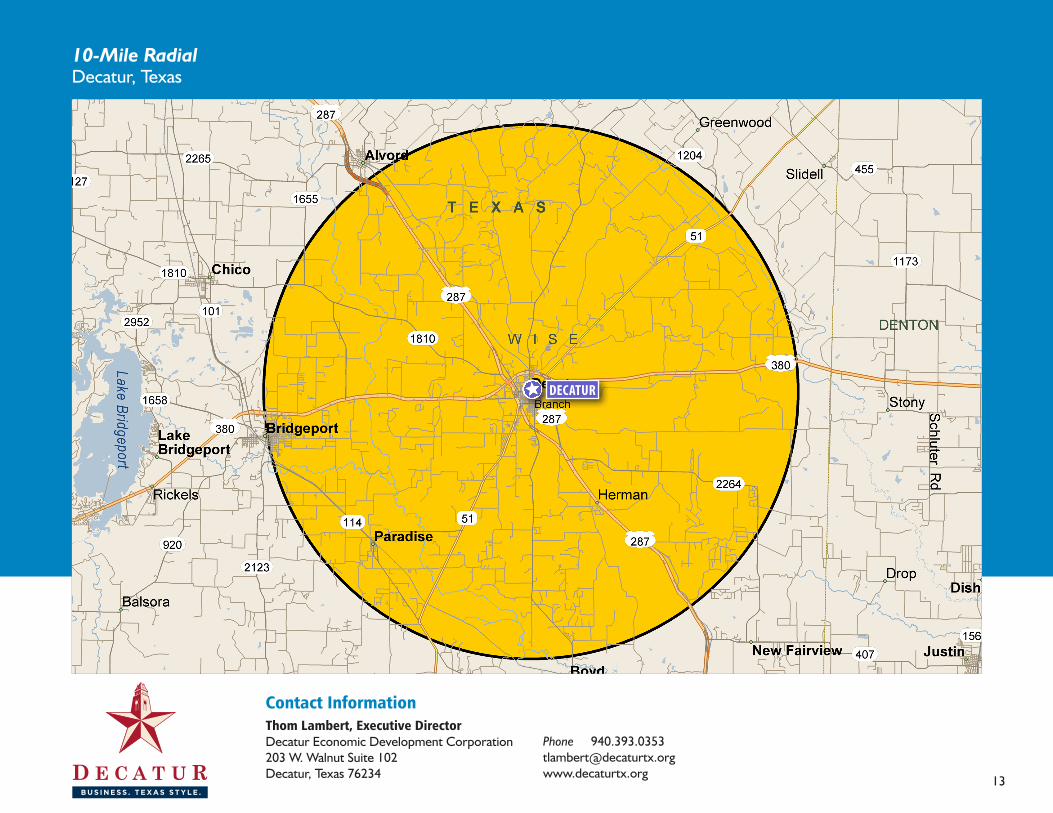
0 mi 2 4 6 8 10 12Contact InformationThom Lambert, Executive DirectorDecatur Economic Development Corporation203 W. Walnut Suite 102Decatur, Texas 76234
Phone [email protected]
10-Mile RadialDecatur, Texas
DECATUR
B U S I N E S S . T E X A S S T Y L E .
D E C A T U RB u s i n e ss . T e xas sT y l e .
B U S I N E S S . T E X A S S T Y L E .
D E C A T U RB u s i n e ss . T e xas sT y l e .

14
DESCRIPTION DATA %
Population
2020 Projection 25,359
2015 Estimate 24,205
2010 Census 23,215
2000 Census 19,134
Growth 2015-2020 4.77%
Growth 2010-2015 4.26%
Growth 2000-2010 21.33%
2015 Est. Population by Single-Classification Race 24,205
White Alone 20,933 86.48
Black or African American Alone 451 1.86
Amer. Indian and Alaska Native Alone 181 0.75
Asian Alone 151 0.62
Native Hawaiian and Other Pac. Isl. Alone 5 0.02
Some Other Race Alone 2,025 8.37
Two or More Races 459 1.90
2015 Est. Population by Hispanic or Latino Origin 24,205
Not Hispanic or Latino 18,302 75.61
Hispanic or Latino: 5,903 24.39
Mexican 5,377 91.09
Puerto Rican 44 0.75
Cuban 28 0.47
All Other Hispanic or Latino 454 7.69
DESCRIPTION DATA %
2015 Est. Hisp. or Latino Pop by Single-Class. Race 5,903
White Alone 3,559 60.29
Black or African American Alone 31 0.53
American Indian and Alaska Native Alone 64 1.08
Asian Alone 5 0.08
Native Hawaiian and Other Pacific Islander Alone 1 0.02
Some Other Race Alone 2,006 33.98
Two or More Races 235 3.98
2015 Est. Pop by Race, Asian Alone, by Category 151
Chinese, except Taiwanese 4 2.65
Filipino 17 11.26
Japanese 41 27.15
Asian Indian 5 3.31
Korean 0 0.00
Vietnamese 3 1.99
Cambodian 29 19.21
Hmong 5 3.31
Laotian 0 0.00
Thai 0 0.00
All Other Asian Races Including 2+ Category 47 31.13
2015 Est. Population by Ancestry 24,205
Arab 0 0.00
Czech 52 0.21
Danish 25 0.10
Dutch 133 0.55
English 1,346 5.56
French (except Basque) 214 0.88
French Canadian 25 0.10
German 1,905 7.87
Greek 19 0.08
Radial Demographics | 10-Mile RadialDecatur, Texas
15
DESCRIPTION DATA %
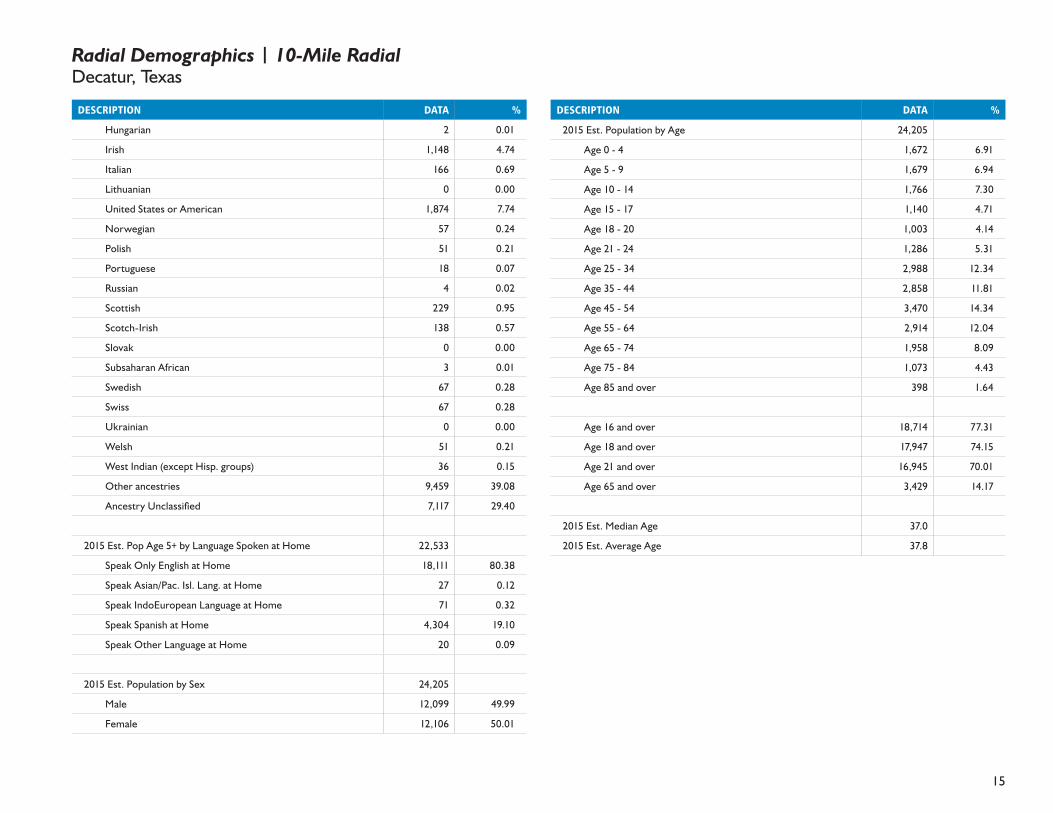
Hungarian 2 0.01
Irish 1,148 4.74
Italian 166 0.69
Lithuanian 0 0.00
United States or American 1,874 7.74
Norwegian 57 0.24
Polish 51 0.21
Portuguese 18 0.07
Russian 4 0.02
Scottish 229 0.95
Scotch-Irish 138 0.57
Slovak 0 0.00
Subsaharan African 3 0.01
Swedish 67 0.28
Swiss 67 0.28
Ukrainian 0 0.00
Welsh 51 0.21
West Indian (except Hisp. groups) 36 0.15
Other ancestries 9,459 39.08
Ancestry Unclassified 7,117 29.40
2015 Est. Pop Age 5+ by Language Spoken at Home 22,533
Speak Only English at Home 18,111 80.38
Speak Asian/Pac. Isl. Lang. at Home 27 0.12
Speak IndoEuropean Language at Home 71 0.32
Speak Spanish at Home 4,304 19.10
Speak Other Language at Home 20 0.09
2015 Est. Population by Sex 24,205
Male 12,099 49.99
Female 12,106 50.01
DESCRIPTION DATA %
2015 Est. Population by Age 24,205
Age 0 - 4 1,672 6.91
Age 5 - 9 1,679 6.94
Age 10 - 14 1,766 7.30
Age 15 - 17 1,140 4.71
Age 18 - 20 1,003 4.14
Age 21 - 24 1,286 5.31
Age 25 - 34 2,988 12.34
Age 35 - 44 2,858 11.81
Age 45 - 54 3,470 14.34
Age 55 - 64 2,914 12.04
Age 65 - 74 1,958 8.09
Age 75 - 84 1,073 4.43
Age 85 and over 398 1.64
Age 16 and over 18,714 77.31
Age 18 and over 17,947 74.15
Age 21 and over 16,945 70.01
Age 65 and over 3,429 14.17
2015 Est. Median Age 37.0
2015 Est. Average Age 37.8
Radial Demographics | 10-Mile RadialDecatur, Texas

16
DESCRIPTION DATA %
2015 Est. Male Population by Age 12,099
Age 0 - 4 859 7.10
Age 5 - 9 855 7.07
Age 10 - 14 907 7.50
Age 15 - 17 581 4.80
Age 18 - 20 518 4.28
Age 21 - 24 671 5.55
Age 25 - 34 1,556 12.86
Age 35 - 44 1,438 11.89
Age 45 - 54 1,701 14.06
Age 55 - 64 1,484 12.27
Age 65 - 74 953 7.88
Age 75 - 84 458 3.79
Age 85 and over 117 0.97
2015 Est. Median Age, Male 35.7
2015 Est. Average Age, Male 36.9
2015 Est. Female Population by Age 12,106
Age 0 - 4 813 6.72
Age 5 - 9 824 6.81
Age 10 - 14 859 7.10
Age 15 - 17 559 4.62
Age 18 - 20 485 4.01
Age 21 - 24 615 5.08
Age 25 - 34 1,432 11.83
Age 35 - 44 1,419 11.72
Age 45 - 54 1,769 14.61
Age 55 - 64 1,429 11.80
Age 65 - 74 1,005 8.30
Age 75 - 84 615 5.08
Age 85 and over 281 2.32
DESCRIPTION DATA %
2015 Est. Median Age, Female 38.3
2015 Est. Average Age, Female 38.8
2015 Est. Pop Age 15+ by Marital Status 19,087
Total, Never Married 4,233 22.18
Males, Never Married 2,622 13.74
Females, Never Married 1,611 8.44
Married, Spouse present 10,772 56.44
Married, Spouse absent 636 3.33
Widowed 1,130 5.92
Males Widowed 169 0.89
Females Widowed 961 5.03
Divorced 2,316 12.13
Males Divorced 926 4.85
Females Divorced 1,390 7.28
2015 Est. Pop Age 25+ by Edu. Attainment 15,659
Less than 9th grade 1,435 9.16
Some High School, no diploma 1,521 9.71
High School Graduate (or GED) 5,527 35.30
Some College, no degree 3,676 23.48
Associate Degree 731 4.67
Bachelor's Degree 2,027 12.94
Master's Degree 595 3.80
Professional School Degree 102 0.65
Doctorate Degree 46 0.29
2015 Est. Pop Age 25+ by Edu. Attain., Hisp./Lat. 2,868
No High School Diploma 1,589 55.40
High School Graduate 734 25.59
Some College or Associate's Degree 369 12.87
Bachelor's Degree or Higher 176 6.14
Radial Demographics | 10-Mile RadialDecatur, Texas

17
DESCRIPTION DATA %
Households
2020 Projection 8,880
2015 Estimate 8,473
2010 Census 8,131
2000 Census 6,625
Growth 2015-2020 4.80%
Growth 2010-2015 4.21%
Growth 2000-2010 22.73%
2015 Est. Households by Household Type 8,473
Family Households 6,468 76.34
Nonfamily Households 2,005 23.66
2015 Est. Group Quarters Population 538
2015 HHs by Ethnicity, Hispanic/Latino 1,421 16.77
2015 Est. Households by HH Income 8,473
Income < $15,000 775 9.15
Income $15,000 - $24,999 761 8.98
Income $25,000 - $34,999 796 9.39
Income $35,000 - $49,999 1,345 15.87
Income $50,000 - $74,999 1,478 17.44
Income $75,000 - $99,999 1,265 14.93
Income $100,000 - $124,999 777 9.17
Income $125,000 - $149,999 459 5.42
Income $150,000 - $199,999 387 4.57
Income $200,000 - $249,999 160 1.89
Income $250,000 - $499,999 202 2.38
Income $500,000+ 69 0.81
2015 Est. Average Household Income $78,029
DESCRIPTION DATA %
2015 Est. Median Household Income $59,471
2015 Median HH Inc. by Single-Class. Race or Eth.
White Alone 59,989
Black or African American Alone 54,821
American Indian and Alaska Native Alone 98,115
Asian Alone 36,528
Native Hawaiian and Other Pacific Islander Alone 35,997
Some Other Race Alone 57,404
Two or More Races 33,711
Hispanic or Latino 42,386
Not Hispanic or Latino 65,917
2015 Est. Family HH Type by Presence of Own Child. 6,468
Married-Couple Family, own children 2,334 36.09
Married-Couple Family, no own children 2,854 44.12
Male Householder, own children 195 3.01
Male Householder, no own children 207 3.20
Female Householder, own children 495 7.65
Female Householder, no own children 384 5.94
2015 Est. Households by Household Size 8,473
1-person 1,710 20.18
2-person 2,797 33.01
3-person 1,451 17.12
4-person 1,318 15.56
5-person 729 8.60
6-person 300 3.54
7-or-more-person 168 1.98
2015 Est. Average Household Size 2.79
Radial Demographics | 10-Mile RadialDecatur, Texas

18
DESCRIPTION DATA %
2015 Est. Households by Presence of People Under 18 8,473
Households with 1 or More People under Age 18: 3,389 40.00
Married-Couple Family 2,528 74.59
Other Family, Male Householder 242 7.14
Other Family, Female Householder 598 17.65
Nonfamily, Male Householder 16 0.47
Nonfamily, Female Householder 4 0.12
Households with No People under Age 18: 5,085 60.01
Married-Couple Family 2,659 52.29
Other Family, Male Householder 159 3.13
Other Family, Female Householder 281 5.53
Nonfamily, Male Householder 965 18.98
Nonfamily, Female Householder 1,021 20.08
2015 Est. Households by Number of Vehicles 8,473
No Vehicles 255 3.01
1 Vehicle 2,421 28.57
2 Vehicles 3,620 42.72
3 Vehicles 1,538 18.15
4 Vehicles 471 5.56
5 or more Vehicles 167 1.97
2015 Est. Average Number of Vehicles 2.0
Family Households
2020 Projection 6,780
DESCRIPTION DATA %
2015 Estimate 6,468
2010 Census 6,207
2000 Census 5,135
Growth 2015-2020 4.83%
Growth 2010-2015 4.20%
Growth 2000-2010 20.89%
2015 Est. Families by Poverty Status 6,468
2015 Families at or Above Poverty 5,819 89.97
2015 Families at or Above Poverty with Children 2,642 40.85
2015 Families Below Poverty 649 10.03
2015 Families Below Poverty with Children 504 7.79
2015 Est. Pop Age 16+ by Employment Status 18,714
In Armed Forces 26 0.14
Civilian - Employed 10,621 56.75
Civilian - Unemployed 1,060 5.66
Not in Labor Force 7,007 37.44
2015 Est. Civ. Employed Pop 16+ by Class of Worker 10,682
For-Profit Private Workers 7,326 68.58
Non-Profit Private Workers 515 4.82
Local Government Workers 1,010 9.46
State Government Workers 402 3.76
Federal Government Workers 125 1.17
Self-Employed Workers 1,271 11.90
Unpaid Family Workers 33 0.31
2015 Est. Civ. Employed Pop 16+ by Occupation 10,682
Architect/Engineer 112 1.05
Radial Demographics | 10-Mile RadialDecatur, Texas

19
DESCRIPTION DATA %
Arts/Entertainment/Sports 148 1.39
Building Grounds Maintenance 497 4.65
Business/Financial Operations 190 1.78
Community/Social Services 129 1.21
Computer/Mathematical 113 1.06
Construction/Extraction 903 8.45
Education/Training/Library 738 6.91
Farming/Fishing/Forestry 176 1.65
Food Prep/Serving 427 4.00
Health Practitioner/Technician 443 4.15
Healthcare Support 180 1.69
Maintenance Repair 660 6.18
Legal 142 1.33
Life/Physical/Social Science 22 0.21
Management 1,037 9.71
Office/Admin. Support 1,478 13.84
Production 682 6.38
Protective Services 232 2.17
Sales/Related 1,113 10.42
Personal Care/Service 341 3.19
Transportation/Moving 919 8.60
2015 Est. Pop 16+ by Occupation Classification 10,682
Blue Collar 3,163 29.61
White Collar 5,666 53.04
Service and Farm 1,853 17.35
2015 Est. Workers Age 16+ by Transp. to Work 10,535
Drove Alone 8,458 80.28
DESCRIPTION DATA %
Car Pooled 1,434 13.61
Public Transportation 1 0.01
Walked 107 1.02
Bicycle 0 0.00
Other Means 90 0.85
Worked at Home 444 4.21
2015 Est. Workers Age 16+ by Travel Time to Work *
Less than 15 Minutes 3,705
15 - 29 Minutes 2,492
30 - 44 Minutes 1,666
45 - 59 Minutes 1,090
60 or more Minutes 1,125
2015 Est. Avg. Travel Time to Work in Minutes 28.91
2015 Est. Occupied Housing Units by Tenure 8,473
Owner Occupied 6,301 74.37
Renter Occupied 2,172 25.63
2015 Owner Occ. HUs: Avg. Length of Residence 14.7
2015 Renter Occ. HUs: Avg. Length of Residence 7.8
2015 Est. Owner-Occupied Housing Units by Value 6,301
Value Less than $20,000 182 2.89
Value $20,000 - $39,999 335 5.32
Radial Demographics | 10-Mile RadialDecatur, Texas

20
DESCRIPTION DATA %
Value $40,000 - $59,999 515 8.17
Value $60,000 - $79,999 572 9.08
Value $80,000 - $99,999 677 10.74
Value $100,000 - $149,999 1,042 16.54
Value $150,000 - $199,999 1,106 17.55
Value $200,000 - $299,999 1,052 16.70
Value $300,000 - $399,999 425 6.74
Value $400,000 - $499,999 209 3.32
Value $500,000 - $749,999 128 2.03
Value $750,000 - $999,999 34 0.54
Value $1,000,000 or more 24 0.38
2015 Est. Median All Owner-Occupied Housing Value $141,738
2015 Est. Housing Units by Units in Structure 9,367
1 Unit Attached 188 2.01
1 Unit Detached 6,170 65.87
2 Units 302 3.22
3 or 4 Units 223 2.38
5 to 19 Units 290 3.10
20 to 49 Units 75 0.80
50 or More Units 65 0.69
Mobile Home or Trailer 2,032 21.69
Boat, RV, Van, etc. 23 0.25
2015 Est. Housing Units by Year Structure Built 9,367
Housing Units Built 2010 or later 444 4.74
Housing Units Built 2000 to 2009 2,116 22.59
DESCRIPTION DATA %
Housing Units Built 1990 to 1999 2,189 23.37
Housing Units Built 1980 to 1989 1,578 16.85
Housing Units Built 1970 to 1979 1,164 12.43
Housing Units Built 1960 to 1969 573 6.12
Housing Units Built 1950 to 1959 540 5.76
Housing Units Built 1940 to 1949 319 3.41
Housing Unit Built 1939 or Earlier 444 4.74
2015 Est. Median Year Structure Built** 1990
Radial Demographics | 10-Mile RadialDecatur, Texas

21
Copyright © and (P) 1988–2012 Microsoft Corporation and/or its suppliers. All rights reserved. http://www.microsoft.com/mappoint/Certain mapping and direction data © 2012 NAVTEQ. All rights reserved. The Data for areas of Canada includes information taken with permission from Canadian authorities, including: © Her Majesty the Queen in Right of Canada, © Queen's Printer for Ontario. NAVTEQ and NAVTEQ ON BOARD are trademarks of NAVTEQ. © 2012 Tele Atlas North America, Inc. All rights reserved. Tele Atlas and Tele Atlas North America are trademarks of Tele Atlas, Inc. © 2012 by Applied Geographic Solutions. All rights reserved. Portions © Copyright 2012 by Woodall Publications Corp. All rights reserved.
Texas, United States, North America
0 mi 5 10 15 20Contact InformationThom Lambert, Executive DirectorDecatur Economic Development Corporation203 W. Walnut Suite 102Decatur, Texas 76234
Phone [email protected]
15-Mile RadialDecatur, Texas
DECATUR
B U S I N E S S . T E X A S S T Y L E .
D E C A T U RB u s i n e ss . T e xas sT y l e .
B U S I N E S S . T E X A S S T Y L E .
D E C A T U RB u s i n e ss . T e xas sT y l e .

22
DESCRIPTION DATA %
Population
2020 Projection 50,194
2015 Estimate 47,820
2010 Census 45,719
2000 Census 38,287
Growth 2015-2020 4.96%
Growth 2010-2015 4.60%
Growth 2000-2010 19.41%
2015 Est. Population by Single-Classification Race 47,820
White Alone 41,371 86.51
Black or African American Alone 810 1.69
Amer. Indian and Alaska Native Alone 415 0.87
Asian Alone 242 0.51
Native Hawaiian and Other Pac. Isl. Alone 23 0.05
Some Other Race Alone 3,940 8.24
Two or More Races 1,018 2.13
2015 Est. Population by Hispanic or Latino Origin 47,820
Not Hispanic or Latino 37,807 79.06
Hispanic or Latino: 10,013 20.94
Mexican 9,007 89.95
Puerto Rican 83 0.83
Cuban 56 0.56
All Other Hispanic or Latino 868 8.67
DESCRIPTION DATA %
2015 Est. Hisp. or Latino Pop by Single-Class. Race 10,013
White Alone 5,431 54.24
Black or African American Alone 55 0.55
American Indian and Alaska Native Alone 114 1.14
Asian Alone 8 0.08
Native Hawaiian and Other Pacific Islander Alone 1 0.01
Some Other Race Alone 3,912 39.07
Two or More Races 492 4.91
2015 Est. Pop by Race, Asian Alone, by Category 242
Chinese, except Taiwanese 7 2.89
Filipino 29 11.98
Japanese 41 16.94
Asian Indian 11 4.55
Korean 0 0.00
Vietnamese 6 2.48
Cambodian 51 21.07
Hmong 10 4.13
Laotian 0 0.00
Thai 1 0.41
All Other Asian Races Including 2+ Category 85 35.12
2015 Est. Population by Ancestry 47,820
Arab 5 0.01
Czech 95 0.20
Danish 67 0.14
Dutch 326 0.68
English 2,436 5.09
French (except Basque) 526 1.10
French Canadian 56 0.12
German 3,970 8.30
Greek 20 0.04
Radial Demographics | 15-Mile RadialDecatur, Texas

23
DESCRIPTION DATA %
Hungarian 14 0.03
Irish 2,655 5.55
Italian 306 0.64
Lithuanian 0 0.00
United States or American 4,079 8.53
Norwegian 130 0.27
Polish 108 0.23
Portuguese 20 0.04
Russian 27 0.06
Scottish 422 0.88
Scotch-Irish 344 0.72
Slovak 1 0.00
Subsaharan African 35 0.07
Swedish 159 0.33
Swiss 72 0.15
Ukrainian 4 0.01
Welsh 87 0.18
West Indian (except Hisp. groups) 50 0.10
Other ancestries 16,293 34.07
Ancestry Unclassified 15,510 32.43
2015 Est. Pop Age 5+ by Language Spoken at Home 44,582
Speak Only English at Home 37,628 84.40
Speak Asian/Pac. Isl. Lang. at Home 53 0.12
Speak IndoEuropean Language at Home 183 0.41
Speak Spanish at Home 6,681 14.99
Speak Other Language at Home 37 0.08
2015 Est. Population by Sex 47,820
Male 23,991 50.17
Female 23,829 49.83
DESCRIPTION DATA %
2015 Est. Population by Age 47,820
Age 0 - 4 3,238 6.77
Age 5 - 9 3,294 6.89
Age 10 - 14 3,476 7.27
Age 15 - 17 2,185 4.57
Age 18 - 20 1,935 4.05
Age 21 - 24 2,488 5.20
Age 25 - 34 5,782 12.09
Age 35 - 44 5,755 12.03
Age 45 - 54 6,936 14.50
Age 55 - 64 6,086 12.73
Age 65 - 74 4,064 8.50
Age 75 - 84 1,949 4.08
Age 85 and over 632 1.32
Age 16 and over 37,097 77.58
Age 18 and over 35,627 74.50
Age 21 and over 33,692 70.46
Age 65 and over 6,645 13.90
2015 Est. Median Age 37.6
2015 Est. Average Age 38.0
Radial Demographics | 15-Mile RadialDecatur, Texas
24
DESCRIPTION DATA %
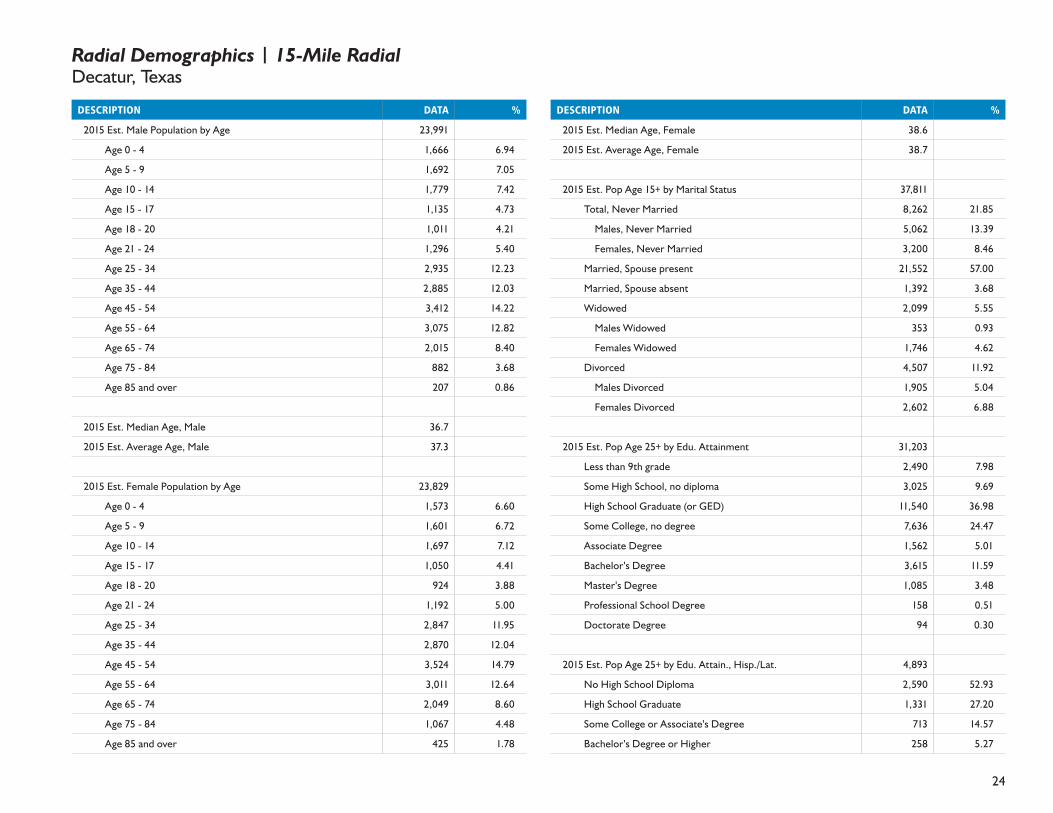
2015 Est. Male Population by Age 23,991
Age 0 - 4 1,666 6.94
Age 5 - 9 1,692 7.05
Age 10 - 14 1,779 7.42
Age 15 - 17 1,135 4.73
Age 18 - 20 1,011 4.21
Age 21 - 24 1,296 5.40
Age 25 - 34 2,935 12.23
Age 35 - 44 2,885 12.03
Age 45 - 54 3,412 14.22
Age 55 - 64 3,075 12.82
Age 65 - 74 2,015 8.40
Age 75 - 84 882 3.68
Age 85 and over 207 0.86
2015 Est. Median Age, Male 36.7
2015 Est. Average Age, Male 37.3
2015 Est. Female Population by Age 23,829
Age 0 - 4 1,573 6.60
Age 5 - 9 1,601 6.72
Age 10 - 14 1,697 7.12
Age 15 - 17 1,050 4.41
Age 18 - 20 924 3.88
Age 21 - 24 1,192 5.00
Age 25 - 34 2,847 11.95
Age 35 - 44 2,870 12.04
Age 45 - 54 3,524 14.79
Age 55 - 64 3,011 12.64
Age 65 - 74 2,049 8.60
Age 75 - 84 1,067 4.48
Age 85 and over 425 1.78
DESCRIPTION DATA %
2015 Est. Median Age, Female 38.6
2015 Est. Average Age, Female 38.7
2015 Est. Pop Age 15+ by Marital Status 37,811
Total, Never Married 8,262 21.85
Males, Never Married 5,062 13.39
Females, Never Married 3,200 8.46
Married, Spouse present 21,552 57.00
Married, Spouse absent 1,392 3.68
Widowed 2,099 5.55
Males Widowed 353 0.93
Females Widowed 1,746 4.62
Divorced 4,507 11.92
Males Divorced 1,905 5.04
Females Divorced 2,602 6.88
2015 Est. Pop Age 25+ by Edu. Attainment 31,203
Less than 9th grade 2,490 7.98
Some High School, no diploma 3,025 9.69
High School Graduate (or GED) 11,540 36.98
Some College, no degree 7,636 24.47
Associate Degree 1,562 5.01
Bachelor's Degree 3,615 11.59
Master's Degree 1,085 3.48
Professional School Degree 158 0.51
Doctorate Degree 94 0.30
2015 Est. Pop Age 25+ by Edu. Attain., Hisp./Lat. 4,893
No High School Diploma 2,590 52.93
High School Graduate 1,331 27.20
Some College or Associate's Degree 713 14.57
Bachelor's Degree or Higher 258 5.27
Radial Demographics | 15-Mile RadialDecatur, Texas
25
DESCRIPTION DATA %
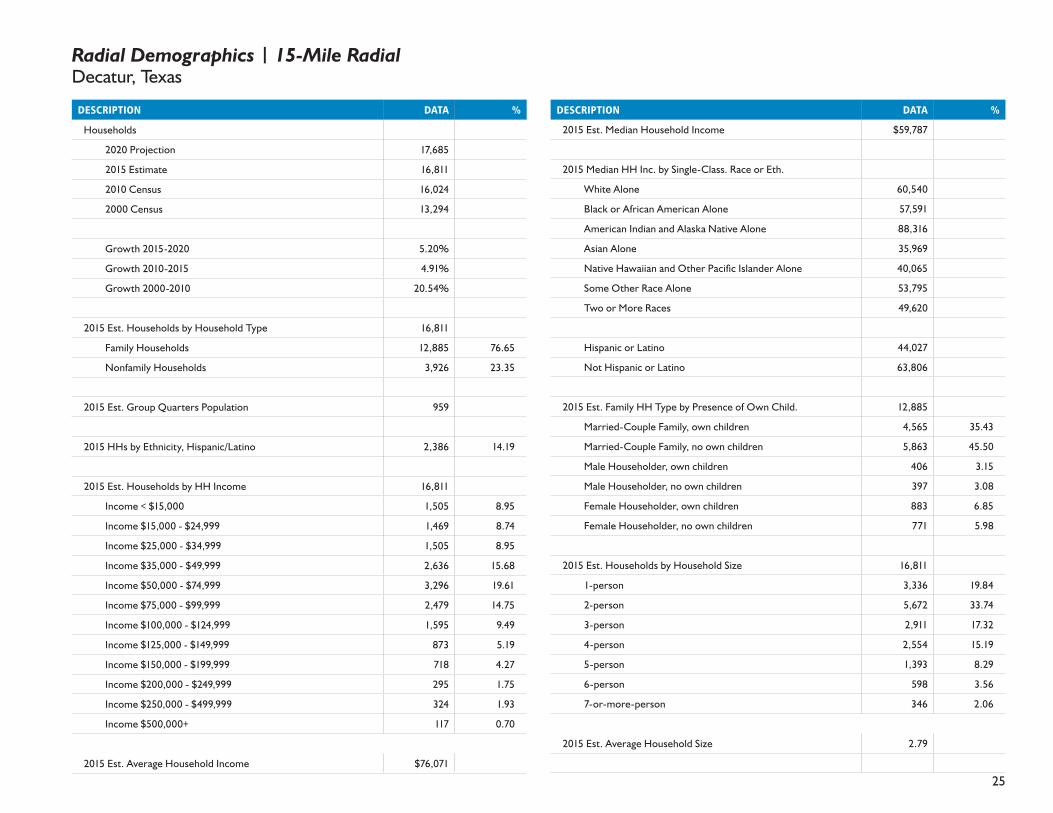
Households
2020 Projection 17,685
2015 Estimate 16,811
2010 Census 16,024
2000 Census 13,294
Growth 2015-2020 5.20%
Growth 2010-2015 4.91%
Growth 2000-2010 20.54%
2015 Est. Households by Household Type 16,811
Family Households 12,885 76.65
Nonfamily Households 3,926 23.35
2015 Est. Group Quarters Population 959
2015 HHs by Ethnicity, Hispanic/Latino 2,386 14.19
2015 Est. Households by HH Income 16,811
Income < $15,000 1,505 8.95
Income $15,000 - $24,999 1,469 8.74
Income $25,000 - $34,999 1,505 8.95
Income $35,000 - $49,999 2,636 15.68
Income $50,000 - $74,999 3,296 19.61
Income $75,000 - $99,999 2,479 14.75
Income $100,000 - $124,999 1,595 9.49
Income $125,000 - $149,999 873 5.19
Income $150,000 - $199,999 718 4.27
Income $200,000 - $249,999 295 1.75
Income $250,000 - $499,999 324 1.93
Income $500,000+ 117 0.70
2015 Est. Average Household Income $76,071
DESCRIPTION DATA %
2015 Est. Median Household Income $59,787
2015 Median HH Inc. by Single-Class. Race or Eth.
White Alone 60,540
Black or African American Alone 57,591
American Indian and Alaska Native Alone 88,316
Asian Alone 35,969
Native Hawaiian and Other Pacific Islander Alone 40,065
Some Other Race Alone 53,795
Two or More Races 49,620
Hispanic or Latino 44,027
Not Hispanic or Latino 63,806
2015 Est. Family HH Type by Presence of Own Child. 12,885
Married-Couple Family, own children 4,565 35.43
Married-Couple Family, no own children 5,863 45.50
Male Householder, own children 406 3.15
Male Householder, no own children 397 3.08
Female Householder, own children 883 6.85
Female Householder, no own children 771 5.98
2015 Est. Households by Household Size 16,811
1-person 3,336 19.84
2-person 5,672 33.74
3-person 2,911 17.32
4-person 2,554 15.19
5-person 1,393 8.29
6-person 598 3.56
7-or-more-person 346 2.06
2015 Est. Average Household Size 2.79
Radial Demographics | 15-Mile RadialDecatur, Texas

26
DESCRIPTION DATA %
2015 Est. Households by Presence of People Under 18 16,811
Households with 1 or More People under Age 18: 6,622 39.39
Married-Couple Family 4,993 75.40
Other Family, Male Householder 491 7.41
Other Family, Female Householder 1,092 16.49
Nonfamily, Male Householder 35 0.53
Nonfamily, Female Householder 11 0.17
Households with No People under Age 18: 10,189 60.61
Married-Couple Family 5,436 53.35
Other Family, Male Householder 309 3.03
Other Family, Female Householder 565 5.55
Nonfamily, Male Householder 1,991 19.54
Nonfamily, Female Householder 1,888 18.53
2015 Est. Households by Number of Vehicles 16,811
No Vehicles 470 2.80
1 Vehicle 4,563 27.14
2 Vehicles 7,138 42.46
3 Vehicles 3,267 19.43
4 Vehicles 1,000 5.95
5 or more Vehicles 373 2.22
2015 Est. Average Number of Vehicles 2.1
Family Households
2020 Projection 13,558
DESCRIPTION DATA %
2015 Estimate 12,885
2010 Census 12,283
2000 Census 10,434
Growth 2015-2020 5.22%
Growth 2010-2015 4.91%
Growth 2000-2010 17.72%
2015 Est. Families by Poverty Status 12,885
2015 Families at or Above Poverty 11,697 90.78
2015 Families at or Above Poverty with Children 5,342 41.46
2015 Families Below Poverty 1,188 9.22
2015 Families Below Poverty with Children 887 6.88
2015 Est. Pop Age 16+ by Employment Status 37,097
In Armed Forces 28 0.08
Civilian - Employed 21,348 57.55
Civilian - Unemployed 2,365 6.38
Not in Labor Force 13,356 36.00
2015 Est. Civ. Employed Pop 16+ by Class of Worker 21,539
For-Profit Private Workers 15,072 69.98
Non-Profit Private Workers 1,073 4.98
Local Government Workers 1,829 8.49
State Government Workers 817 3.79
Federal Government Workers 352 1.63
Self-Employed Workers 2,327 10.80
Unpaid Family Workers 69 0.32
2015 Est. Civ. Employed Pop 16+ by Occupation 21,539
Architect/Engineer 223 1.04
Radial Demographics | 15-Mile RadialDecatur, Texas

27
DESCRIPTION DATA %
Arts/Entertainment/Sports 281 1.30
Building Grounds Maintenance 1,043 4.84
Business/Financial Operations 413 1.92
Community/Social Services 242 1.12
Computer/Mathematical 220 1.02
Construction/Extraction 1,781 8.27
Education/Training/Library 1,211 5.62
Farming/Fishing/Forestry 267 1.24
Food Prep/Serving 874 4.06
Health Practitioner/Technician 868 4.03
Healthcare Support 366 1.70
Maintenance Repair 1,319 6.12
Legal 273 1.27
Life/Physical/Social Science 59 0.27
Management 2,081 9.66
Office/Admin. Support 3,169 14.71
Production 1,394 6.47
Protective Services 561 2.60
Sales/Related 2,194 10.19
Personal Care/Service 584 2.71
Transportation/Moving 2,115 9.82
2015 Est. Pop 16+ by Occupation Classification 21,539
Blue Collar 6,609 30.68
White Collar 11,236 52.17
Service and Farm 3,694 17.15
2015 Est. Workers Age 16+ by Transp. to Work 21,187
Drove Alone 17,068 80.56
DESCRIPTION DATA %
Car Pooled 2,879 13.59
Public Transportation 6 0.03
Walked 192 0.91
Bicycle 2 0.01
Other Means 190 0.90
Worked at Home 849 4.01
2015 Est. Workers Age 16+ by Travel Time to Work *
Less than 15 Minutes 6,073
15 - 29 Minutes 5,410
30 - 44 Minutes 3,770
45 - 59 Minutes 2,228
60 or more Minutes 2,836
2015 Est. Avg. Travel Time to Work in Minutes 31.85
2015 Est. Occupied Housing Units by Tenure 16,811
Owner Occupied 13,049 77.62
Renter Occupied 3,762 22.38
2015 Owner Occ. HUs: Avg. Length of Residence 14.6
2015 Renter Occ. HUs: Avg. Length of Residence 7.8
2015 Est. Owner-Occupied Housing Units by Value 13,049
Value Less than $20,000 416 3.19
Value $20,000 - $39,999 754 5.78
Radial Demographics | 15-Mile RadialDecatur, Texas

28
DESCRIPTION DATA %
Value $40,000 - $59,999 1,201 9.20
Value $60,000 - $79,999 1,227 9.40
Value $80,000 - $99,999 1,383 10.60
Value $100,000 - $149,999 2,271 17.40
Value $150,000 - $199,999 2,032 15.57
Value $200,000 - $299,999 2,072 15.88
Value $300,000 - $399,999 850 6.51
Value $400,000 - $499,999 460 3.53
Value $500,000 - $749,999 258 1.98
Value $750,000 - $999,999 59 0.45
Value $1,000,000 or more 67 0.51
2015 Est. Median All Owner-Occupied Housing Value $133,971
2015 Est. Housing Units by Units in Structure 18,821
1 Unit Attached 222 1.18
1 Unit Detached 12,281 65.25
2 Units 369 1.96
3 or 4 Units 320 1.70
5 to 19 Units 340 1.81
20 to 49 Units 113 0.60
50 or More Units 70 0.37
Mobile Home or Trailer 5,041 26.78
Boat, RV, Van, etc. 65 0.35
2015 Est. Housing Units by Year Structure Built 18,821
Housing Units Built 2010 or later 933 4.96
Housing Units Built 2000 to 2009 4,595 24.41
DESCRIPTION DATA %
Housing Units Built 1990 to 1999 4,178 22.20
Housing Units Built 1980 to 1989 3,256 17.30
Housing Units Built 1970 to 1979 2,323 12.34
Housing Units Built 1960 to 1969 1,175 6.24
Housing Units Built 1950 to 1959 941 5.00
Housing Units Built 1940 to 1949 621 3.30
Housing Unit Built 1939 or Earlier 799 4.25
2015 Est. Median Year Structure Built** 1991
Radial Demographics | 15-Mile RadialDecatur, Texas

29
About The Retail Coach
The Retail Coach, LLC, is a national retail analytics and locational intelligence firm that specializes in all aspects of retail market analyses and recruitment, from “macro to micro” trade area assessment to actively recruiting retailers on behalf of our clients.
Through its unique Retail:360 process, The Retail Coach offers a dynamic system of products and services that better enable communities to maximize their retail development potential.
Retail:360 Process
Providing more than simple data reports of psychographic and demographic trends, The Retail Coach goes well beyond other retail consulting and market research firms’ offerings by combining current national and statewide demographics and trend data with real-world, “on-the-ground” data gathered through extensive visits within our clients’ communities.
Every community is different, and there is no “one size fits all” retail recruitment solution. Compiling the gathered data into client-tailored information packets that are uniquely designed for, and targeted to, specific retailers and restaurants who meet the community’s needs helps assure our clients that they are receiving the latest and best information for their retail recruitment efforts — all with personal service and coaching guidance that continues beyond the initial project scope and timeline.
Our Retail:360 process assures that communities get timely, accurate and relevant information. Translating that data into the information that retailers need and seek assures our clients even better possibilities for tremendous retail growth and success.
The Retail Coach -It’s not about data. It’s about your success.
The Retail Coach, LLC | P. O. Box 7272 | Tupelo, Mississippi 38802tel 800.851.0962 | fax 662.844.2738 | e-mail [email protected] | web www.theretailcoach.net
C. Kelly Cofer President & CEO
The Retail Coach, LLC

30
Acknowledgements
The observations, conclusions and recommendations contained in this study are solely those of The Retail Coach, LLC and should not be construed to represent the opinions of others, including its clients, or any other entity prior to such entity’s express approval of this study.
Sources used in completing this study include: infoUSA™, Applied Geographic Solutions, Nielsen 2015/2016, ESRI 2015, U.S. Census Bureau, Economy.com, Spatial Insights Inc., Urban Land Institute, CensusViewer.com, International Council of Shopping Centers, and/or U.S. Bureau of Labor and Statistics.
To better represent current data, where applicable, portions of estimated actual sales may be calculated using an average sales per square foot model.
Mapping data is provided by MapInfo, Nielsen, ESRI and/or Microsoft Corporation.
All information furnished is from sources deemed reliable and is submitted subject to errors, omissions, change of terms and/or conditions.