Embed Size (px)
Citation preview

Grocery-Anchored Shopping Centers: A Better Retail Investment?
by
Adam Schwank
B.S., Finance, 2003 Northern Arizona University
Submitted to the Program in Real Estate Development in Conjunction with the Center for Real Estate in Partial Fulfillment of the Requirements for the Degree of Master of Science
in Real Estate Development
at the
Massachusetts Institute of Technology
September, 2011
©2011 Adam Schwank All rights reserved
Signature of Author_________________________________________________________
Center for Real Estate July 29, 2011 Certified by_______________________________________________________________ William C. Wheaton Professor, MIT Department of Economics Thesis Supervisor Accepted by______________________________________________________________
David Geltner Chair, MSRED Committee, Interdepartmental Degree Program in Real Estate Development

2 Grocery-Anchored Shopping Center: A Better Retail Investment?
Grocery-Anchored Shopping Centers: A Better Retail Investment?
By
Adam Schwank
Submitted to the Program in Real Estate Development in Conjunction with the Center for Real Estate on July 29, 2011 in Partial Fulfillment of the Requirements for the Degree of Master of
Science in Real Estate Development
ABSTRACT A very popular hypothesis of late is that grocery-anchored shopping centers perform better and are less risky than other retail investments. This hypothesis is primarily based on three notions: 1) grocery stores are unique in their ability to attract shoppers on a regular basis, often two to three times a week. This provides a grocery-anchored shopping center with consistent traffic that benefits the in-line tenants; 2) Grocery stores represent a non-cyclical business. People need to eat whether the economy is strong or weak, therefore, grocery-anchored shopping centers can rely on a minimum level of traffic regardless of economic conditions; 3) Many retailers have experienced significant sales leakage to the Internet. This has recently led to the concept of replacing large stores with small showrooms. However, the Internet has not impacted the grocery store business as significantly. Although some grocers have attempted to implement online stores, the model has been difficult to implement and unsuccessful. Therefore, many investors view grocery-anchored shopping centers as a hedge to the threat of online shopping faced by other retailers. These three characteristics have led many core investors to allocate capital to grocery-anchored shopping centers since they are viewed as stable and low-risk investments relative to other real estate alternatives. The purpose of this Thesis is to evaluate the performance of grocery-anchored shopping centers relative to other real estate investments, primarily in terms of asset prices and capitalization rates. This Thesis will attempt to determine whether investors pay more for grocery-anchored shopping centers and whether a potential price premium is warranted based on actual performance. This Thesis will also measure the volatility of grocery-anchored shopping center prices compared to other retail and non-retail investments to help determine the relative risk of these investments. Thesis Supervisor: William C. Wheaton Title: Professor, MIT Department of Economic

3 Grocery-Anchored Shopping Center: A Better Retail Investment?
ACKNOWLEDGEMENTS
I would like to thank Professor William Wheaton for his guidance throughout my work on this
thesis, as well as the invaluable information he teaches his students in the classroom. I also owe
thanks to Schery Bokhari for his willingness to discuss my thesis with me while also introducing
tools that proved to be very useful during my analysis. Last, but certainly not least, I would like
to thank my family and friends for all the support they have given over the years. And to my
fellow MSRED classmates, thank you all for a fun and memorable year.

4 Grocery-Anchored Shopping Center: A Better Retail Investment?
TABLE OF CONTENTS
Chapter 1: Introduction ............................................................................................................7
1.1 Grocery Stores and Retail Traffic .........................................................................................7
1.2 Grocery Stores and the Economy .........................................................................................8
1.3 Grocery Stores and Online Shopping ...................................................................................12
1.4 Thesis Intent and Hypothesis ................................................................................................13
Chapter 2: Transaction Data ....................................................................................................15
2.1 Data Source ...........................................................................................................................15
2.2 Data Overview ......................................................................................................................15
Chapter 3: Using Repeat-Sales Indexes to Ascertain Price Trends ......................................19 3.1 Repeat-Sales Index Methodology ..........................................................................................19
3.2 Repeat-Sales Indexes: Grocery-Anchored vs. Total ..............................................................19
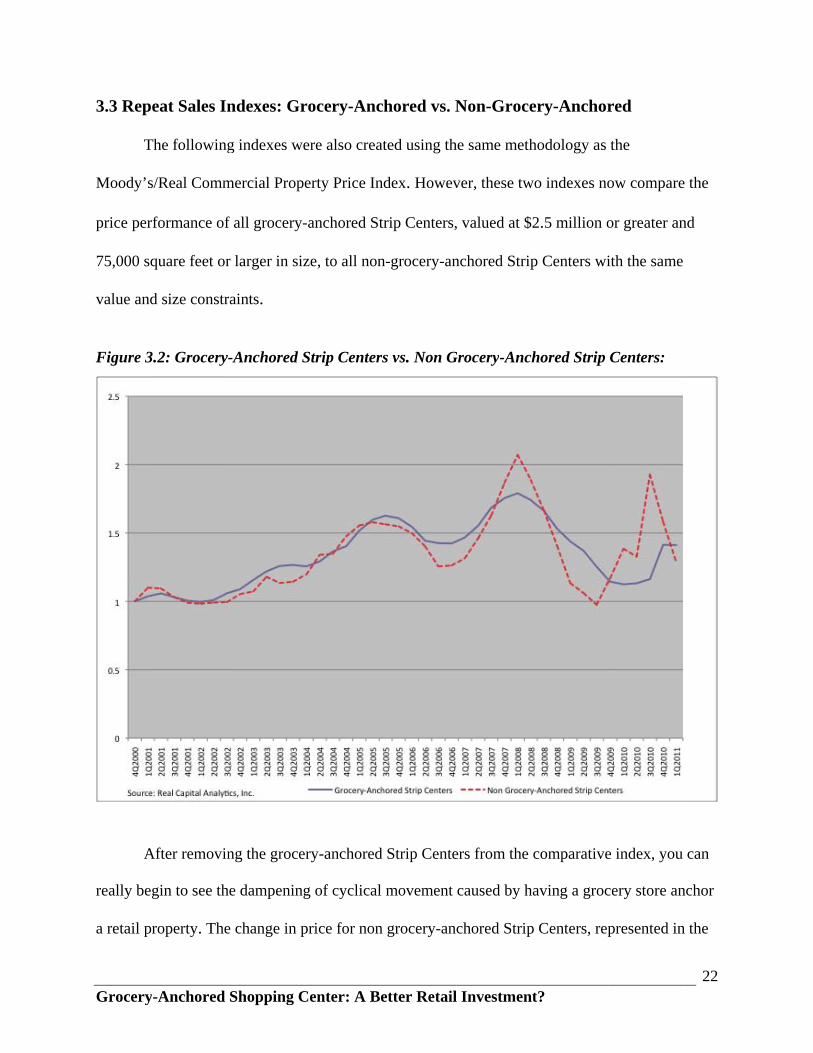
3.3 Repeat Sales Indexes: Grocery-Anchored vs. Non-Grocery-Anchored ...............................22
3.4 Repeat-Sales Conclusion ......................................................................................................23
Chapter 4: Using Hedonic Regressions to Compare Price Levels and Trends ....................25 4.1 Sales Price PSF .....................................................................................................................25
4.2 Grocery Store Chains – Impact on Sales Price PSF .............................................................29
4.3 Regression Analysis – Price Levels and Trends Conclusion ................................................30
Chapter 5: Using Hedonic Regressions to Compare Capitalization Rates ...........................32 5.1 Capitalization Rates and Modern Pricing Theory .................................................................32
5.2 Capitalization Rates – Grocery-Anchored vs. Non-Grocery-Anchored ...............................33
5.3 Grocery Store Chains – Impact on Capitalization Rates ......................................................37
5.3 Capitalization Rates Conclusion ...........................................................................................38
Chapter 6: Conclusion ...............................................................................................................39

5 Grocery-Anchored Shopping Center: A Better Retail Investment?
Bibliography ...............................................................................................................................42 Appendix A: Regression Outputs ............................................................................................43
Appendix B: Sale Year Time Trend ........................................................................................52
Appendix C: Top 20 Food Retailers .........................................................................................55

6 Grocery-Anchored Shopping Center: A Better Retail Investment?
LIST OF FIGURES
Figure 1.1 At-Home Food Expenditures as % of Total Food Expenditures
Figure 1.2 Primary Store Channels, 2005 – 2010
Figure 1.3 Retail Sales, 1992 – 2010
Figure 2.1 Transaction Data Classifications
Figure 2.2 Transaction Data Geographic Breakdown
Figure 2.3 Transaction Data Summary Statistics
Figure 3.1 Index: Grocery-Anchored Strip Centers vs. All Strip Centers
Figure 3.2 Index: Grocery-Anchored Strip Centers vs. Non Grocery-Anchored Strip Centers
Figure 4.1 Sale Year Time Trend – Sale Price PSF
Figure 5.1 Sale Year Time Trend – Capitalization Rates

7 Grocery-Anchored Shopping Center: A Better Retail Investment?
CHAPTER 1: INTRODUCTION
Grocery stores represent a unique tenant with certain characteristics that can benefit a
shopping center. These characteristics and conventional wisdom have led many investors to
favor grocery-anchored shopping centers over other retail and non-retail real estate investments.
However, little research has been done to date on the actual performance of grocery-anchored
shopping centers relative to other retail investments. What specific benefits does a grocery store
provide as an anchor and are these benefits reflected in the prices investors are willing to pay for
grocery-anchored shopping centers? Furthermore, is a potential price premium warranted and
realized based on the actual performance of grocery-anchored shopping centers? This paper will
aim to answer these questions, but first, it is important to identify the common perceived benefits
that a grocery store can provide a shopping center.
1.1 Grocery Stores and Retail Traffic
Grocery stores attract customers on a regular basis. According to the Food Marketing
Institute (“FMI”) Grocery Shoppers Trends 2010, the average number of trips per week
consumers made to supermarkets in 2010 was 2.06. Obviously, this will be higher or lower
depending on transportation costs and the spatial distribution and supply of grocery stores in
each specific trade area. However, the consistent flow of consumer traffic generated by a grocery
store can be a significant benefit to the in-line tenants at a shopping center. Some tenants may
only lease space at a shopping center with a grocery store as a primary anchor because of the
traffic it provides, therefore providing the landlord of a grocery-anchored center with the
opportunity to charge higher rents. Although this is a common hypothesis, it is difficult to
measure the correlation between the performance of the grocery store anchoring the shopping

8 Grocery-Anchored Shopping Center: A Better Retail Investment?
center and the sales produced by the in-line tenants. Do the grocery store customers actually visit
the other stores and do they do so out of convenience, that is the ability to visit the salon, bank,
drug store, and grocery store all at one destination. If a correlation does exist, meaning that the
higher the grocery store sales the better the in-line tenants perform, perhaps because grocery
store patrons appreciate the convenience of service retailers adjacent to their primary grocery
store, then this relationship should create a price premium for grocery-anchored shopping centers
compared to similar properties without a grocery store as the anchor.
1.2 Grocery Stores and the Economy
Grocery stores represent a non-cyclical business. People need to eat regardless of
economic conditions and actually tend to eat more at home than at restaurants during challenging
economic times, thus placing upward pressure on grocery store sales during recessionary
periods. Consumers certainly adjusted purchasing patterns during the “Great Recession”
beginning in 2007 and ate out less, impacting family chain restaurants such as Applebee’s, TGIF,
and Red Lobster, however, fast food restaurants like McDonald’s, Taco Bell, and Pizza Hut were
less affected. According to the Food Marketing Institute (“FMI”) Grocery Shoppers Trends
2010, 68% of consumers said they were eating out less in 2010 than a year ago. Although this
translated to increased grocery store purchases, there was certainly a dichotomy between the
grocery stores that benefited. Club stores (e.g., Costco, Sam’s Club, BJ’s), low-end discounters
(e.g., Wal-Mart), and price competitive supermarkets (e.g., Super Valu, Kroger, Safeway)
benefited from the shift in spending from restaurants while high-end grocery retailers (e.g.,
Whole Foods) did not so much (Shea, 2008, 1). The following charts help to demonstrate these

Grocery
two impo
change in
Figure 1
O
spent on
most iden
1958, 19
period. D
eating ou
challengi
y-Anchored
ortant trends
n the types o
1.1: At-Hom
Overall, the a
food at hom
ntifiable incr
73 – 1974, 1
Despite what
ut), between
ing economi
Shopping C
s during rece
of grocery sto
e Food Exp
above chart s
me compared
reases in the
1988 – 1990,
t appears to b
1935 and 20
ic times.
Center: A B
essionary per
ores consum
enditures as
shows a decl
d to food exp
e percentage
, 2000 – 200
be a strong c
008, people t
etter Retail
riods – the sh
mers frequent
s % of Total
line in the am
penditures aw
of food exp
01) either im
change in act
tend to rever
l Investment
hift from eat
t.
l Food Expe
mount of tot
way from ho
enditures at
mmediately fo
tual eating h
rt back to ea
t?
ting out to ea
enditures
al disposable
me. Howeve
home (1945
ollowed or le
habits (eating
ating at home
ating in and
e income tha
er, five of th
5 – 1948, 195
ed a recessio
g at home vs
e during
9
the
at is
he
56 –
onary
s.

Grocery
Figure 1
T
visited be
supercen
like Trad
2007 org
2009 as t
2008 and
supermar
taking pl
y-Anchored
1.2: Primary
The above ch
etween 2005
nters, althoug
der Joes cont
ganic/special
the economic
d 2009 also r
rkets and inc
ace during r
Shopping C
y Store Chan
hart illustrate
5 and 2010. A
gh this appea
tinue to gain
ty stores gai
c downturn t
represents th
crease for su
recessionary
Center: A B
nnels, 2005 -
es the breakd
As you can s
ared to stabil
n market shar
ined market
took hold an
he most signi
upercenters, f
periods.
etter Retail
- 2010
down in the t
see, superma
lize in 2010.
re. Interestin
share, but th
nd consumer
ificant one-y
further point
l Investment
type of groc
arkets have l
. Furthermor
ngly, you can
hen lost mark
rs became m
year decline
ting to the sh
t?
ery stores th
lost market s
re, limited as
n see that be
ket share bet
more price sen
in market sh
hift in consu
hat consumer
share to
ssortment sto
etween 2006
tween 2008
nsitive. Betw
hare for
umer patterns
10
rs
ores
and
and
ween
s

Grocery
Figure 1
T
stores co
stores, an
indicator
continue
2010, the
period, g
motor ve
y-Anchored
1.3: Retail Sa
The above ch
mpared to o
nd motor veh
r of the overa
to spend at
e unemploym
grocery store
ehicle dealers
Shopping C
ales, 1992 -
hart plots the
ther more di
hicle dealers
all health of
grocery stor
ment rate inc
s sales incre
s declined by
Center: A B
2010
e change in c
iscretionary
s. The chart a
the economy
res while sca
creased by ap
eased by 6.1%
y 20.8%, 3.5
etter Retail
consumer spe
retailers, in
also plots the
y. As expect
aling back on
pproximately
% while sale
5%, and 18.4
l Investment
ending, inde
this case, fu
e national un
ted, during e
n other expen
y 500 basis p
es at furnitur
4%, respecti
t?
exed to 1992
urniture store
nemploymen
economic do
nditures. Be
points. Over
re stores, clo
vely.
, at grocery
es, clothing
nt rate – one
ownturns peo
tween 2007
r this same
othing stores
11
ople
and
, and

12 Grocery-Anchored Shopping Center: A Better Retail Investment?
1.3 Grocery Stores and Online Shopping
Another perceived benefit of grocery-anchored shopping centers is that grocery stores are
less susceptible to losing sales to the Internet. Retail stores have lost significant market share to
ecommerce and of course many retailers have implemented online shopping platforms, thus
driving sales away from shopping centers to the Internet. However, online shopping has not had
as significant of an impact on grocery stores because online grocery shopping models have
proven difficult to implement for a variety of reasons. Although consumers identify the benefits
of online grocery shopping in terms of convenience, price, and product range, the disadvantages
have been difficult to overcome. These mental barriers for consumers include the risk of
receiving inferior groceries and the loss of the recreational aspect of grocery shopping in that
many people actually enjoy the experience (Ramus & Niels, 2005). Webvan probably represents
the most famous failed online grocery retailer, having collapsed in 2001 largely due to a
combination of the design of its logistics system, a misunderstanding of information technology
capabilities, and ineffective marketing (Lunce & Kawai & Maniam, 2006). Following Webvan’s
failure, other grocers were reluctant to enter the online grocery space. However, there has been a
recent resurgence in this space that may create a different landscape for grocers going forward.
Although online grocery shopping has not been very successful to date, this certainly
does not mean the same challenges will continue, and some shifts are actually now taking place
in this retail space, creating a potential threat to grocery-anchored shopping centers going
forward. According to a report completed by Forrester Research in 2011, ecommerce within the
grocery industry accounts for 8% of total retail sales, however, they estimate this could increase
to 11% if not for the little penetration into the online grocery shopping market (Lindeman, 2011).
Walmart, for example, launched a test service in 2011 called Walmart To Go, which allows

13 Grocery-Anchored Shopping Center: A Better Retail Investment?
customers in San Jose, California to order produce, meat, seafood, and bread for an average
delivery fee of $5 to $10. This service is similar to Amazon’s service in Seattle, Washington
called AmazonFresh as well as other online grocery retailers like Fresh Direct and Peapod,
which have been expanding their services in the United States. However, according to the
National Grocers Association, online grocery sales make up only 1% to 2% of total grocery sales
(Jopson & Rappeport, 2011). Although ecommerce within the grocery industry has not had a
significant impact on grocery stores yet, future impacts are yet to be determined and this
represents a meaningful risk that long-term investors in grocery-anchored shopping centers
should consider.
1.4 Thesis Intent and Hypothesis
Based on the previous discussions in this chapter, one would expect grocery-anchored
shopping centers to perform better than similar properties without a grocery store, or at least
drive a positive relationship between the existence of a grocery store and the performance of the
shopping center. One key measure of performance is price and the movement in prices (i.e.,
appreciation) over time. If a grocery store does in fact provide unique benefits to a shopping
center as previously discussed then such centers should be more expensive, on a per square foot
basis, in terms of what investors are willing to pay. Furthermore, one would expect grocery-
anchored properties to demonstrate stronger price appreciation over time relative to properties
without a grocery store.
Risk is another important component of real estate investment performance and one of
the most common measures of risk is volatility. If grocery stores do in fact represent a non-
cyclical business compared to other retailers, which is demonstrated clearly in Figure 1.3, then

14 Grocery-Anchored Shopping Center: A Better Retail Investment?
grocery-anchored properties should be less cyclical than other retail investments. Therefore,
grocery-anchored property prices should not react as drastically to difficult economic
environments compared to properties that do not have a grocery store anchoring the center.
Furthermore, the stability that a grocery store adds to a shopping center should be reflected in the
overall fluctuation or volatility in asset prices over time.
Real estate investors also pay close attention to the relationship between the income
generated by and the value of a property, which is referred to as the capitalization rate. This
relationship demonstrates the price premium investors are willing to pay in response to the
perceived growth and income risk of a property. That is, the lower the property income relative
to value, the higher the premium being paid for the asset. This premium can be supported by
higher income growth expectations or lower perceived income risk, and therefore can be justified
by actual price performance and volatility. Given the characteristics that a grocery store brings to
a retail property, one would expect grocery-anchored properties to trade at a premium, therefore
a lower capitalization rate, relative to non-grocery-anchored properties.
The purpose of this thesis is to determine whether these expectations are accurate and if
the common hypothesis applied to grocery-anchored retail investments holds true. This
hypothesis will be tested through statistical analysis that focuses on asset prices, movement of
asset prices, and the relationship between property income and values. A complete set of historic
retail transactions will be thoroughly analyzed to determine how grocery-anchored properties
have performed relative to other retail investments.

15 Grocery-Anchored Shopping Center: A Better Retail Investment?
CHAPTER 2: TRANSACTION DATA
2.1 Data Source
Real Capital Analytics (“RCA”) provided the data utilized for the majority of the
statistical analysis in this thesis. RCA was founded in 2000, and at that time began tracking
commercial real estate transactions in the United States. In 2007, RCA expanded its focus to
include global markets; however, the data utilized in this thesis is limited to the United States.
RCA’s proprietary data is primarily concentrated on property and portfolio transactions of $2.5
million or greater in the United States and $10 million or greater in international markets.
RCA reports that, on average, each transaction is reviewed by at least two researchers and
based on at least two sources. Each source is diligently cross-referenced by in-house researchers
for each transaction. According to RCA’s website, primary sources include press releases, news
reports, SEC filings, public records, listing services, other licensed databases, and feedback from
subscribers. The quality of the data is attributed to extensive collection methodologies and a
focus on continuously updating historic data as additional sources become available.
2.2 Data Overview
RCA provided its entire proprietary database of retail transactions, dating back to when
the company began gathering data in 2000. The retail transactions are divided into two primary
subtypes, Strip Center and Mall & Other, which are defined on RCA’s website as follows:
Strip Center/Retail Park: Indicates a shopping center that is not enclosed and that its
stores’ entrances typically face the parking lot.

16 Grocery-Anchored Shopping Center: A Better Retail Investment?
Mall & Other: “Mall” indicates that the shopping center is enclosed and the shop’s
entrances are predominantly facing the center’s interior while “Other” indicates retail
properties that are neither enclosed malls nor unenclosed strip centers/retail parks.
Each retail sale transaction is also classified by one of eight niche subtypes, including
Unanchored, Mall, Lifestyle/Power Center, Grocery, Drug Store, Big Box, Single Tenant, and
Other. The retail transaction data set provided by RCA, totaling approximately 29,000
transactions, is broken down by subtype and niche subtype as follows.
Figure 2.1: Transaction Data Classifications
Since this thesis is focused on grocery-anchored shopping centers, it is important to note that the
majority of grocery-anchored properties fall under the Strip Center subtype. Furthermore, the
5,475 grocery-anchored properties make up 32% of the total Strip Center transactions and Strip
Centers make up 58% of all the retail transactions in the data set.
Another important classification is geography, especially given that real estate prices vary
greatly depending on where the property is located. RCA divides the retail transactions into
seven primary regions: West, Southeast, Northeast, Midwest, Southwest, Mid-Atlantic, and
Other. The following table illustrates the geographic breakdown of the retail transactions
provided by RCA.

17 Grocery-Anchored Shopping Center: A Better Retail Investment?
Figure 2.2: Transaction Data Geographic Breakdown
The largest concentration of transactions is in the Southeast, followed by the West, Southwest,
Midwest, Northeast, Mid-Atlantic, and Other. The approximately 29,000 retail transactions are
relatively evenly distributed among geographic regions, which support the significance of the
analysis in this thesis as it relates to location.
RCA records a significant amount of information on each transaction, including the
transaction type, transaction date, property type, rentable area, land area, number of buildings,
number of stories, year built, year renovated, buyer and seller profiles, brokers involved, lender
and loan terms, property name, property location, price, capitalization rate, and more. However,
the following table summarizes the primary variables that are utilized in forthcoming sections of
this thesis while also illustrating the average (or mean), standard deviation, and range of these
variables across the entire data set of approximately 29,000 transactions.

18 Grocery-Anchored Shopping Center: A Better Retail Investment?
Figure 2.3: Transaction Data Summary Statistics
The above table illustrates not only the key variables that will be utilized in this thesis but also
the number of transactions in which the variable information is available. Although there are
approximately 29,000 total retail transactions, as you can see, there are approximately 12,000
transactions where a capitalization rate was provided, for example. Furthermore, the above chart
identifies some outliers in the data set that could potentially skew the statistical analysis and
therefore serves as a guide to strengthen the comparative nature of the data set by removing
extremes, which will be described in detail in subsequent chapters. This, combined with certain
variables not being available across all transactions, is why the size of the transaction data set
will fluctuate depending on the specific analysis being done and the variables involved in such
analysis.

19 Grocery-Anchored Shopping Center: A Better Retail Investment?
CHAPTER 3: USING REPEAT-SALES INDEXES TO ACERTAIN PRICE TRENDS
3.1 Repeat-Sales Index Methodology
A repeat-sales price index looks at actual same-property round trip price changes over a
given period of time and provides a strong indication of price trends. The MIT Center for Real
Estate, in partnership with Real Capital Analytics, Inc. and Real Estate Analytics, LLC,
developed the Moody’s/REAL Commercial Property Index (CPPI), which was developed to
accommodate derivatives trading. The Moody’s/REAL Commercial Property Price Index is
based on a repeat-sales regression methodology. This methodology uses regression analysis to
take properties that have transacted at least twice over the given sample period to generate a
price index that is based solely on real transactions rather than appraisals. This is the similar
methodology behind the widely followed Case-Shiller-Weiss housing price indexes. The
Moody’s/REAL Commercial Property Index is designed to control for differences in the quality
of properties that are traded over varying periods of time while also filtering out development
projects and “flips”. A detailed overview of the development of the Moody’s/REAL Commercial
Property Index is outlined in a white paper titled “A Set of Indexes for Trading Commercial Real
Estate Based on the Real Capital Analytics Transaction Prices Databases” by David Geltner and
Henry Pollakowski.
3.2 Repeat Sales Indexes: Grocery-Anchored vs. Total
The following indexes were created using the same methodology as the Moody’s/Real
Commercial Property Price Index in order to evaluate price trends of grocery-anchored shopping
centers relative to other retail investments. These two indexes compare the price performance of

Grocery
all grocer
Transacti
Strip Cen
Figure 3
T
grocery-a
traded at
compares
most part
the long-
y-Anchored
ry-anchored
ion Data), va
nters with th
3.1: Grocery-
The above ind
anchored Str
least twice b
s this index t
t, these two
-term trend it
Shopping C
d Strip Cente
alued at $2.5
he same value
-Anchored S
dex, represen
rip Centers (
between app
to that of all
indexes mov
t is importan
Center: A B
rs, as define
5 million or
e and size co
Strip Center
nted by the s
(as defined b
proximately
l Strip Cente
ve similarly
nt to account
etter Retail
ed by Real C
greater and 7
onstraints.
rs vs. All Str
solid line, ill
by Real Capi
2000 and the
ers, which is
over the sam
t for cycle in
l Investment
Capital Analy
75,000 squa
rip Centers
lustrates the
ital Analytic
e first quarte
represented
mple period.
n historical d
t?
ytics (See Ch
are feet or lar
change in p
s), above $2
er of 2011. T
by the dash
However, to
data and obse
hapter 2:
rger in size,
price for all
2.5 million an
The above ch
hed line. For
o better eval
erve the chan
20
to all
nd
hart
the
luate
nge

21 Grocery-Anchored Shopping Center: A Better Retail Investment?
in price from the peak-to-peak and trough-to-trough, thus across cycles rather than within cycles.
The change in price for grocery-anchored Strip Centers between the trough in the fourth quarter
2006 and the trough in the first quarter 2010 was negative 21% while for all Strip Centers the
change in price between the trough in the third quarter 2006 and the subsequent trough in the
third quarter 2009 was negative 18%. The change in price for grocery-anchored Strip Centers
between the peak in the fourth quarter 2005 and the subsequent peak in the first quarter 2008 was
11% while for all Strip Centers the change in price between a peak in the third quarter 2006 and
the subsequent peak in the third quarter 2009 was 23%. Therefore, grocery-anchored properties
actually underperformed non-grocery-anchored properties in terms of price appreciation across
the last two cycles. However, it is important to also consider the relationship between price
appreciation and risk.
The average quarterly return, as derived by the repeat-sales index, for grocery-anchored
Strip Centers between the fourth quarter 2000 and the first quarter 2011 was 0.96% with a
standard deviation of 5.53%. Interestingly, the average quarterly return for all Strip Centers over
the same time period was slightly higher at 0.98%, however, with a standard deviation of 7.49%.
Therefore, in this specific data set, over the last ten years the average quarterly returns between
the two indexes were about the same, however, the dispersion from the mean for grocery-
anchored Strip Centers was significantly less than that of all Strip Centers over the sample
period. This implies that prices tend to be less volatile within the grocery-anchored data set as
compared to the total data set in this analysis.
Grocery
3.3 Rep
T
Moody’s
price per
75,000 sq
value and
Figure 3
A
really beg
a retail pr
y-Anchored
eat Sales In
The following
s/Real Comm
rformance of
quare feet or
d size constr
3.2: Grocery-
After removin
gin to see th
roperty. The
Shopping C
ndexes: Gr
g indexes we
mercial Prop
f all grocery-
r larger in siz
raints.
-Anchored S
ng the groce
he dampening
e change in p
Center: A B
rocery-Anc
ere also crea
erty Price In
-anchored St
ze, to all non
Strip Center
ery-anchored
g of cyclical
price for non
etter Retail
chored vs. N
ated using th
ndex. Howev
trip Centers,
n-grocery-an
rs vs. Non G
d Strip Cente
l movement
n grocery-an
l Investment
Non-Groce
he same meth
ver, these tw
, valued at $2
nchored Strip
Grocery-Anch
ers from the
caused by h
chored Strip
t?
ery-Anchor
hodology as
wo indexes no
2.5 million o
p Centers wi
hored Strip
comparative
aving a groc
p Centers, rep
red
the
ow compare
or greater an
ith the same
Centers:
e index, you
cery store an
presented in
22
e the
nd
can
nchor
n the

23 Grocery-Anchored Shopping Center: A Better Retail Investment?
above chart by the dashed line, between the peak in the second quarter 2010 and the subsequent
peak in the first quarter 2008 was 31% (compared to 11% for the grocery-anchored index) while
the change in price between the trough in the third quarter 2006 and the subsequent trough in the
fourth quarter 2009 was negative 7% (compared to negative 21% for the grocery-anchored
index). Across the last two cycles, grocery-anchored properties seemed to underperform non-
grocery-anchored properties as it relates to price trends. But once again, it is important to also
consider the risk associated with the price appreciation.
The average quarterly return for the non-grocery-anchored index over the entire analysis
period of fourth quarter 2000 to first quarter 2011 was 1.2%. This compares to the average
quarterly return for the grocery-anchored index of 0.96%. However, the higher average return for
non-grocery-anchored Strip Centers is combined with greater volatility. The standard deviation
of the non-grocery-anchored quarterly returns was 12.0%, significantly higher than the standard
deviation for the grocery-anchored average quarterly returns at 5.53%. Therefore, having a
grocery store as an anchor at a retail center may not lead to better performance across cycles in
terms of price, in fact, in the two cycles observed above grocery-anchored centers actually
performed worse. However, grocery stores do seem to decrease the overall risk, measured in
terms of price fluctuations within cycles, of retail properties.
3.4 Repeat-Sales Conclusion The repeat-sales index illustrates two key components of real estate investment – asset
prices and the fluctuation of these prices. Interestingly, over the last two cycles those properties
without a grocery store actually outperformed grocery-anchored retail centers in terms of price.
However, it is important to keep in mind that this price performance as measured by comparing

24 Grocery-Anchored Shopping Center: A Better Retail Investment?
the trough-to-trough and peak-to-peak between two cycles represents the highest and lowest
index values. But individual investors are rarely able to time the market perfectly in order to
capture peak prices, and therefore, must also be cognizant of the volatility of asset prices or how
quickly these prices may fall or rise within a cycle, representing an important measure of risk.
Therefore, although the results of the repeat-sales analysis conclude that grocery-anchored
centers underperformed other retail properties in terms of peak-to-peak and trough-to-trough
price performance between the last two cycles, grocery-anchored centers do seem to be less
volatile and therefore less risky investments.

25 Grocery-Anchored Shopping Center: A Better Retail Investment?
CHAPTER 4: USING HEDONIC REGRESSIONS TO COMPARE PRICE LEVELS AND TRENDS
A series of multivariate regression equations were created to determine the relationship
between various dependent and independent variables. The analysis was based on the following
multivariate regression equation:
Y = β0 + βiXi + … + βnXn + e
In the above equation, an increase in each unit of the independent variable (Xi) results in an
incremental increase in the dependent variable (Y) based on the corresponding coefficient (βi)
for each independent variable. The first set of regression equations in this chapter are designed to
identify whether investors actually pay more for grocery-anchored retail centers compared to
retail centers without grocery stores and how the price levels change over time while the
subsequent regression equation begins to identify the relationship between the prices of grocery-
anchored properties and the specific grocery store that anchors it.
4.1 Sales Price PSF
The following equation was created based on 6,858 transactions and illustrates the
relationship between multiple independent variables and the endogenous variable, or in this case,
the per square foot sales price (“Sale Price PSF”) of the retail asset.
Regression Equation #1:
Sales Price PSF = β0 + β1(Square Feet) + β2(Vacancy) + β3(Age) + β4(Subtype Dummy) +
β5(Grocery Dummy) + β6(Sale Year 2001 Dummy) + … β16(Sale Year 2011 Dummy +
β17(Midwest Dummy) + … β22(West Dummy)

26 Grocery-Anchored Shopping Center: A Better Retail Investment?
The above equation includes three independent variables, including the size of the property in
terms of square feet, the vacancy at the property at the time of sale, and the age of the property at
the time of sale. Furthermore, the regression equation includes three sets of dummy variables.
The first dummy variable is intended to account for the property subtype (i.e., Strip Center and
Mall & Other) as outlined in Chapter 2: Transaction Data. A “1” would be placed next to the β4
if the property is classified as a Strip Center and “0” if not. The next set of dummy variables
account for the year in which the property was sold. Eleven dummy variables were created to
represent transaction years between 2001 and 2011. The data set includes transactions dating
back to 2000; however, a dummy variable was not created for 2000 because this is the year that
the other variables regress from. The third set of dummy variables account for the region where
the property is located. Six dummy variables were created to represent the Midwest, Northeast,
Southeast, Southwest, US-Other, and West. The Mid-Atlantic serves as the base region in the
regression equation.
The original data set from RCA, outlined in Chapter 2: Transaction Data, was revised in
two primary ways to increase the “apples to apples” nature of the analysis. First, all transactions
of properties under 75,000 square feet were dropped from the analysis to eliminate small Strip
Centers, which do not represent an appropriate comparison to grocery-anchored shopping
centers. Most neighborhood and community centers will exceed 75,000 square feet. The second
revision to the data set dropped any transactions where the Sales Price PSF exceeded $300 psf.
This helped to refine the data set to not include lifestyle centers or luxury retail centers located in
downtown districts, which also do not represent an appropriate comparison to grocery-anchored
shopping centers, as well as mere pricing anomalies.

27 Grocery-Anchored Shopping Center: A Better Retail Investment?
The full results of Regression Equation #1 can be found in Appendix A. As expected,
there is a negative relationship between the Sales Price PSF and the vacancy rate and age of the
property. All other variables aside, each incremental change in the vacancy rate and the age of
the property results in approximately a $59 per square foot and $1 per square foot decline in the
Sales Price PSF, respectively. As for the region, it appears that properties in the Midwest,
Southeast, and Southwest tend to be less expensive than those in the Mid-Atlantic, while
properties in the Northeast and West tend to be more expensive. And finally, based on the data
set, retail properties that are anchored by a grocery store tend to be more expensive with a
positive coefficient of $8.99 per square foot. This regression equation produced an R-Squared of
0.235, meaning that 23.5% of the change in the dependent variable, in this case the Sales Price
PSF, can be explained by the independent variables in the equation.
The next two regression equations are identical to the first one except that Regression
Equation #2 only includes properties anchored by a grocery store while Regression Equation #3
excludes all grocery-anchored properties. The actual equation for Regression Equation #2 and
Regression Equation #3 is in fact identically; however, the data behind each is different as
previously mentioned.
Regression Equation #2 and Regression Equation #3:
Sales Price PSF = β0 + β1(Square Feet) + β2(Vacancy) + β3(Age) + β4(Subtype Dummy) +
β6(Sale Year 2001 Dummy) + … β16(Sale Year 2011 Dummy + β17(Midwest Dummy) + …
β22(West Dummy)
The results of Regression Equation #2 and Regression Equation #3 can also be found in
Appendix A. Interestingly, the prices of grocery-anchored properties tend to be more sensitive to

28 Grocery-Anchored Shopping Center: A Better Retail Investment?
vacancy and age. Through separating the grocery-anchored properties from the non-grocery-
anchored properties, we can evaluate the time trend for each and determine the growth in Sale
Price PSF between 2000 and 2011 based on the year in which the property sold. In order to
isolate the impact of the sale year, two prototypical shopping centers were created, one grocery-
anchored and the other non-grocery anchored, yet with the same characteristics. The prototypes
were assumed to be 20 years old, 150,000 square feet in size, 10% vacant, located in the West
region, and classified as a Strip Center per RCA’s classifications. The grocery-anchored and
non-grocery-anchored prototypes were entered into Regression Equation #2 and Regression
Equation #3, respectively, in order to calculate the Sale Price PSF for each year (see Appendix B
for full calculation). The results were plotted on the following chart.
Figure 4.1: Sale Year Time Trend – Sales Price PSF
80
90
100
110
120
130
140
150
160
170
180
190
200
2000 2001 2002 2003 2004 2005 2006 2007 2008 2009 2010 2011
Grocery‐Anchored Prototype Non‐Grocery‐Anchored Prototype

29 Grocery-Anchored Shopping Center: A Better Retail Investment?
The above hedonic price indexes illustrate the difference in price trends between grocery-
anchored and non-grocery-anchored properties. Between 2000 and 2011, the grocery-anchored
prototype was more expensive than the non-grocery-anchored prototype except in 2000 and
2001. As expected, the grocery-anchored prototype seemed to be less sensitive to economic
fluctuations. For example, when the price of the non-grocery-anchored property declined
between 2002 and 2003, the price for the grocery-anchored property continued to rise.
Furthermore, when the price of the non-grocery-anchored property began to decline in 2007-
2008, the price of the grocery-anchored property remained stable and did not begin to decline
until 2008-2009. The average annual return between 2000 and 2010 was 2.8% for the grocery-
anchored prototype and 1.0% for the non-grocery-anchored prototype. Based on the two
hypothetical assets, the hedonic pricing index concludes superior price trends for grocery-
anchored properties as compared to non-grocery-anchored properties.
4.2 Grocery Store Chains – Impact on Sales Price PSF The next set of regression equations intends to illustrate the relationship between the
actual grocery store anchoring a center and the Sale Price PSF. Previous regression equations
demonstrated that investors are willing to pay more, on a per square foot basis, for grocery-
anchored centers. This section now focuses on the actual grocery store and how the size of the
grocery company, in terms of number of stores and total annual sales of the chain, may impact
the price investors are willing to pay for a shopping center.
In order to differentiate the grocery store sizes, a dummy variable was included in the
following regression equation to identify the relationship between the dependent variables (i.e.,
Sales Price PSF) and whether the grocery store is affiliated with one of the top 20 food retailers

30 Grocery-Anchored Shopping Center: A Better Retail Investment?
based on the number of stores and annual sales of the grocery store company as defined in
Appendix C.
Regression Equation #4:
Sale Price PSF = β0 + β1(Square Feet) + β2(Vacancy) + β3(Age) + β4(Top 20 Grocer Dummy) +
β6(Sale Year 2001 Dummy) + … β16(Sale Year 2011 Dummy + β17(Midwest Dummy) + …
β22(West Dummy)
The results of Regression Equation #4 can be found in Appendix A. The equation is based on
2,411 grocery-anchored transactions. Across these transactions, it appears that investors were
willing to pay more for a shopping center that is anchored by a larger grocery store chain
compared to the prices associated with properties anchored by smaller grocery store chains. This
is supported by the coefficient of 8.17 for the dummy variable for top 20 grocery stores.
Therefore, in aggregate across the data set, investors were willing to pay $8.17 per square foot
more for shopping centers that were anchored by a top 20 grocery store.
4.3 Regression Analysis – Price Levels and Trends Conclusion The preceding regression analysis resulted in some important conclusions in terms of the
relationship between grocery-anchored retail properties and asset prices. First, grocery-anchored
properties tend to be more expensive than non-grocery-anchored properties. Second, between
2000 and 2011 grocery-anchored properties outperformed non-grocery-anchored properties
based on the movement in prices. Third, the actual grocery store anchoring a property plays just
as important of a role to asset prices as whether or not the property is merely grocery anchored.
Investors seem to pay more for grocery-anchored properties in which the anchor represents a
larger national chain. Although many of the regressions, as outlined in Appendix A, had

31 Grocery-Anchored Shopping Center: A Better Retail Investment?
relatively low R-Squares, thus implying that there are many factors or variables that affect asset
prices, there remains a meaningful relationship between the independent and dependent variables
in this analysis.

32 Grocery-Anchored Shopping Center: A Better Retail Investment?
CHAPTER 5: USING HEDONIC REGRESSIONS TO COMPARE CAPITALIZATION RATES
5.1 Capitalization Rate Overview
A capitalization rate represents the proportion of net operating income generated by a
property to the value of the same property. This ratio is essentially the inverse of the common
price to earnings ratio that many investors use to evaluate stock investments. A capitalization
rate is a good indication of the premium real estate investors are willing to pay for an asset (i.e.,
lower net operating income relative to the price of the property). The capitalization rate is
determined by the supply of investment capital and demand in the asset market, based on three
primary factors – the opportunity cost of capital, growth expectations, and risk. The opportunity
cost of capital represents the interest rates and returns for other form of investments in the capital
markets, including stocks, bonds, and money market instruments. The price investors are willing
to pay for real estate depends on the returns generated by other types of investments. For
example, when returns on stocks are lower, investors will be willing to pay more for real estate
relative to the income generated by the property, therefore lowering the capitalization rate.
Growth expectations also significantly impact capitalization rates. When investors buy real
estate, they will be focused on the future growth potential of the income stream generated by the
property, which is largely dependent on the space market (i.e., the future supply of and demand
for real estate). The greater the expected growth in future rent, the more investors will be willing
to pay for a property, therefore lowering the capitalization rate. Lastly, real estate investors also
focus on the likelihood that future income streams will actually be collected. If an investor is
confident the future income of a property will be realized, this investor will be willing to pay

33 Grocery-Anchored Shopping Center: A Better Retail Investment?
more for the property today. However, the greater the uncertainty in collecting future rents, the
less the investor will be willing to pay for the property, which will lower the capitalization rate.
5.2 Capitalization Rates – Grocery-Anchored vs. Non-Grocery-Anchored
The next set of regression equations is similar to those in the Chapter 4; however, now
focus on capitalization rates to identify whether there is a price premium for grocery-anchored
centers. The following regression equation was created based on 3,435 transactions and
illustrates the relationship between multiple independent variables, similar to the regression
equations in Chapter 4, but now with the capitalization rate serving as the dependent variable
Regression Equation #5:
Capitalization Rate = β0 + β1(Square Feet) + β2(Vacancy) + β3(Age) + β4(Subtype Dummy) +
β5(Grocery Dummy) + β6(Sale Year 2001 Dummy) + … β16(Sale Year 2011 Dummy +
β17(Midwest Dummy) + … β22(West Dummy)
The results of Regression Equation #5 can be found in Appendix A. As expected, a relationship
exists between the vacancy rate at the property and the capitalization rate in that as the vacancy
rate increases the capitalization rate also increases. The coefficient of 0.0066 implies that for
each incremental upward change in the vacancy rate, the cap rate increases by 66 basis points in
aggregate across the 3,435 transactions. Similarly, as the age of the property increases so does
that capitalization rate. For each incremental increase in the age of the property the capitalization
rate increases by 2 basis points based on the coefficient of 0.0002, which makes sense given that
real estate investors will pay less for older properties relative to the income these properties
produce, therefore increasing the capitalization rate.

34 Grocery-Anchored Shopping Center: A Better Retail Investment?
Capitalization rates also changed based on where the property is located. Regression
Equation #5 found that in this specific data investors paid a premium (i.e., lower capitalization
rate) for properties located in the Northeast and West as compared to those properties in the Mid-
Atlantic while properties located in the Midwest and Southeast tend to trade at higher
capitalization rates compared to the Mid-Atlantic. There were not enough transactions in the
Southwest to make a conclusion based on the low P-Value attributed to this independent variable
in the regression output.
As for the impact on the capitalization rate caused by a grocery store anchoring the
property, Regression Equation #5 illustrates a positive relationship between the existence of a
grocery store and the premium investors are willing to pay for the asset. The capitalization rates
for grocery-anchored properties were 18 basis points lower than those without a grocery store,
based on the coefficient of 0.0018 for the grocery dummy variable in the equation.
The next set of regression equations also look at capitalization rates, but separates the
transactions into two categories – grocery-anchored (Regression Equation #6) and non-grocery-
anchored (Regression Equation #7). Therefore, the grocery dummy variable in these regression
equations is not longer required. The results of the following regression equations will illustrate
the how the relationship between the independent variables differs between grocery-anchored
shopping centers and non-grocery-anchored shopping centers.
Regression Equation #6 and Regression Equation #7:
Capitalization Rate = β0 + β1(Square Feet) + β2(Vacancy) + β3(Age) + β4(Subtype Dummy) +
β6(Sale Year 2001 Dummy) + … β16(Sale Year 2011 Dummy + β17(Midwest Dummy) + …
β22(West Dummy)

35 Grocery-Anchored Shopping Center: A Better Retail Investment?
The results can be found in Appendix A. Interestingly, the capitalization rates for grocery-
anchored centers seem to be more sensitive to changes in vacancy compared to non-grocery-
anchored centers, based on the coefficients in these equations of 0.0094 and 0.0054, respectively.
However, the capitalization rates for grocery-anchored centers did not respond differently to age
compared to the capitalization rates for non-grocery-anchored centers - both regression
equations resulted in the same coefficient for the age independent variable.
Separating the grocery-anchored properties from the non-grocery-anchored properties
illustrates the time trend for each asset type as to the corresponding change in capitalization rates
between 2000 and 2011. The same prototypes used in Chapter 4 (20 years old, 150,000 square
feet, 10% vacancy, Strip Center, West Region) were entered into Regression Equation #6 and
Regression Equation #7 in order to isolate the impact of the sale year, or time, on the
capitalization rate, thus deciphering capitalization rate trends over time between grocery-
anchored and non-grocery-anchored properties. The actual calculation can be found in Appendix
B and the results are plotted on the following chart.

36 Grocery-Anchored Shopping Center: A Better Retail Investment?
Figure 5.1: Sale Year Time Trend – Capitalization Rates
As demonstrated in the above chart, the trend in capitalization rates is very similar between
grocery-anchored and non-grocery-anchored properties. In seven out of the ten years in the
sample period, the grocery-anchored prototype realized lower capitalization rates than the non-
grocery-anchored prototype. However, these hedonic indexes also allow us to see the trend over
time. Interestingly, the capitalization rate for the grocery-anchored prototype actually climbed
faster during the recession beginning in 2007 than that of the non-grocery-anchored prototype,
and was actually higher in 2008 and 2009. However, the capitalization rate for the grocery-
anchored property fell quickly in 2009-2010 while the capitalization rate for the non-grocery-
anchored property stabilized in 2009-2010. As capital began to flow back into commercial real
estate markets after the “Great Recession”, investors preferred core assets and this is supported
0.04
0.05
0.06
0.07
0.08
0.09
0.10
0.11
0.12
2000 2001 2002 2003 2004 2005 2006 2007 2008 2009 2010 2011
Grocery‐Anchored Prototype Non‐Grocery‐Anchored Prototype
37 Grocery-Anchored Shopping Center: A Better Retail Investment?
by the rapid fall in the capitalization rate for the grocery-anchored prototype in 2009-2010.
During the peak of the last cycle (2006-2007), the spread was also significant and could be
indicative of higher growth expectations investors had for grocery-anchored properties compared
to non-grocery-anchored properties.
4.2 Grocery Store Chains - Impact on Capitalization Rates
The next regression equation intends to identify the relationship between capitalization
rates and the type of grocery store anchoring the property. The following equation is based on
1,342 transactions and includes a dummy variable to account for whether the grocery store is one
of the top 20 grocery stores based on the number of stores and annual sales.
Regression Equation #8:
Capitalization Rate = β0 + β1(Square Feet) + β2(Vacancy) + β3(Age) + β4(Top 20 Grocer Dummy)
+ β6(Sale Year 2001 Dummy) + … β16(Sale Year 2011 Dummy + β17(Midwest Dummy) + …
β22(West Dummy)
The results of Regression Equation #8 can be found in Appendix A. As expected, properties that
are anchored by a top 20 grocery store chain seemed to trade at lower capitalization rates based
on a negative coefficient of 0.0023. This means that capitalization rates for grocery-anchored
centers with a top 20 grocer, in aggregate across the data set, were approximately 23 basis points
lower than the capitalization rates for grocery-anchored properties without a leading grocery
store chain. Therefore, investors will pay a premium for grocery-anchored properties anchored
by larger national chains, likely based on perceived higher income growth potential as well as
lower income risk.

38 Grocery-Anchored Shopping Center: A Better Retail Investment?
4.2 Capitalization Rates Conclusion
Capitalization rates are a good indicator of the income growth potential and income risk
for a real estate investment as perceived by the investment market. Capitalization rates are also
affected by the opportunity cost of capital or investment yields on alternative investments to real
estate. The analysis in this chapter concludes that grocery-anchored properties typically trade at
lower capitalization rates as compared to non-grocery-anchored properties, and furthermore,
those grocery-anchored properties with a “stronger” grocery store generate even lower
capitalization rates. This implies that investors view the income stream of a grocery-anchored
property to be less risky and more likely to grow. However, the sale year time trend highlighted
some interesting aspects of the movement of these capitalization rates over time and found that
depending on the economic environment, the capitalization rates for non-grocery-anchored
properties can actually be lower than those of non-grocery-anchored properties. Furthermore, the
magnitude of a decline or rise in capitalization rates can vary significantly between grocery-
anchored and non-grocery-anchored depending on the investors perception of the current
economic environment and how the related to the perceived income growth and income risk of
grocery-anchored and non-grocery-anchored properties.

39 Grocery-Anchored Shopping Center: A Better Retail Investment?
CHAPTER 6: CONCLUSION
This thesis began by looking at the actual perceived benefits of grocery-anchored
shopping centers compared to other retail investments, similar in nature, but without a grocery
store as the primary anchor. Simple evidence supports three primary notions. First, grocery
stores are unique among retailers in that they are able to attract shoppers on a regular basis,
therefore consistently bringing people to grocery-anchored shopping centers. Second, the
grocery store business is non-cyclical and therefore less impacted by economic downturns
relative to the rest of the retail industry. Third, grocery stores have not been as impacted by the
Internet compared to other retailers, although recent developments illustrate that this may not be
the case going forward.
Through creating a repeat-sales index, I was able to evaluate the price performance
between 2000 and 2011. Interestingly, non-grocery-anchored properties actually outperformed
grocery-anchored centers in terms of the change in price not only between the peaks and troughs
of the last two real estate cycles, but also based on the average quarterly return over the entire
sample period. However, this performance came at the expense of greater volatility or movement
of asset prices within each cycle, supporting the common relationship between risk and return.
Next, a set of hedonic regression equations were created to evaluate the price
performance of grocery-anchored properties compared to non-grocery-anchored properties.
Grocery-anchored properties tend to be more expensive in terms of the per square foot sale price
of the asset; however, not by much ($8.99 per square foot). After separating the grocery-
anchored properties from the non-grocery-anchored properties, each regression equations’ sale
year time trend was also evaluated. Grocery-anchored properties seem to perform better, in terms

40 Grocery-Anchored Shopping Center: A Better Retail Investment?
of price appreciation since 2000, compared to non-grocery-anchored properties. The regression
analysis concluded different price performance results compared to the repeat-sales approach.
Therefore, it is clear that investors pay more on a per square foot basis for grocery-anchored
properties, however, it remains unclear whether grocery-anchored properties benefited from
superior price trends over the last ten years.
The next objective was to compare capitalization rates for grocery-anchored properties to
those of non-grocery-anchored properties. A lower capitalization rate would imply that investors
are willing to pay a premium for these assets due to the perceived income risk and income
growth potential. The analysis completed in Chapter 5 supports the hypothesis that grocery-
anchored properties tend to trade at lower capitalization rates. This can be justified by the lower
risk associated with grocery-anchored properties, as demonstrated by less volatility in asset
prices in the repeat-sales analysis. Furthermore, investors will accept lower income returns (i.e.,
lower capitalization rates) for grocery-anchored properties in which the grocery store represents
a large national chain. Lower capitalization rates are more difficult to justify by higher growth
potential. The repeat-sales price indexes actually demonstrated that grocery-anchored properties
underperformed non-grocery-anchored properties in terms of price appreciation while the
regression analysis in Chapter 4 and the corresponding sale year time trend concluded the
opposite - all other variables constant, grocery-anchored properties appreciated faster than non-
grocery-anchored properties between 2000 and 2011.
Overall, the analysis in this thesis supports the hypothesis that investors will tend to pay
more for grocery-anchored properties in terms of the per square foot sale price. Grocery-
anchored properties also tend to trade at lower capitalization rates, which can be attributed to the
perceived income risk and income growth potential. Although grocery-anchored properties

41 Grocery-Anchored Shopping Center: A Better Retail Investment?
clearly demonstrate less volatility, it remains unclear whether they are superior in terms of price
appreciation. Although a clear relationship exists between grocery-anchored shopping centers
and asset prices and capitalization rates, the magnitude of the relationships is modest, which may
be partially explained by the many variables that affect prices and capitalization rates on a micro
(e.g., specific property issues, etc.) and macro (e.g., capital markets, etc.) level. The intent of this
thesis was to isolate the impact that a grocery-store has on the performance of a retail asset, and
supported by the statistical tools utilized in this thesis, the unique characteristics that a grocery
store brings to a shopping center clearly has an impact on asset prices and capitalization rates.

42 Grocery-Anchored Shopping Center: A Better Retail Investment?
Bibliography
Food Marketing Institute. FMI Grocery Shopper Trends 2010: Consumers Are Savvy and Informed Bargain Hunters When It Comes to Grocery Shopping. Arlington. 2010. Print. Geltner, David, and Henry Pollakowski. A Set of Indexes for Trading Commercial Real Estate Based on the Real Capital Analytics Transaction Prices Database. MIT Center for Real Estate Commercial Real Estate Data Laboratory, 26 Sept. 2007. Web. 31 July 2011. Jopson, Barney, and Alan Rappeport. "Walmart Plots Online Grocery Growth." FT.com. Financial Times Ltd., 24 Apr. 2011. Web. 31 July 2011. Lindeman, Teresa F. "Online Grocery Shopping Services Bounce Back." Pittsburgh Post-Gazette. 22 Apr. 2011. Web. 31 July 2011. Lunce, Stephen E., Leslie M. Lunce, Yoko Kawai, and Balasundrum Maniam. "Success and Failure of Pure-play Organizations: Webvan versus Peapod, a Comparative Analysis." Industrial Management & Data Systems 106.9 (2006): 1344-358. Print. "MIT CRE : Moodys/REAL Commercial Property Price Index (CPPI)." MIT - Massachusetts Institute of Technology. Web. 31 July 2011. <http://web.mit.edu/cre/research/credl/rca.html>. Ramus, Kim, and Niels Asger Nielsen. "Online Grocery Retailing: What Do Consumers Think?" Internet Research 15.3 (2005): 335-52. Print. "Retail | Real Capital Analytics | Commercial Real Estate Glossary." RCA Commercial Real Estate Sales Trends & Market Research. Web. 31 July 2011. <http://www.rcanalytics.com/glossary/r/Retail.aspx>. Shea, Rick. "Consumers Shifting Food Purchase Patterns Into Recession Mode." Seeking Alpha (2008). Seeking Alpha. 13 Apr. 2008. Web. 31 July 2011. United States Census Bureau. Monthly Retail Trade Report. 14 July 2011. Web. United States Department of Agriculture. Economics Research Service. Food CPI and Expenditures: Table 7. Web.

43 Grocery-Anchored Shopping Center: A Better Retail Investment?
Appendix A: Regression Outputs

44 Grocery-Anchored Shopping Center: A Better Retail Investment?
Regression #1

45 Grocery-Anchored Shopping Center: A Better Retail Investment?
Regression #2

46 Grocery-Anchored Shopping Center: A Better Retail Investment?
Regression #3

47 Grocery-Anchored Shopping Center: A Better Retail Investment?
Regression #4

48 Grocery-Anchored Shopping Center: A Better Retail Investment?
Regression #5

49 Grocery-Anchored Shopping Center: A Better Retail Investment?
Regression #6

50 Grocery-Anchored Shopping Center: A Better Retail Investment?
Regression #7

51 Grocery-Anchored Shopping Center: A Better Retail Investment?
Regression #8

52 Grocery-Anchored Shopping Center: A Better Retail Investment?
Appendix B: Sale Year Time Trends

53 Grocery-Anchored Shopping Center: A Better Retail Investment?
Variable Product Variable Product Variable Product Variable Product Variable Product Variable Product Variable Product Variable Product Variable Product Variable Product Variable Product Variable Product
Constant 130.1 130.10 130.10 130.10 130.10 130.10 130.10 130.10 130.10 130.10 130.10 130.10 130.10
Square Feet -2.69E-05 150,000 -4.04 150,000 -4.04 150,000 -4.04 150,000 -4.04 150,000 -4.04 150,000 -4.04 150,000 -4.04 150,000 -4.04 150,000 -4.04 150,000 -4.04 150,000 -4.04 150,000 -4.04
Vacancy -65.79 10% -6.58 10% -6.58 10% -6.58 10% -6.58 10% -6.58 10% -6.58 10% -6.58 10% -6.58 10% -6.58 10% -6.58 10% -6.58 10% -6.58
Age -1.15 20 -23.00 20 -23.00 20 -23.00 20 -23.00 20 -23.00 20 -23.00 20 -23.00 20 -23.00 20 -23.00 20 -23.00 20 -23.00 20 -23.00
Subtype Dummy -2.56 1 -2.56 1 -2.56 1 -2.56 1 -2.56 1 -2.56 1 -2.56 1 -2.56 1 -2.56 1 -2.56 1 -2.56 1 -2.56 1 -2.56
SY 2001 Dummy 7.77 0 0.00 1 7.77 0 0.00 0 0.00 0 0.00 0 0.00 0 0.00 0 0.00 0 0.00 0 0.00 0 0.00 0 0.00
SY 2002 Dummy 12.59 0 0.00 0 0.00 1 12.59 0 0.00 0 0.00 0 0.00 0 0.00 0 0.00 0 0.00 0 0.00 0 0.00 0 0.00SY 2003 Dummy 23.77 0 0.00 0 0.00 0 0.00 1 23.77 0 0.00 0 0.00 0 0.00 0 0.00 0 0.00 0 0.00 0 0.00 0 0.00
SY 2004 Dummy 37.43 0 0.00 0 0.00 0 0.00 0 0.00 1 37.43 0 0.00 0 0.00 0 0.00 0 0.00 0 0.00 0 0.00 0 0.00
SY 2005 Dummy 57.1 0 0.00 0 0.00 0 0.00 0 0.00 0 0.00 1 57.10 0 0.00 0 0.00 0 0.00 0 0.00 0 0.00 0 0.00
SY 2006 Dummy 58.4 0 0.00 0 0.00 0 0.00 0 0.00 0 0.00 0 0.00 1 58.40 0 0.00 0 0.00 0 0.00 0 0.00 0 0.00
SY 2007 Dummy 59.84 0 0.00 0 0.00 0 0.00 0 0.00 0 0.00 0 0.00 0 0.00 1 59.84 0 0.00 0 0.00 0 0.00 0 0.00
SY 2008 Dummy 60.35 0 0.00 0 0.00 0 0.00 0 0.00 0 0.00 0 0.00 0 0.00 0 0.00 1 60.35 0 0.00 0 0.00 0 0.00
SY 2009 Dummy 52.45 0 0.00 0 0.00 0 0.00 0 0.00 0 0.00 0 0.00 0 0.00 0 0.00 0 0.00 1 52.45 0 0.00 0 0.00
SY 2010 Dummy 43.3 0 0.00 0 0.00 0 0.00 0 0.00 0 0.00 0 0.00 0 0.00 0 0.00 0 0.00 0 0.00 1 43.30 0 0.00
SY 2011 Dummy 40.06 0 0.00 0 0.00 0 0.00 0 0.00 0 0.00 0 0.00 0 0.00 0 0.00 0 0.00 0 0.00 0 0.00 1 40.06
Midwest Dummy -30.83 0 0.00 0 0.00 0 0.00 0 0.00 0 0.00 0 0.00 0 0.00 0 0.00 0 0.00 0 0.00 0 0.00 0 0.00
Northeast Dummy -0.16 0 0.00 0 0.00 0 0.00 0 0.00 0 0.00 0 0.00 0 0.00 0 0.00 0 0.00 0 0.00 0 0.00 0 0.00
Southeast Dummy -26.17 0 0.00 0 0.00 0 0.00 0 0.00 0 0.00 0 0.00 0 0.00 0 0.00 0 0.00 0 0.00 0 0.00 0 0.00
Southwest Dummy -12.69 0 0.00 0 0.00 0 0.00 0 0.00 0 0.00 0 0.00 0 0.00 0 0.00 0 0.00 0 0.00 0 0.00 0 0.00
West Dummy 25.76 1 25.76 1 25.76 1 25.76 1 25.76 1 25.76 1 25.76 1 25.76 1 25.76 1 25.76 1 25.76 1 25.76 1 25.76
Sale Price PSF 119.69 127.46 132.28 143.46 157.12 176.79 178.09 179.53 180.04 172.14 162.99 159.75
Grocery-Anchored2010 20112004 2005 2006 2007 2008 20092000 2001
Coefficient2002 2003
Variable Product Variable Product Variable Product Variable Product Variable Product Variable Product Variable Product Variable Product Variable Product Variable Product Variable Product Variable Product
Constant 105.2 105.20 105.20 105.20 105.20 105.20 105.20 105.20 105.20 105.20 105.20 105.20 105.20
Square Feet 3.12E-05 150,000 4.68 150,000 4.68 150,000 4.68 150,000 4.68 150,000 4.68 150,000 4.68 150,000 4.68 150,000 4.68 150,000 4.68 150,000 4.68 150,000 4.68 150,000 4.68
Vacancy -48.11 10% -4.81 10% -4.81 10% -4.81 10% -4.81 10% -4.81 10% -4.81 10% -4.81 10% -4.81 10% -4.81 10% -4.81 10% -4.81 10% -4.81
Age -0.92 20 -18.40 20 -18.40 20 -18.40 20 -18.40 20 -18.40 20 -18.40 20 -18.40 20 -18.40 20 -18.40 20 -18.40 20 -18.40 20 -18.40
Subtype Dummy 23.29 1 23.29 1 23.29 1 23.29 1 23.29 1 23.29 1 23.29 1 23.29 1 23.29 1 23.29 1 23.29 1 23.29 1 23.29
SY 2001 Dummy -11.19 0 0.00 1 -11.19 0 0.00 0 0.00 0 0.00 0 0.00 0 0.00 0 0.00 0 0.00 0 0.00 0 0.00 0 0.00
SY 2002 Dummy 7.67 0 0.00 0 0.00 1 7.67 0 0.00 0 0.00 0 0.00 0 0.00 0 0.00 0 0.00 0 0.00 0 0.00 0 0.00
SY 2003 Dummy 7.13 0 0.00 0 0.00 0 0.00 1 7.13 0 0.00 0 0.00 0 0.00 0 0.00 0 0.00 0 0.00 0 0.00 0 0.00
SY 2004 Dummy 12.97 0 0.00 0 0.00 0 0.00 0 0.00 1 12.97 0 0.00 0 0.00 0 0.00 0 0.00 0 0.00 0 0.00 0 0.00
SY 2005 Dummy 17.63 0 0.00 0 0.00 0 0.00 0 0.00 0 0.00 1 17.63 0 0.00 0 0.00 0 0.00 0 0.00 0 0.00 0 0.00
SY 2006 Dummy 24.22 0 0.00 0 0.00 0 0.00 0 0.00 0 0.00 0 0.00 1 24.22 0 0.00 0 0.00 0 0.00 0 0.00 0 0.00
SY 2007 Dummy 27.38 0 0.00 0 0.00 0 0.00 0 0.00 0 0.00 0 0.00 0 0.00 1 27.38 0 0.00 0 0.00 0 0.00 0 0.00
SY 2008 Dummy 24.82 0 0.00 0 0.00 0 0.00 0 0.00 0 0.00 0 0.00 0 0.00 0 0.00 1 24.82 0 0.00 0 0.00 0 0.00
SY 2009 Dummy 5 0 0.00 0 0.00 0 0.00 0 0.00 0 0.00 0 0.00 0 0.00 0 0.00 0 0.00 1 5.00 0 0.00 0 0.00
SY 2010 Dummy 8.18 0 0.00 0 0.00 0 0.00 0 0.00 0 0.00 0 0.00 0 0.00 0 0.00 0 0.00 0 0.00 1 8.18 0 0.00
SY 2011 Dummy 11.46 0 0.00 0 0.00 0 0.00 0 0.00 0 0.00 0 0.00 0 0.00 0 0.00 0 0.00 0 0.00 0 0.00 1 11.46
Midwest Dummy -23.07 0 0.00 0 0.00 0 0.00 0 0.00 0 0.00 0 0.00 0 0.00 0 0.00 0 0.00 0 0.00 0 0.00 0 0.00
Northeast Dummy 13.39 0 0.00 0 0.00 0 0.00 0 0.00 0 0.00 0 0.00 0 0.00 0 0.00 0 0.00 0 0.00 0 0.00 0 0.00
Southeast Dummy -16.39 0 0.00 0 0.00 0 0.00 0 0.00 0 0.00 0 0.00 0 0.00 0 0.00 0 0.00 0 0.00 0 0.00 0 0.00
Southwest Dummy -9.61 0 0.00 0 0.00 0 0.00 0 0.00 0 0.00 0 0.00 0 0.00 0 0.00 0 0.00 0 0.00 0 0.00 0 0.00
US-Other Dummy 47.38 0 0.00 0 0.00 0 0.00 0 0.00 0 0.00 0 0.00 0 0.00 0 0.00 0 0.00 0 0.00 0 0.00 0 0.00
West Dummy 21.91 1 21.91 1 21.91 1 21.91 1 21.91 1 21.91 1 21.91 1 21.91 1 21.91 1 21.91 1 21.91 1 21.91 1 21.91
Sale Price PSF 131.87 120.68 139.54 139.00 144.84 149.50 156.09 159.25 156.69 136.87 140.05 143.33
NonGrocery-Anchored
2007 2008 2009 2010 2011Coefficient
2000 2001 2002 2003 2004 2005 2006

54 Grocery-Anchored Shopping Center: A Better Retail Investment?
Variable Product Variable Product Variable Product Variable Product Variable Product Variable Product Variable Product Variable Product Variable Product Variable Product Variable Product Variable Product
Constant 0.0892 8.92% 8.92% 8.92% 8.92% 8.92% 8.92% 8.92% 8.92% 8.92% 8.92% 8.92% 8.92%
Square Feet -9.23E-09 150,000 -0.14% 150,000 -0.14% 150,000 -0.14% 150,000 -0.14% 150,000 -0.14% 150,000 -0.14% 150,000 -0.14% 150,000 -0.14% 150,000 -0.14% 150,000 -0.14% 150,000 -0.14% 150,000 -0.14%
Vacancy 0.0094 10% 0.09% 10% 0.09% 10% 0.09% 10% 0.09% 10% 0.09% 10% 0.09% 10% 0.09% 10% 0.09% 10% 0.09% 10% 0.09% 10% 0.09% 10% 0.09%
Age 0.0002 20 0.40% 20 0.40% 20 0.40% 20 0.40% 20 0.40% 20 0.40% 20 0.40% 20 0.40% 20 0.40% 20 0.40% 20 0.40% 20 0.40%
Subtype Dummy 0.0101 1 1.01% 1 1.01% 1 1.01% 1 1.01% 1 1.01% 1 1.01% 1 1.01% 1 1.01% 1 1.01% 1 1.01% 1 1.01% 1 1.01%
SY 2001 Dummy -0.0015 0 0.00% 1 -0.15% 0 0.00% 0 0.00% 0 0.00% 0 0.00% 0 0.00% 0 0.00% 0 0.00% 0 0.00% 0 0.00% 0 0.00%
SY 2002 Dummy -0.0092 0 0.00% 0 0.00% 1 -0.92% 0 0.00% 0 0.00% 0 0.00% 0 0.00% 0 0.00% 0 0.00% 0 0.00% 0 0.00% 0 0.00%
SY 2003 Dummy -0.0163 0 0.00% 0 0.00% 0 0.00% 1 -1.63% 0 0.00% 0 0.00% 0 0.00% 0 0.00% 0 0.00% 0 0.00% 0 0.00% 0 0.00%
SY 2004 Dummy -0.0216 0 0.00% 0 0.00% 0 0.00% 0 0.00% 1 -2.16% 0 0.00% 0 0.00% 0 0.00% 0 0.00% 0 0.00% 0 0.00% 0 0.00%
SY 2005 Dummy -0.0258 0 0.00% 0 0.00% 0 0.00% 0 0.00% 0 0.00% 1 -2.58% 0 0.00% 0 0.00% 0 0.00% 0 0.00% 0 0.00% 0 0.00%
SY 2006 Dummy -0.0307 0 0.00% 0 0.00% 0 0.00% 0 0.00% 0 0.00% 0 0.00% 1 -3.07% 0 0.00% 0 0.00% 0 0.00% 0 0.00% 0 0.00%
SY 2007 Dummy -0.0344 0 0.00% 0 0.00% 0 0.00% 0 0.00% 0 0.00% 0 0.00% 0 0.00% 1 -3.44% 0 0.00% 0 0.00% 0 0.00% 0 0.00%
SY 2008 Dummy -0.0238 0 0.00% 0 0.00% 0 0.00% 0 0.00% 0 0.00% 0 0.00% 0 0.00% 0 0.00% 1 -2.38% 0 0.00% 0 0.00% 0 0.00%
SY 2009 Dummy -0.0117 0 0.00% 0 0.00% 0 0.00% 0 0.00% 0 0.00% 0 0.00% 0 0.00% 0 0.00% 0 0.00% 1 -1.17% 0 0.00% 0 0.00%
SY 2010 Dummy -0.0171 0 0.00% 0 0.00% 0 0.00% 0 0.00% 0 0.00% 0 0.00% 0 0.00% 0 0.00% 0 0.00% 0 0.00% 1 -1.71% 0 0.00%
SY 2011 Dummy -0.0193 0 0.00% 0 0.00% 0 0.00% 0 0.00% 0 0.00% 0 0.00% 0 0.00% 0 0.00% 0 0.00% 0 0.00% 0 0.00% 1 -1.93%
Midwest Dummy 0.0018 0 0.00% 0 0.00% 0 0.00% 0 0.00% 0 0.00% 0 0.00% 0 0.00% 0 0.00% 0 0.00% 0 0.00% 0 0.00% 0 0.00%
Northeast Dummy -0.0043 0 0.00% 0 0.00% 0 0.00% 0 0.00% 0 0.00% 0 0.00% 0 0.00% 0 0.00% 0 0.00% 0 0.00% 0 0.00% 0 0.00%
Southeast Dummy -0.0005 0 0.00% 0 0.00% 0 0.00% 0 0.00% 0 0.00% 0 0.00% 0 0.00% 0 0.00% 0 0.00% 0 0.00% 0 0.00% 0 0.00%
Southwest Dummy -0.0014 0 0.00% 0 0.00% 0 0.00% 0 0.00% 0 0.00% 0 0.00% 0 0.00% 0 0.00% 0 0.00% 0 0.00% 0 0.00% 0 0.00%
West Dummy -0.0054 1 -0.54% 1 -0.54% 1 -0.54% 1 -0.54% 1 -0.54% 1 -0.54% 1 -0.54% 1 -0.54% 1 -0.54% 1 -0.54% 1 -0.54% 1 -0.54%
Capitalization Rate 9.75% 9.60% 8.83% 8.12% 7.59% 7.17% 6.68% 6.31% 7.37% 8.58% 8.04% 7.82%
Grocery-Anchored20112005 2006 2007 2008 2009 2010
Coefficient2000 2001 2002 2003 2004
Variable Product Variable Product Variable Product Variable Product Variable Product Variable Product Variable Product Variable Product Variable Product Variable Product Variable Product Variable Product
Constant 0.101 10.10% 10.10% 10.10% 10.10% 10.10% 10.10% 10.10% 10.10% 10.10% 10.10% 10.10% 10.10%
Square Feet -7.27E-09 150,000 -0.11% 150,000 -0.11% 150,000 -0.11% 150,000 -0.11% 150,000 -0.11% 150,000 -0.11% 150,000 -0.11% 150,000 -0.11% 150,000 -0.11% 150,000 -0.11% 150,000 -0.11% 150,000 -0.11%
Vacancy 0.0054 10% 0.05% 10% 0.05% 10% 0.05% 10% 0.05% 10% 0.05% 10% 0.05% 10% 0.05% 10% 0.05% 10% 0.05% 10% 0.05% 10% 0.05% 10% 0.05%
Age 0.0002 20 0.40% 20 0.40% 20 0.40% 20 0.40% 20 0.40% 20 0.40% 20 0.40% 20 0.40% 20 0.40% 20 0.40% 20 0.40% 20 0.40%
Subtype Dummy -0.0024 1 -0.24% 1 -0.24% 1 -0.24% 1 -0.24% 1 -0.24% 1 -0.24% 1 -0.24% 1 -0.24% 1 -0.24% 1 -0.24% 1 -0.24% 1 -0.24%
SY 2001 Dummy -0.0048 0 0.00% 1 -0.48% 0 0.00% 0 0.00% 0 0.00% 0 0.00% 0 0.00% 0 0.00% 0 0.00% 0 0.00% 0 0.00% 0 0.00%
SY 2002 Dummy -0.0111 0 0.00% 0 0.00% 1 -1.11% 0 0.00% 0 0.00% 0 0.00% 0 0.00% 0 0.00% 0 0.00% 0 0.00% 0 0.00% 0 0.00%
SY 2003 Dummy -0.0169 0 0.00% 0 0.00% 0 0.00% 1 -1.69% 0 0.00% 0 0.00% 0 0.00% 0 0.00% 0 0.00% 0 0.00% 0 0.00% 0 0.00%
SY 2004 Dummy -0.0232 0 0.00% 0 0.00% 0 0.00% 0 0.00% 1 -2.32% 0 0.00% 0 0.00% 0 0.00% 0 0.00% 0 0.00% 0 0.00% 0 0.00%
SY 2005 Dummy -0.029 0 0.00% 0 0.00% 0 0.00% 0 0.00% 0 0.00% 1 -2.90% 0 0.00% 0 0.00% 0 0.00% 0 0.00% 0 0.00% 0 0.00%
SY 2006 Dummy -0.032 0 0.00% 0 0.00% 0 0.00% 0 0.00% 0 0.00% 0 0.00% 1 -3.20% 0 0.00% 0 0.00% 0 0.00% 0 0.00% 0 0.00%
SY 2007 Dummy -0.0345 0 0.00% 0 0.00% 0 0.00% 0 0.00% 0 0.00% 0 0.00% 0 0.00% 1 -3.45% 0 0.00% 0 0.00% 0 0.00% 0 0.00%
SY 2008 Dummy -0.0316 0 0.00% 0 0.00% 0 0.00% 0 0.00% 0 0.00% 0 0.00% 0 0.00% 0 0.00% 1 -3.16% 0 0.00% 0 0.00% 0 0.00%
SY 2009 Dummy -0.0189 0 0.00% 0 0.00% 0 0.00% 0 0.00% 0 0.00% 0 0.00% 0 0.00% 0 0.00% 0 0.00% 1 -1.89% 0 0.00% 0 0.00%
SY 2010 Dummy -0.0191 0 0.00% 0 0.00% 0 0.00% 0 0.00% 0 0.00% 0 0.00% 0 0.00% 0 0.00% 0 0.00% 0 0.00% 1 -1.91% 0 0.00%
SY 2011 Dummy -0.0219 0 0.00% 0 0.00% 0 0.00% 0 0.00% 0 0.00% 0 0.00% 0 0.00% 0 0.00% 0 0.00% 0 0.00% 0 0.00% 1 -2.19%
Midwest Dummy 0.0046 0 0.00% 0 0.00% 0 0.00% 0 0.00% 0 0.00% 0 0.00% 0 0.00% 0 0.00% 0 0.00% 0 0.00% 0 0.00% 0 0.00%
Northeast Dummy -0.0018 0 0.00% 0 0.00% 0 0.00% 0 0.00% 0 0.00% 0 0.00% 0 0.00% 0 0.00% 0 0.00% 0 0.00% 0 0.00% 0 0.00%
Southeast Dummy 0.0038 0 0.00% 0 0.00% 0 0.00% 0 0.00% 0 0.00% 0 0.00% 0 0.00% 0 0.00% 0 0.00% 0 0.00% 0 0.00% 0 0.00%
Southwest Dummy 0.0024 0 0.00% 0 0.00% 0 0.00% 0 0.00% 0 0.00% 0 0.00% 0 0.00% 0 0.00% 0 0.00% 0 0.00% 0 0.00% 0 0.00%
West Dummy -0.0024 1 -0.24% 1 -0.24% 1 -0.24% 1 -0.24% 1 -0.24% 1 -0.24% 1 -0.24% 1 -0.24% 1 -0.24% 1 -0.24% 1 -0.24% 1 -0.24%
Capitalization Rate 9.96% 9.48% 8.85% 8.27% 7.64% 7.06% 6.76% 6.51% 6.80% 8.07% 8.05% 7.77%
NonGrocery-Anchored
2007 2008 2009 2010 2011Coefficient
2000 2001 2002 2003 2004 2005 2006

55 Grocery-Anchored Shopping Center: A Better Retail Investment?
Appendix C: Top 20 Food Retailers

56 Grocery-Anchored Shopping Center: A Better Retail Investment?

57 Grocery-Anchored Shopping Center: A Better Retail Investment?