Embed Size (px)
Citation preview
GRINCH Detector Technical Document v.11
Todd D. Averett, Huan Yao, College of William and MaryBogdan Wojtsekhowski, Jefferson Lab
Submitted to Hall A, September 18, 2012
Contents
1 Introduction 2
2 Experimental Requirements 5
3 Basic Concept 73.1 Temple University/dn2 BigBite Cherenkov Detector . . . . . . . 73.2 W&M BigBite Cherenkov Detector Concept . . . . . . . . . . 10
4 Background and Rate Studies 124.1 Neutrons . . . . . . . . . . . . . . . . . . . . . . . . . . . . . . 124.2 Photons and Low Energy Electrons . . . . . . . . . . . . . . . 134.3 An1 Background Rate Estimate . . . . . . . . . . . . . . . . . . 13
5 Simulation and Design 145.1 GEANT4 Simulation and Design Parameters . . . . . . . . . . 145.2 Physical Design . . . . . . . . . . . . . . . . . . . . . . . . . . 155.3 PMTs . . . . . . . . . . . . . . . . . . . . . . . . . . . . . . . 155.4 Magnetic Shielding . . . . . . . . . . . . . . . . . . . . . . . . 215.5 Pion Detection Efficiency . . . . . . . . . . . . . . . . . . . . . 235.6 Accidental Backgrounds . . . . . . . . . . . . . . . . . . . . . 25
6 Gas System 26
7 Prototype 26
8 Budget and Personnel 27
9 Conclusion 31
1
1 Introduction
This document outlines the motivation, concept and budget of the proposedHall A BigBite Gas Cherenkov (GRINCH) detector for use in An1 and otherexperiments at 12 GeV. Detailed information about this project may be foundon the William and Mary gas Cherenkov wiki site [1]. The current list ofexperiments using the upgraded BigBite spectrometer is:
1. An1 , E12-06-122 [2]: Measurement of the neutron spin asymmetry An1 inthe valence quark region using BigBite spectrometer in Hall A. ∆u/u,∆d/d. Uses the upgraded BigBite detector.
2. Tritium, E12-10-103 [3]: Measurement of the F n2 /F
p2 , d/u Ratios and
A=3 EMC Effect in Deep Inelastic Electron Scattering Off the Tritiumand Helium Mirror Nuclei. Uses the BigBite detector.
3. GnM , E12-09-019 [4]: Precision Measurement of the Neutron Magnetic
Form Factor up to Q2 = 18.0 GeV2 by the Ratio Method. Uses SBSand the upgraded BB detector, the deuterium target.
4. SIDIS, E12-09-018 [5]: Measurement of the Semi-Inclusive π and KElectro-production in the DIS Regime from a Transversely Polarized3He target with the SBS&BB Spectrometers in Hall A. Uses the SBSand upgraded BB spectrometers.
5. GnE, E12-016 [6]: Measurement of the Neutron Electromagnetic Form
Factor Ratio GnE/G
nM at High Q2. Uses the upgraded BB detector and
neutron detector.
Jefferson Lab experiment E12-06-122 [2] proposes to measure the An1asymmetry via the reaction 3He(e, e′) using a longitudinally polarized beamand longitudinal or transverse polarized target. This will be the most precisemeasurement on the neutron in the DIS region up to x = 0.71 and covering2 < Q2 < 9 (GeV/c)2, where there is substantial room to constrain valencequark models of the neutron.
At the end of the SLAC DIS polarized target program, scientists had arelatively clear picture of the trend of Ap1 versus x in the DIS region as xbecomes large; see Ref. [7] where a summary of the SLAC data is included.Theoretical models generally predict a rise towards 1 as x→ 1 using simplepQCD models dominated by valence quarks. For the neutron, the picture
2
was less clear. Here the asymmetry was also expected to approach 1 asx → 1. However, the neutron data at that time (at lower x) showed anegative asymmetry with no hint of crossing zero and increasing towards 1as x increases.
Jefferson Lab experiment E99-117 [7] made the first definitive measure-ment of this quantity in the middle of the x range with enough statisticalprecision to clearly show An1 going from negative to positive as x increasesas shown in Figure 1. The only published DIS data above x = 0.6 weretwo points obtained by a subtraction of proton data from deuteron data [8],yielding uncertainties that are not useful for constraining the behavior atlarge x. It is worth noting that there have been several experiments thatmeasured An1 (gn2 ) at large x in the resonance region [9, 10, 11].
The interest in the DIS high x region comes from models that include avariety of mechanisms that are commonly used in pQCD calculations. Forexample, some of the models and fits assume hadron helicity conservation(HHC), but do not describe the data well. This is an indication that orbitalangular momentum may be playing a role not previously included. Also,by combining this data with world data for Ap1, the quark (and anti-quark)asymmetries ∆d/d and ∆u/u were also extracted. ∆u/u was very well fitwith several pQCD models. However, the neutron data showed dramaticdisagreement again with a model that includes HHC, while the up quarkdistribution showed good agreement with the same model. This discrepancyin the proton versus neutron model agreement is not well understood and isalso viewed as critical to understanding the role of quarks in the polarizationof the nucleon.
Experiment E12-06-122 will take advantage of the early beam delivery toHall A to measure An1 with beam energies of 6.6 and 8.8 GeV. This docu-ment presents the experimental and technical requirements for the GRINCHdetector. This includes results from simulation, and background studies,preliminary design work, PMT and magnetic shielding, prototype detector,budget and manpower.
It is interesting to note that measuring An1 was listed in the 2001 12 GeVwhite paper [12] as one of the motivating experiments behind the 12 GeVupgrade. To quote “The lack of data in the valence region is particularlyglaring in the case of the neutron, where there is no information at all onthe polarization asymmetry An1 for xBj ≥ 0.4. This is unfortunate, sincethere are rigorous QCD predictions for the behavior of A1 as xBj → 1 thathave never been tested.” Now, 11 years later, we have precisely measured
3
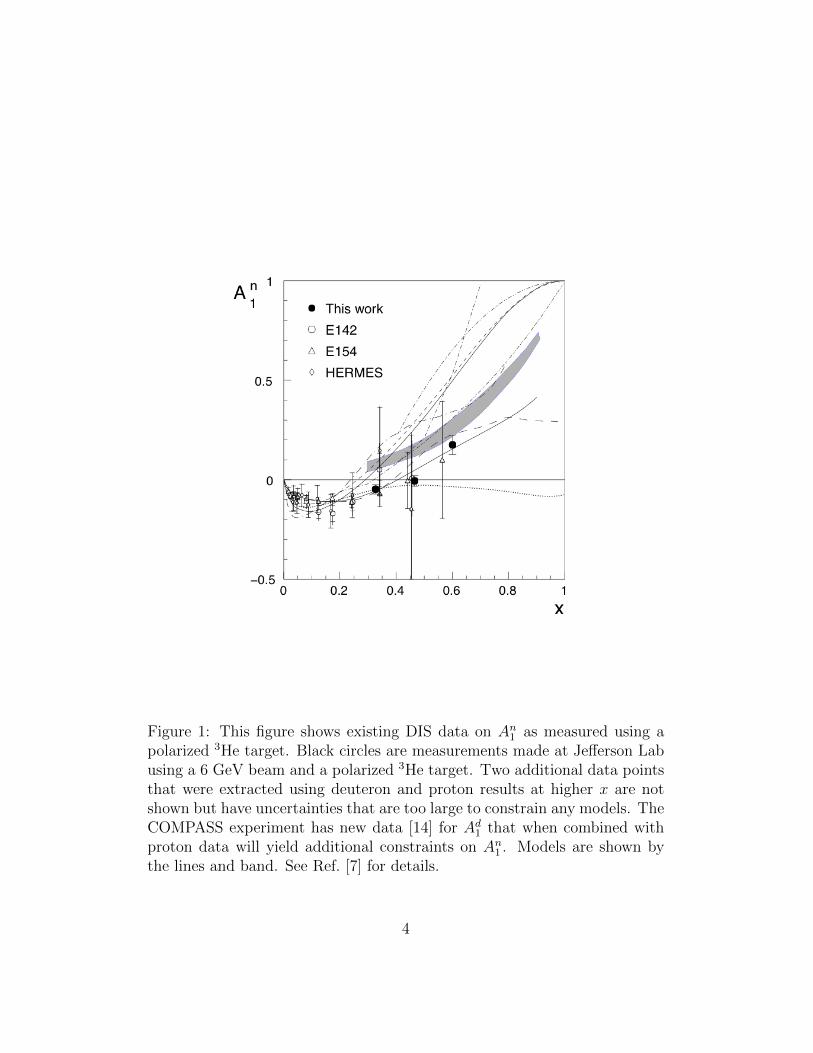
Figure 1: This figure shows existing DIS data on An1 as measured using apolarized 3He target. Black circles are measurements made at Jefferson Labusing a 6 GeV beam and a polarized 3He target. Two additional data pointsthat were extracted using deuteron and proton results at higher x are notshown but have uncertainties that are too large to constrain any models. TheCOMPASS experiment has new data [14] for Ad1 that when combined withproton data will yield additional constraints on An1 . Models are shown bythe lines and band. See Ref. [7] for details.
4

only up to x = 0.6 due to the 6 GeV maximum energy at CEBAF. The 201212 GeV white paper [13] has the following quote: “Thus the large-x regionprovides an ideal theater in which to explore the dynamics of the quarks ina nucleon. Moreover, an accurate knowledge of the distributions in the deepvalence region has an important impact on hadronic cross sections at thesmall values of x and large values of Q2 relevant for the LHC, and can affectsearches for new physics beyond the Standard Model.”
Finally we would like to provide a citation to the PAC36 report:“The case made at PAC30 was that the Hall A BigBite spectrometer withan added Cerenkov detector would not provide sufficient pion rejection toreach the highest x and Q2 points of the Hall C proposal. As the Hall Aexperiment would likely run near the start of 12 GeV data taking, it seemedsensible to simply wait and see how BigBite performed before making a finaldecision on the need for further data from Hall C.The updated proposals reviewed by PAC36 included numerous changes thatmade the two experiments much more similar. Perhaps most importantly,the beam time request for the Hall C was greatly reduced: from 79 to 36days, which is commensurate with the 23 days requested at Hall A. Bothexperiments propose to take two stripes in (x,Q2) that give each a Q2 leverarm up to similar values of x (0.6 for Hall A and 0.55 for Hall C). Both havehardware issues. At Hall C, the dramatic reduction in beam time was current.Significant R&D will be required to accomplish this technical goal. At HallA, a more modest target upgrade was invoked ( for BigBite was revealed tobe a RICH with a finely segmented array of over 1,000 phototubes. The PACwas pleased to see that manpower (the Averett group) was clearly identifiedfor this task, but even with the recycling of parts from the decommissionedHERMES RICH, this is an ambitious undertaking.” As will be shown laterwe obtained the DIRC’s PMTs and found them more suitable for the BigBiteGas Cherenkov counter.
2 Experimental Requirements
The focus of the experiment is to measure An1 with a statistical precision onthe level of 0.003 and similar or smaller systematics. The measured asym-metry Am, normalized by target and beam polarization, varies with PID cutand allows us to determine the electron and pion asymmetries, Ae and Aπ.We will use Aem to denote the measured asymmetry with PID cuts optimized
5
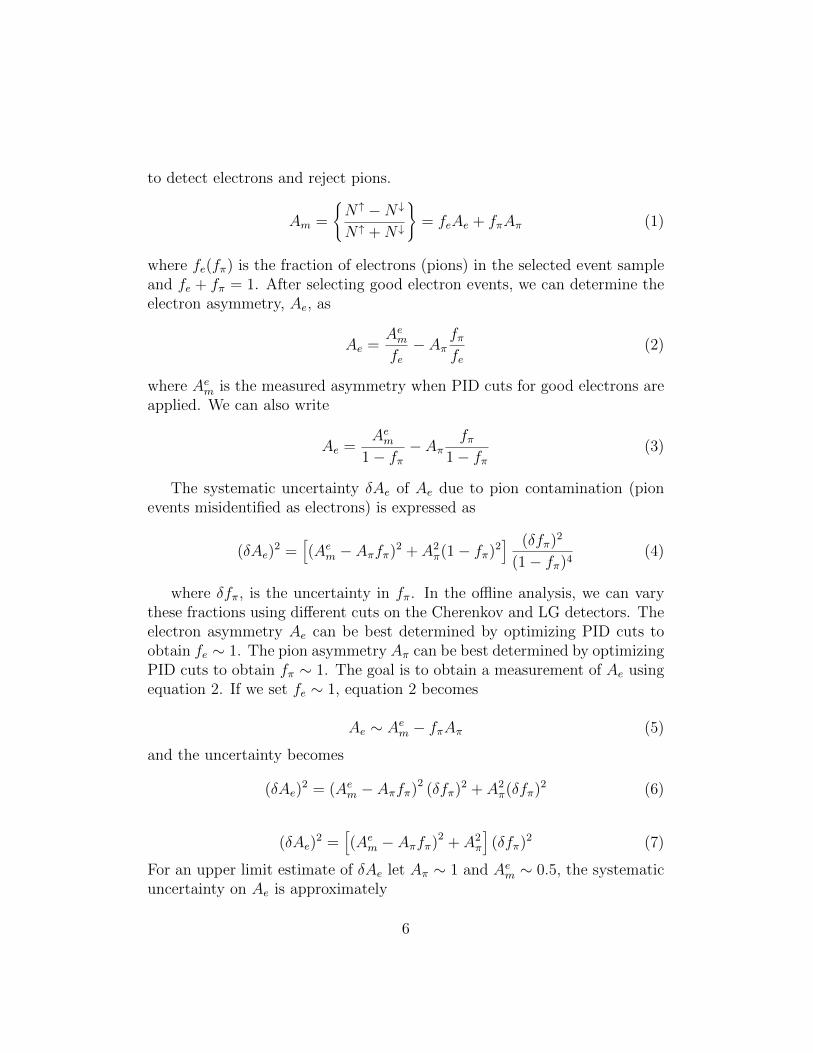
to detect electrons and reject pions.
Am =
{N↑ −N↓
N↑ +N↓
}= feAe + fπAπ (1)
where fe(fπ) is the fraction of electrons (pions) in the selected event sampleand fe + fπ = 1. After selecting good electron events, we can determine theelectron asymmetry, Ae, as
Ae =Aemfe− Aπ
fπfe
(2)
where Aem is the measured asymmetry when PID cuts for good electrons areapplied. We can also write
Ae =Aem
1− fπ− Aπ
fπ1− fπ
(3)
The systematic uncertainty δAe of Ae due to pion contamination (pionevents misidentified as electrons) is expressed as
(δAe)2 =
[(Aem − Aπfπ)2 + A2
π(1− fπ)2] (δfπ)2
(1− fπ)4(4)
where δfπ, is the uncertainty in fπ. In the offline analysis, we can varythese fractions using different cuts on the Cherenkov and LG detectors. Theelectron asymmetry Ae can be best determined by optimizing PID cuts toobtain fe ∼ 1. The pion asymmetry Aπ can be best determined by optimizingPID cuts to obtain fπ ∼ 1. The goal is to obtain a measurement of Ae usingequation 2. If we set fe ∼ 1, equation 2 becomes
Ae ∼ Aem − fπAπ (5)
and the uncertainty becomes
(δAe)2 = (Aem − Aπfπ)2 (δfπ)2 + A2
π(δfπ)2 (6)
(δAe)2 =
[(Aem − Aπfπ)2 + A2
π
](δfπ)2 (7)
For an upper limit estimate of δAe let Aπ ∼ 1 and Aem ∼ 0.5, the systematicuncertainty on Ae is approximately
6
δAe = 1.1δfπ ∼ δfπ (8)
If we require δAe ∼ 0.003, we then require δfπ ∼ 0.003. Let’s assume we candetermine δfπ to about 0.10 fπ, then we require fπ ∼ 0.03. This is ourgoal for the PID system. The total fraction of misidentified pions dependson the efficiency the lead-glass (LG) and Cherenkov (GC) detectors,
fπ =Nπη
LGπ ηGCπ
NπηLGπ ηGCπ +NeηLGe ηGCe(9)
where Nπ, Ne are the number of pions and electrons produced at the targetin the acceptance of BigBite. ηπ and ηe are the pion and electron detectionefficiencies. Assume ηe ∼ 1, then
fπ = R(πe)ηLGπ ηGCπ (10)
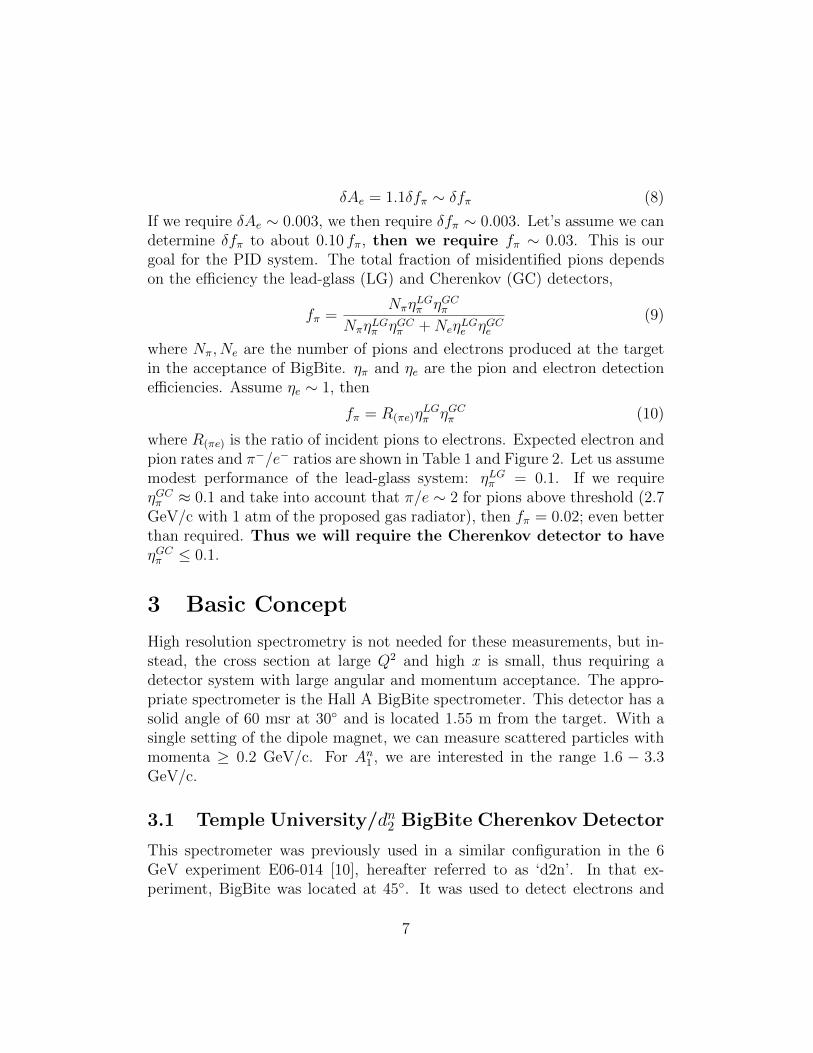
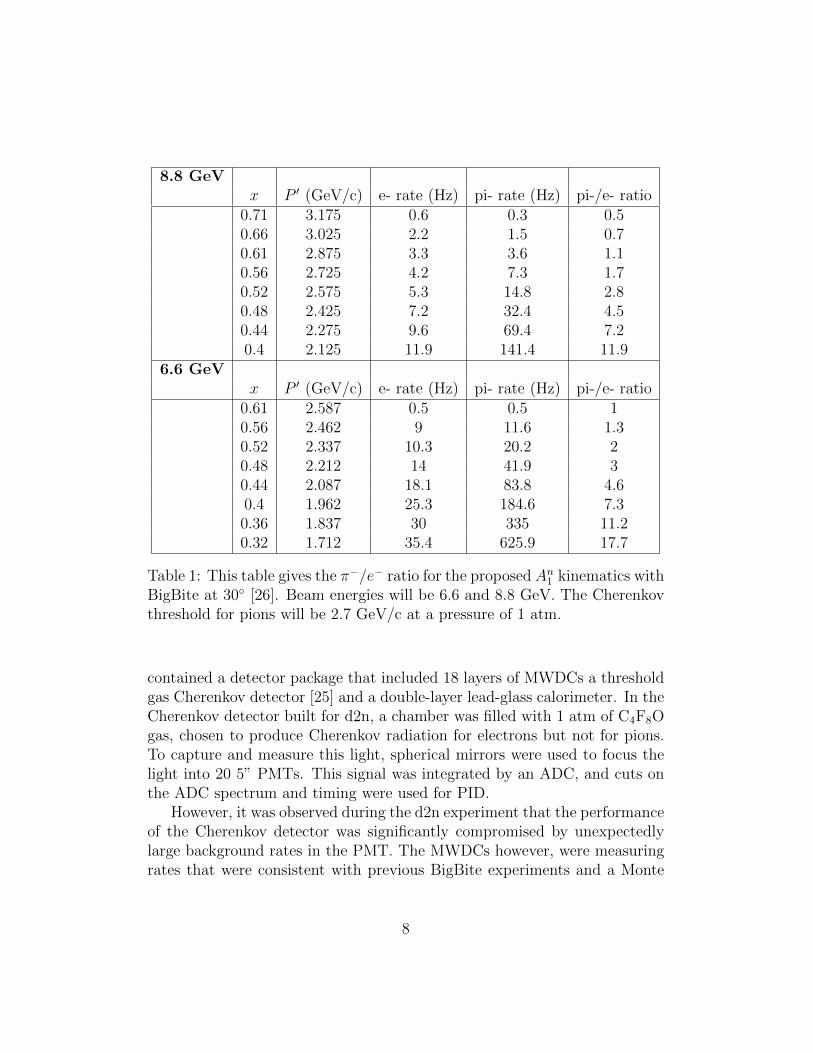
where R(πe) is the ratio of incident pions to electrons. Expected electron andpion rates and π−/e− ratios are shown in Table 1 and Figure 2. Let us assumemodest performance of the lead-glass system: ηLGπ = 0.1. If we requireηGCπ ≈ 0.1 and take into account that π/e ∼ 2 for pions above threshold (2.7GeV/c with 1 atm of the proposed gas radiator), then fπ = 0.02; even betterthan required. Thus we will require the Cherenkov detector to haveηGCπ ≤ 0.1.
3 Basic Concept
High resolution spectrometry is not needed for these measurements, but in-stead, the cross section at large Q2 and high x is small, thus requiring adetector system with large angular and momentum acceptance. The appro-priate spectrometer is the Hall A BigBite spectrometer. This detector has asolid angle of 60 msr at 30◦ and is located 1.55 m from the target. With asingle setting of the dipole magnet, we can measure scattered particles withmomenta ≥ 0.2 GeV/c. For An1 , we are interested in the range 1.6 − 3.3GeV/c.
3.1 Temple University/dn2 BigBite Cherenkov Detector
This spectrometer was previously used in a similar configuration in the 6GeV experiment E06-014 [10], hereafter referred to as ‘d2n’. In that ex-periment, BigBite was located at 45◦. It was used to detect electrons and
7
8.8 GeVx P ′ (GeV/c) e- rate (Hz) pi- rate (Hz) pi-/e- ratio
0.71 3.175 0.6 0.3 0.50.66 3.025 2.2 1.5 0.70.61 2.875 3.3 3.6 1.10.56 2.725 4.2 7.3 1.70.52 2.575 5.3 14.8 2.80.48 2.425 7.2 32.4 4.50.44 2.275 9.6 69.4 7.20.4 2.125 11.9 141.4 11.9
6.6 GeVx P ′ (GeV/c) e- rate (Hz) pi- rate (Hz) pi-/e- ratio
0.61 2.587 0.5 0.5 10.56 2.462 9 11.6 1.30.52 2.337 10.3 20.2 20.48 2.212 14 41.9 30.44 2.087 18.1 83.8 4.60.4 1.962 25.3 184.6 7.30.36 1.837 30 335 11.20.32 1.712 35.4 625.9 17.7
Table 1: This table gives the π−/e− ratio for the proposed An1 kinematics withBigBite at 30◦ [26]. Beam energies will be 6.6 and 8.8 GeV. The Cherenkovthreshold for pions will be 2.7 GeV/c at a pressure of 1 atm.
contained a detector package that included 18 layers of MWDCs a thresholdgas Cherenkov detector [25] and a double-layer lead-glass calorimeter. In theCherenkov detector built for d2n, a chamber was filled with 1 atm of C4F8Ogas, chosen to produce Cherenkov radiation for electrons but not for pions.To capture and measure this light, spherical mirrors were used to focus thelight into 20 5” PMTs. This signal was integrated by an ADC, and cuts onthe ADC spectrum and timing were used for PID.
However, it was observed during the d2n experiment that the performanceof the Cherenkov detector was significantly compromised by unexpectedlylarge background rates in the PMT. The MWDCs however, were measuringrates that were consistent with previous BigBite experiments and a Monte
8
'(GeV)eE
2.2 2.4 2.6 2.8 3 3.2
-/e-
π
0
2
4
6
8
10
12 / ndf 2χ 0.02854 / 6
Prob 1
Constant 0.07146± 9.322
Slope 0.03217± -3.224
/ ndf 2χ 0.02854 / 6
Prob 1
Constant 0.07146± 9.322
Slope 0.03217± -3.224
=8.8 GeVe
'(GeV) for Ee-/e- vs Eπ
/ ndf 2χ 0.02854 / 6
Prob 1
Constant 0.07146± 9.322
Slope 0.03217± -3.224
'(GeV)eE
1.8 2 2.2 2.4 2.6
-/e-
π0
2
4
6
8
10
12
14
16
18 / ndf 2χ 0.07709 / 6
Prob 1
Constant 0.06789± 8.927
Slope 0.03764± -3.538
/ ndf 2χ 0.07709 / 6
Prob 1
Constant 0.06789± 8.927
Slope 0.03764± -3.538
=6.6 GeVe
'(GeV) for Ee-/e- vs Eπ
/ ndf 2χ 0.07709 / 6
Prob 1
Constant 0.06789± 8.927
Slope 0.03764± -3.538
Figure 2: The π−/e ratio vs. particle energy.
Carlo simulation [22]. Through shielding studies, many attempts were madeto understand and eliminate the background. However, no significant drop inthe background rate was achieved during the d2n run. Later, offline analysisand simulation were able to advance understanding of this background asprimarily low energy particles produced in materials near the beam line.Those particles were producing Cherenkov light in the glass window of thePMT. The spherical focusing optics were necessarily complicated, using twomirrors and a Winston cone per PMT to focus light with a wide range ofincident angles (due to the large acceptance of BigBite). This, and thepresence of a significant magnetic field were the reasons for the small numberof photoelectrons.
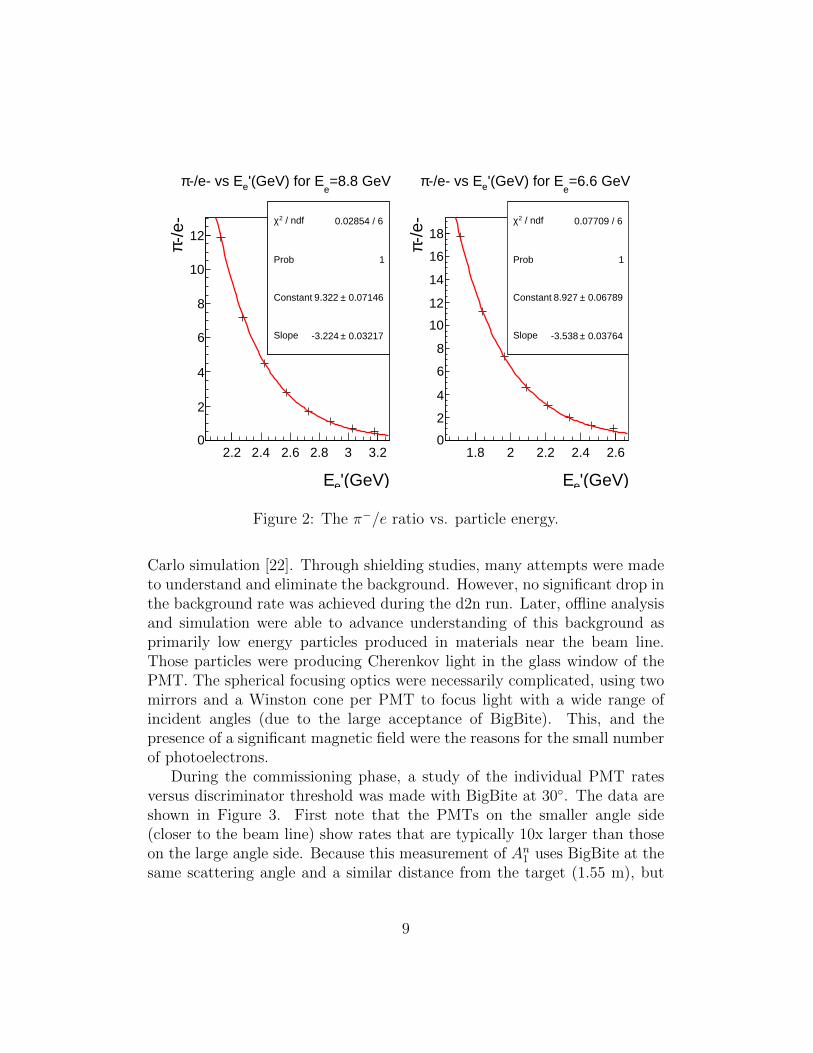
During the commissioning phase, a study of the individual PMT ratesversus discriminator threshold was made with BigBite at 30◦. The data areshown in Figure 3. First note that the PMTs on the smaller angle side(closer to the beam line) show rates that are typically 10x larger than thoseon the large angle side. Because this measurement of An1 uses BigBite at thesame scattering angle and a similar distance from the target (1.55 m), but
9
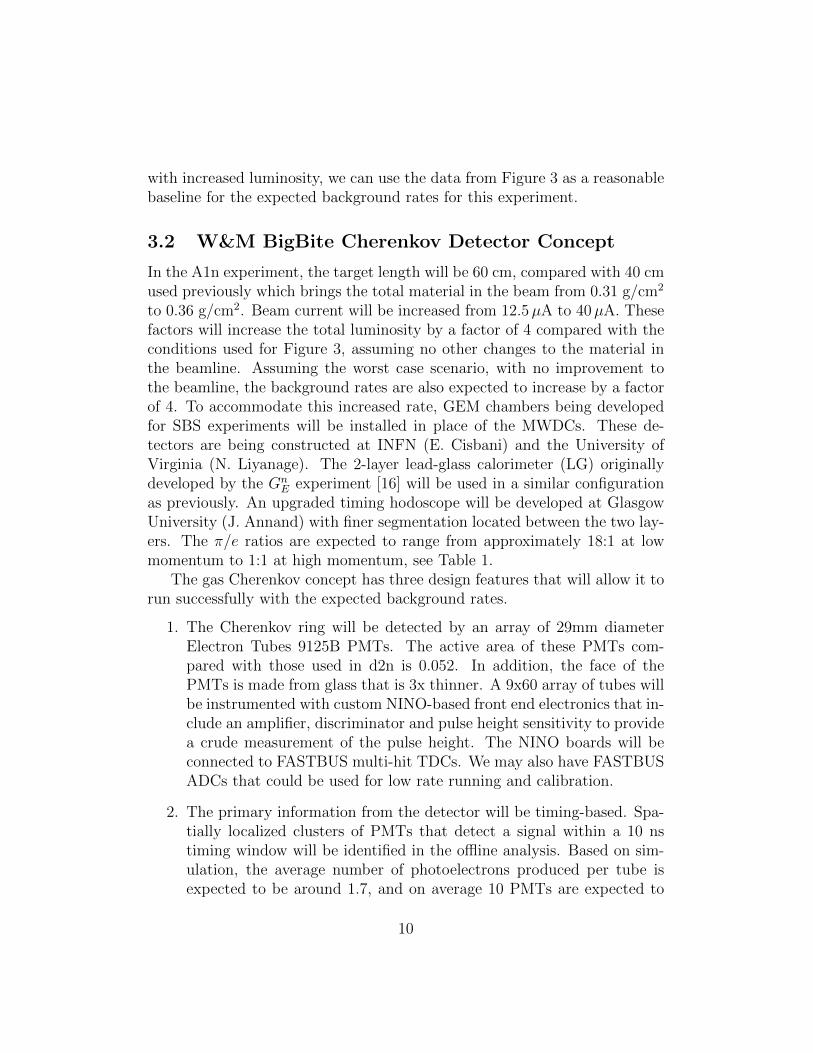
with increased luminosity, we can use the data from Figure 3 as a reasonablebaseline for the expected background rates for this experiment.
3.2 W&M BigBite Cherenkov Detector Concept
In the A1n experiment, the target length will be 60 cm, compared with 40 cmused previously which brings the total material in the beam from 0.31 g/cm2
to 0.36 g/cm2. Beam current will be increased from 12.5µA to 40µA. Thesefactors will increase the total luminosity by a factor of 4 compared with theconditions used for Figure 3, assuming no other changes to the material inthe beamline. Assuming the worst case scenario, with no improvement tothe beamline, the background rates are also expected to increase by a factorof 4. To accommodate this increased rate, GEM chambers being developedfor SBS experiments will be installed in place of the MWDCs. These de-tectors are being constructed at INFN (E. Cisbani) and the University ofVirginia (N. Liyanage). The 2-layer lead-glass calorimeter (LG) originallydeveloped by the Gn
E experiment [16] will be used in a similar configurationas previously. An upgraded timing hodoscope will be developed at GlasgowUniversity (J. Annand) with finer segmentation located between the two lay-ers. The π/e ratios are expected to range from approximately 18:1 at lowmomentum to 1:1 at high momentum, see Table 1.
The gas Cherenkov concept has three design features that will allow it torun successfully with the expected background rates.
1. The Cherenkov ring will be detected by an array of 29mm diameterElectron Tubes 9125B PMTs. The active area of these PMTs com-pared with those used in d2n is 0.052. In addition, the face of thePMTs is made from glass that is 3x thinner. A 9x60 array of tubes willbe instrumented with custom NINO-based front end electronics that in-clude an amplifier, discriminator and pulse height sensitivity to providea crude measurement of the pulse height. The NINO boards will beconnected to FASTBUS multi-hit TDCs. We may also have FASTBUSADCs that could be used for low rate running and calibration.
2. The primary information from the detector will be timing-based. Spa-tially localized clusters of PMTs that detect a signal within a 10 nstiming window will be identified in the offline analysis. Based on sim-ulation, the average number of photoelectrons produced per tube isexpected to be around 1.7, and on average 10 PMTs are expected to
10
0 100 200 300 400 500 600 700 800 900 1000Threshold [mV]
1
10
100
1000
10000
Rate
[kH
z]
PMT 1PMT 4PMT 5PMT 10PMT 11PMT 12PMT 13PMT 15PMT 16PMT 18PMT 19 (witness)PMT 20PMT 18 (Run 4305)PMT 20 (Run 4305)
PMT rates vs. threshold12 uA on 3He (Run 3573)
Figure 3: Rates versus discriminator threshold as measured in 5” PMTsduring the commissioning of the dn2 experiment [25]. The PMTs were locatedin the BigBite spectrometer Cherenkov detector at a scattering angle of 30◦.The single photoelectron threshold was approximately 50mV. PMTs 1-10 areon the small angle side nearer to the beam line. PMTs 11-20 are on the largeangle side.
11
“fire” (≥ 1 p.e.) for an electron event. The discriminator thresholdswill be set to approximately 20-30% of the single ph.e. peak to pro-vide good detection efficiency for single p.e. hits. Offline analysis willbe even less sensitive to background as the timing cut is reduced to< 10 ns.
3. The PMT array will be located on the large angle side of BigBite wherethe rates are 10x smaller. Mirrors could be made using a technique thathas been proven in the HRS Cherenkov detectors [17] and in the CLAS6spectrometer. A thin acrylic sheet will be formed using pressure andheat to achieve the desired curvature. This sheet will be coated withreflective aluminum and the back will be glued to honeycomb or low-density foam, followed by an outer shell. Because this detector is notbased on the concept of focusing a given ring onto a single PMT, it ismuch less sensitive to mirror geometry. Cylindrical mirrors instead ofthe usual spherical mirrors will be used, making fabrication easier andpotentially cheaper. Cylindrical mirrors are sufficient for transportingthe light to a PMT array.
4 Background and Rate Studies
4.1 Neutrons
There is widely held opinion that neutrons are a primary source of PMTrates because the borosilicate glass is a good absorber of thermal neutrons.We will explain below that because of the very low probability of a neutron-induced PMT firing, the boron mechanism for neutron-induced rates is notimportant.
One possible mechanism for background is absorption of neutrons in theglass window of the PMT. Neutrons are produced copiously in Hall A duringany of these types of scattering experiments. These neutrons are present allover the Hall and are able to penetrate into almost every detector, causing apotential source of background. Neutron production has been modeled andis well understood for Hall A and Hall C [21]. Note that for the conditionsof the d2n experiment, this simulation showed that the neutron inducedbackground rate in the 5” tubes was three orders of magnitude smaller thanthe total background rate measured during d2n. The expected neutron ratefor An1 should be the same as that calculated for d2n but scaled by total
12

luminosity. For additional information on neutron-induced rates in the PMTsrefer to Ref. [22].
Experimental studies [24] have demonstrated that neutron induced α par-ticles have a very short path in the glass and a negligible probability of in-ducing a signal in the PMT. The probability was found of 3 × 10⁻⁴ for theborosilicate window R7525-HA and 3×10⁻⁶ for the quartz window R7600U-200-M4 PMTs, respectively. Again note that the thickness of the glass win-dow of the 29 mm PMTs is 3x less than the 5” tubes. The contribution ofneutrons to the background by conversion in the PMT glass is expected tobe very small relative to the electromagnetic background discussed next.
4.2 Photons and Low Energy Electrons
The Monte Carlo simulations [22] have shown that a significant backgroundof low-energy electrons is present due to production from material near thebeam line and in the target scattering chamber which was not under vacuum.Bench tests [23] have shown that ∼ 1 MeV electrons from a 106Ru source willproduce Cherenkov radiation in the PMT glass which produces a single-photoelectron hit 30% of the time. Reasonable agreement between MC andthe measured rates in d2n was achieved. Using this information, we canestimate the background contribution from this process, which again will bereduced by a factor of 3 due to smaller glass window thickness. Anothersource of background is photons that are produced in BigBite or via line ofsight to the target or beam line. Both of these backgrounds can be reducedby careful simulation and installation of shielding, as described below.
4.3 An1 Background Rate Estimate
Figure 3 from d2n commissioning studies shows the measured rate in thePMTs from the Cherenkov detector [25]. The detector has 10 PMTs on thesmall angle side and 10 on the large angle side. It is clear that the largerangle side has a factor of approximately 10x lower rates. The first designrequirement for a new detector is to locate the PMTs at large angle. For thelarge angle side, the background intensity, extrapolated to zero threshold,ranges from 5.5-16 kHz/cm2.
In the An1 experiment, the target length will be 60 cm, compared with40 cm previously, which brings the total material in the beam from 0.31 g/cm2
to 0.36 g/cm2. Beam current will be increased from 11.5µA to 40µA. These
13
factors will increase the luminosity by a factor of 4 compared with d2n,assuming no other changes to the material in the beamline. Based on this,the background intensity will be 22-64 kHz/cm2. For our PMTs, with adiameter of 29 mm, the background rates could be 145-420 kHz per tube.Because the background rates in the d2n PMTs were mostly generated byCherenkov light generated in the glass face of the tube, the thinner glassface on the new tubes will reduce the rate by a factor of 3, giving final rateestimates of 48-140 kHz per tube.
The results from the d2n setup Monte Carlo show that adding 5” of leadshielding around the downstream beamline will reduce the rates by a factorof 3. This shielding is expected to generate additional neutron backgroundwhich is expected to have a negligible effect on background hits. This wasstudied with the beam line models [21]. For future SBS experiments, ithas been proposed to reduce the amount of material in the beamline to0.115 g/cm2, primarily by using an evacuated scattering chamber, whichwould reduce the rates by another factor of 3.
To quantify the susceptibility of the proposed detector to these back-ground rates, we will assume that background events are occurring in everyPMT in the array at a rate of 140 kHz, calculated above. The TDC gatewill be set to 50 ns, giving 4 total background hits in the entire array of 540tubes. If a Cherenkov event strikes the array, based on simulation, we willassume a good event will fire an average of 10 tubes. We found that a 25-tubearea needs to be searched for clusters in the offline analysis. When a timingwindow of 10 ns is used to select good events in the cluster, the probabilitythat one of these (25) PMTs will detect a background event in time with theCherenkov event is 4%. This assumes that the discriminator thresholds areoptimized to collect single p.e. events. Note that a cut of ±5 ns was usedin the analysis of data from the prototype tests in Hall A, described below.Tracking information will be used to locate a search area and isolate clusters.The expected misidentification of clusters is expected to be negligible.
5 Simulation and Design
5.1 GEANT4 Simulation and Design Parameters
The detector must fit within a 90 cm keep-out zone between the GEM cham-bers in the new BB detector frame (not yet built). A detector vessel with an
14
average active path length of 66 cm can be installed. As mentioned previ-ously, the PMTs will be arranged in a tall, narrow array located on the largeangle side of the BB spectrometer. It will be attached to the gas vessel suchthat 4 cylindrical mirrors with radius of curvature 1.3 meters can be usedto transport all Cherenkov light onto the array. The detector will be filledwith 1-1.5 atm (absolute) of the “heavy gas” C4F8O with index of refractionn=1.00135 (at 1 atm). This will give a pion threshold of 2.7 − 2.2 GeV/c.Simulation and optimization of the proposed design has been completed us-ing GEANT4 to optimize the geometry of the vessel and the detector array.The optimization was focused on producing the largest possible electron effi-ciency and pion efficiency. This translates to generating the largest numberof photo-electrons per tube per event with the smallest possible Cherenkovring diameter. The selected geometry will provide an average of 1.7 photo-electrons per tube, and an average of 10 tubes will fire for an event. Notethat at this time the simulation does not include any entrance window forthe detector. The inclusion of the window will increase the production ofδrays and misidentified pions. This will be included in the full simulationonce the final geometry is decided.
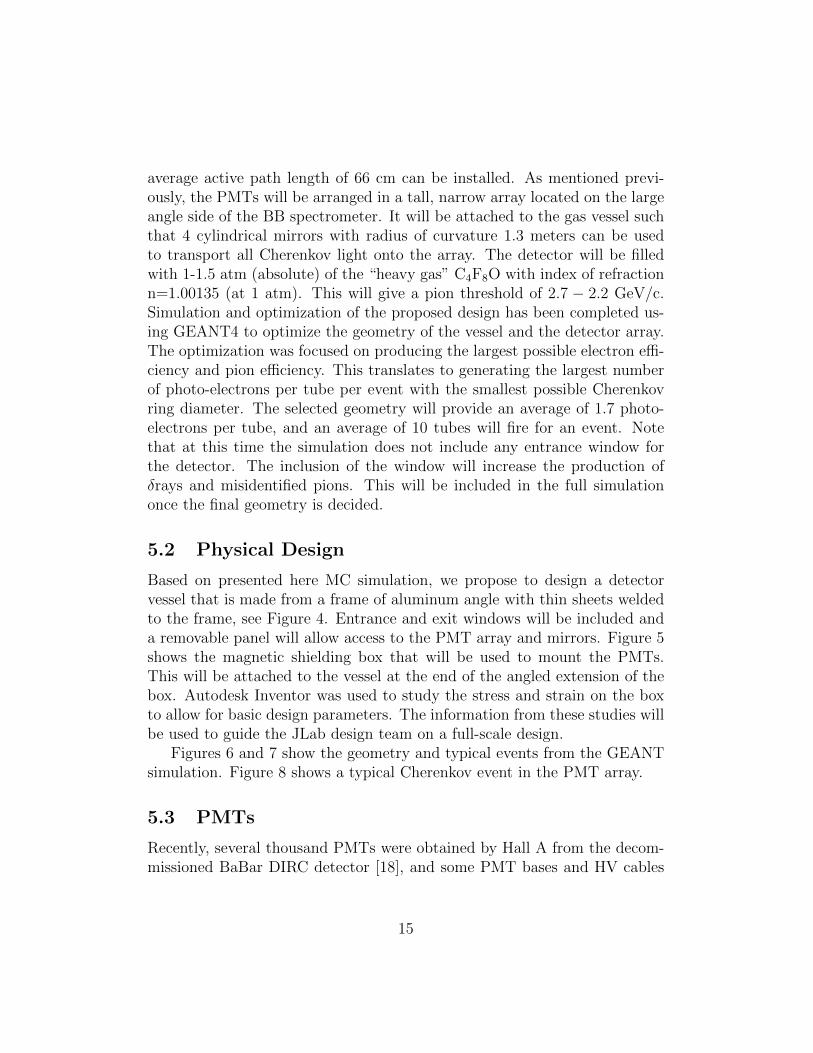
5.2 Physical Design
Based on presented here MC simulation, we propose to design a detectorvessel that is made from a frame of aluminum angle with thin sheets weldedto the frame, see Figure 4. Entrance and exit windows will be included anda removable panel will allow access to the PMT array and mirrors. Figure 5shows the magnetic shielding box that will be used to mount the PMTs.This will be attached to the vessel at the end of the angled extension of thebox. Autodesk Inventor was used to study the stress and strain on the boxto allow for basic design parameters. The information from these studies willbe used to guide the JLab design team on a full-scale design.
Figures 6 and 7 show the geometry and typical events from the GEANTsimulation. Figure 8 shows a typical Cherenkov event in the PMT array.
5.3 PMTs
Recently, several thousand PMTs were obtained by Hall A from the decom-missioned BaBar DIRC detector [18], and some PMT bases and HV cables
15
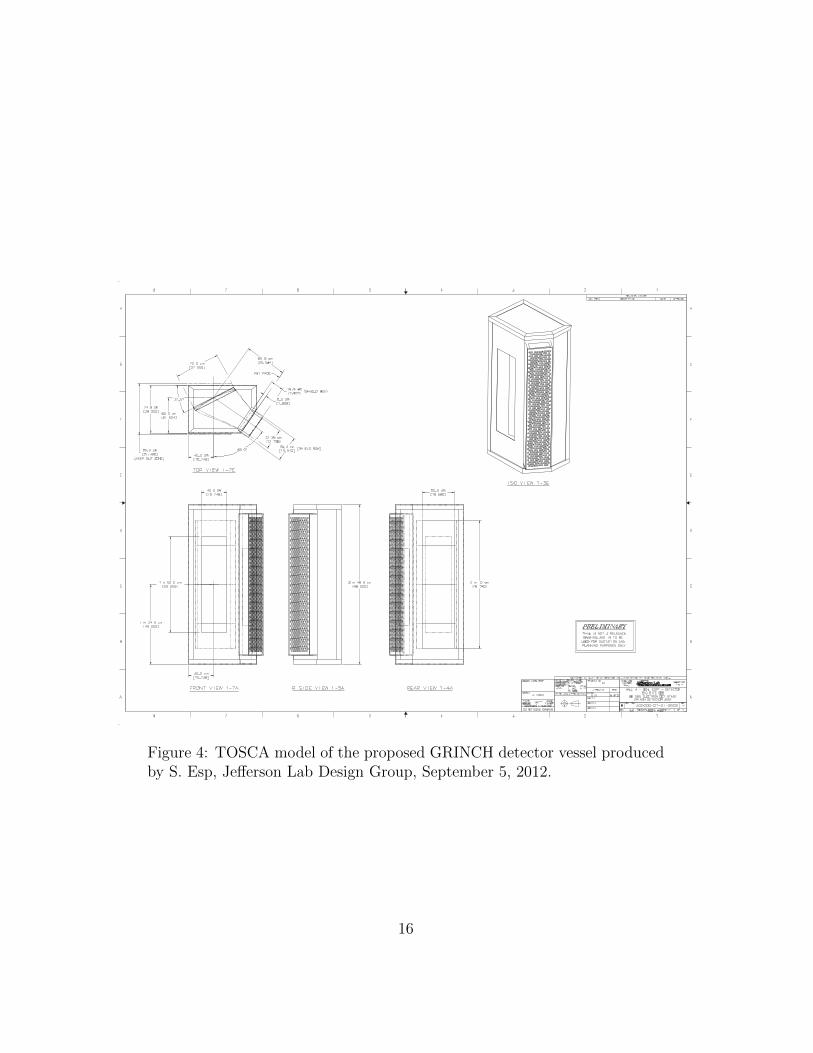
Figure 4: TOSCA model of the proposed GRINCH detector vessel producedby S. Esp, Jefferson Lab Design Group, September 5, 2012.
16
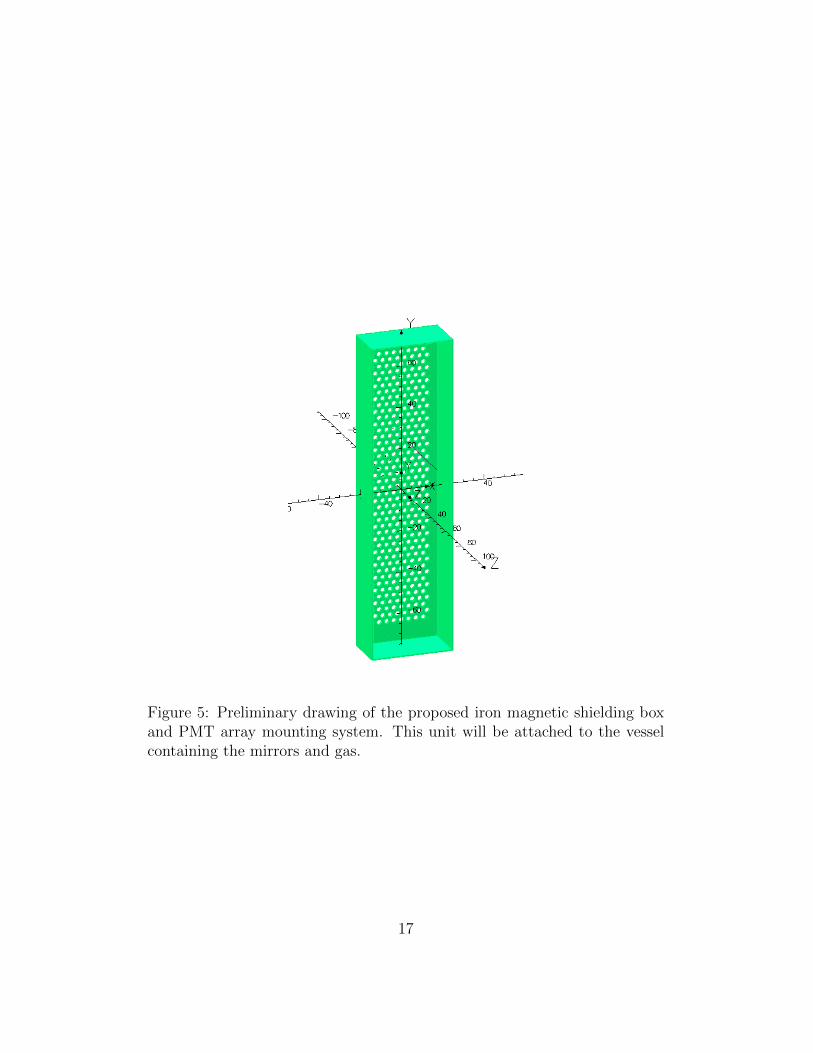
Figure 5: Preliminary drawing of the proposed iron magnetic shielding boxand PMT array mounting system. This unit will be attached to the vesselcontaining the mirrors and gas.
17
Figure 6: Side view of GRINCH as simulated in GEANT4. Beginning at theleft are the target cell (blue), BigBite magnet and second GEM chamber.The light blue box contains the mirrors and PMT array. The green raysare Cherenkov radiation. The yellow rings on the PMT array are Cherenkovrings detected in the array.
18
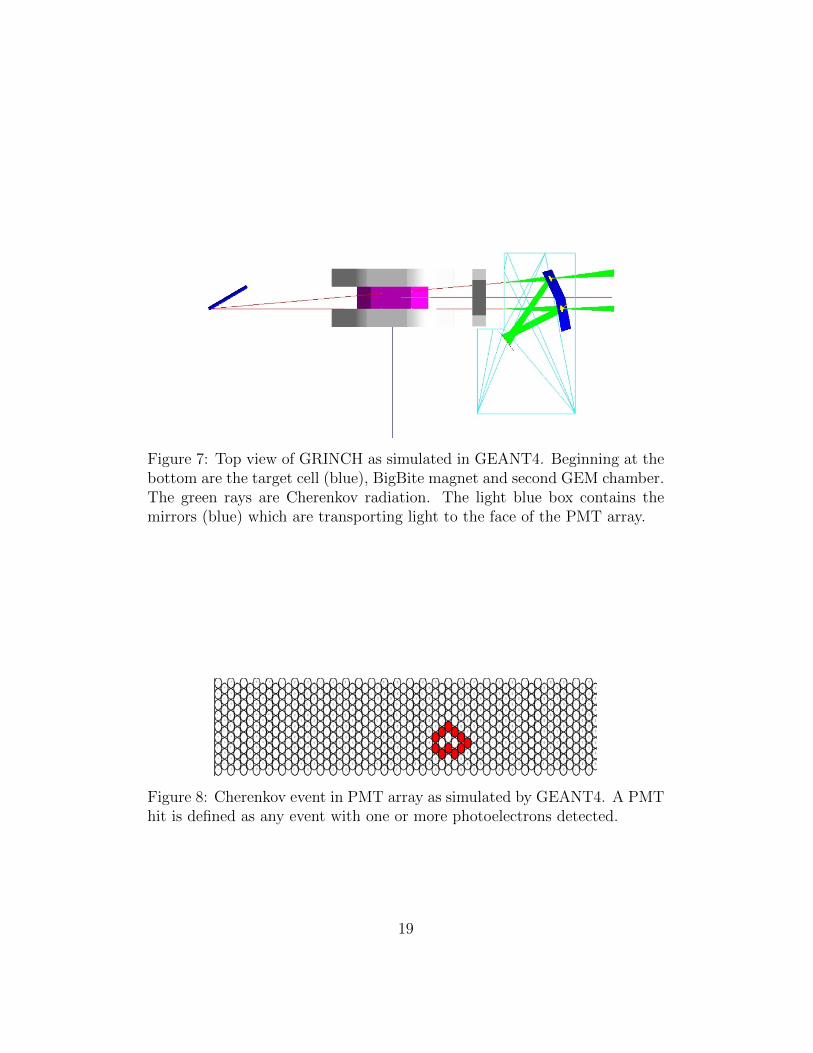
Figure 7: Top view of GRINCH as simulated in GEANT4. Beginning at thebottom are the target cell (blue), BigBite magnet and second GEM chamber.The green rays are Cherenkov radiation. The light blue box contains themirrors (blue) which are transporting light to the face of the PMT array.
Figure 8: Cherenkov event in PMT array as simulated by GEANT4. A PMThit is defined as any event with one or more photoelectrons detected.
19
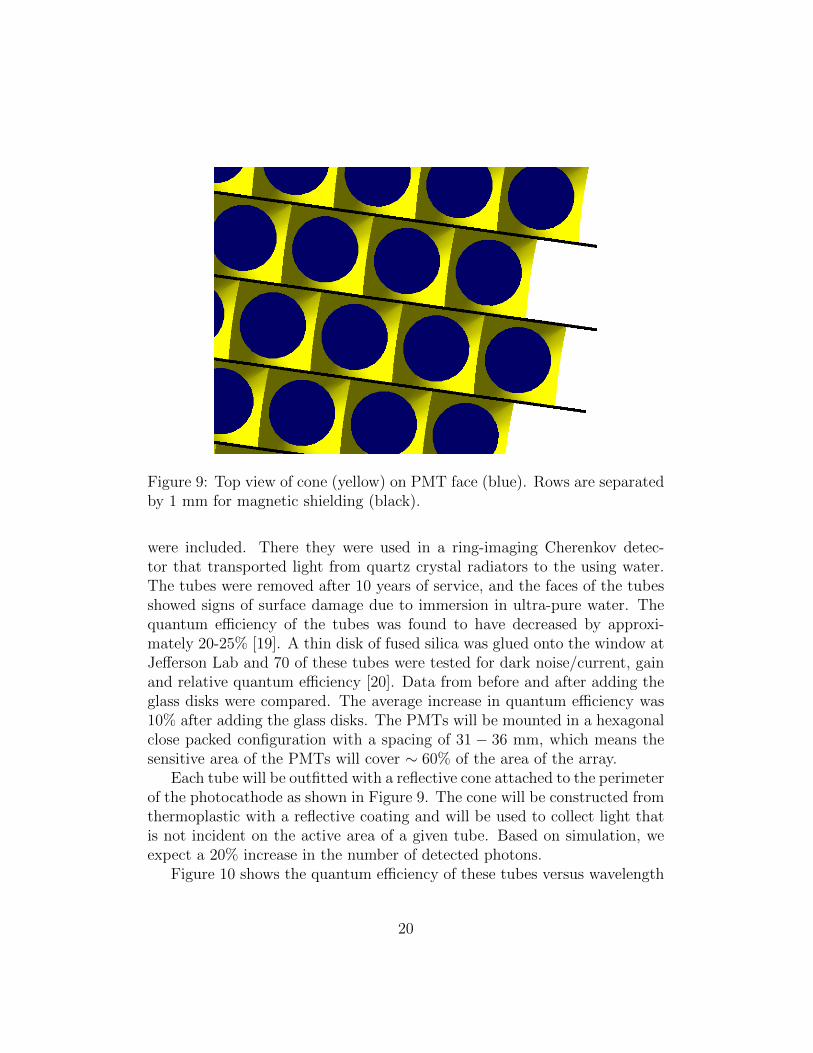
Figure 9: Top view of cone (yellow) on PMT face (blue). Rows are separatedby 1 mm for magnetic shielding (black).
were included. There they were used in a ring-imaging Cherenkov detec-tor that transported light from quartz crystal radiators to the using water.The tubes were removed after 10 years of service, and the faces of the tubesshowed signs of surface damage due to immersion in ultra-pure water. Thequantum efficiency of the tubes was found to have decreased by approxi-mately 20-25% [19]. A thin disk of fused silica was glued onto the window atJefferson Lab and 70 of these tubes were tested for dark noise/current, gainand relative quantum efficiency [20]. Data from before and after adding theglass disks were compared. The average increase in quantum efficiency was10% after adding the glass disks. The PMTs will be mounted in a hexagonalclose packed configuration with a spacing of 31 − 36 mm, which means thesensitive area of the PMTs will cover ∼ 60% of the area of the array.
Each tube will be outfitted with a reflective cone attached to the perimeterof the photocathode as shown in Figure 9. The cone will be constructed fromthermoplastic with a reflective coating and will be used to collect light thatis not incident on the active area of a given tube. Based on simulation, weexpect a 20% increase in the number of detected photons.
Figure 10 shows the quantum efficiency of these tubes versus wavelength
20
(nm)λPhoton wavelength 250 300 350 400 450 500 550 600 650
Qua
ntum
Effi
cien
cy
0
0.05
0.1
0.15
0.2
0.25
/ ndf 2χ 0.000400459 / 5Prob 1p0 23.3418± -74.2442 p1 0.333001± 0.968278 p2 0.00194737± -0.00521893 p3 5.97739e-06± 1.49183e-05 p4 1.0161e-08± -2.38068e-08 p5 9.07424e-12± 2.00603e-11 p6 3.32786e-15± -6.96098e-15
/ ndf 2χ 0.000400459 / 5Prob 1p0 23.3418± -74.2442 p1 0.333001± 0.968278 p2 0.00194737± -0.00521893 p3 5.97739e-06± 1.49183e-05 p4 1.0161e-08± -2.38068e-08 p5 9.07424e-12± 2.00603e-11 p6 3.32786e-15± -6.96098e-15
(nm) (275nm ~ 635nm)λQuantum Efficiency vs / ndf 2χ 0.000400459 / 5
Prob 1p0 23.3418± -74.2442 p1 0.333001± 0.968278 p2 0.00194737± -0.00521893 p3 5.97739e-06± 1.49183e-05 p4 1.0161e-08± -2.38068e-08 p5 9.07424e-12± 2.00603e-11 p6 3.32786e-15± -6.96098e-15
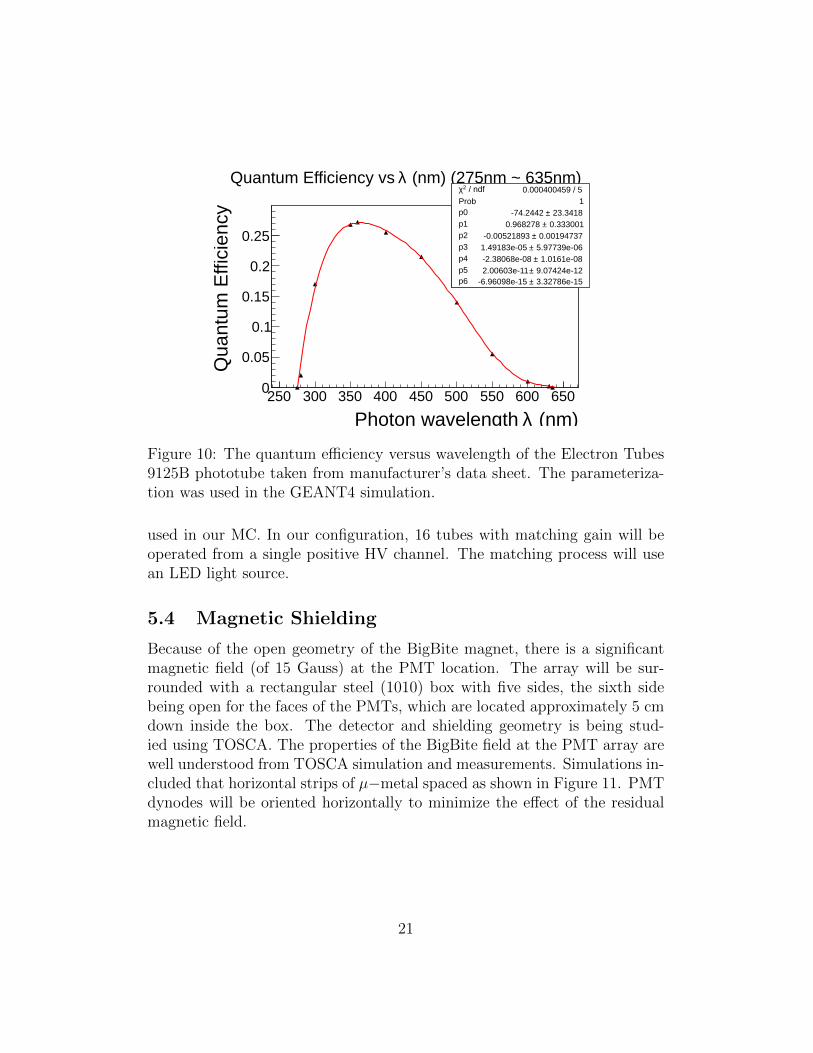
Figure 10: The quantum efficiency versus wavelength of the Electron Tubes9125B phototube taken from manufacturer’s data sheet. The parameteriza-tion was used in the GEANT4 simulation.
used in our MC. In our configuration, 16 tubes with matching gain will beoperated from a single positive HV channel. The matching process will usean LED light source.
5.4 Magnetic Shielding
Because of the open geometry of the BigBite magnet, there is a significantmagnetic field (of 15 Gauss) at the PMT location. The array will be sur-rounded with a rectangular steel (1010) box with five sides, the sixth sidebeing open for the faces of the PMTs, which are located approximately 5 cmdown inside the box. The detector and shielding geometry is being stud-ied using TOSCA. The properties of the BigBite field at the PMT array arewell understood from TOSCA simulation and measurements. Simulations in-cluded that horizontal strips of µ−metal spaced as shown in Figure 11. PMTdynodes will be oriented horizontally to minimize the effect of the residualmagnetic field.
21
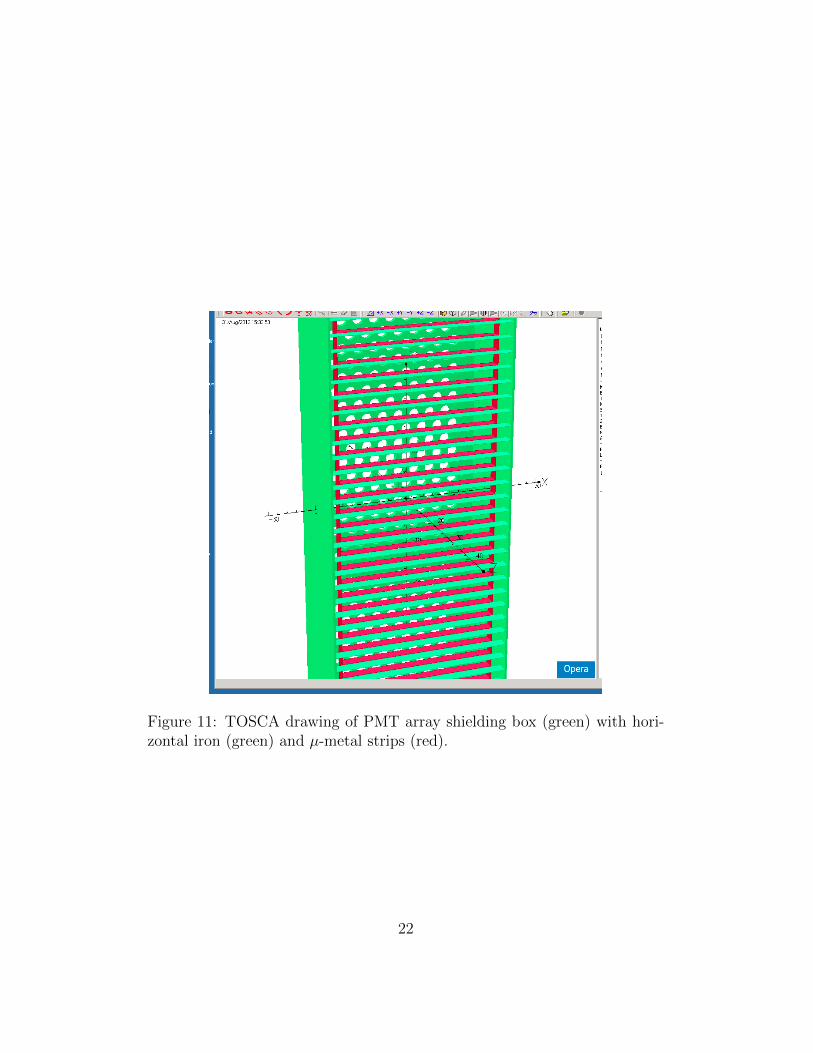
Figure 11: TOSCA drawing of PMT array shielding box (green) with hori-zontal iron (green) and µ-metal strips (red).
22
5.5 Pion Detection Efficiency
In the MC simulation, the electron detection efficiency ηe is defined as theprobability that an incident electron will be detected as a good electronevent. The pion detection efficiency ηπ is defined as the probability that anincident pion will be detected as a good electron event. The detector mustbe optimized to keep fπ = 0.03 or lower and fe ≈ 1.
At pion momenta below the Cherenkov threshold, ηπ is limited by thedelta electron knockout process in the gas, which has probability of 2%. Thetotal number of p.e.’s in that process has a wide distribution due to variationof the origin of the delta-electron along the pion track through the gas.
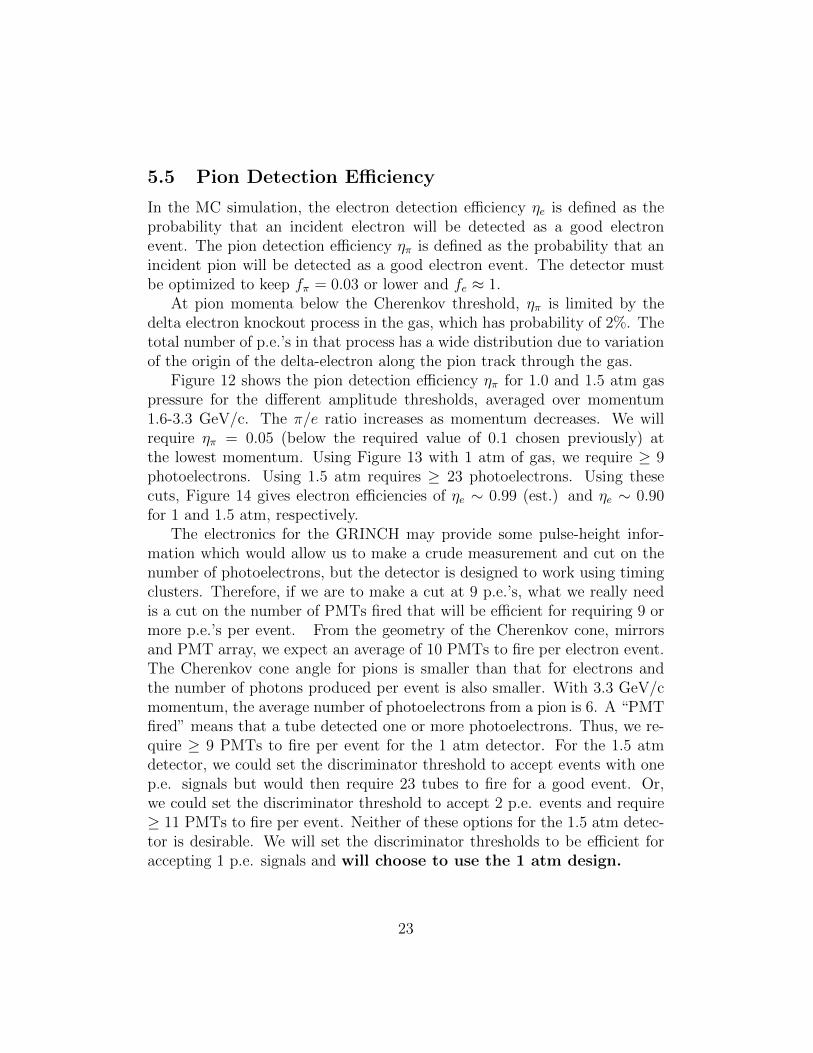
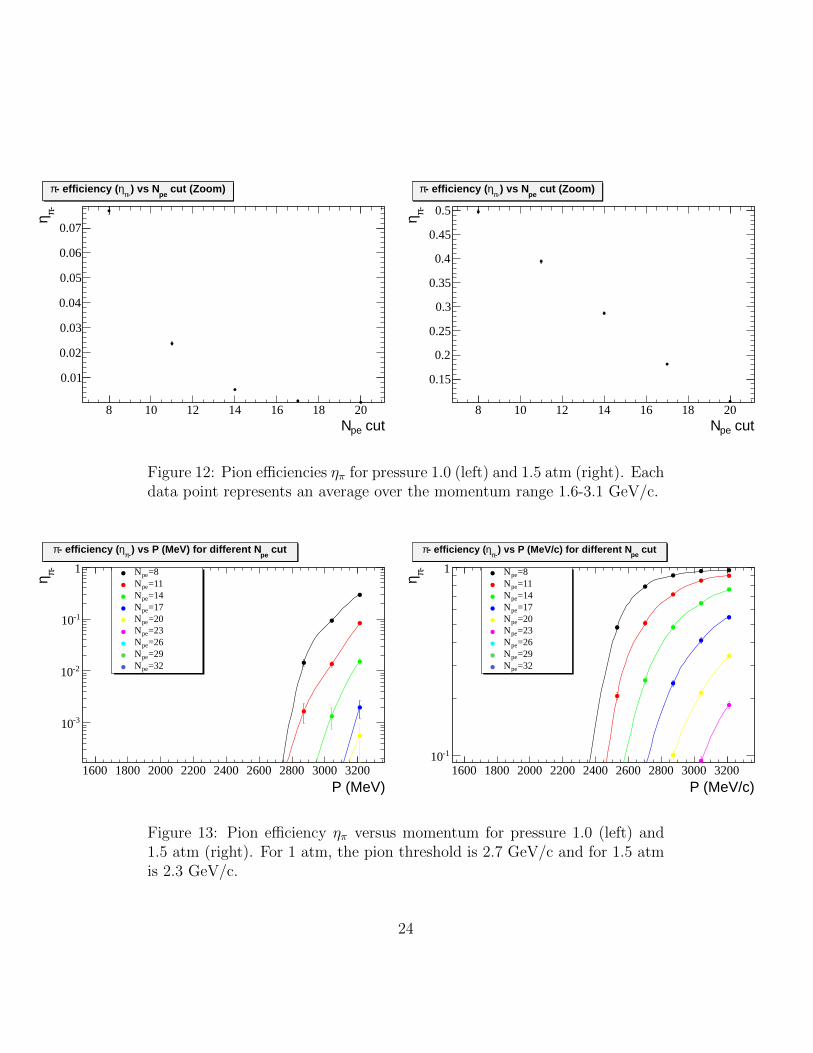
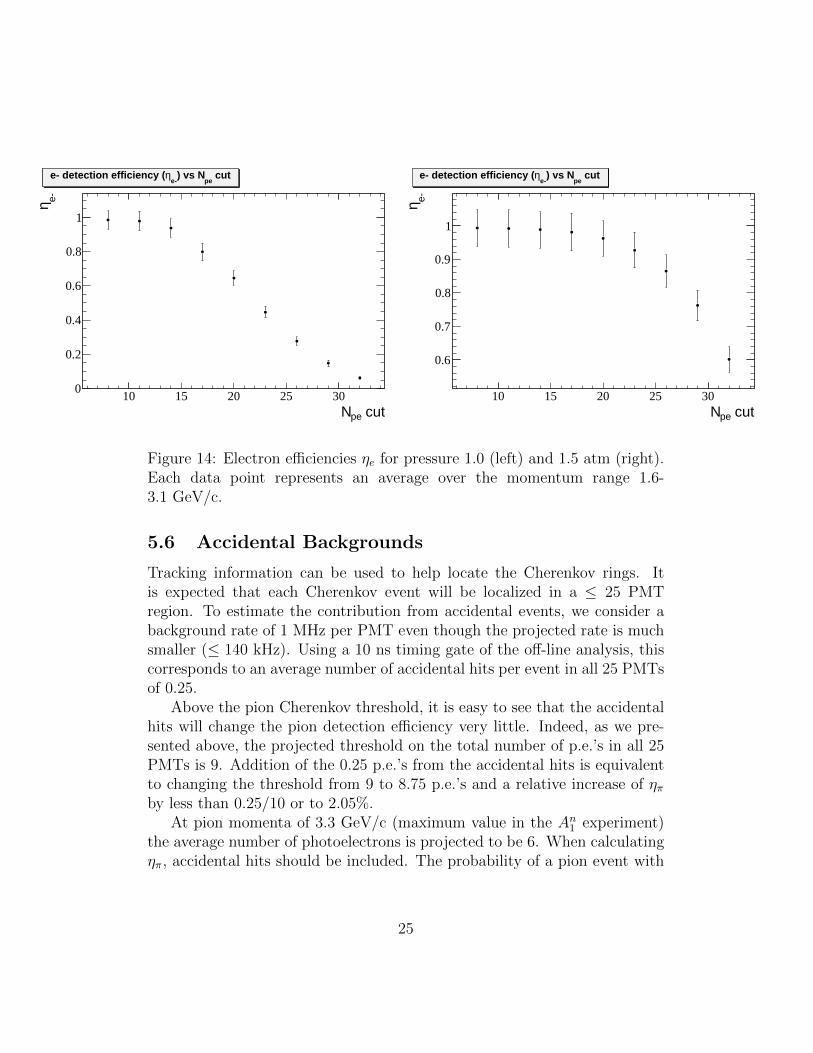
Figure 12 shows the pion detection efficiency ηπ for 1.0 and 1.5 atm gaspressure for the different amplitude thresholds, averaged over momentum1.6-3.3 GeV/c. The π/e ratio increases as momentum decreases. We willrequire ηπ = 0.05 (below the required value of 0.1 chosen previously) atthe lowest momentum. Using Figure 13 with 1 atm of gas, we require ≥ 9photoelectrons. Using 1.5 atm requires ≥ 23 photoelectrons. Using thesecuts, Figure 14 gives electron efficiencies of ηe ∼ 0.99 (est.) and ηe ∼ 0.90for 1 and 1.5 atm, respectively.
The electronics for the GRINCH may provide some pulse-height infor-mation which would allow us to make a crude measurement and cut on thenumber of photoelectrons, but the detector is designed to work using timingclusters. Therefore, if we are to make a cut at 9 p.e.’s, what we really needis a cut on the number of PMTs fired that will be efficient for requiring 9 ormore p.e.’s per event. From the geometry of the Cherenkov cone, mirrorsand PMT array, we expect an average of 10 PMTs to fire per electron event.The Cherenkov cone angle for pions is smaller than that for electrons andthe number of photons produced per event is also smaller. With 3.3 GeV/cmomentum, the average number of photoelectrons from a pion is 6. A “PMTfired” means that a tube detected one or more photoelectrons. Thus, we re-quire ≥ 9 PMTs to fire per event for the 1 atm detector. For the 1.5 atmdetector, we could set the discriminator threshold to accept events with onep.e. signals but would then require 23 tubes to fire for a good event. Or,we could set the discriminator threshold to accept 2 p.e. events and require≥ 11 PMTs to fire per event. Neither of these options for the 1.5 atm detec-tor is desirable. We will set the discriminator thresholds to be efficient foraccepting 1 p.e. signals and will choose to use the 1 atm design.
23
cutpeN8 10 12 14 16 18 20
-πη
0.01
0.02
0.03
0.04
0.05
0.06
0.07
cut (Zoom)pe
) vs N-πη- efficiency (π cut (Zoom)
pe) vs N
-πη- efficiency (π
cutpeN8 10 12 14 16 18 20
-πη
0.15
0.2
0.25
0.3
0.35
0.4
0.45
0.5
cut (Zoom)pe
) vs N-πη- efficiency (π cut (Zoom)
pe) vs N
-πη- efficiency (π
Figure 12: Pion efficiencies ηπ for pressure 1.0 (left) and 1.5 atm (right). Eachdata point represents an average over the momentum range 1.6-3.1 GeV/c.
P (MeV)1600 1800 2000 2200 2400 2600 2800 3000 3200
-πη
-310
-210
-110
1
cutpe
) vs P (MeV) for different N-π
η- efficiency (π
=8peN=11peN=14peN=17peN=20peN=23peN=26peN=29peN=32peN
cutpe
) vs P (MeV) for different N-π
η- efficiency (π
P (MeV/c)1600 1800 2000 2200 2400 2600 2800 3000 3200
-πη
-110
1
cutpe
) vs P (MeV/c) for different N-π
η- efficiency (π
=8peN=11peN=14peN=17peN=20peN=23peN=26peN=29peN=32peN
cutpe
) vs P (MeV/c) for different N-π
η- efficiency (π
Figure 13: Pion efficiency ηπ versus momentum for pressure 1.0 (left) and1.5 atm (right). For 1 atm, the pion threshold is 2.7 GeV/c and for 1.5 atmis 2.3 GeV/c.
24
cutpeN10 15 20 25 30
e-η
0
0.2
0.4
0.6
0.8
1
cutpe
) vs Ne-
ηe- detection efficiency ( cutpe
) vs Ne-
ηe- detection efficiency (
cutpeN10 15 20 25 30
e-η
0.6
0.7
0.8
0.9
1
cutpe
) vs Ne-
ηe- detection efficiency ( cutpe
) vs Ne-
ηe- detection efficiency (
Figure 14: Electron efficiencies ηe for pressure 1.0 (left) and 1.5 atm (right).Each data point represents an average over the momentum range 1.6-3.1 GeV/c.
5.6 Accidental Backgrounds
Tracking information can be used to help locate the Cherenkov rings. Itis expected that each Cherenkov event will be localized in a ≤ 25 PMTregion. To estimate the contribution from accidental events, we consider abackground rate of 1 MHz per PMT even though the projected rate is muchsmaller (≤ 140 kHz). Using a 10 ns timing gate of the off-line analysis, thiscorresponds to an average number of accidental hits per event in all 25 PMTsof 0.25.
Above the pion Cherenkov threshold, it is easy to see that the accidentalhits will change the pion detection efficiency very little. Indeed, as we pre-sented above, the projected threshold on the total number of p.e.’s in all 25PMTs is 9. Addition of the 0.25 p.e.’s from the accidental hits is equivalentto changing the threshold from 9 to 8.75 p.e.’s and a relative increase of ηπby less than 0.25/10 or to 2.05%.
At pion momenta of 3.3 GeV/c (maximum value in the An1 experiment)the average number of photoelectrons is projected to be 6. When calculatingηπ, accidental hits should be included. The probability of a pion event with
25
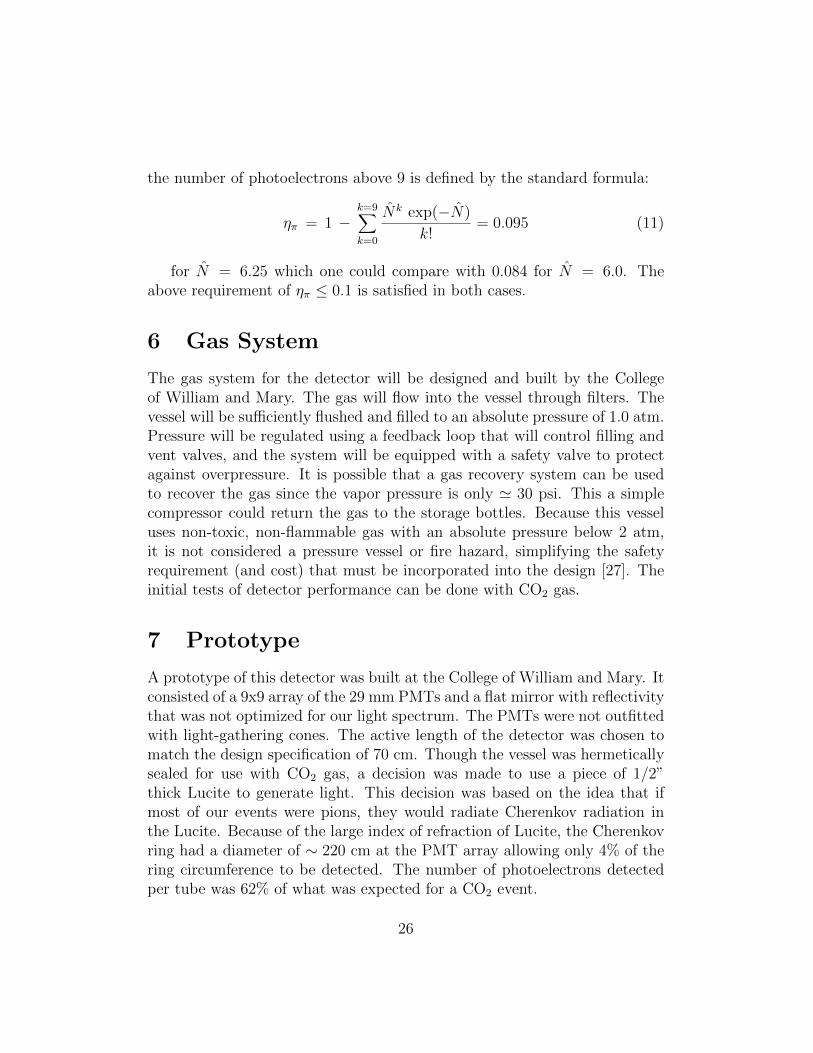
the number of photoelectrons above 9 is defined by the standard formula:
ηπ = 1 −k=9∑k=0
N̂k exp(−N̂)
k!= 0.095 (11)
for N̂ = 6.25 which one could compare with 0.084 for N̂ = 6.0. Theabove requirement of ηπ ≤ 0.1 is satisfied in both cases.
6 Gas System
The gas system for the detector will be designed and built by the Collegeof William and Mary. The gas will flow into the vessel through filters. Thevessel will be sufficiently flushed and filled to an absolute pressure of 1.0 atm.Pressure will be regulated using a feedback loop that will control filling andvent valves, and the system will be equipped with a safety valve to protectagainst overpressure. It is possible that a gas recovery system can be usedto recover the gas since the vapor pressure is only ' 30 psi. This a simplecompressor could return the gas to the storage bottles. Because this vesseluses non-toxic, non-flammable gas with an absolute pressure below 2 atm,it is not considered a pressure vessel or fire hazard, simplifying the safetyrequirement (and cost) that must be incorporated into the design [27]. Theinitial tests of detector performance can be done with CO2 gas.
7 Prototype
A prototype of this detector was built at the College of William and Mary. Itconsisted of a 9x9 array of the 29 mm PMTs and a flat mirror with reflectivitythat was not optimized for our light spectrum. The PMTs were not outfittedwith light-gathering cones. The active length of the detector was chosen tomatch the design specification of 70 cm. Though the vessel was hermeticallysealed for use with CO2 gas, a decision was made to use a piece of 1/2”thick Lucite to generate light. This decision was based on the idea that ifmost of our events were pions, they would radiate Cherenkov radiation inthe Lucite. Because of the large index of refraction of Lucite, the Cherenkovring had a diameter of ∼ 220 cm at the PMT array allowing only 4% of thering circumference to be detected. The number of photoelectrons detectedper tube was 62% of what was expected for a CO2 event.
26

The detector was located on a platform at beam height on the beamright side at about 45-50 degree scattering angle and 5 meters from the tar-get. Scintillator trigger paddles were installed before and after the Cherenkovprototype and a lead glass block was used as the final element for particledetection. Triggers were generated by a coincidence in the scintillator de-tectors. The DAQ system consisted of NIM amplifiers, discriminators andlevel convertors. Signals were measured using VME ADC, TDC and scalermodules that were read out using CODA. For each trigger, the TDC andADC information was read for each tube. The discriminator threshold wasset to accept events below the single photo-electron peak.
Because this test was parasitic, we were subjected to many different run-ning conditions including different beam energies, beam tune quality, and ori-entation of the 2.5-5 Tesla target field. Particles produced in the target hadto traverse an approximately 1” thick aluminum scattering chamber beforeour detector. Thus, even with a relatively clean beam tune and experimentalconfiguration, the variation in rate, particle type, and energy spectrum wasnot known and was expected to contain relatively few good electron events.On the other hand, it was a good test for our system to run in differentbackground configurations.
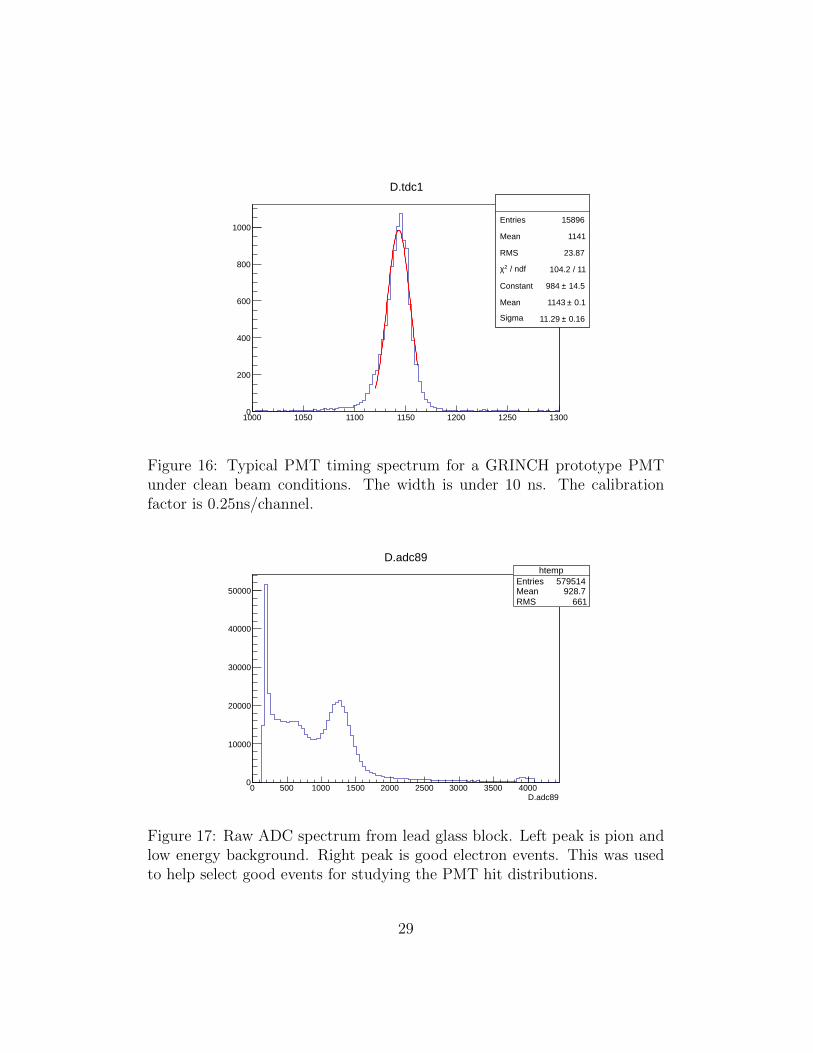
Under clean beam conditions, individual tube rates were under 10 kHzwith a threshold of approximately 50% of the single photoelectron peak. Un-der poor beam tune conditions, the rates were as large as 35 kHz. Figure 15shows a picture of the prototype detector. Figure 16 shows the timing spec-trum for a typical tube with relatively clean beam tune. Figure 17 showsthe lead glass ADC spectrum. Figure 18 shows a good event from the Luciteradiator.
8 Budget and Personnel
Table 2 shows expected costs for the GRINCH detector. It does not includeany cost for incorporating the GRINCH into the new BigBite detector frame.It does not include manpower support for installation and commissioning ofthe detectors and cables. The William and Mary group (Averett, Yao, gradu-ate students) will produce the mirrors and gas system and take responsibilityfor the overall detector project, from start to finish. The University of NorthCarolina A&T (Ahmidouch, Danagoulian) will produce the complete PMTarray including magnetic shielding. We request support from Jefferson Lab
27
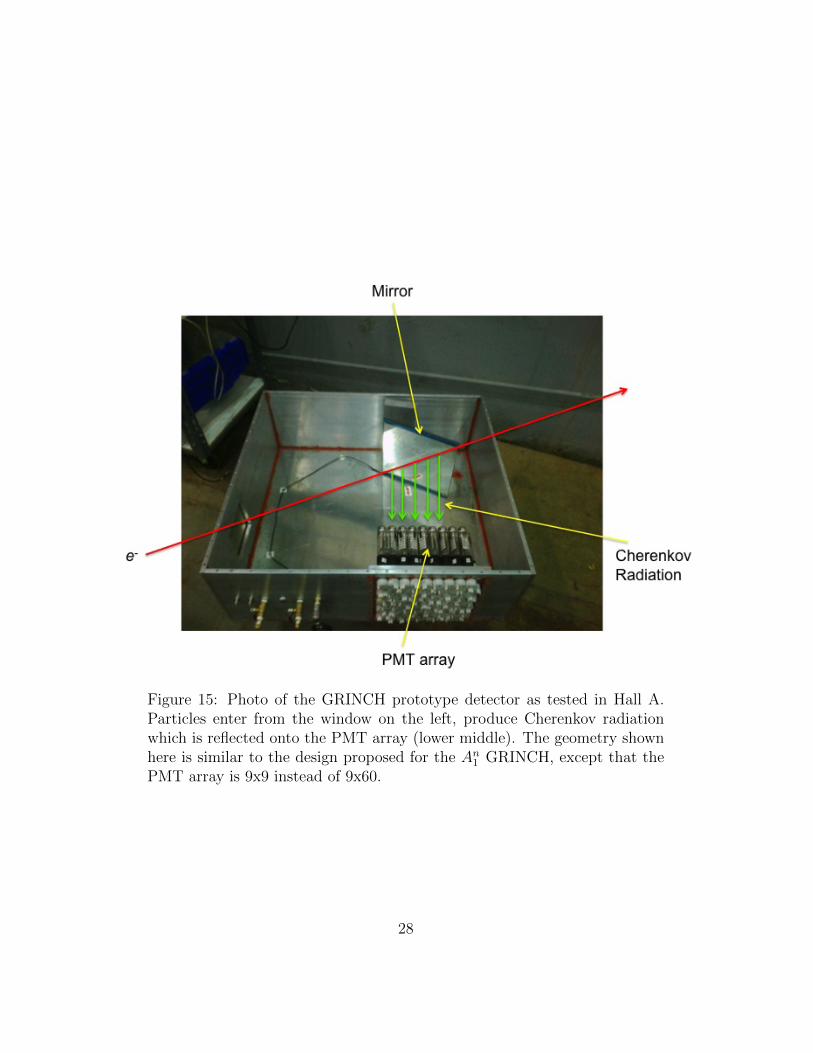
Figure 15: Photo of the GRINCH prototype detector as tested in Hall A.Particles enter from the window on the left, produce Cherenkov radiationwhich is reflected onto the PMT array (lower middle). The geometry shownhere is similar to the design proposed for the An1 GRINCH, except that thePMT array is 9x9 instead of 9x60.
28
Entries 15896
Mean 1141
RMS 23.87
/ ndf 2χ 104.2 / 11
Constant 14.5± 984
Mean 0.1± 1143
Sigma 0.16± 11.29
1000 1050 1100 1150 1200 1250 13000
200
400
600
800
1000Entries 15896
Mean 1141
RMS 23.87
/ ndf 2χ 104.2 / 11
Constant 14.5± 984
Mean 0.1± 1143
Sigma 0.16± 11.29
D.tdc1
Figure 16: Typical PMT timing spectrum for a GRINCH prototype PMTunder clean beam conditions. The width is under 10 ns. The calibrationfactor is 0.25ns/channel.
htempEntries 579514Mean 928.7RMS 661
D.adc890 500 1000 1500 2000 2500 3000 3500 4000
0
10000
20000
30000
40000
50000
htempEntries 579514Mean 928.7RMS 661
D.adc89
Figure 17: Raw ADC spectrum from lead glass block. Left peak is pion andlow energy background. Right peak is good electron events. This was usedto help select good events for studying the PMT hit distributions.
29
0 1 2 3 4 5 6 7 8
9 10 11 12 13 14 15 16 17
18 19 20 21 22 23 24 25 26
27 28 29 30 31 32 33 34 35
36 37 38 39 40 41 42 43 44
45 46 47 48 49 50 51 52 53
54 55 56 57 58 59 60 61 62
63 64 65 66 67 68 69 70 71
72 73 74 75 76 77 78 79 80
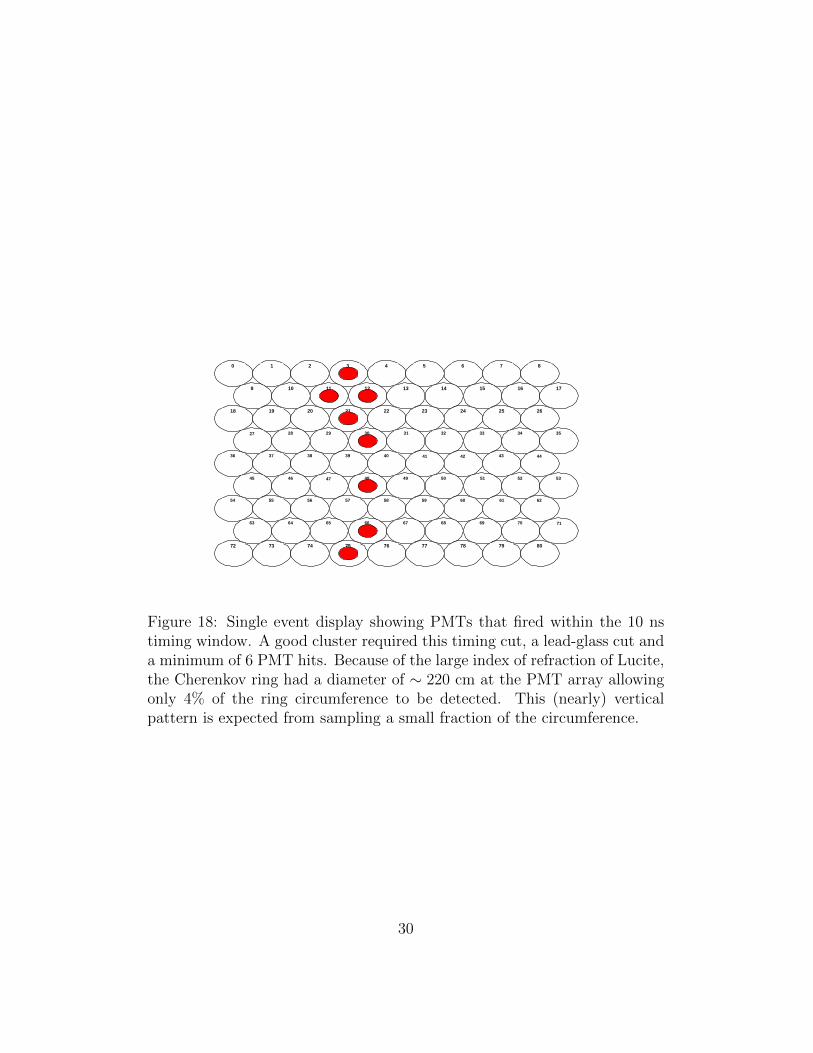
Figure 18: Single event display showing PMTs that fired within the 10 nstiming window. A good cluster required this timing cut, a lead-glass cut anda minimum of 6 PMT hits. Because of the large index of refraction of Lucite,the Cherenkov ring had a diameter of ∼ 220 cm at the PMT array allowingonly 4% of the ring circumference to be detected. This (nearly) verticalpattern is expected from sampling a small fraction of the circumference.
30
Item Cost (US$) Responsibility1. Gas Cherenkov vessel $45k ** W&M/Hall A eng./tech.2. Gas Cherenkov PMT array & 30k NCA&Tmagnetic shielding3. Gas Cherenkov Mirrors 20k W&M4. Gas Cherenkov Front-End Disr. 25k ** Hall A/W&M/GU5. Gas Cherenkov Gas System 10k W&M
Total Cost $130k
Collaborator Contributions $60kHall A contribution ** $70k
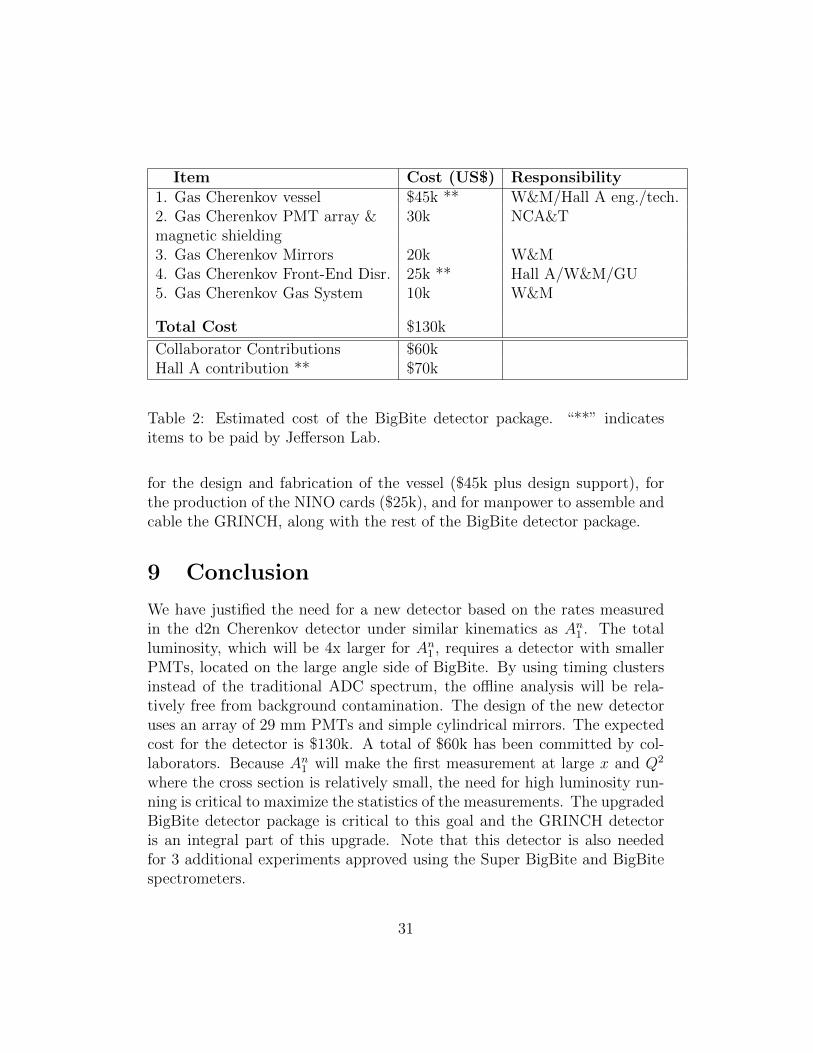
Table 2: Estimated cost of the BigBite detector package. “**” indicatesitems to be paid by Jefferson Lab.
for the design and fabrication of the vessel ($45k plus design support), forthe production of the NINO cards ($25k), and for manpower to assemble andcable the GRINCH, along with the rest of the BigBite detector package.
9 Conclusion
We have justified the need for a new detector based on the rates measuredin the d2n Cherenkov detector under similar kinematics as An1 . The totalluminosity, which will be 4x larger for An1 , requires a detector with smallerPMTs, located on the large angle side of BigBite. By using timing clustersinstead of the traditional ADC spectrum, the offline analysis will be rela-tively free from background contamination. The design of the new detectoruses an array of 29 mm PMTs and simple cylindrical mirrors. The expectedcost for the detector is $130k. A total of $60k has been committed by col-laborators. Because An1 will make the first measurement at large x and Q2
where the cross section is relatively small, the need for high luminosity run-ning is critical to maximize the statistics of the measurements. The upgradedBigBite detector package is critical to this goal and the GRINCH detectoris an integral part of this upgrade. Note that this detector is also neededfor 3 additional experiments approved using the Super BigBite and BigBitespectrometers.
31
References
[1] http://wm-jlab.physics.wm.edu/mediawiki/index.php/
Bigbite Gas Cherenkov.
[2] J. Annand, T. Averett, G. Cates, N. Liyanage, G. Rosner, B. Wojt-sekhowski, X. Zheng, spokespersons,http://www.jlab.org/exp prog/proposals/06/PR12-06-122.pdf.
[3] E12-10-103, J. Gomez, R. Holt, G. Petratos, R. Ransome, spokespersons,http://www.jlab.org/exp prog/proposals/10/PR12-10-103.pdf.
[4] E12-09-019, J. Annand, R. Gilman, B. Quinn, B. Wojtsekhowski,spokespersons,http://www.jlab.org/exp prog/proposals/09/PR12-09-019.pdf.
[5] E12-09-018, G. Cates, E. Cisbani, G. Franklin, A. Pukket, B. Wojt-sekhowski, spokespersons,http://www.jlab.org/exp prog/proposals/09/PR12-09-018.pdf.
[6] E12-09-018, G. Cates, S. Riordan, B. Wojtsekhowski, spokespersons,http://www.jlab.org/exp prog/proposals/09/PR12-09-016.pdf.
[7] X. Zheng et al., Phys. Rev. C70 (2004) 065207.
[8] P.L. Anthony et al., Phys. Rev. D58 (1998) 112003.
[9] P. Solvignon et al., Phys. Rev. Lett. 101 (2008) 182502.
[10] S. Choi, X. Jiang, Z.-E. Meziani, B. Sawatzky, spokespersons,http://www.jlab.org/exp prog/proposals/06/PR06-014.pdf
[11] M. Amarian et al., Phys. Rev. Lett. 89 (2002) 242301.
[12] White Paper: “The Science Driving the 12 GeV Upgrade of CEBAF”,(2001), http://www.jlab.org/div dept/physics division/
GeV/WhitePaper V11.pdf.
[13] “Physics Opportunities with the 12 GeV Upgrade at Jefferson Lab”,(2012), http://arxiv.org/pdf/1208.1244v2.pdf.
[14] E.S. Aggev et al., Phys. Lett. B647 (2007) 330.
32
[15] “Precision measurement of Neutron Spin Asymmetry An1 at Large xBjusing CEBAF at 5.7 GeV”, X. Zheng, doctoral thesis, MassachusettsInstitute of Technology, (2002).
[16] S. Riordan et al., Phys.Rev.Lett. 105 (2010) 262302.
[17] E. Cisbani et al., Nucl. Inst. Meth. A496 (2003) 305.
[18] I. Adam et al., Nucl. Inst. Meth. A538 (2005) 281.
[19] P. Bourgeois and J. Va’vra, “Corrosion of Glass Windows in DRICPMTs”, Technical Report (date, post BaBar)
[20] E. Jensen, “Testing DIRC PMTs”, (2012); and private communication.
[21] P. Degtyarenko, Jefferson Lab Hall A Monte-Carlo Simulation.
[22] V. Nelyubin, “A GEANT Simulation of Background Rate in QuartzWindow of PMT XP4508 in Cherenkov Detector”, (2011).
[23] B. Wojtsekhowski, private communication (2012).
[24] U. Akgun et al., (2010) JINST 5 P08005.
[25] B. Sawatzky, Hall A Technical Note for the BigBite Cherenkov Detector,https://jlabdoc.jlab.org/docushare/dsweb/Get/
Document-61783/12-038.pdf.
[26] N. Liyanage, University of Virginia, using fits and models for pion pro-duction cross sections, 2011.
[27] Jefferson Lab ES&H Manual, Section 6151, 2.0.
33