Embed Size (px)
Citation preview

Validation of AirPhysio Oscillating Positive Expiratory
Pressure Device
Report Prepared by Professor Norman Morris School of Allied Health Science and Menzies Health Institute Griffith University

1. Introduction For lung diseases that result in excess secretions, airway clearance techniques which improve mucus clearance are considered to be essential for optimising respiratory status and reducing disease progression [1]. In the conducting airways lined by ciliated epithelial cells, secretions are cleared by the mucocillary escalator; an essential component of the lung defence protecting the lung and gas exchange regions from aspirated particles and bacteria which may lead to infection. Mucus generating goblet cells produce a mucus film that sits on top of the cilia. The rhythmic beating of the cilia acts as an escalator that moves the mucus from the smaller peripheral airways to the larger central airways. From these larger airways mucus and any trapped aspirated particles or bacteria can be cleared, typically using a forced expiratory technique such as a cough or a huff. There are a number of airway clearance techniques. The primary aim of these techniques is to shear mucus and excess sputum from the inner surface of the airway lumen in the direction of the larger airways [2]. To achieve this, airway clearance techniques apply external forces to the lungs and airways that manipulate lung volumes, pulmonary pressures and gas flow [2, 3]. Examples of airway clearance techniques include postural drainage, percussion, breathing exercises and positive expiratory pressure (PEP). Positive expiratory pressure devices can be used to assist airway clearance in individuals with excess secretions [3]. Originating in Denmark and defined as ‘the PEP technique’, Falk et al [4] described an airway clearance method which required the subject to breathe through a flow dependent PEP device
attached to a face mask that created a PEP of between 10 and 20 cmH20 for 12 to 15 breaths. Theoretically, PEP assists airway clearance several ways. The addition of positive resistive pressure as the participant breaths out results in a prolongation of expiration which in turn may increase expiratory capacity and a reduction in gas trapping [5]. Moreover, it is proposed that PEP stabilises and splints the airways open [6] and increases the gas pressure behind excess mucus via collateral ventilation resulting in a temporary increase in functional residual capacity (FRC) [7]. As the individual breaths through the PEP device, FRC is gradually increased [1]. By increasing the gas pressure behind the mucus, forced expiratory techniques may be more effective in moving excess secretions from the peripheral to central airways [1, 7]. Oscillating high frequency PEP (OPEP) devices combine both PEP and airway oscillation techniques. The most well-known OPEP device, the Flutter, originated in Switzerland [3]. An early study by Konstan and colleagues [8] described the efficacy of the device for airway clearance in18 cystic fibrosis patients. The authors reported there were no adverse events with the device and that patients expectorated significantly (p<0.001) greater amounts of sputum when compared to airway clearance technique of postural drainage and voluntary cough. The Flutter device is a handheld pipelike device with a stainless-steel ball seated in a conical cone inside the bowl of the pipe (Figure 1). A screw top lid with perforations to allow airflow through the device sits on top of the pipe. As the subject breaths out through the device the ball moves up and down creating an opening and closing cycle as the stainless-steel ball is lifted off and then reseated on the cone throughout expiration [8]. These opening and closing cycles result in oscillations of endobronchial pressure and expiratory airflow which coincide with the opening and closing cycle of the ball being seated and lifted from the cone [8] (Figure 1). It is hypothesised that these additional oscillations may enhance sputum clearance by decreasing the viscoelastic properties of sputum and improved clearance through the airways.

Figure 1a. Cross sectional image of a Flutter Device Recent Cochrane reviews in individuals with cystic fibrosis, bronchiectasis and following an acute exacerbation of chronic obstructive pulmonary disease (AECOPD) suggest that airway clearance techniques are safe and may confer some benefit on clinical outcomes [1, 2, 9]. In AECOPD, there was a greater magnitude of the effect for PEP over non-PEP airway clearance techniques on the need for ventilatory assistance and hospital length of stay [2]. In a large randomised controlled trial comparing PEP with no airway clearance during a hospital stay for AECOPD, resting breathlessness improved more rapidly in the group allocated to PEP when compared control in the first 8 weeks following intervention. However, these authors found no difference in patient reported symptoms, quality of life or exacerbations at 6 months [10]. The recently published Cochrane review by McIlwaine et al [1] examined the use of PEP devices in individuals with cystic fibrosis. Using outcomes such as changes in lung function, mucus cleared from the airways and quality of life, the authors reported that efficacy of PEP was similar to other forms of chest physiotherapy. Of note these authors compared the efficacy of PEP and OPEP and found similar results for both techniques. However, it is worth noting that one long-term randomised controlled trial of children with cystic fibrosis that compared PEP and OPEP reported greater declines in lung function (forced vital capacity) and greater rates of hospitalisations in individuals that used flutter (ie OPEP) when compared to PEP [11]. Apart from the Flutter, there are now several types of OPEP devices on the market such as the Acapella, Cornet and Quake [5, 7]. Volsko et al [12] compared the Flutter device with the low (blue) and high (green) flow Acapella devices and reported no significant difference in the performance characteristics (mean PEP, peak PEP, amplitude PEP and oscillation frequency) of the devices. The AirPhysio device is a new OPEP device designed and manufactured in Australia (Figure 2). The AiPhysio device is a handheld pipelike device with a stainless-steel ball seated in a conical cone. The manufacturers included several original design features in the device including a dual cone and a modified cap that allows 3 different ball bearings (19, 20 and 22 mm) to be fitted. The device is made from a robust polycarbonate plastic, which the manufacturer suggests makes it more durable. It has been designed to sit flat sit flat on the benchtop with the mouthpiece elevated for improved hygiene. In a further attempt to improve hygiene the device includes a cap to go over the mouthpiece.
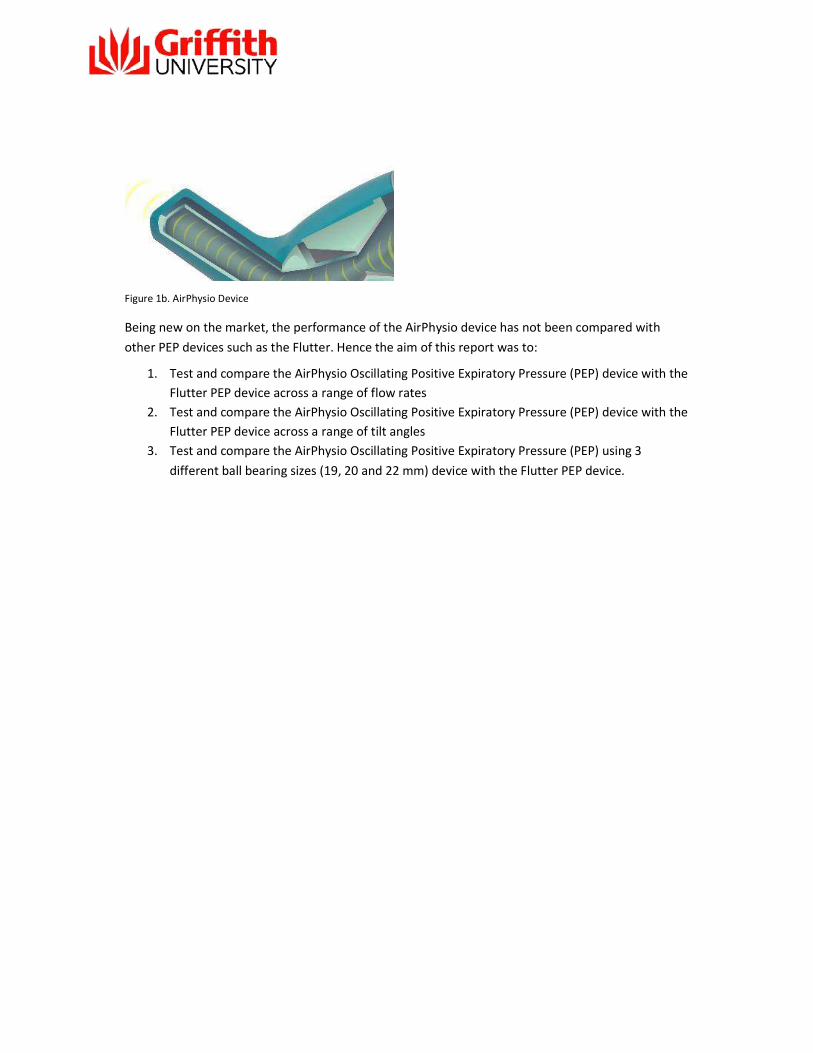
Figure 1b. AirPhysio Device Being new on the market, the performance of the AirPhysio device has not been compared with other PEP devices such as the Flutter. Hence the aim of this report was to:
1. Test and compare the AirPhysio Oscillating Positive Expiratory Pressure (PEP) device with the Flutter PEP device across a range of flow rates
2. Test and compare the AirPhysio Oscillating Positive Expiratory Pressure (PEP) device with the Flutter PEP device across a range of tilt angles
3. Test and compare the AirPhysio Oscillating Positive Expiratory Pressure (PEP) using 3 different ball bearing sizes (19, 20 and 22 mm) device with the Flutter PEP device.

2. Methods Equipment Set-Up For the current experiment, the two devices were tested using the equipment rig displayed in Figure 1. This rig is based on the equipment set-up used by Volsko et al [12].
Figure 2. Equipment Set-up: PEP: Positive expiratory pressure. During testing the rig was clamped into place. The angle of inclination was measured using a
protractor mounted on the flow sensor. The inclination range used for the study was from 0 to 300. Silicon connecters linked the device to a combined flow meter/pressure transducer (Venthor D30 from Thor Medical Systems, Hungary) and the Y-piece. A second pressure transducer (PX138 from Omega Engineering, USA) was added close to the input of the positive expiratory pressure (PEP) devices. Output from the pressure transducer was connected to a lab view data acquisition system and custom written software was written for the collection, storage and display of data. The ends of the Y-piece were connected to two pressure compensated medical flow -meters (Ezi-Flow, Comweld
Group Medical Products, Australia) allowing accurate flow rates from 5 to 30 L.min-1 to be applied to the device. Minimum Flow Rate to Lift the Ball Bearing
For each of the inclination angles (0, 10, 20, 300) the minimum flow rate required to lift the ball bearing was determined. The flow rate on the flow meter was slowly increased so that the ball bearing would just begin to oscillate for each of the devices (Flutter device and the AirPhysio device using either 19, 20 or 22 mm ball bearing). A total of 5 trials at this flow rate were undertaken with the PEP recorded for each trial. The mean and standard deviation for PEP the five trials was reported.
T piece Silicone Connectors
PEP Device Protractor: Angle of inclination varied from 0-300
Dual Flow Meters connected to air pump: Testing rates were 5, 10, 15, 20, 25 and 30 L.min-1
Flow meter and Pressure Transducer
Monitor
Data Acquisition and Storage System
PEP Device

Flow Settings and Inclination Angles
Each of the devices was tested a range of flow rates (5, 10, 15, 20, 25 and 30 L.min-1) and inclination
angles (0 to 300). Details on each of the conditions tested and how these were achieved are outlined in Table 1. For the AirPhysio device, the 3 ball bearing sizes (small: 19 mm, medium: 20 mm, and large: 22 mm) were used across different flow rates and inclination angles.
For the Flutter device, a single ball bearing was used. At the all flow rates from 5-30 L.min-1,
the device was tested across four inclination angles ranges from 0 to 300.
5

Table 1. Testing Protocol for Each Device across Flow Rates and Inclination Angles
Device Flow Rate (L.min-1) Ball Size (mm) Angle (0)
Small (19 mm) 0
10 5 Medium (20mm) 20 Large (22mm) 30
Small (19 mm)
0
10 10 Medium (20mm)
20 Large (22mm) 30
Small (19 mm)
0
10 15 Medium (20mm)
20 Large (22mm)
AirPhysio
30
Small (19 mm) 0
20 Medium (20mm) 10
20 Large (22mm) 30
Small (19 mm) 0 10 25 Medium (20mm) 20
Large (22mm) 30
Small (19 mm) 0
10 30 Medium (20mm) 20 Large (22mm) 30
Device Flow Rate (L.min-1) Ball Size (mm) Angle (0)
0 5 Standard size
10 20
30 0
10 Standard size
10
20
30
0
15 Standard size
10
20
Flutter 30
0
20 Standard Size 10 20
30 0 25 Standard Size
10 20
30 0 30 Standard Size 10 20 30
Signal Processing and Outcome measures
Data was sampled at 1000 Hz. Output from the pressure transducer was filtered using a 4th order Butterworth, low pass filter with a cut off frequency of 40Hz. For each of the conditions in Table 1, a total of five individual trials were conducted. Labview output from a typical trial is shown in Figure 2. Each trial was 5-seconds in duration with the following output variables extracted: mean trial PEP, mean peak trial PEP, mean trial PEP amplitude (peak-min) and the mean trial oscillation frequency. Data from each of the five trials was then averaged to determine mean PEP, peak PEP, amplitude (mean peak-minimum PEP) and oscillation frequency. A two-way analysis of variance with repeated measures was used to compare the performance of the devices across a range of flows. Data from each of the inclination angles were pooled and averaged at each flow rates. A comparison between the AirPhysio devices and the Flutter of the mean PEP achieved across flow rates was also made using a Bland-Altman plot.
Figure 3: Typical Figure for Airphysio Device: 20 L.min-1, medium ball, at 00 inclination. 3. Results
Minimum Flow Rate to Lift the Ball Bearing
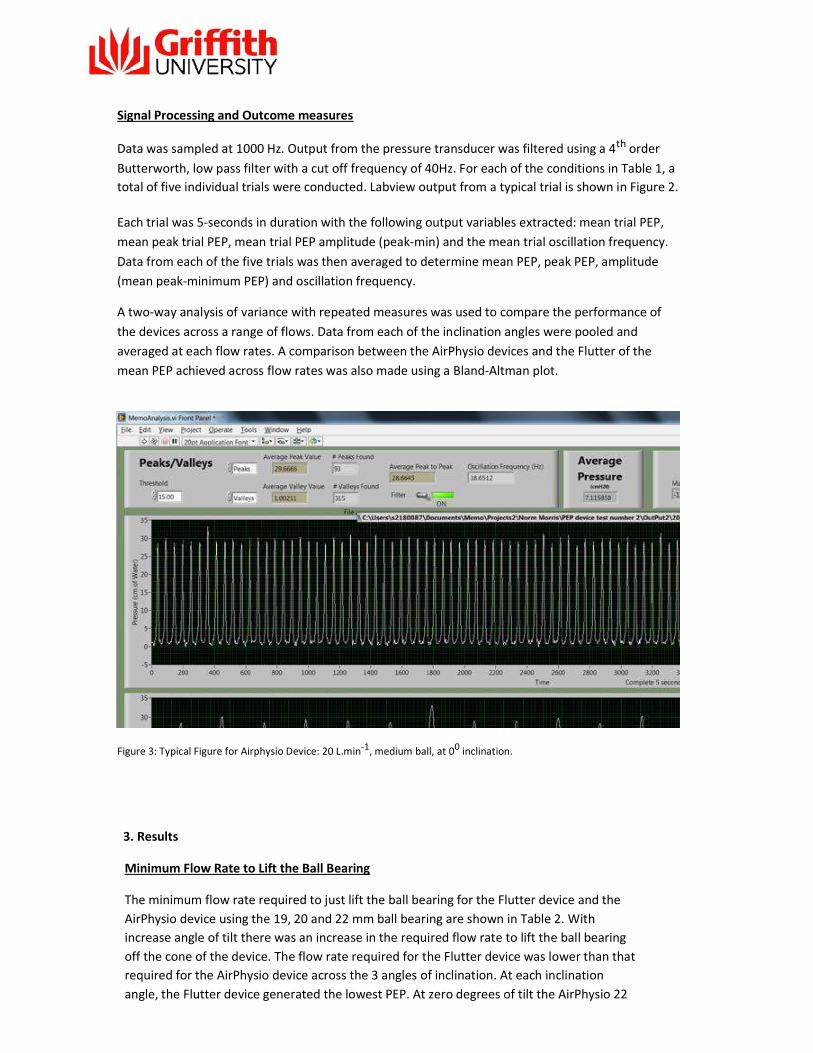
The minimum flow rate required to just lift the ball bearing for the Flutter device and the AirPhysio device using the 19, 20 and 22 mm ball bearing are shown in Table 2. With increase angle of tilt there was an increase in the required flow rate to lift the ball bearing off the cone of the device. The flow rate required for the Flutter device was lower than that required for the AirPhysio device across the 3 angles of inclination. At each inclination angle, the Flutter device generated the lowest PEP. At zero degrees of tilt the AirPhysio 22
generated the highest PEP with there being no apparent significant difference between the
AirPhysio19 and AirPhysio20 devices. At tilt angles of 10-300, the Flutter again produced the lowest PEP followed by the AirPhysio19 and AirPhysio20, with the AirPhysio22 device generating the highest PEP.
Table 2. The Minimal Flow Rate Required and average pressure generated to just lift the ball bearing for different inclination angle
Zero Degrees 10 Degrees 20 Degrees 30 Degrees 30
Device Min Flow
PEP Min Flow PEP
Min Flow PEP
Min Flow PEP
(L.min-1) (cmH20) (L.min-1) (cmH20) (L.min-1) (cmH20) (L.min-1) (cmH20) Flutter 2.4 7.1±0.1a 2.6 9.2±0.0c 2.6 10.9±0.1c 2.0 12.8±0.0c
AirPhysio19 2.8 8.4±0.0 3.1 9.8±0.1c 4.0 11.7±0.0c 4.3 13.1±0.2c
AirPhysio20 3.2 8.7±0.1 3.5 10.4±0.2c 4.0 12.3±0.0c 4.5 13.9±0.2c
AirPhysio 22 3.6 9.1±0.2 3.6 10.9±0.2c 4.1 12.8±0.2c 5.1 15.1±0.1c
Table 2: Zero Degrees: 00 degrees inclination; 10 Degrees: 100 of inclination; 200 of inclination; 300 of inclination; Min Flow: minimum flow rate to just lift the ball; PEP: mean positive expiratory pressure generated across the five trials; AirPhysio19: Airphysio device with 19 mm ball; Airphysio20: Airphysio with 20 mm ball bearing; Airphysio22: Airphysio with 22 mm ball bearing. aSignificantly less than all other devices (P<0.05); bSignificantly greater than other devices (P<0.05); cSignificantly different from all other devices (P<0.05).
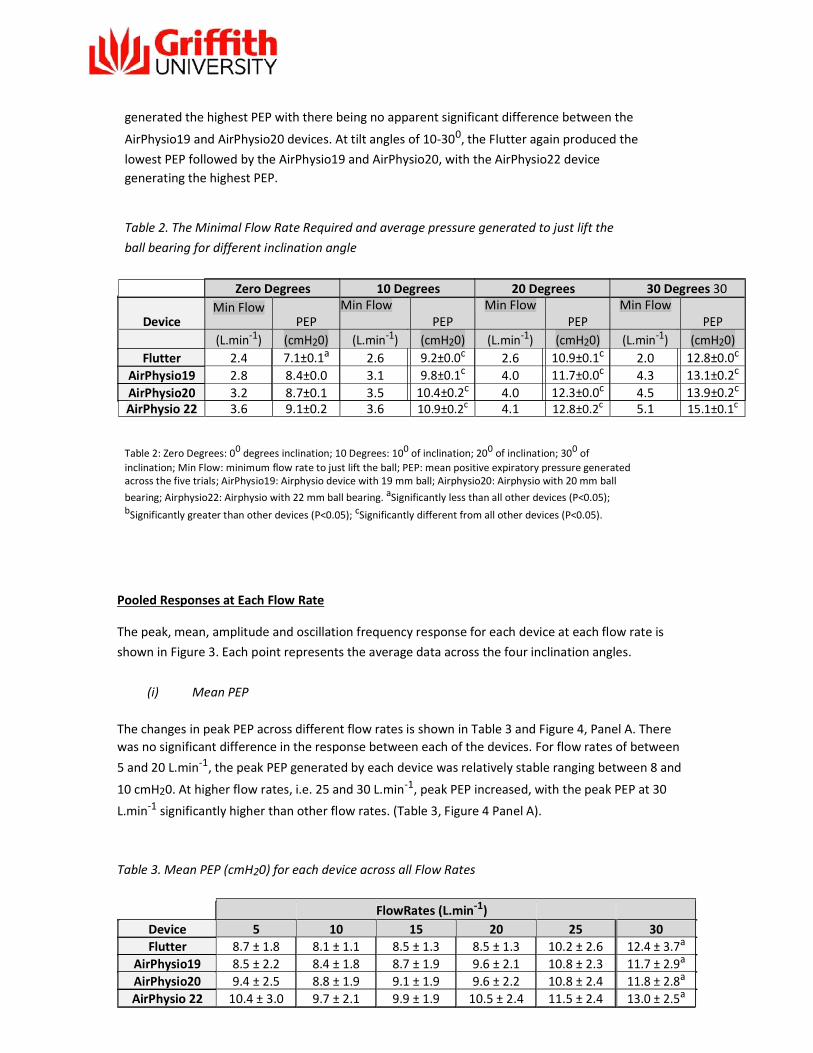
Pooled Responses at Each Flow Rate The peak, mean, amplitude and oscillation frequency response for each device at each flow rate is shown in Figure 3. Each point represents the average data across the four inclination angles.
(i) Mean PEP
The changes in peak PEP across different flow rates is shown in Table 3 and Figure 4, Panel A. There was no significant difference in the response between each of the devices. For flow rates of between 5 and 20 L.min-1, the peak PEP generated by each device was relatively stable ranging between 8 and
10 cmH20. At higher flow rates, i.e. 25 and 30 L.min-1, peak PEP increased, with the peak PEP at 30
L.min-1 significantly higher than other flow rates. (Table 3, Figure 4 Panel A).
Table 3. Mean PEP (cmH20) for each device across all Flow Rates
FlowRates (L.min-1) Device 5 10 15 20 25 30 Flutter 8.7 ± 1.8 8.1 ± 1.1 8.5 ± 1.3 8.5 ± 1.3 10.2 ± 2.6 12.4 ± 3.7a AirPhysio19 8.5 ± 2.2 8.4 ± 1.8 8.7 ± 1.9 9.6 ± 2.1 10.8 ± 2.3 11.7 ± 2.9a AirPhysio20 9.4 ± 2.5 8.8 ± 1.9 9.1 ± 1.9 9.6 ± 2.2 10.8 ± 2.4 11.8 ± 2.8a AirPhysio 22 10.4 ± 3.0 9.7 ± 2.1 9.9 ± 1.9 10.5 ± 2.4 11.5 ± 2.4 13.0 ± 2.5a

Table 3: Mean positive expiratory pressure generated across the four inclination angles; AirPhysio19: Airphysio device with 19 mm ball; Airphysio20: Airphysio device with 20 mm ball bearing; Airphysio22: Airphysio device with 22 mm ball bearing. aSignificantly higher than other flow rates (P<0.05).
(ii) Peak PEP The changes in peak PEP across different flow rates is shown in Table 4 and Figure 4, Panel B. There was no significant difference in the response between each of the devices. For increasing flow rates the mean PEP increased in a linear fashion, with the highest values achieved at flow rates of 30
L.min-1.
Table 4. Peak PEP (cmH20) for each device across all Flow Rates
Flow Rates (L.min-1) Device 5 10 15 20 25 30 Flutter 14.0 ± 1.4 18.7 ± 1.4 24.3 ± 1.6 26.2 ± 3.5 30.9 ± 5.7 32.8 ± 10.5 AirPhysio19 12.3 ± 1.5 18.1 ± 0.6 22.9 ± 2.0 26.6 ± 2.9 30.4 ± 5.7 37.3 ± 6.0 AirPhysio20 12.4 ± 1.3 18.1 ± 0.8 23.4 ± 2.1 26.9 ± 3.3 32.6 ± 4.5 37.4 ± 7.2 AirPhysio 22 13.6 ± 1.3 19.1 ± 0.8 24.6 ± 2.1 27.6 ± 3.0 32.6 ± 4.8 37.2 ± 5.9
Table 4: Mean positive expiratory pressure generated across the four inclination angles; AirPhysio19: Airphysio device with 19 mm ball; Airphysio20: Airphysio device with 20 mm ball bearing; Airphysio22: Airphysio device with 22 mm ball bearing.
(iii) Amplitude PEP The changes in amplitude PEP across different flow rates is shown in Table 5 and Figure 4, Panel C. Again there were no significant differences in the response between each of the devices. For increasing flow rates the mean PEP increased in a linear fashion, with the highest values achieved at
flow rates of 30 L.min-1.

Table 5. Amplitude PEP (cmH20) for each device across all Flow Rates
Flow Rates (L.min-1) Device 5 10 15 20 25 30 Flutter 10.8 ± 1.4 17.0 ± 2.6 22.9 ± 2.1 24.5 ± 4.1 28.1 ± 8.0 27.6 ± 15.2 AirPhysio19 7.5 ± 0.9 15.8 ± 1.0 20.9 ± 2.6 24.4 ± 3.4 27.5 ± 6.8 34.0 ± 8.2 AirPhysio20 6.5 ± 1.8 15.4 ± 1.2 21.2 ± 2.9 24.6 ± 3.8 30.2 ± 5.1 33.9 ± 9.6 AirPhysio 22 6.6 ± 2.9 15.8 ± 1.5 22.3 ± 2.5 24.9 ± 3.5 29.8 ± 5.5 33.6 ± 7.2
Table 5: Mean positive expiratory pressure generated across the four inclination angles; AirPhysio19: Airphysio device with 19 mm ball; Airphysio20: Airphysio device with 20 mm ball bearing; Airphysio22: Airphysio device with 22 mm ball bearing.
(iv) Oscillation Frequency
The changes in the oscillation frequency (Hz) across different flow rates are shown in Table 6 and Figure 4, Panel D. There were no significant differences in the oscillation frequency achieved at each
flow rate between each of the devices. For flow rates over 10 L.min-1, the oscillation frequency
tended to decrease with the lowest oscillation frequency being achieved at 30 L.min-1.
Table 6. Oscillation Frequency (Hz) for each device across all Flow Rates
Flow Rates (L.min-1) Device 5 10 15 20 25 30 Flutter 28.0 ± 7.3 30.9 ± 6.2 26.8 ± 5.4 25.3 ± 5.7 23.6 ± 5.7 22.6 ± 5.0 AirPhysio19 31.0 ± 4.4 29.6 ± 4.4 26.8 ± 5.3 24.6 ± 4.8 23.1 ± 4.6 21.6 ± 5.2 AirPhysio20 25.2 ± 6.3 29.7 ± 4.2 27.0 ± 5.0 25.5 ± 5.3 23.3 ± 4.5 22.2 ± 5.6 AirPhysio 22 26.0 ± 2.2 29.9 ± 4.2 27.9 ± 5.2 26.3 ± 5.2 25.0 ± 5.3 23.1 ± 5.5
Table 6: Mean positive expiratory pressure generated across the four inclination angles; AirPhysio19: Airphysio device with 19 mm ball; Airphysio20: Airphysio device with 20 mm ball bearing; Airphysio22: Airphysio device with 22 mm ball bearing.

Figure 4: Air Physio vs Flutter across different flow rates: Data represents the average of each of five trials across each of the inclination angles. PEP: Positive Expiratory Pressure; Amplitude: Difference between peak and minimum values

Responses at Each Flow Rate for Different Inclination Angle The mean PEP, peak PEP, amplitude PEP and oscillation frequency for each device at flow rates of 5-
30 L.min-1 across four inclination angles (0-300) are presented in Figures 5-8.
(i) Mean PEP Changes in the mean PEP (cmH20) for different tilt angles at each flow rate are shown in Figure 5. Each of the PEP devices behaved in a similar fashion at each of the six flow rates (5, 10, 15, 20. 25 and 30 L.min- 1). In general, moving from the lowest to highest tilt angle, there was a linear
increase in mean PEP. For all flow rates the lowest mean PEP was generated at a 00 tilt angle and
generally the highest mean PEP for each device was generated at 300 tilt angle. With increasing flow rates there was some variability in this response. At flow rates of 15, 20 and 25 L.min-1 mean PEP tended to fall for each device as inclination angle was increased from 100 to 200,
before then increasing for an inclination angle of 300. At the highest flow rate there was some variation between devices and across inclination angles with the mean PEP for the Flutter, AirPhysio19 and AirPhysio20 devices tending to increase across all inclination angles, similar to what was seen at the lower flow rates. The mean PEP for the AirPhysio device at 22 mm tended to again decrease between inclination angles of 100 and 200 before then increasing at an inclination angle of
300.
(ii) Peak PEP
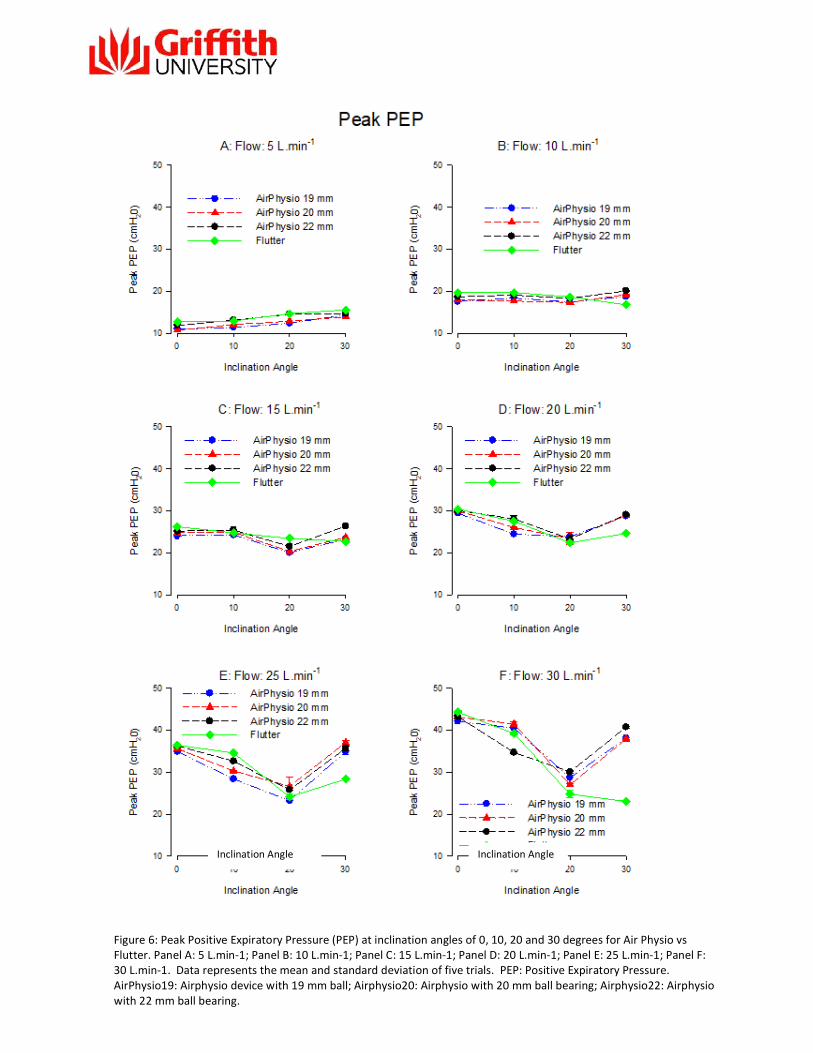
Changes in the peak PEP (cmH20) for different tilt angles at each flow rate are shown in Figure 6. Each of the PEP devices behaved in a similar fashion at each of the six flow rates (5, 10, 15, 20.
25 and 30 L.min-1). The impact of tilt angle on peak PEP generated by each device was dependent on the flow rate. For the lowest flow rates (5 and 10 L.min-1), there tended to be a small (3-5 cmH20) but significant (P<0.05) increase in peak PEP as tilt angle was increased from 0 to 300. At 15 L.min-1, peak PEP was similar at 00 and 100 of inclination, however peak PEP fell at 200 inclination before increasing again at 300 inclination. This response (ie a fall in mean PEP between the inclination angles of 100 and 200 before increasing again at 300 inclination) was more pronounced at the higher flow rates of 20,25 and 30 30 L.min-1. One notable exception was that at 30 L.min-1, for the flutter, peak PEP fell further from 200 to 300 of inclination.
(iii) PEP Amplitude
Changes in the PEP amplitude (cmH20) for different tilt angles at each flow rate are shown in Figure 7. Each of the PEP devices behaved in a similar fashion at each of the six flow rates (5, 10, 15, 20. 25
and 30 L.min-1). The impact of tilt angle on PEP amplitude generated by each device was dependent on the flow rate. For the lowest flow rates (5 and 10 L.min-1) PEP amplitude remained relatively constant as tilt angle
was increased from 0 to 300. At 15 L.min-1, PEP amplitude was similar at 00 and 100 of inclination, however PEP amplitude fell at 200 inclination before increasing again at 300 inclination (except for Flutter which stayed approximately the same). This response (ie a fall in PEP amplitude between the inclination angles of 100 and 200 before increasing again at 300 inclination) then became more obvious at a flow rate of 20 and was most obvious at the highest flow rates of 25 and 30 L.min-1. One notable exception was that at 30 L.min-1, again for the flutter, PEP amplitude fell further from 200 to 300 of inclination.
(iv) Oscillation Frequency Changes in the oscillation frequency (Hz) for different tilt angles at each flow rate are shown in Figure 8. In general each of the PEP devices behaved in a similar fashion at each of the six flow rates
(5, 10, 15, 20. 25 and 30 L.min-1). For flow rates from 10-30 L.min-1, an increase in tilt angle resulted in an increase in the frequency of oscillation, with the lowest frequency being generated at 0 tilt angle and the highest frequency
at a flow rate of 30 L.min-1. The increase was linear, except at a flow rate of 10 L.min-1 where the AirPhysio devices tended to decrease the frequency of oscillation when the device was tilted from
20 to 300.
At the lowest flow rate (5 L.min- 1) there was some variation across tilt angles for devices. For the Flutter device and the AirPhysio with the 20 mm ball, oscillation frequency dropped as the device was tilted from 100 to 200 before increasing at a tilt angle of 300 The other two AirPhysio devices behaved in a different fashion. In the AirPhysio 19 mm device, oscillation frequency increased from inclination angles of 00-20 0 before falling at 300. For the Airphysio 22 mm device, oscillation
frequency increased from 00-100 inclination before falling at 200 and 300 inclination.

Figure 5: Mean Positive Expiratory Pressure (PEP) at inclination angles of 0, 10, 20 and 30 degrees for Air Physio vs Flutter.
Panel A: 5 L.min-1; Panel B: 10 L.min-1; Panel C: 15 L.min-1; Panel D: 20 L.min-1; Panel E: 25 L.min-1; Panel F: 30 L.min-1. Data represents the mean and standard deviation of five trials. PEP: Positive Expiratory Pressure. AirPhysio19: Airphysio device with 19 mm ball; Airphysio20: Airphysio with 20 mm ball bearing; Airphysio22: Airphysio with 22 mm ball bearing.
Inclination Angle
Inclination Angle
Figure 6: Peak Positive Expiratory Pressure (PEP) at inclination angles of 0, 10, 20 and 30 degrees for Air Physio vs Flutter. Panel A: 5 L.min-1; Panel B: 10 L.min-1; Panel C: 15 L.min-1; Panel D: 20 L.min-1; Panel E: 25 L.min-1; Panel F: 30 L.min-1. Data represents the mean and standard deviation of five trials. PEP: Positive Expiratory Pressure. AirPhysio19: Airphysio device with 19 mm ball; Airphysio20: Airphysio with 20 mm ball bearing; Airphysio22: Airphysio with 22 mm ball bearing.

Figure 7: Amplitude of Positive Expiratory Pressure (PEP) at inclination angles of 0, 10, 20 and 30 degrees for Air Physio vs Flutter. Panel A: 5 L.min-1; Panel B: 10 L.min-1; Panel C: 15 L.min-1; Panel D: 20 L.min-1; Panel E: 25 L.min-1; Panel F: 30 L.min-1. Data represents the mean and standard deviation of five trials. PEP: Positive Expiratory Pressure. AirPhysio19: Airphysio device with 19 mm ball; Airphysio20: Airphysio with 20 mm ball bearing; Airphysio22: Airphysio with 22 mm ball bearing.
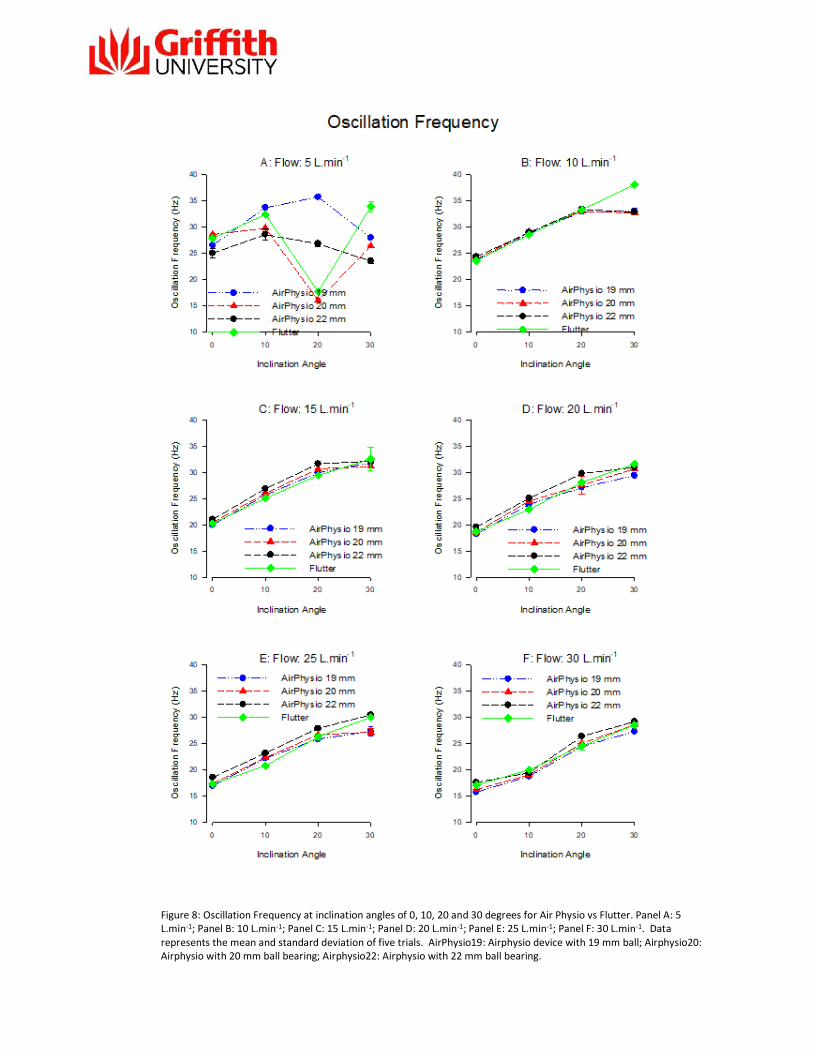
Figure 8: Oscillation Frequency at inclination angles of 0, 10, 20 and 30 degrees for Air Physio vs Flutter. Panel A: 5 L.min-1; Panel B: 10 L.min-1; Panel C: 15 L.min-1; Panel D: 20 L.min-1; Panel E: 25 L.min-1; Panel F: 30 L.min-1. Data represents the mean and standard deviation of five trials. AirPhysio19: Airphysio device with 19 mm ball; Airphysio20: Airphysio with 20 mm ball bearing; Airphysio22: Airphysio with 22 mm ball bearing.
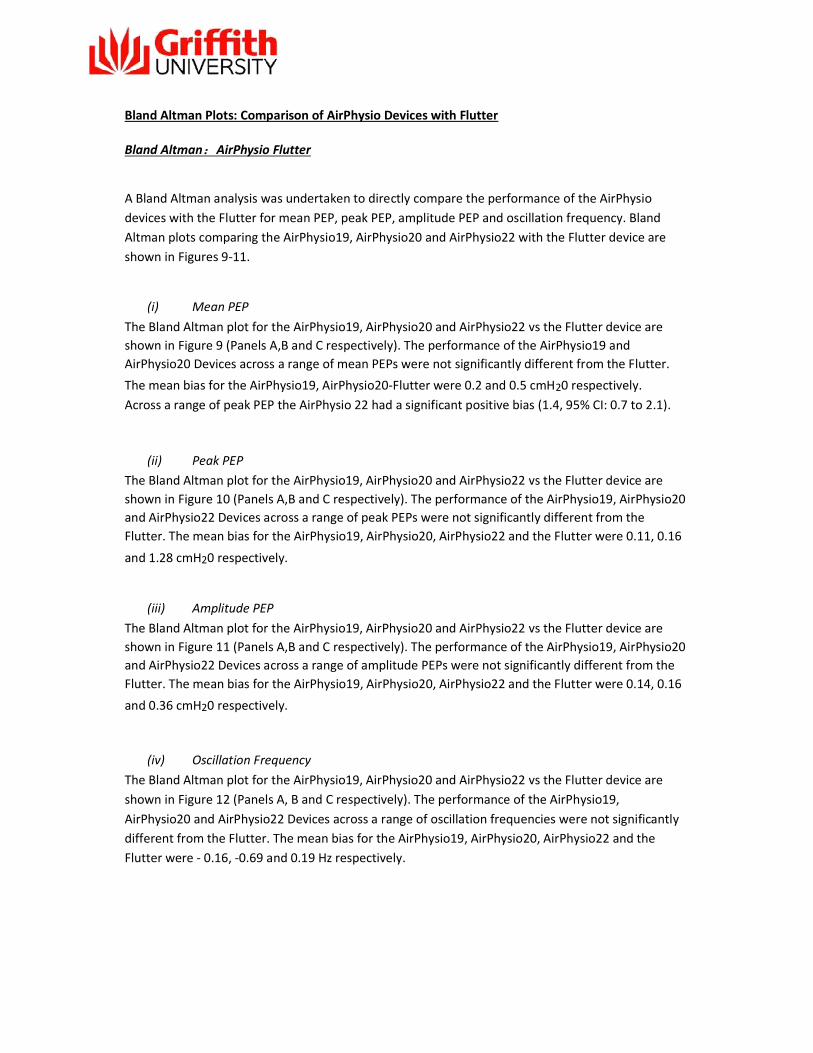
Bland Altman Plots: Comparison of AirPhysio Devices with Flutter Bland Altman:AirPhysio Flutter A Bland Altman analysis was undertaken to directly compare the performance of the AirPhysio devices with the Flutter for mean PEP, peak PEP, amplitude PEP and oscillation frequency. Bland Altman plots comparing the AirPhysio19, AirPhysio20 and AirPhysio22 with the Flutter device are shown in Figures 9-11.
(i) Mean PEP The Bland Altman plot for the AirPhysio19, AirPhysio20 and AirPhysio22 vs the Flutter device are shown in Figure 9 (Panels A,B and C respectively). The performance of the AirPhysio19 and AirPhysio20 Devices across a range of mean PEPs were not significantly different from the Flutter.
The mean bias for the AirPhysio19, AirPhysio20-Flutter were 0.2 and 0.5 cmH20 respectively. Across a range of peak PEP the AirPhysio 22 had a significant positive bias (1.4, 95% CI: 0.7 to 2.1).
(ii) Peak PEP The Bland Altman plot for the AirPhysio19, AirPhysio20 and AirPhysio22 vs the Flutter device are shown in Figure 10 (Panels A,B and C respectively). The performance of the AirPhysio19, AirPhysio20 and AirPhysio22 Devices across a range of peak PEPs were not significantly different from the Flutter. The mean bias for the AirPhysio19, AirPhysio20, AirPhysio22 and the Flutter were 0.11, 0.16
and 1.28 cmH20 respectively.
(iii) Amplitude PEP
The Bland Altman plot for the AirPhysio19, AirPhysio20 and AirPhysio22 vs the Flutter device are shown in Figure 11 (Panels A,B and C respectively). The performance of the AirPhysio19, AirPhysio20 and AirPhysio22 Devices across a range of amplitude PEPs were not significantly different from the Flutter. The mean bias for the AirPhysio19, AirPhysio20, AirPhysio22 and the Flutter were 0.14, 0.16
and 0.36 cmH20 respectively.
(iv) Oscillation Frequency The Bland Altman plot for the AirPhysio19, AirPhysio20 and AirPhysio22 vs the Flutter device are shown in Figure 12 (Panels A, B and C respectively). The performance of the AirPhysio19, AirPhysio20 and AirPhysio22 Devices across a range of oscillation frequencies were not significantly different from the Flutter. The mean bias for the AirPhysio19, AirPhysio20, AirPhysio22 and the Flutter were - 0.16, -0.69 and 0.19 Hz respectively.

Dif
fere
nc
e A
irP
hys
io19
- F
lutt
er
(cm
H2 0
)
Mean PEP: Airphysio19 vs Flutter
6
4 Mean + 1.96SD
2
0 Mean
Bias = .2025
Std Dev = 1.2759
-2 Bias CI
Mean - 1.96SD 95% CI = -0.3377 To 0.7426
-4
-6 4 6 8 10 12 14 16
Mean PEP (cm H20)
Dif
fere
nc
e A
irP
hys
io2
0-F
lutt
er
(cm
H2 0
)
Mean PEP: Airphysio20 vs Flutter 6
4 Mean + 1.96SD
2 Bias = .5179
Mean Std Dev = 1.3367
0 95% CI = -0.048 To 1.0838
-2 Bias CI
Mean - 1.96SD
-4
-6 6 8 10 12 14 16
Mean PEP (cmH20)
2
Dif
fere
nce
Air
Ph
ysio
22-
Flu
tte
r (c
mH
0)
Mean PEP: AirPhysio22 vs Flutter
6
Mean + 1.96SD 4
2 Mean Bias = 1.4322
Std Dev = 1.6863 0 Bias CI
95% CI = 0.7182 To 2.1461
-2 Mean - 1.96SD
-4
-6 6 8 10 12 14 16 18
Mean PEP (cmH20)
Figure 9: Bland Altman Plot comparing the Mean Positive Expiratory Pressure generated by the AirPhysio devices with the Flutter Device. Each data point represents the average of 5 individual trials. Each device was compared at flow rates of 5,
10, 15, 20, 25 and 30 L.min-1 and across tilt angles of 00, 100, 200 and 300. Bias: mean difference between devices; CI: Confidence Interval.
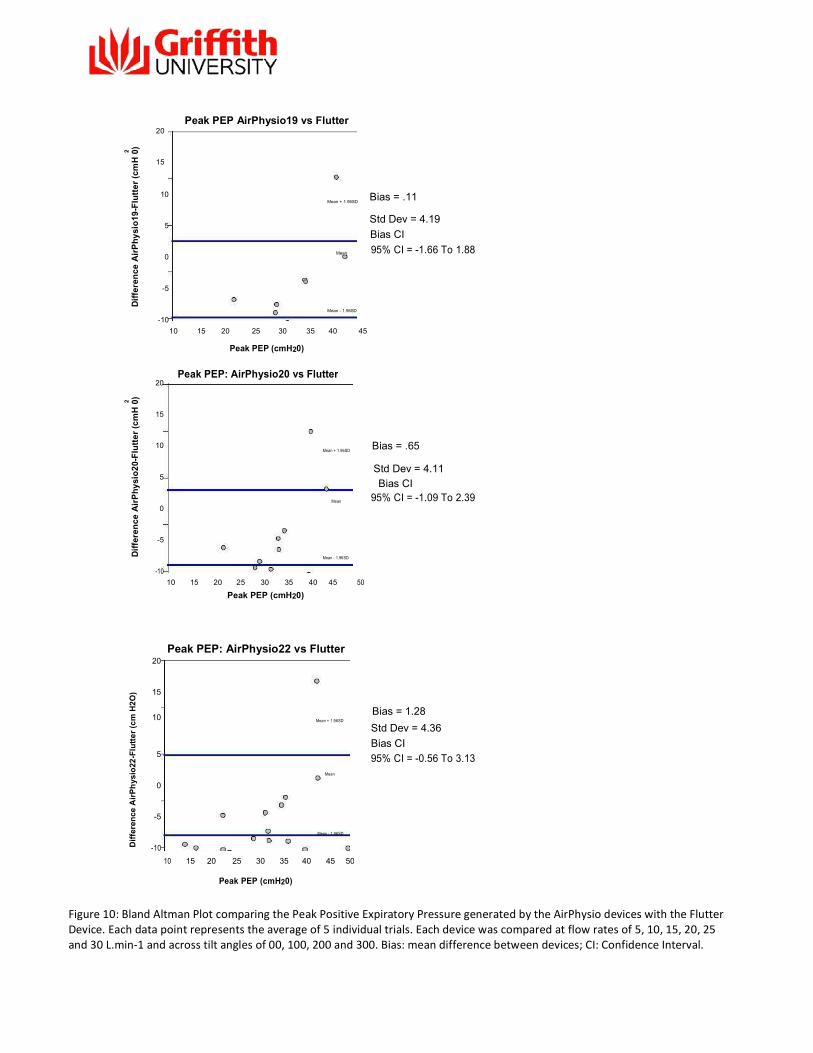
Figure 10: Bland Altman Plot comparing the Peak Positive Expiratory Pressure generated by the AirPhysio devices with the Flutter Device. Each data point represents the average of 5 individual trials. Each device was compared at flow rates of 5, 10, 15, 20, 25 and 30 L.min-1 and across tilt angles of 00, 100, 200 and 300. Bias: mean difference between devices; CI: Confidence Interval.
2
Dif
fere
nc
e A
irP
hy
sio
19-
Flu
tte
r (c
mH
0)
2
Dif
fere
nc
e A
irP
hy
sio
20-
Flu
tte
r (c
mH
0)
Peak PEP AirPhysio19 vs Flutter
20
15
10 Bias = .11 Mean + 1.96SD
5 Std Dev = 4.19
Bias CI
0 Mean 95% CI = -1.66 To 1.88
-5 Mean - 1.96SD
-10 10 15 20 25 30 35 40 45
Peak PEP (cmH20)
20
Peak PEP: AirPhysio20 vs Flutter
15
10 Mean + 1.96SD
Bias = .65
5 Std Dev = 4.11
Bias CI
0 Mean 95% CI = -1.09 To 2.39
-5 Mean - 1.96SD
-10 10 15 20 25 30 35 40 45 50
Peak PEP (cmH20)
Dif
fere
nce
Air
Ph
ysio
22-F
lutt
er
(cm
H2
O)
Peak PEP: AirPhysio22 vs Flutter 20
15
10 Bias = 1.28
Mean + 1.96SD
Std Dev = 4.36
5 Bias CI 95% CI = -0.56 To 3.13
Mean
0
-5 Mean - 1.96SD
-10 10 15 20 25 30 35 40 45 50
Peak PEP (cmH20)
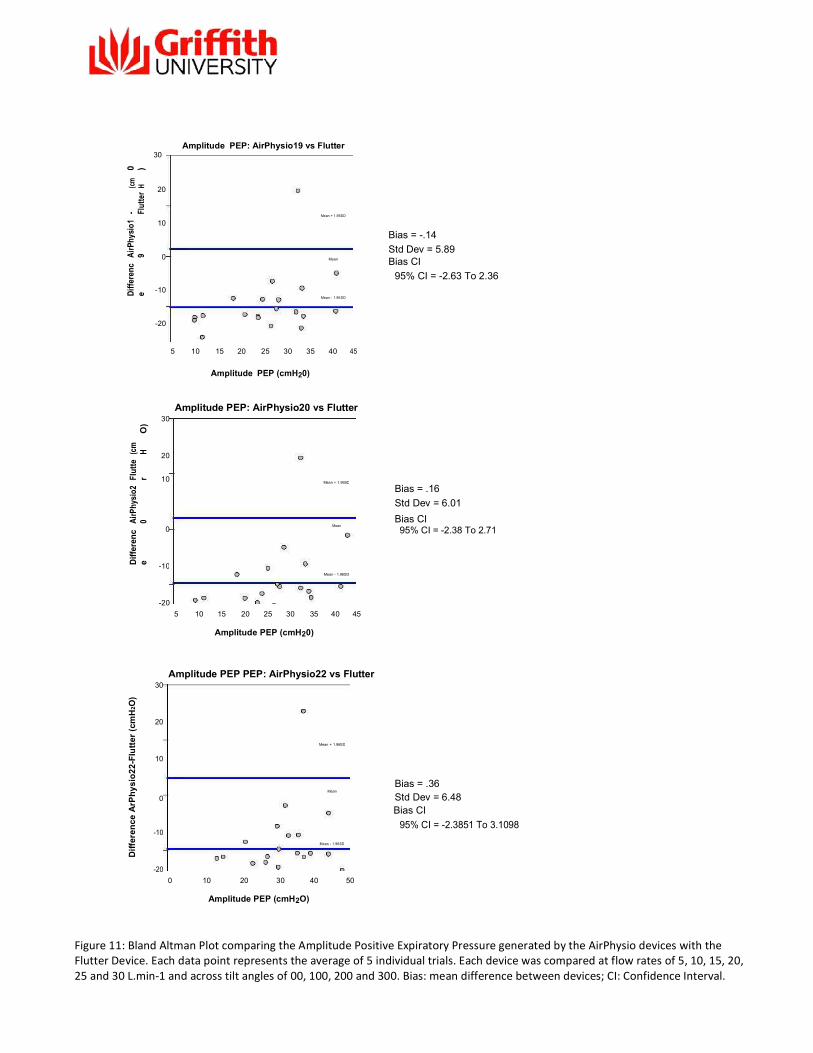
Figure 11: Bland Altman Plot comparing the Amplitude Positive Expiratory Pressure generated by the AirPhysio devices with the Flutter Device. Each data point represents the average of 5 individual trials. Each device was compared at flow rates of 5, 10, 15, 20, 25 and 30 L.min-1 and across tilt angles of 00, 100, 200 and 300. Bias: mean difference between devices; CI: Confidence Interval.
Amplitude PEP: AirPhysio19 vs Flutter
30
0 )
(cm
H 20
- Flut
ter
10
Mean + 1.96SD
Air
Phys
io1
9
0 Mean
Diff
eren
ce -10
Mean - 1.96SD
-20
5 10 15 20 25 30 35 40 45
Amplitude PEP (cmH20)
Amplitude PEP: AirPhysio20 vs Flutter
30
O)
(cm
H
20
Flut
ter
10 Mean + 1.96SD
Air
Phy
sio2
0
0
Mean
Dif
fere
nc
e
-10
Mean - 1.96SD
-20 5 10 15 20 25 30 35 40 45
Amplitude PEP (cmH20)
Bias = -.14 Std Dev = 5.89 Bias CI
95% CI = -2.63 To 2.36
Bias = .16 Std Dev = 6.01 Bias CI 95% CI = -2.38 To 2.71
Dif
fere
nc
e A
rPh
ysi
o2
2-F
lutt
er (
cmH
2 O)
Amplitude PEP PEP: AirPhysio22 vs Flutter 30
20
Mean + 1.96SD
10
Mean
Bias = .36
0
Std Dev = 6.48
Bias CI
-10 95% CI = -2.3851 To 3.1098
Mean - 1.96SD
-20 0 10 20 30 40 50
Amplitude PEP (cmH2O)

Figure 12: Bland Altman Plot comparing the Oscillation Frequency generated by the AirPhysio devices with the Flutter Device. Each data point represents the average of 5 individual trials. Each device was compared at flow rates of 5, 10, 15, 20, 25 and 30 L.min-1 and across tilt angles of 00, 100, 200 and 300. Bias: mean difference between devices; CI: Confidence Interval.
Oscillation Freq. AirPhysio19 vs Flutter 15
(Hz)
10
u tt e r 5 Mean + 1.96SD
Air
Ph
ysio
19
0 Mean
Dif
fere
nce
-5
-10
Mean - 1.96SD
-15 15 20 25 30 35 40
Oscillation Frequency Oscillation Freq. AirPhysio20 vs Flutter 15
(Hz)
10
- F
lutt
er
5
AirP
hysi
o20
Mean + 1.96SD
0 Mean
Dif
fere
nce
-5 Mean - 1.96SD
-10
-15 15 20 25 30 35 40
Oscillation Frequency (Hz)
Bias = -.06 Std Dev = 4.23 Bias CI 95% CI = -1.86 To 1.73
Bias = -.6926 Std Dev = 2.1256
Bias CI 95% CI = -1.5925 To 0.2073
Dif
fere
nce
Air
Ph
ysio
22-
Flu
tte
r (H
z)
Oscillation Freq: AirPhysio22 vs Flutter 15
10 Mean + 1.96SD
5 Bias = .19
0 Mean Std Dev = 3.44
Bias CI
-5 95% CI = -1.26 To 1.65
Mean - 1.96SD
-10
-15 15 20 25 30 35 40
Oscillation Frequency (Hz
4. Conclusions The purpose of this report was to compare the AirPhysio Oscillating Positive Expiratory Pressure device using three ball bearing sizes (19, 20 and 22 mm) with the Flutter PEP device across a range of flow rates and tilt angles. Using a customised rig and data collection software, we compared the
performance of the AirPhysio and Flutter devices at flow rates ranging from 5 to 30 L.min-1 across
tilt angles of 0 to 300. Increasing the ball size on the AirPhysio device from 19-22 mm resulted in an increase in the mean and peak PEP across flow rates and tilt angles (Figure 4, 5 and 6). These figures show a similar response for the mean and peak PEP generated by the Flutter device. For the mean PEP the Flutter behaved similarly as AirPhysio 19 and 20 mm balls but was significantly lower than the AirPhysio 22 mm (Figure 9). The heavier ball and the greater flow rate required to lift the ball from cone (Table 2) would have accounted for the higher mean PEP generated by the AirPhysio22 when compared to the Flutter and the smaller AirPhysio ball bearing sizes. For the peak PEP, the Flutter device and all AirPhysio devices behaved in a similar fashion (Figure 10). Whilst there was tendency for the AirPhysio 22 to generate higher peak pressures, this varied across flow rates with the AirPhysio 22 not always generating the peak PEP at the highest flow rates
of 25 and 30 L.min-1. Increasing the flow rate resulted in an increase in the amplitude of PEP for both the AirPhysio and Flutter devices (Figure 4). An increase in the amplitude of PEP reflects a widening of the difference between peak and minimal PEP generated by the device. For the current study we found an increase in the maximal PEP across flow rates for both the AirPhysio and Flutter devices (Figure 4). An increase in the amplitude PEP across flow rates suggests that the rate of increase in the minimal PEP was less than that of the maximal PEP. Indeed, whilst not reported in results section, the rate of increase in peak PEP for the Flutter and AirPhysio devices was far greater than the increase in minimal PEP. The rate of increase in peak PEP for the Flutter and AirPhysio 19, 20 and 22 were 0.76,
0.95, 0.98 and 0.92 cmH20/L.min-1 respectively. By comparison the rate of increase in the minimal
PEP for the Flutter and AirPhysio 19, 20 and 22 were 0.10, -0.03, -0.08 and -0.10 cmH20/L.min-1 respectively. Simply put, as flow rate increased, peak PEP increased to a greater extent than the minimal PEP generated by each device. For the AirPhysio the ball size did not appear to affect the amplitude. Once again, there were no significant differences in the performance of these devices across a range of tilt angles (Figure 7 and 11).
Increasing the flow rate from 5 to 10 L.min-1 tended to increase the oscillation frequency whereupon there was a general decline in oscillation frequency for increased flow (Figure 4). Once again, the performance of the AirPhysio and Flutter devices did not appear significantly different across a range of
flow and tilt angles. The increase in oscillation frequency from 5 to 10 L.min-1 may be due to this flow rate being near that required to lift the ball from the cone for each of the devices (Table 2). For the larger AirPhysio ball (22 mm) the flow rate required to lift the ball from the cone at higher tilt angles was
nearly 5 L.min-1 and as such this may have impacted on the generated oscillation frequency at this low flow rate. The flow rates chosen for this particular study were similar to those described in the study by Volsko
et al [12] who compared the Flutter and Acapella OPEP devices across flow rates of 5- 30 Lmin-1. We chose this range of airflows as severe lung disease results in a loss of elastic recoil of the lung and a
marked reduction in peak airflow generation. At these low flow rates and tilt angles there is a graded mean PEP response produced by the AirPhysio device with the lowest mean PEP generated by 19 mm ball and the highest mean PEP generated by the AirPhysio22. Across these same tilt
angles (0-300), the Flutter device tended to perform between that of the AirPhysio 19 and 20 mm device. In summary, using mean PEP, peak PEP, amplitude PEP and oscillation frequency as indices of performance, we found that the AirPhysio and Flutter devices behaved similarly across a range of flow rates and tilt angles. Similar to our results, Volsko et al [12] found that the Flutter and Acapella devices performed similarly across a range of airflows.
Publication Note This report (including any enclosures and attachments) has been prepared for a specific purpose for a particular client. Use of this report for any other purpose (including raising capital) by the particular client or for any purpose whatsoever by any third party is not permitted. This report is not intended for use by a third party and a third party may not place any reliance on this report whatsoever. Griffith University makes no warranty, express or implied as to the accuracy or completeness of the report or any information used in compiling the report. To the extent permitted by law, Griffith University disclaims all liability for any loss or damage of any nature whatsoever which may be suffered by any fault or negligence of Griffith University or otherwise. Griffith University owns or has a right to use the copyright and all intellectual property in the report. No part of this report may be reproduced for any commercial use or distributed or communicated to any third party, without the prior written consent of Griffith University.
24

5. References
1. Mcllwaine, M., B. Button, and K. Dwan, Positive expiratory pressure physiotherapy for airway clearance in people with cystic fibrosis. Cochrane Database Syst Rev, 2015(6): p. CD003147.
2. Osadnik, C.R., C.F. McDonald, A.P. Jones, and A.E. Holland, Airway clearance techniques for chronic obstructive pulmonary disease. Cochrane Database Syst Rev, 2012(3): p. CD008328.
3. Pryor, J.A., Physiotherapy for airway clearance in adults. Eur Respir J, 1999. 14(6): p. 141824.
4. Falk, M., M. Kelstrup, J.B. Andersen, T. Kinoshita, P. Falk, S. Stovring, and I. Gothgen, Improving the ketchup bottle method with positive expiratory pressure, PEP, in cystic fibrosis. Eur J Respir Dis, 1984. 65(6): p. 423-32.
5. Osadnik, C.R., C.F. McDonald, and A.E. Holland, Advances in airway clearance technologies for chronic obstructive pulmonary disease. Expert Rev Respir Med, 2013. 7(6): p. 673-85.
6. Oberwaldner, B., J.C. Evans, and M.S. Zach, Forced expirations against a variable resistance: a new chest physiotherapy method in cystic fibrosis. Pediatr Pulmonol, 1986. 2(6): p. 358-67.
7. Myers, T.R., Positive expiratory pressure and oscillatory positive expiratory pressure therapies. Respir Care, 2007. 52(10): p. 1308-26; discussion 1327.
8. Konstan, M.W., R.C. Stern, and C.F. Doershuk, Efficacy of the Flutter device for airway mucus clearance in patients with cystic fibrosis. J Pediatr, 1994. 124(5 Pt 1): p. 689-93.
9. Lee, A.L., A.T. Burge, and A.E. Holland, Airway clearance techniques for bronchiectasis. Cochrane Database Syst Rev, 2015(11): p. CD008351.
10. Osadnik, C.R., C.F. McDonald, B.R. Miller, C.J. Hill, B. Tarrant, R. Steward, C. Chao, N. Stodden, C.C. Oliveira, N. Gagliardi, and A.E. Holland, "l. Thorax, 2014. 69(2): p. 137-43.
11. McIlwaine, P.M., L.T. Wong, D. Peacock, and A.G. Davidson, Long-term comparative trial of positive expiratory pressure versus oscillating positive expiratory pressure (flutter) physiotherapy in the treatment of cystic fibrosis. J Pediatr, 2001. 138(6): p. 845-50. 12. Volsko, T.A., J. DiFiore, and R.L. Chatburn, Performance comparison of two oscillating positive expiratory pressure devices: Acapella versus Flutter. Respir Care, 2003. 48(2): p. 124¬30.