Embed Size (px)
Citation preview

©AB
B In
c.
GridView – An Analytic Tool for
Market Simulation & Asset Performance Evaluations
ABB Inc.Electric Systems
Consulting

©AB
B In
c.
Outline
What is GridView about?
GridView Capabilities and Functional Highlights
Demonstration of GridView’s Graphical User Interface
(GUI) and Database preparation process
A Case Study for the NYCA System
Q & A

©AB
B In
c.
Where is the opportunity?Where is the opportunity?
25 $/MWh
10 $/MWh
7 $/MWh3 $/MWh
1 $/MWh
2 $/MWh
15 $/MWh
18 $/MWH17 $/MWh
A
CB
D
Transmission Expansion IPP Plant Siting

©AB
B In
c.
The Starting Point: GridView
MarketScenariosMarket
Scenarios
Competitive Energy Market Simulation
Engine
Competitive Energy Market Simulation
Engine
Demand Model:Location
dependentload
Demand Model:Location
dependentload
Supply Model:Generator Capacity
Heat rateFuel cost/operation
Constraint
Supply Model:Generator Capacity
Heat rateFuel cost/operation
ConstraintDetailed
transmissionsystem model
Detailedtransmissionsystem model
GeneratorUtilization and
Asset Value
GeneratorUtilization and
Asset ValuePower System
ReliabilityMeasures
Power System ReliabilityMeasures
TransmissionLine
UtilizationLevel
TransmissionLine
UtilizationLevel
LocationalMarket Clearing
Price
LocationalMarket Clearing
PriceBottlenecks&
Economic value of expansion
Bottlenecks&
Economic value of expansion
Goal: Goal: Combine Combine Power System Power System Details with Details with Market and Market and Economic Economic AspectsAspects

©AB
B In
c.
Power Market Simulation Models
Supply Curve• Ignores transmission
‘Bubble’ View• Major interconnects only
Detailed View• Very complex
CG&E14.74
KUEN13.59
LG&EE12.66
EKPC13.78
OVEC13.65
WVPA13.41
PSI13.89
NO
LOAD
217
NU
KE-A
218
NU
KE-B
221
HYD
RO
222
MID
CO
AL21
6 AD
DO
N22
5 VIKI
NG
219
MID
CO
ALP
215
CO
ND
ENS
214
CAR
IOC
A22
0
BIG
CO
AL22
3
BIG
CO
IL21
3
WES
TIE-
222
4
WES
TIE-
110
3
MID
TIE-
221
1
MID
TIE-
110
9
EAST
IE-2
212
EAST
IE-1
110R
EAC
TOR
106
MAR
YLO
AD10
4AN
NEL
OAD
105
ERIK
LOAD
108
CO
AL-A
101
CO
AL-B
102
MID
OIL
107
Ease
Simple
DifficultGood
Poor
Accuracy
Power Market Simulation Models
GridView is a detailed model with a nice Graphical User Interface !

©AB
B In
c.
What’s Behind ?
{ }∑ ∑ ∑∑ +++ TccDcGcMin tdg θθ
Control Variables
MaxMin GG G ≤≤MaxMin DDD ≤≤
MaxMin θθθ ≤≤
(Real Power Gen. Limits)
(Dispatchable Demands)
(Phase Shifter Limits)
LimitsTT ≤ (Transmission Constraints)
s.t. ∑∑ = LG (Real Power Balance)

©AB
B In
c.
Transmission Constraints
Transmission facility (lines and transformers) thermal limits using normal ratingsTransmission facility limits considering selected critical contingencies using emergency ratings (LTE or STE)Interfaces/flowgates limits and nomograms due to voltage and stability problemsTransmission maintenance schedulingMonte Carlo simulation (forced outages) for major Interfaces & flowgates

©AB
B In
c.
Nomograms
LcZbYaX ≤+++ ...

©AB
B In
c.
Price & Performance Evaluation ModelPrice & Performance Evaluation Model
Optimal Load Flow
Market Modeling
Market Simulation
Opportunity Analysis
Generation• size• bids• availability
Transmission• power flow• constraints• operating rules• FTR/Tariffs
Load• hourly variation• location• growth
History Information
ProbabilityDistribution Curves
Workably Competitive System Operating Cases (Non-cost issues)
Revenues (Energy & Capacity Sales)
Values of A.S.Flows / Congestion
Price Volatility(real-time or off-line)
Scenarios
Goal: Combine Power Systems Analysis withGoal: Combine Power Systems Analysis withAccurate Economic ModelsAccurate Economic Models

©AB
B In
c.
Modeling CapabilitiesModeling CapabilitiesTransmission
- large detailed system such as the WECC- transmission constraints explicitly modeled
Generation- generators as represented in transmission model- generation costs - fixed and variable production costs- generation scheduling (maintenance and forced outages)- individual generator capacity adjustment
Load- individual bus load- hourly load variations based on historical data
Transmission Tariffs
- directly included in dispatch decision

©AB
B In
c.
GridView Outputs – Market SimulationMarket Clearing Prices (LMP or Zonal Pricing)
Hourly and duration Individual bus, area average
Generation Individual or area plant production Individual or area plant production costsIndividual or area plant revenueIndividual or area generation capacity and reserve marginReliability indices
TransmissionIndividual line or interface power flows Transmission congestion cost and utilization measuresContingency analysis and reliability indicesBudget constrained transmission expansion plans

©AB
B In
c.GridView Outputs – Monte Carlo Simulation and
Contingency Analysis
Frequency, duration and probability of a contingency event
Statistic information from Monte Carlo simulations – Mean, median, standard deviation, confidence level, etc.
Loss of Load Expectation
Overloads, and islands under contingency conditions
Remedial actions and system conditions after corrections
System generation cost before and after contingency or remedial actions
System load payment before and after contingency or remedial actions.

©AB
B In
c.
GridView Functional HighlightsGridView Functional HighlightsPower Market Simulator
- combines gen. & transmission engineering and financial data
- simulates competitive market behavior
- scenario (what if) analysis
Opportunity Identification, Evaluation and Justification
- generation and transmission expansion projects
Market Position and Asset Worth Evaluation
- existing plants, refurbished plants, new plants
- transmission expansion sensitivity index
Transmission Economics and Planning
- identify low and high cost areas (potential customers)
- identify transmission constraints that might exist and impede transactions, and the costs of the transmission congestion

©AB
B In
c.
Volatility Modeling for Energy MarketsVolatility Modeling for Energy Markets
Actual PJM Hourly Average LMP in 1999
0
100
200
300
400
500
600
700
800
900
1000
0 1000 2000 3000 4000 5000 6000 7000 8000Hour
LMP
($/M
WH
)
LMPSorted
Volatility Prices
Cost-based Prices Discounted Prices

©AB
B In
c.
PJM Simulation Results
Cost-based Simulation Results for PJM 2002
Actual LMP inPJM 2002
PJM 2002 Load

©AB
B In
c.
Simulated PJM Eastern Interface in 2002

©AB
B In
c.
Merchant Plant Evaluation Merchant Plant Evaluation -- Energy SalesEnergy Sales
0 1000 2000 3000 4000 5000 6000 7000 8000 900010
20
30
40
50
60
70
Hours
$/M
Wh
Market Clearing Price Duration: Plant X
Dispatch Cost for Plant X
‘Profit’
Running Hours

©AB
B In
c.
Capacity Market AssessmentCapacity Market Assessment

©AB
B In
c.
Top 5 Most Congested NY Interfaces *
Ranking Interface Name Average Power Flow (MW) Shadow Price ($/MW) Congestion Cost (k$) Congestion Hours (Hrs) Loading Factor1 SPR/DUNW SOUTH 3895.67 3.32 114836.24 5290 0.992 UPNY CONED 3939.10 1.66 61486.87 1997 0.933 CONED-LILCO 938.52 6.53 55814.96 6886 0.964 WEST CENTRAL 1233.00 2.47 37359.44 1506 0.715 UPNY SENY 3624.70 0.55 20290.21 1341 0.87
* This is a sample report from the simulation result of year 2003 based on ABB’s NYISO database.

©AB
B In
c.
Market StudiesMarket StudiesBenefits analysis and costs evaluation for RTOs and stakeholders
Congestion management and value of congestion relief
Energy market price forecasting & price volatility analysis
Evaluation for forward energy contracts
Capacity market studies
Market power analysis and market monitoring
Market performance benchmark
Alternative market design and modeling
NERC regional generation, transmission and load data collection and forecast

©AB
B In
c.
Generation StudiesGeneration StudiesGeneration plant siting optimization
Generation bidding strategy assessment
Generation asset evaluation and management
Generation portfolio optimization and risk management
Generation plant performance and efficiency analysis
System impact and facility study for generator interconnection

©AB
B In
c.
Transmission StudiesTransmission StudiesTransmission asset utilization monitoring
Transmission bottleneck identification
Transmission congestion assessment
Transmission expansion planning and alternative evaluation
Identification and economic assessment of merchant transmission projects

©AB
B In
c.
Program ServicesProgram ServicesProgram installation and setup
Customer-site training
ABB-site training in US
Limited software warranty and customer support
Database creation
Consulting services
Software customization

©AB
B In
c.
GridView’s User Interface and Database preparation process
User Friendly Graphical User Interface (GUI) by Visual
Basic
External dataset is managed by Microsoft Excel
Spreadsheets and sanity checked by GUI when imported
into GridView database
Internal Database is managed by Microsoft ACCESS
Compatible with PSS/E formatted load flow and
contingency files
©AB
B In
c.
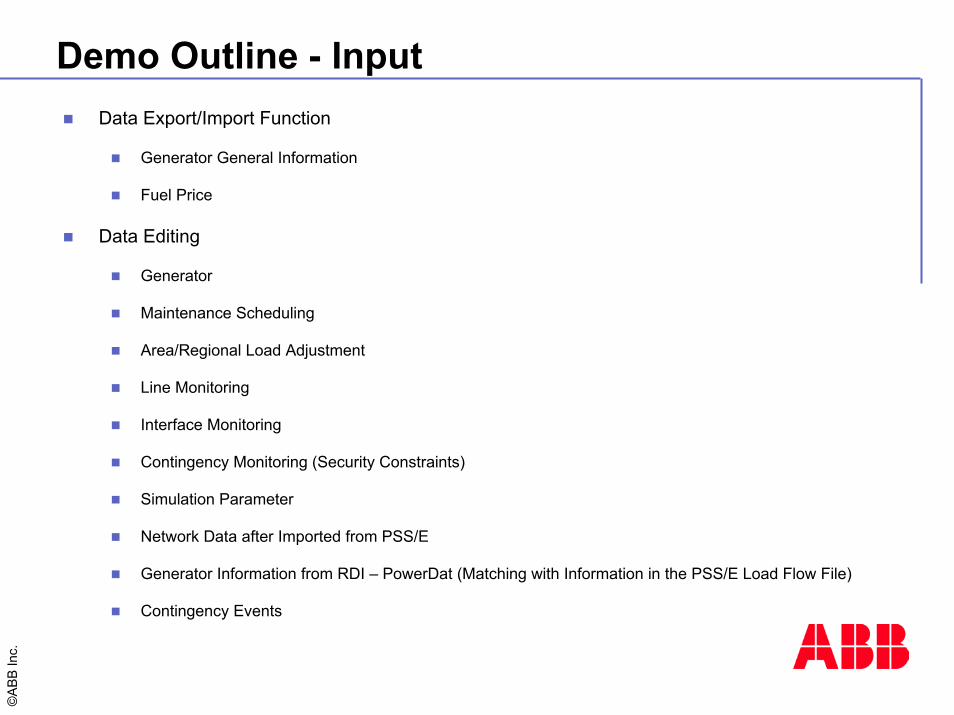
Demo Outline - InputData Export/Import Function
Generator General Information
Fuel Price
Data Editing
Generator
Maintenance Scheduling
Area/Regional Load Adjustment
Line Monitoring
Interface Monitoring
Contingency Monitoring (Security Constraints)
Simulation Parameter
Network Data after Imported from PSS/E
Generator Information from RDI – PowerDat (Matching with Information in the PSS/E Load Flow File)
Contingency Events
©AB
B In
c.
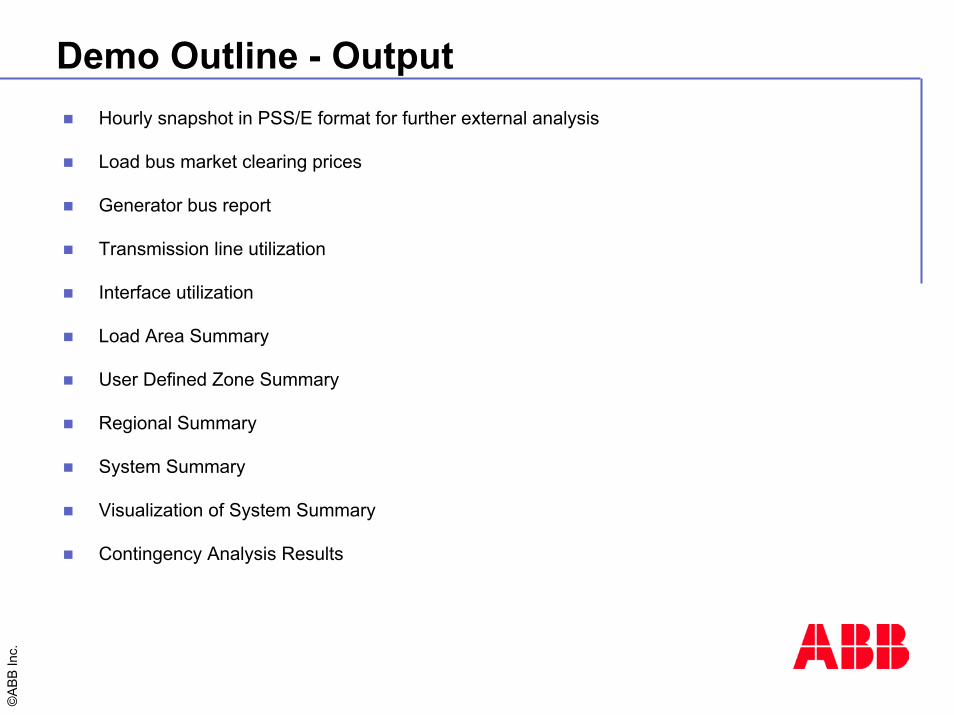
Demo Outline - OutputHourly snapshot in PSS/E format for further external analysis
Load bus market clearing prices
Generator bus report
Transmission line utilization
Interface utilization
Load Area Summary
User Defined Zone Summary
Regional Summary
System Summary
Visualization of System Summary
Contingency Analysis Results

©AB
B In
c.
A Case Study
“Economic Evaluation of Transmission Congestion Relief for the NYCA System”
Reference [1] - “Economic Evaluation of Transmission Congestion Relief Based on Power MarketSimulations”, IEEE PES General Meeting, Toronto, Canada, July 2003.

©AB
B In
c.
Questions for the Case StudyWhere are the bottlenecks?
How often does transmission congestion occur?
What are the economic consequences of inadequate transmission
capacity?
Which interface or path constraints are more attractive for
improvement?
What system expansion or upgrade options are available?
What is the market and system impact of any proposed system
expansion project?

©AB
B In
c.
NYCA System

©AB
B In
c.
In-City Requirements

©AB
B In
c.
NYCA Transmission Network and Interfaces
Transmission Bottlenecks.

©AB
B In
c.
NYC
NYC is right inside the transmission congestion.

©AB
B In
c.
NY State Price Forecast
Average summer (June~August) prices in NY state forecasted by Dr. David Pattern to NY-ISO.

©AB
B In
c.
NYCA System Congestion Costs
(M$/yr) (%)
1unlimited network capacity 2451.0 0 0
2w/ transmission constraints 2640.6 189.6 7.74
3w/ security constraints 2768.4 317.4 12.95
Congestion CostSolution Approach Production Cost (M$/yr)
Case
Reference [1] - “Economic Evaluation of Transmission Congestion Relief Based on Power MarketSimulations”, IEEE PES General Meeting, Toronto, Canada, July 2003.

©AB
B In
c.
NYCA Zonal Average LMPs
NYCA Zonal Average LMP ($/MWh)
0
10
20
30
40
50
Capita
lNY C
ityWest
Centra
lDun
woodie
Genes
see
Hudso
nLo
ng Is
land
Millwood
MohawkNort
htransmission constrained
security constrained
Reference [1] - “Economic Evaluation of Transmission Congestion Relief Based on Power MarketSimulations”, IEEE PES General Meeting, Toronto, Canada, July 2003.

©AB
B In
c.
NYCA Interface Utilization Analysis
CENTRAL EAST 65.10 0 0 0MOSES SOUTH 29.09 0 0 0
TOTAL EAST 60.30 0 0 0CONED-LILCO 98.99 67044 65.4 7974LILCO-IMPORT 87.74 0 0 0
DYSINGER EAST 60.78 0 0 0WEST CENTRAL 69.51 12822 22.1 1343
SPR/DUNW SOUTH 97.24 27309 107.9 3185UPNY SENY 77.10 7567 31.6 1264
UPNY CONED 92.74 20204 85.4 2020
Expansion Value
($/MW-yr)
LoadingFactor
(%)Interface Name
CongestionHours
(Hrs/yr)
PathCost
(M$/yr)
Reference [1] - “Economic Evaluation of Transmission Congestion Relief Based on Power MarketSimulations”, IEEE PES General Meeting, Toronto, Canada, July 2003.

©AB
B In
c.
NYCA Interface Congestion Analysis
on 31372 30.6 3938off 35672 34.8 4036on 7293 12.6 845off 5529 9.5 498on 9085 35.9 1014off 18224 72.0 2171on 7235 30.2 1155off 333 1.4 109on 19483 82.3 1935off 722 3.0 85
UPNY CONED
Expansion Value
($/MW-yr)
System Peak Hour
(on/off) Interface Name
CONED-LILCO
WEST CENTRAL
SPR/DUNW SOUTH
CongestionHours
(Hrs/yr)
PathCost
(M$/yr)
UPNY SENY
Reference [1] - “Economic Evaluation of Transmission Congestion Relief Based on Power MarketSimulations”, IEEE PES General Meeting, Toronto, Canada, July 2003.

©AB
B In
c.
Heavily Loaded NYCA Interface Components
SPRBROOK W 49 ST 4951 98.76 SPR/DUNW SOUTHDUNWODIE RAINEY 2023 96.48 SPR/DUNW SOUTHTREMONT PARK TR1 5727 99.12 SPR/DUNW SOUTHDUNWODIE DUN NO 3760 97.78 SPR/DUNW SOUTHSPRBROOK REACBUS 5877 89.96 CONED-LILCODUNWODIE SHORE RD 5639 99.24 CONED-LILCO
SPRBROOK W 49 ST 188182 138.4 SPR/DUNW SOUTHDUNWODIE RAINEY 62885 42.7 SPR/DUNW SOUTHTREMONT PARK TR1 27330 5.6 SPR/DUNW SOUTHDUNWODIE DUN NO 27219 7.9 SPR/DUNW SOUTHSPRBROOK REACBUS 46847 29.4 CONED-LILCODUNWODIE SHORE RD 43109 24.5 CONED-LILCO
Interface NameFrom Bus To BusExpansion
Value ($/MW-yr)
PathCost
(M$/yr)
Interface NameFrom Bus To BusCongestion
Hours(Hrs/yr)
LoadingFactor
(%)
Reference [1] - “Economic Evaluation of Transmission Congestion Relief Based on Power MarketSimulations”, IEEE PES General Meeting, Toronto, Canada, July 2003.

©AB
B In
c.
NYCA Interface Upgrade Options
Interface MW (M$/yr) (%) 1 WEST CENTRAL 100 2638.5 2.14 0.082 CONED-LILCO 90 2632.4 8.21 0.313 SPR/DUNW SOUTH 150 2631.9 8.70 0.334 SPR/DUNW SOUTH 150 2636.9 3.69 0.145 2+3 90+150 2625.3 15.31 0.58
Congestion CostSavings
ProductionCostCapacity ImprovementOption
∆ (M$/yr)
Reference [1] - “Economic Evaluation of Transmission Congestion Relief Based on Power MarketSimulations”, IEEE PES General Meeting, Toronto, Canada, July 2003.

©AB
B In
c.
Impact of SPR/DUNW Interface Upgrades
Load AreaTotal
Generation(MWh)
GenerationReveune
(M$)
GenerationCost(M$)
Load Payment
(M$)
Average LMP
($/MWh)
Capital 174957 6.2 5.0 2.0 0.13NY City -666616West 15819 1.7 0.4 0.6 0.04Central 123565 5.9 3.8 0.8 0.05Dunwoodie 0 0.1 0.0 -1.8 -0.42Genessee 1493 0.3 0.0 0.3 0.04Hudson Valley 322329 16.7 9.6 7.7 0.61Long Island 20967 1.4 1.0 1.4 0.08Millwood 0 40.6 0.0 10.9 2.48Mohawk Valley 1937 0.3 0.1 0.5 0.06North 5548 0.7 0.2 0.4 0.06Total 0 49.9 -8.7 1.6
-23.9 -28.8 -21.2 -0.39
Reference [1] - “Economic Evaluation of Transmission Congestion Relief Based on Power MarketSimulations”, IEEE PES General Meeting, Toronto, Canada, July 2003.

©AB
B In
c.
Interconnection Options and Benefits
Location MW (M$/yr) (%) 1 W49 ST 800 2551.2 89.40 3.392 RAINEY 600 2571.1 69.50 2.63
Option NY City InjectionProduction
(M$/yr)
Congestion CostSavingsCost
Reference [1] - “Economic Evaluation of Transmission Congestion Relief Based on Power MarketSimulations”, IEEE PES General Meeting, Toronto, Canada, July 2003.

©AB
B In
c.
© A
BB C
onsu
lting
-
1
Fairfield
Queens
Nassau
Norwalk
New York
Bergen
10%
96%
42%
92%
44%
62%
47%
40%
- Around New York City -Tuesday, July 15, 2005
($/MWh)
$42.5
$54.8
$40.3$45.2
$42.6
•LMP Forecast•Congestion Assessment
•Line Loading Evaluation
LMP and Transmission Utilization Screening

©AB
B In
c.
Contact Information
ABB Consulting Business Unit:Http://www.abb.com/PowerT&D
Dr. Henry Chao (for General Information):Email: [email protected]: (919)856-2394Fax: (919)807-5060
Dr. Lan Trinh (for Technical Consultation):Email: [email protected]: (919)856-3922Fax: (919)807-5060
Mailing Address:940 Main Campus Drive, Suite 300Raleigh, NC 27606U.S.A.