Embed Size (px)
Citation preview
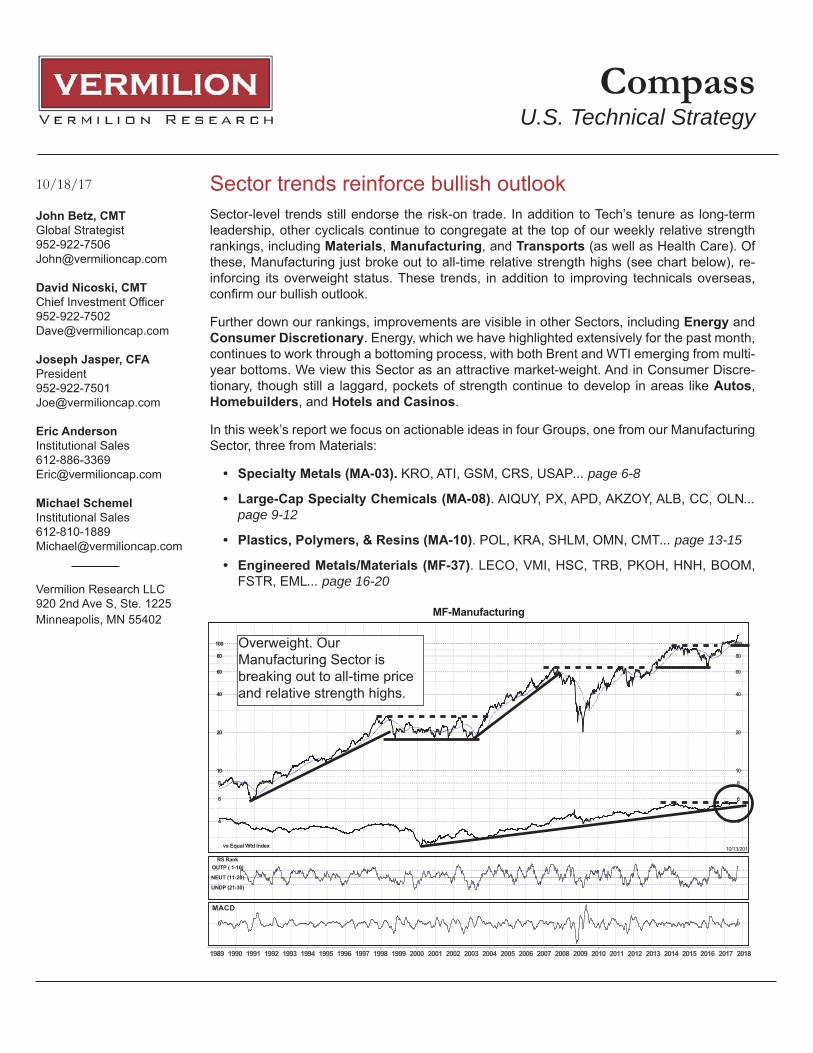
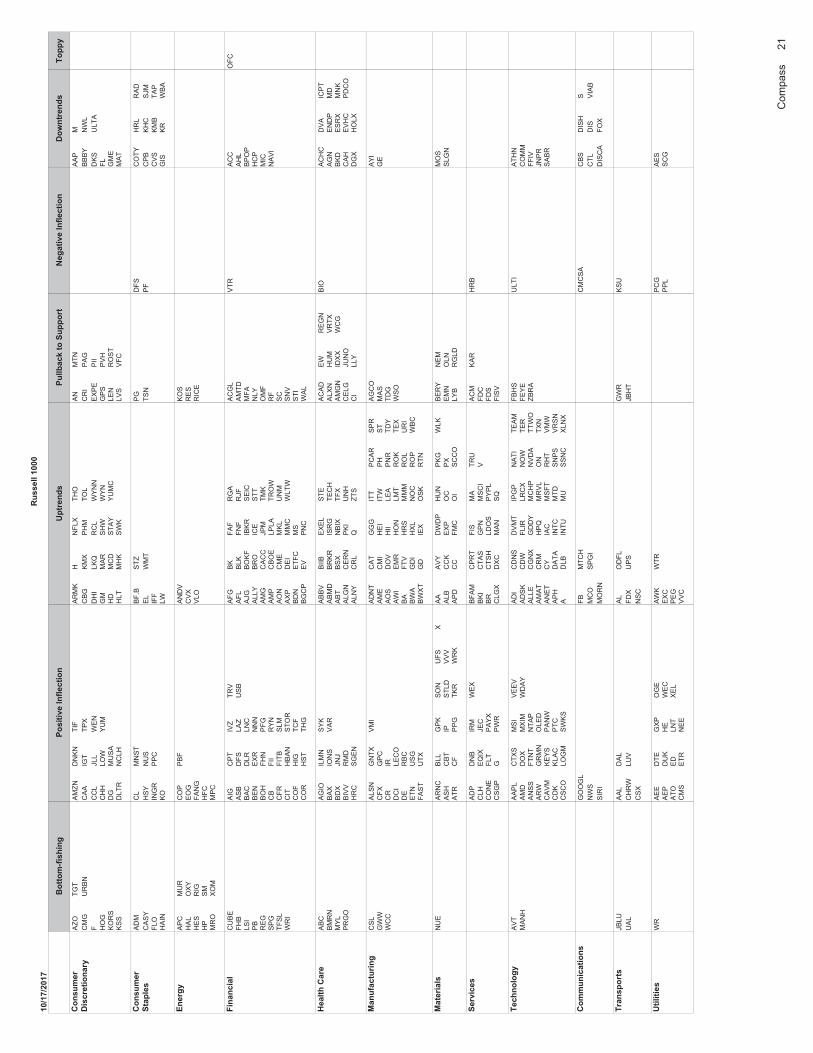
10/18/17 Sector trends reinforce bullish outlookSector-level trends still endorse the risk-on trade. In addition to Tech’s tenure as long-term leadership, other cyclicals continue to congregate at the top of our weekly relative strength rankings, including Materials, Manufacturing, and Transports (as well as Health Care). Of these, Manufacturing just broke out to all-time relative strength highs (see chart below), re-inforcing its overweight status. These trends, in addition to improving technicals overseas,
Further down our rankings, improvements are visible in other Sectors, including Energy and Consumer Discretionary. Energy, which we have highlighted extensively for the past month, continues to work through a bottoming process, with both Brent and WTI emerging from multi-year bottoms. We view this Sector as an attractive market-weight. And in Consumer Discre-tionary, though still a laggard, pockets of strength continue to develop in areas like Autos, Homebuilders, and Hotels and Casinos.
In this week’s report we focus on actionable ideas in four Groups, one from our Manufacturing Sector, three from Materials:
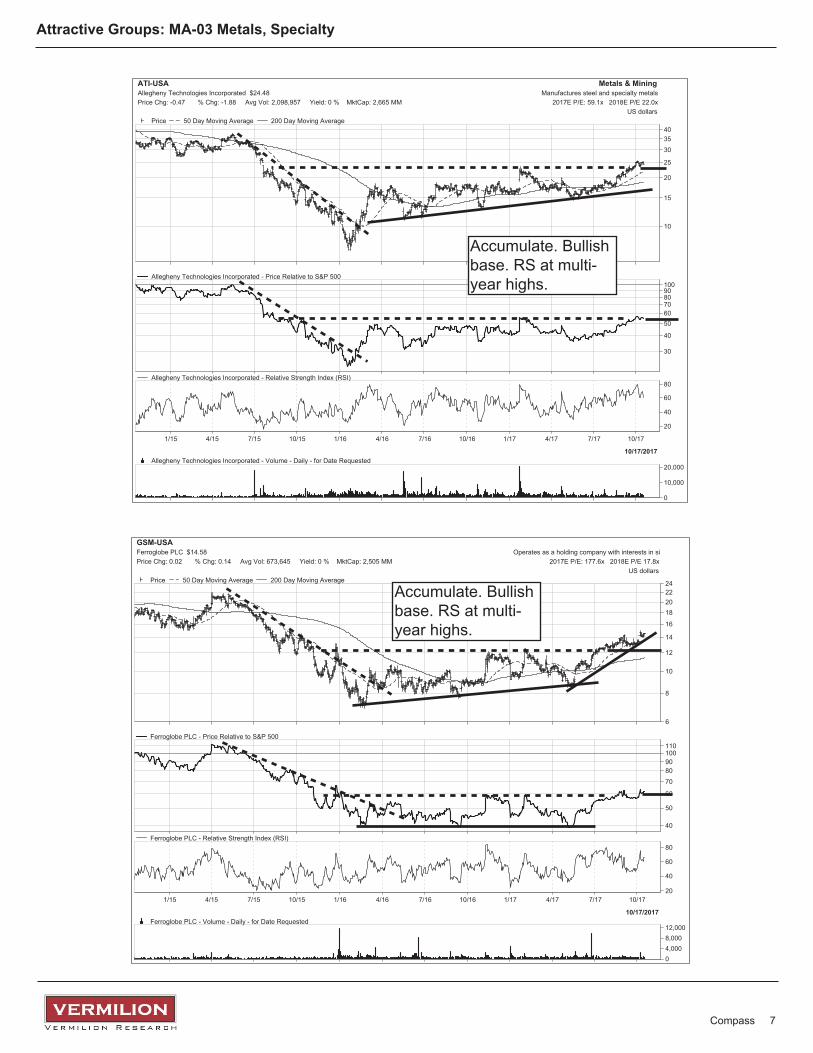
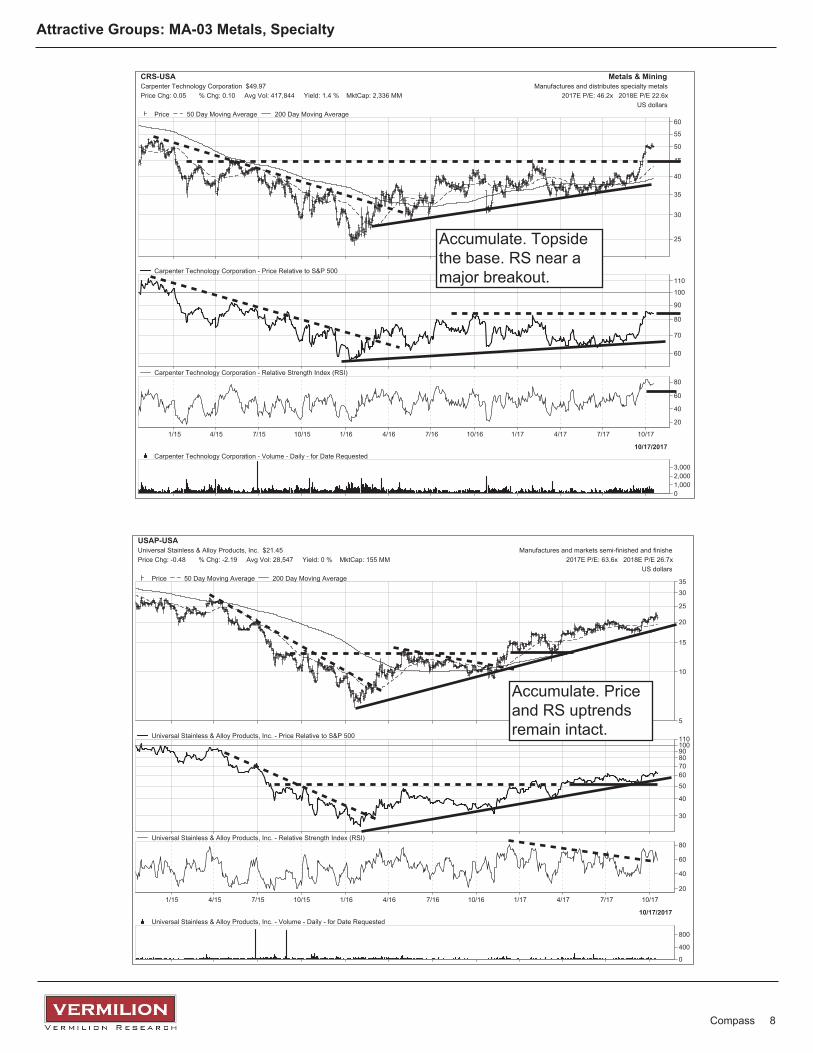
• Specialty Metals (MA-03). KRO, ATI, GSM, CRS, USAP... page 6-8
• Large-Cap Specialty Chemicals (MA-08). AIQUY, PX, APD, AKZOY, ALB, CC, OLN... page 9-12
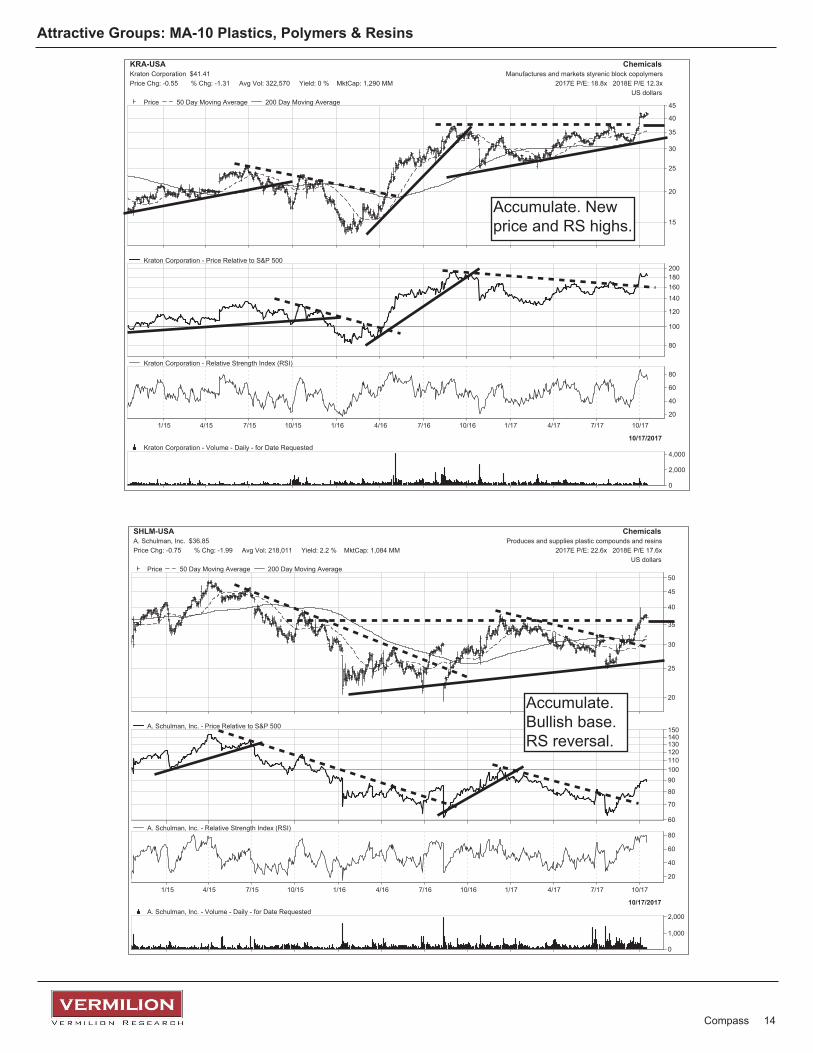
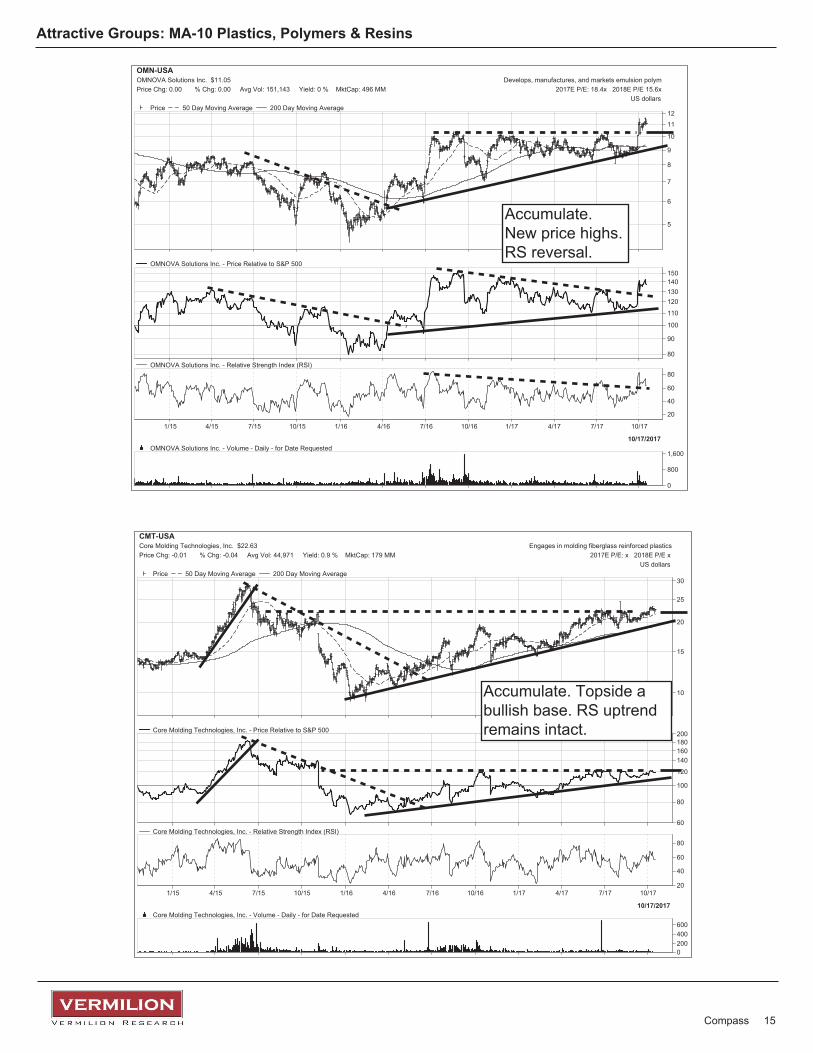
• Plastics, Polymers, & Resins (MA-10). POL, KRA, SHLM, OMN, CMT... page 13-15
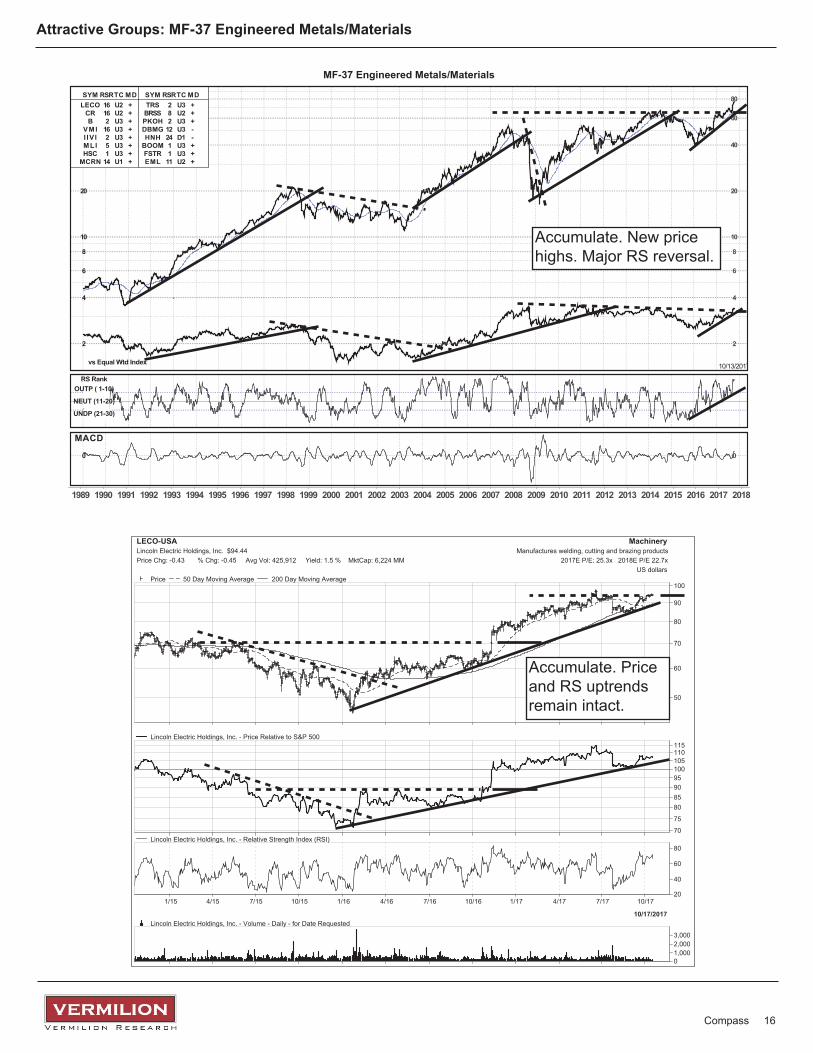
• Engineered Metals/Materials (MF-37). LECO, VMI, HSC, TRB, PKOH, HNH, BOOM, FSTR, EML... page 16-20
John Betz, CMTGlobal [email protected]
David Nicoski, CMT
Joseph Jasper, CFAPresident [email protected]
Eric AndersonInstitutional [email protected]
Michael SchemelInstitutional [email protected]
Vermilion Research LLC920 2nd Ave S, Ste. 1225Minneapolis, MN 55402
CompassU.S. Technical Strategy
MF-Manufacturing
1989 1990 1991 1992 1993 1994 1995 1996 1997 1998 1999 2000 2001 2002 2003 2004 2005 2006 2007 2008 2009 2010 2011 2012 2013 2014 2015 2016 2017 2018
4 4
6 6
8 8
10 10
20 20
40 40
60 60
80 80
100 100
vs Equal Wtd Index 10/13/2017
RS RankOUTP ( 1-10)
NEUT (11-20)
UNDP (21-30)
MACD
0 0
Overweight. OurManufacturing Sector isbreaking out to all-time priceand relative strength highs.
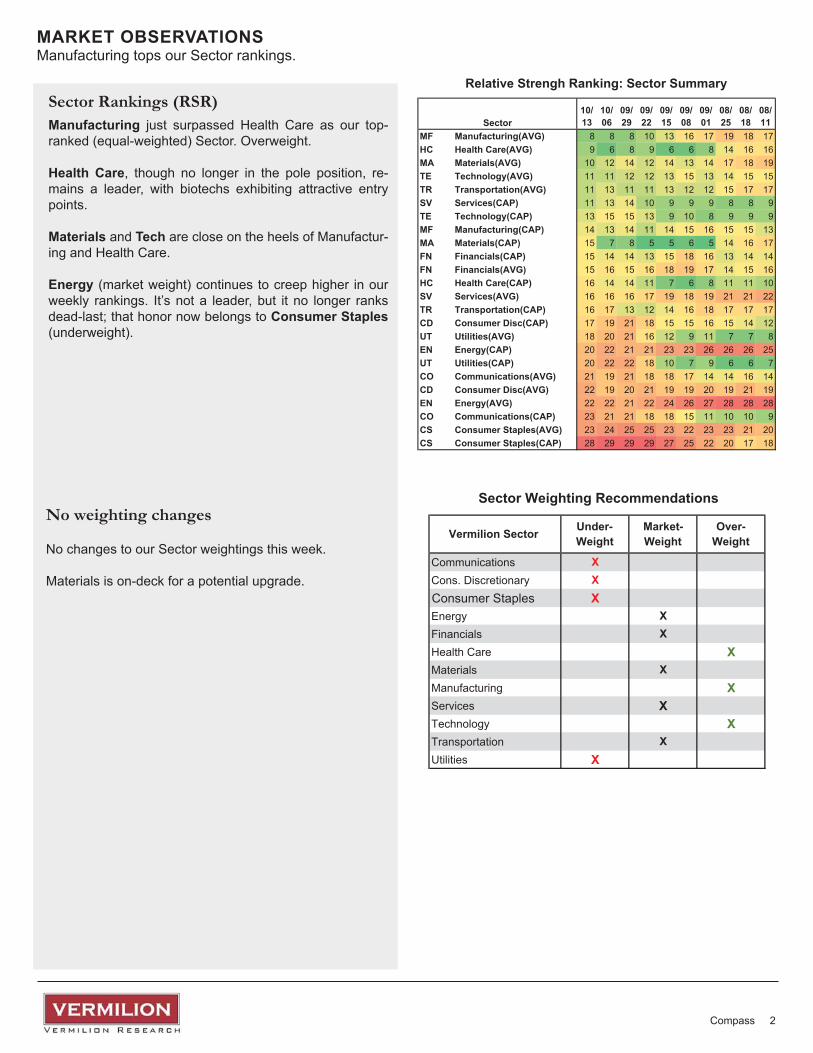
MARKET OBSERVATIONS Manufacturing tops our Sector rankings.
Sector Rankings (RSR)Manufacturing just surpassed Health Care as our top-ranked (equal-weighted) Sector. Overweight.
Health Care, though no longer in the pole position, re-mains a leader, with biotechs exhibiting attractive entry points.
Materials and Tech are close on the heels of Manufactur-ing and Health Care.
Energy (market weight) continues to creep higher in our weekly rankings. It’s not a leader, but it no longer ranks dead-last; that honor now belongs to Consumer Staples (underweight).
No weighting changes
No changes to our Sector weightings this week.
Materials is on-deck for a potential upgrade.
Compass 2
Sector Highlights
Communications: Underweight
RS remains mediocre.
GOOG, GOOGL, BIDU, BABA, YNDX, IAC and BCOR.SPGI, MCO, MORN.
EBAY, WUBA, ATHM, BITA, GRPN, WBMD, ETSY, BZUN, RATE, SFUN, LPSN, ANGI, LLNW, XNET, TTGT, QNST, FB, WB, YELP, YY, ZNGA and MTCH.
Consumer Discretionary: Underweight • • GM is leading this campaign in the U.S., and F
• MAR, HLT, WYN, HGV, VAC.•
Consumer Staples: Underweight• GIS• PPC, TSN, WMT, CL, MNST, and KO.
Energy: Market Weight•
CVX, RDS.A, BP, STO, COP, EOG, OXY, PBR, CNQ, REPYY, APC, DVN, CXO, PDCE, MTDR, SM, SLB, HAL, RES, NR, OII, PTEN, and NBR.
• PSX, VLO, MPC, ANDV, HFC, PBF, CVI, CVRR, ALDW and CLMT.
Financials: Market Weight• -
ITUB, BBD, BAP, BCH, BSAC, BMA, BSMX, and GGAL.
-clude RY, TD, BNS, BMO and CM.
BLK, STT, AMP, TROW, AMG, SEIC, APO, EV, LPLA and FII.
JPM, C, GS, MS, SCHW, CS, AMTD, ETFC, BGCP, SF, MD, HLI, ITG, LTS, & COWN.
MMC, AON, WLTW, AJG, BRO, EHTH, HIRQ, MFC, AFL, SLF, AEG, KMPR, AZSEY, AXAHY, ING, HIG, CB, TRV, ALL, PGR, MKL, FNF, CINF, FAF, NAVG, MBI, SAFT, FNFV, KNSL, and TRUP.
MTG, RDN, ESNT, and NMIH.
PLD, DCT, DFT, FR, EGP, STAG, REXR, TRNO, MNR, and HIFR.
Compass 3
Sector Highlights
Health Care: Overweight• Health Care ranks just behind Manufacturing, followed closely by Materials, Manufacturing, Tech, and Transports.• Biotechs remain a favorite theme, and recent comments by Trump relating to drug prices helped create attractive
pullback opportunities in names like AMGN, CELG, GILD, ALXN, NBIX and NKTR.• Pharma, led by JNJ (breaking out), exhibits continued improvements. Other actionable names: PFE, LLY, & AERI.• Actionable med device charts: ATRI, BAX, BDX, CMD, EW, HRC, IDXX, IVC, OMCL, PEN, RMD, and SYK.
Manufacturing: Overweight • Aero defense related names continue to dominate the Sector in terms of relative strength. Attractive names include:
BA, LMT, RTN, NOC, HII, ESLT, IIVI, AJRD, AVAV, TDG, TXT, SPR, OA, TDY, ERJ, HEI.A, HEI, CVU, SPA, COL, HRS, LLL, DGI, GOGO, CMTL, MOG.A, KTOS, and MOG.B.
ETN, AXL, DAN, VC, DLPH, CPS, MGA, LEA, ALV, BWA, WBC, ADNT, LCII, MTOR, FOXF, MOD, BLDP, and SPAR.
• Our Trucks and Components Group (MF-14) is breaking to historical price highs, and RS continues to point in a northerly direction. Attractive names include: CMI, PCAR, OSK, NAV, RUSHA, WNC, CYD, PLOW, BLBD, RUSHB, STS and MLR.
include: TRN, GBX, TPIC, FSTR and RAIL. • Construction Equipment is another leadership Group with many technically attractive names: CAT, CAE, TEX,
RUSHA, MTW, ALG, HY, and CMCO.• Instrumentation and Process Controls is another standout in the Sector. Attractive names include: DHR, ROP, FTV,
ROK, AME, THR and BMI. • Industrial Rental Equipment (Group MF-30) is breaking to new highs with names such as URI, HRI, HEES and
NEFF leading the way. -
pected surge in demand from Irma. Attractive names include: MAS, OC, USG, JELD, BECN, AWI, TREX, SSD, BLD, BLDR, and IBP.
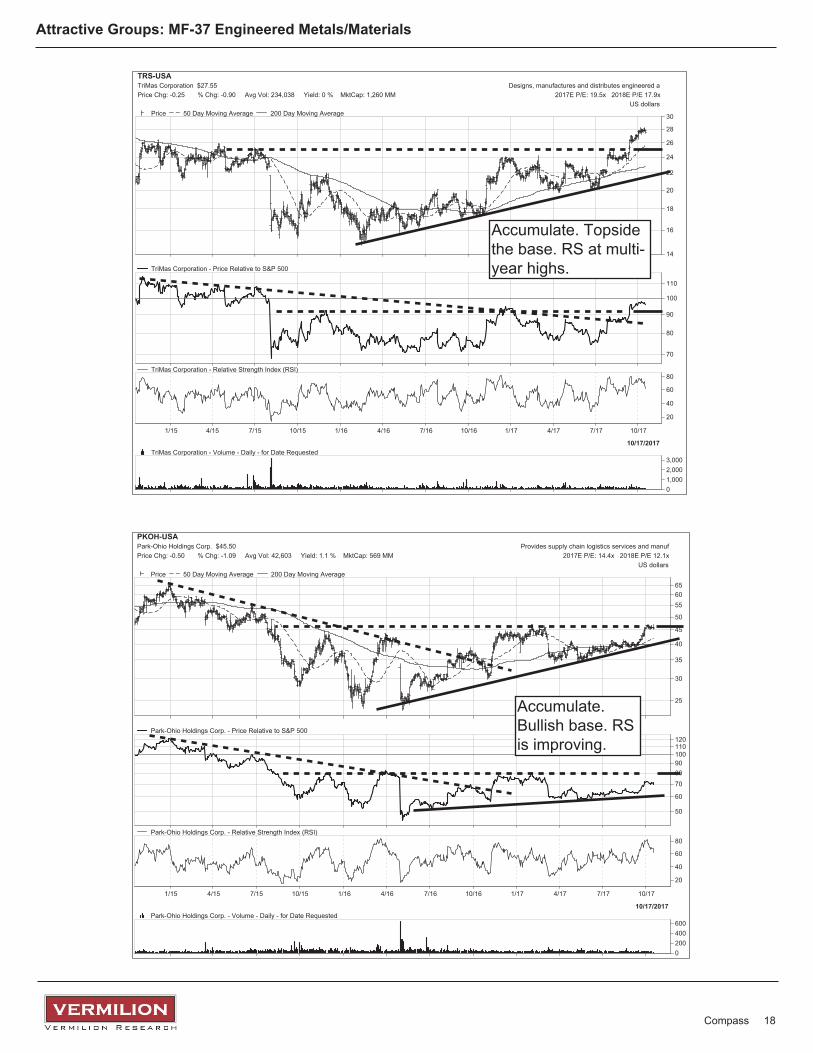
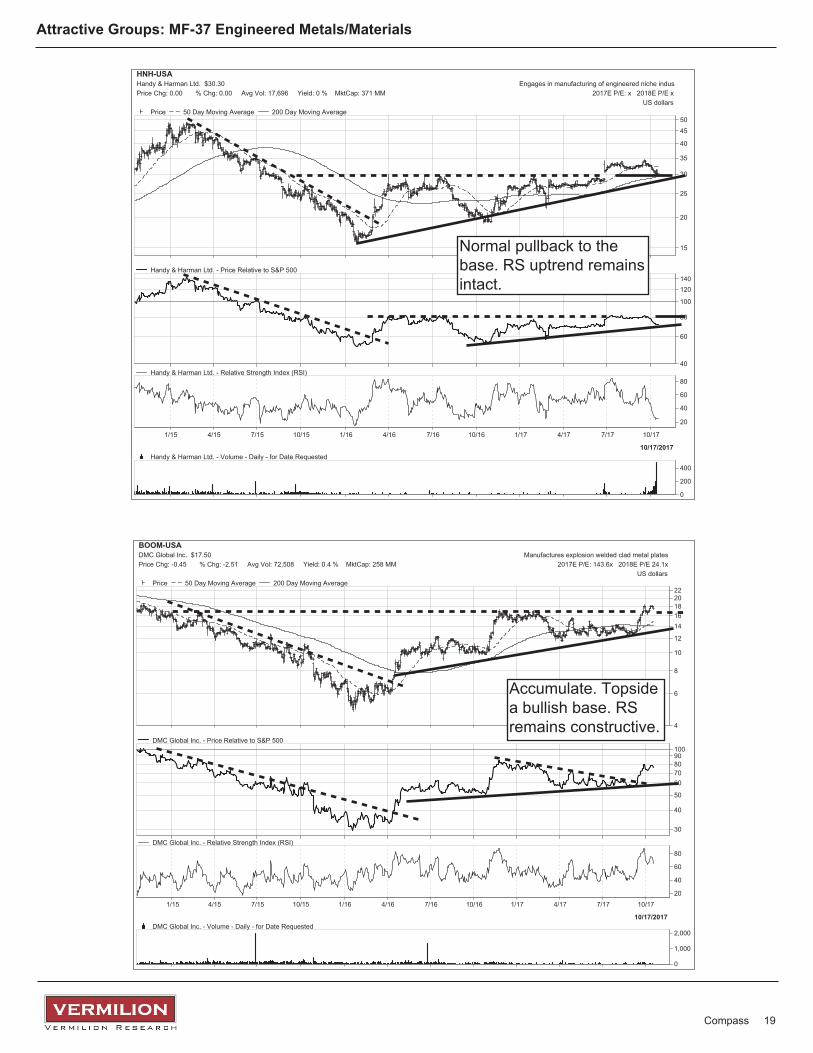
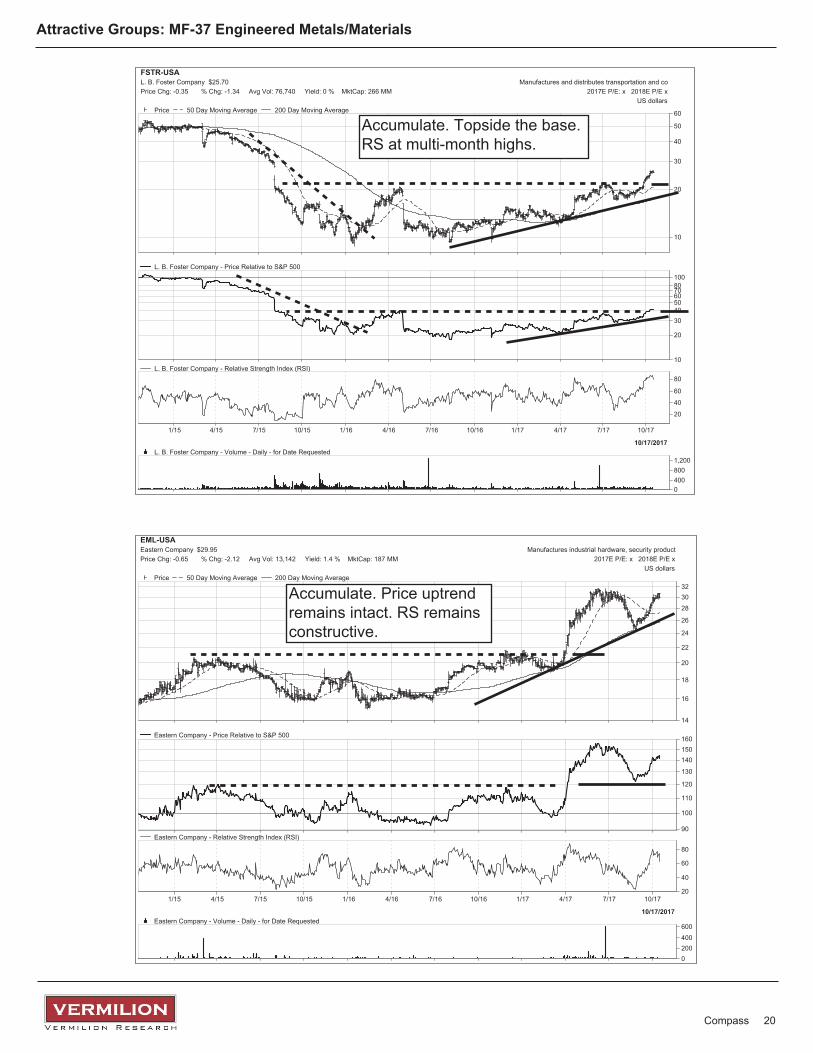
• Group MF-37 Engineered Metals /Materials is breaking a long-term price and RS downtrend. This group is featured in this week’s compass. Attractive names: LECO, B, VMI, IIVI, MCRN, HSC, MCRN, TRS, BRSS, PKOH.
Materials: Market Weight• Non-U.S. Steel is a leadership group. Attractive names include: RIO, MT, PKX, TX, GGB, and SID.• Specialty metals and Aluminum are also leadership. Attractive names include: KRO, ATI, GSM, CRS, NHYDY,
AA, AWCNY, ACH, CENX, KALU and CSTM. • Chemicals continue to plod ahead and contain many technically attractive names, such as: DWDP, BASFY, DD,
LYB, CE, EMN, FMC, HUN, WLK, MEOH, BAK, SHI, OEC, APD, AKZOY, AIQUY, PX, ALB, and CC.•
the aftermath of Irma. Attractive names include: WY, IP, LPX, UFS, BCC, and DEL. • BHP, RIO, BBL, NGLOY, and TECK.• SCCO, FCX, TECK,
TRQ, LUNMF, and TGB.• Gold Miners appear to be carving out a bottom and look to be turning up at a major area of support. Attractive names
that have pulled back to support include: NEM, ABX, FNV, GG, AEM, RGLD, KGC, BVN, IAG, AUY, BTG, NGD, AGI, NG, MUX, SA, RIC, TGB, GOLD, and GFI.
Services: Market Weight• Services continues to hover in the middle of our weekly relative strength rankings, reinforcing our market weight.• Our Data Processing Groups contain actionable breakouts: FLT, WEX (10-month base), G, & SYNT.• VRNT, CIGI, NSCC, and LAKE.
Compass 4
Sector Highlights
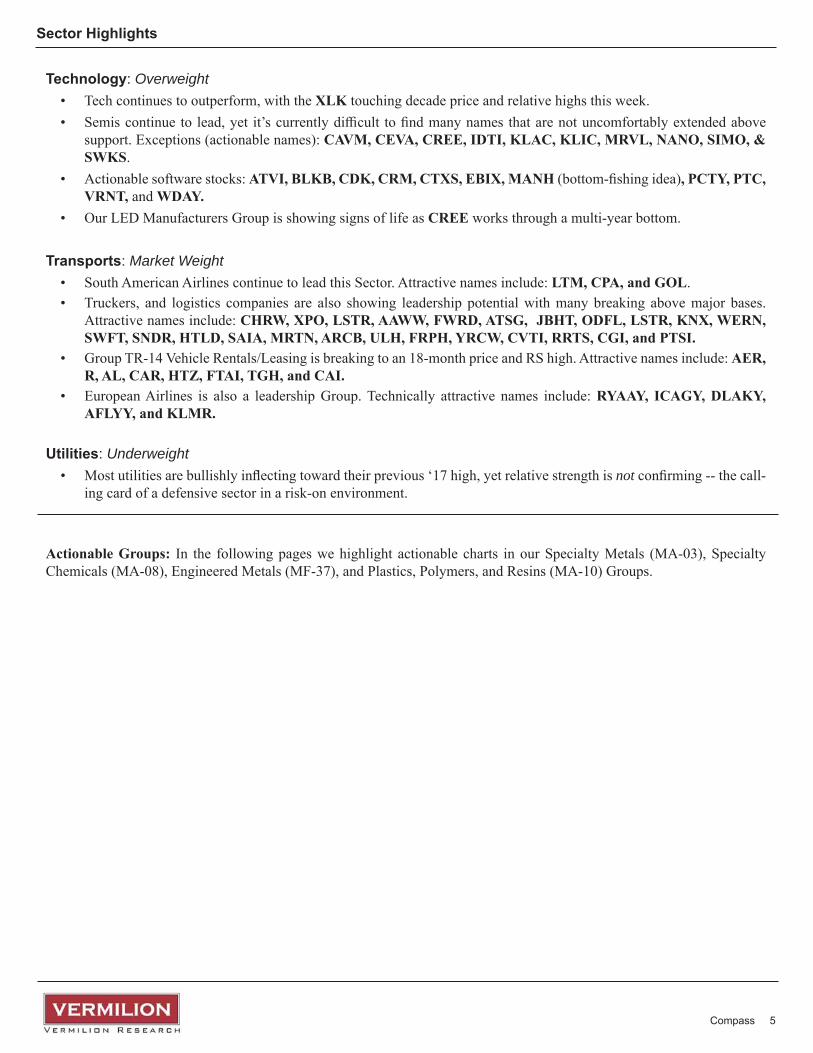
Technology: Overweight• XLK•
CAVM, CEVA, CREE, IDTI, KLAC, KLIC, MRVL, NANO, SIMO, & SWKS.
• ATVI, BLKB, CDK, CRM, CTXS, EBIX, MANH , PCTY, PTC, VRNT, and WDAY.
• CREE
Transports: Market Weight LTM, CPA, and GOL.
CHRW, XPO, LSTR, AAWW, FWRD, ATSG, JBHT, ODFL, LSTR, KNX, WERN, SWFT, SNDR, HTLD, SAIA, MRTN, ARCB, ULH, FRPH, YRCW, CVTI, RRTS, CGI, and PTSI.
AER, R, AL, CAR, HTZ, FTAI, TGH, and CAI.
RYAAY, ICAGY, DLAKY, AFLYY, and KLMR.
Utilities: Underweight• not -
Actionable Groups:
Compass 5
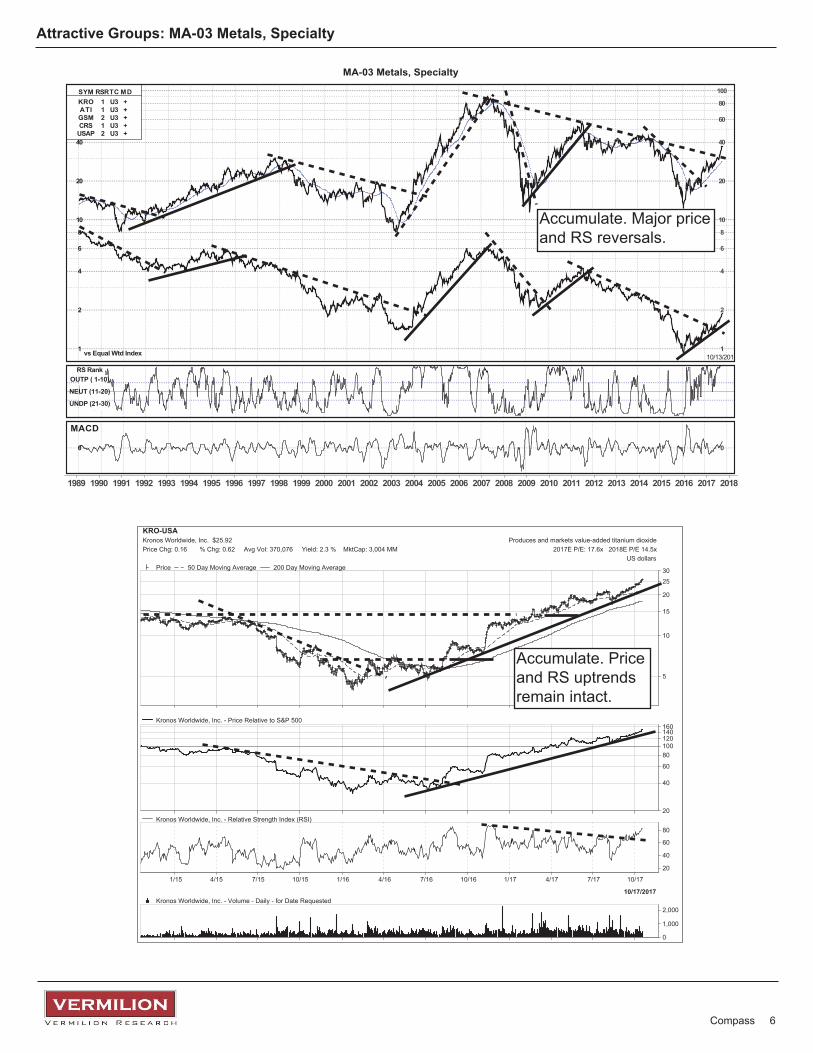
Attractive Groups: MA-03 Metals, Specialty
5
10
15
20
2530
KRO-USAKronos Worldwide, Inc. $25.92 Produces and markets value-added titanium dioxidePrice Chg: 0.16 % Chg: 0.62 Avg Vol: 370,076 Yield: 2.3 % MktCap: 3,004 MM 2017E P/E: 17.6x 2018E P/E 14.5x
US dollarsPrice 50 Day Moving Average 200 Day Moving Average
20
40
60
80100120140160
Kronos Worldwide, Inc. - Price Relative to S&P 500
1/15 4/15 7/15 10/15 1/16 4/16 7/16 10/16 1/17 4/17 7/17 10/17
20
40
60
80Kronos Worldwide, Inc. - Relative Strength Index (RSI)
0
1,000
2,000
10/17/2017Kronos Worldwide, Inc. - Volume - Daily - for Date Requested
MA-03 Metals, Specialty
1989 1990 1991 1992 1993 1994 1995 1996 1997 1998 1999 2000 2001 2002 2003 2004 2005 2006 2007 2008 2009 2010 2011 2012 2013 2014 2015 2016 2017 2018
2 2
4 4
6 6
8 8
10 10
20 20
40 40
60 60
80 80
100 100
1 1
SYM RSRTC MDKRO 1 U3 +ATI 1 U3 +GSM 2 U3 +CRS 1 U3 +
USAP 2 U3 +
vs Equal Wtd Index 10/13/2017
RS RankOUTP ( 1-10)
NEUT (11-20)
UNDP (21-30)
MACD
0 0
Compass 6
Accumulate. Major priceand RS reversals.
Accumulate. Priceand RS uptrendsremain intact.
Attractive Groups: MA-03 Metals, Specialty
6
8
10
12
14
16
18202224
GSM-USAFerroglobe PLC $14.58 Operates as a holding company with interests in siPrice Chg: 0.02 % Chg: 0.14 Avg Vol: 673,645 Yield: 0 % MktCap: 2,505 MM 2017E P/E: 177.6x 2018E P/E 17.8x
US dollarsPrice 50 Day Moving Average 200 Day Moving Average
40
50
60
708090100110
Ferroglobe PLC - Price Relative to S&P 500
1/15 4/15 7/15 10/15 1/16 4/16 7/16 10/16 1/17 4/17 7/17 10/1720
40
60
80Ferroglobe PLC - Relative Strength Index (RSI)
04,0008,00012,000
10/17/2017Ferroglobe PLC - Volume - Daily - for Date Requested
10
15
20
25
303540
ATI-USA Metals & MiningAllegheny Technologies Incorporated $24.48 Manufactures steel and specialty metalsPrice Chg: -0.47 % Chg: -1.88 Avg Vol: 2,098,957 Yield: 0 % MktCap: 2,665 MM 2017E P/E: 59.1x 2018E P/E 22.0x
US dollarsPrice 50 Day Moving Average 200 Day Moving Average
30
40
5060708090100
Allegheny Technologies Incorporated - Price Relative to S&P 500
1/15 4/15 7/15 10/15 1/16 4/16 7/16 10/16 1/17 4/17 7/17 10/17
20
40
60
80Allegheny Technologies Incorporated - Relative Strength Index (RSI)
0
10,000
20,000
10/17/2017Allegheny Technologies Incorporated - Volume - Daily - for Date Requested
Compass 7
Accumulate. Bullishbase. RS at multi-year highs.
Accumulate. Bullishbase. RS at multi-year highs.
Attractive Groups: MA-03 Metals, Specialty
5
10
15
20
25
3035
USAP-USAUniversal Stainless & Alloy Products, Inc. $21.45 Manufactures and markets semi-finished and finishePrice Chg: -0.48 % Chg: -2.19 Avg Vol: 28,547 Yield: 0 % MktCap: 155 MM 2017E P/E: 63.6x 2018E P/E 26.7x
US dollarsPrice 50 Day Moving Average 200 Day Moving Average
30
40
5060708090100110Universal Stainless & Alloy Products, Inc. - Price Relative to S&P 500
1/15 4/15 7/15 10/15 1/16 4/16 7/16 10/16 1/17 4/17 7/17 10/1720
40
60
80Universal Stainless & Alloy Products, Inc. - Relative Strength Index (RSI)
0
400
800
10/17/2017Universal Stainless & Alloy Products, Inc. - Volume - Daily - for Date Requested
25
30
35
40
45
50
55
60
CRS-USA Metals & MiningCarpenter Technology Corporation $49.97 Manufactures and distributes specialty metalsPrice Chg: 0.05 % Chg: 0.10 Avg Vol: 417,844 Yield: 1.4 % MktCap: 2,336 MM 2017E P/E: 46.2x 2018E P/E 22.6x
US dollarsPrice 50 Day Moving Average 200 Day Moving Average
60
70
80
90
100
110Carpenter Technology Corporation - Price Relative to S&P 500
1/15 4/15 7/15 10/15 1/16 4/16 7/16 10/16 1/17 4/17 7/17 10/17
20
40
60
80Carpenter Technology Corporation - Relative Strength Index (RSI)
01,0002,0003,000
10/17/2017Carpenter Technology Corporation - Volume - Daily - for Date Requested
Compass 8
Accumulate. Topsidethe base. RS near amajor breakout.
Accumulate. Priceand RS uptrendsremain intact.
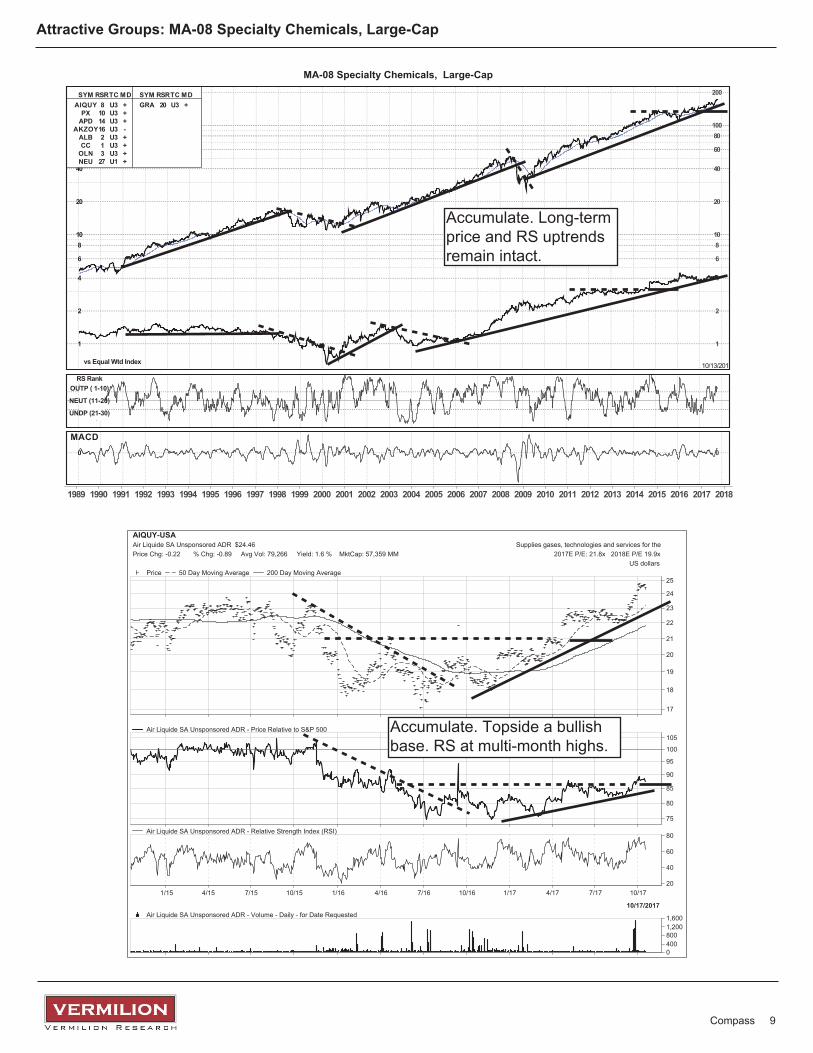
Attractive Groups: MA-08 Specialty Chemicals, Large-Cap
17
18
19
20
21
22
23
24
25
AIQUY-USAAir Liquide SA Unsponsored ADR $24.46 Supplies gases, technologies and services for thePrice Chg: -0.22 % Chg: -0.89 Avg Vol: 79,266 Yield: 1.6 % MktCap: 57,359 MM 2017E P/E: 21.8x 2018E P/E 19.9x
US dollarsPrice 50 Day Moving Average 200 Day Moving Average
75
80
85
90
95
100
105Air Liquide SA Unsponsored ADR - Price Relative to S&P 500
1/15 4/15 7/15 10/15 1/16 4/16 7/16 10/16 1/17 4/17 7/17 10/1720
40
60
80Air Liquide SA Unsponsored ADR - Relative Strength Index (RSI)
04008001,2001,600
10/17/2017Air Liquide SA Unsponsored ADR - Volume - Daily - for Date Requested
MA-08 Specialty Chemicals, Large-Cap
1989 1990 1991 1992 1993 1994 1995 1996 1997 1998 1999 2000 2001 2002 2003 2004 2005 2006 2007 2008 2009 2010 2011 2012 2013 2014 2015 2016 2017 2018
2 2
4 4
6 6
8 810 10
20 20
40 40
60 60
80 80100 100
200 200
1 1
SYM SYMRSR RSRTC TCMD MDAIQUY 8 U3 +
PX 10 U3 +APD 14 U3 +
AKZOY16 U3 -ALB 2 U3 +CC 1 U3 +
OLN 3 U3 +NEU 27 U1 +
GRA 20 U3 +
vs Equal Wtd Index 10/13/2017
RS RankOUTP ( 1-10)
NEUT (11-20)
UNDP (21-30)
MACD0 0
Compass 9
Accumulate. Long-termprice and RS uptrendsremain intact.
Accumulate. Topside a bullishbase. RS at multi-month highs.
Attractive Groups: MA-08 Specialty Chemicals, Large-Cap
110
120
130
140
150
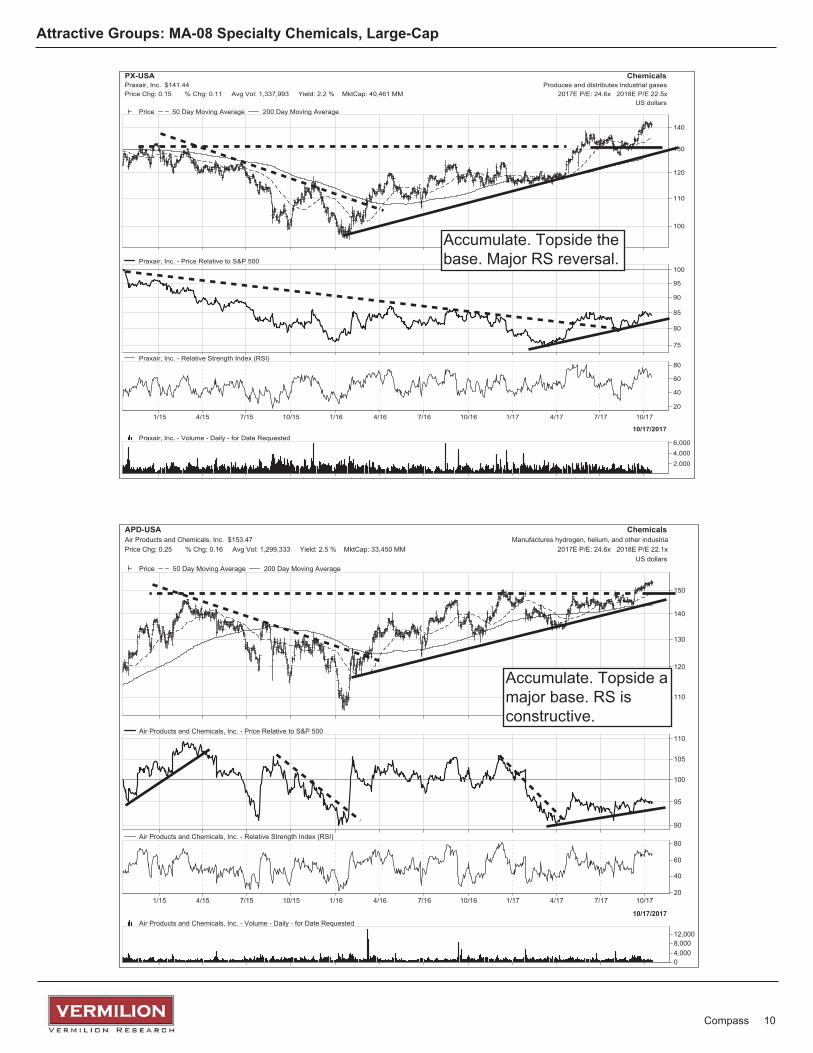
APD-USA ChemicalsAir Products and Chemicals, Inc. $153.47 Manufactures hydrogen, helium, and other industriaPrice Chg: 0.25 % Chg: 0.16 Avg Vol: 1,299,333 Yield: 2.5 % MktCap: 33,450 MM 2017E P/E: 24.6x 2018E P/E 22.1x
US dollarsPrice 50 Day Moving Average 200 Day Moving Average
90
95
100
105
110Air Products and Chemicals, Inc. - Price Relative to S&P 500
1/15 4/15 7/15 10/15 1/16 4/16 7/16 10/16 1/17 4/17 7/17 10/1720
40
60
80Air Products and Chemicals, Inc. - Relative Strength Index (RSI)
04,0008,00012,000
10/17/2017Air Products and Chemicals, Inc. - Volume - Daily - for Date Requested
100
110
120
130
140
PX-USA ChemicalsPraxair, Inc. $141.44 Produces and distributes industrial gasesPrice Chg: 0.15 % Chg: 0.11 Avg Vol: 1,337,993 Yield: 2.2 % MktCap: 40,461 MM 2017E P/E: 24.6x 2018E P/E 22.5x
US dollarsPrice 50 Day Moving Average 200 Day Moving Average
75
80
85
90
95
100Praxair, Inc. - Price Relative to S&P 500
1/15 4/15 7/15 10/15 1/16 4/16 7/16 10/16 1/17 4/17 7/17 10/1720
40
60
80Praxair, Inc. - Relative Strength Index (RSI)
2,0004,0006,000
10/17/2017Praxair, Inc. - Volume - Daily - for Date Requested
Compass 10
Accumulate. Topside thebase. Major RS reversal.
Accumulate. Topside amajor base. RS isconstructive.
Attractive Groups: MA-08 Specialty Chemicals, Large-Cap
40
60
80
100
120
140
160
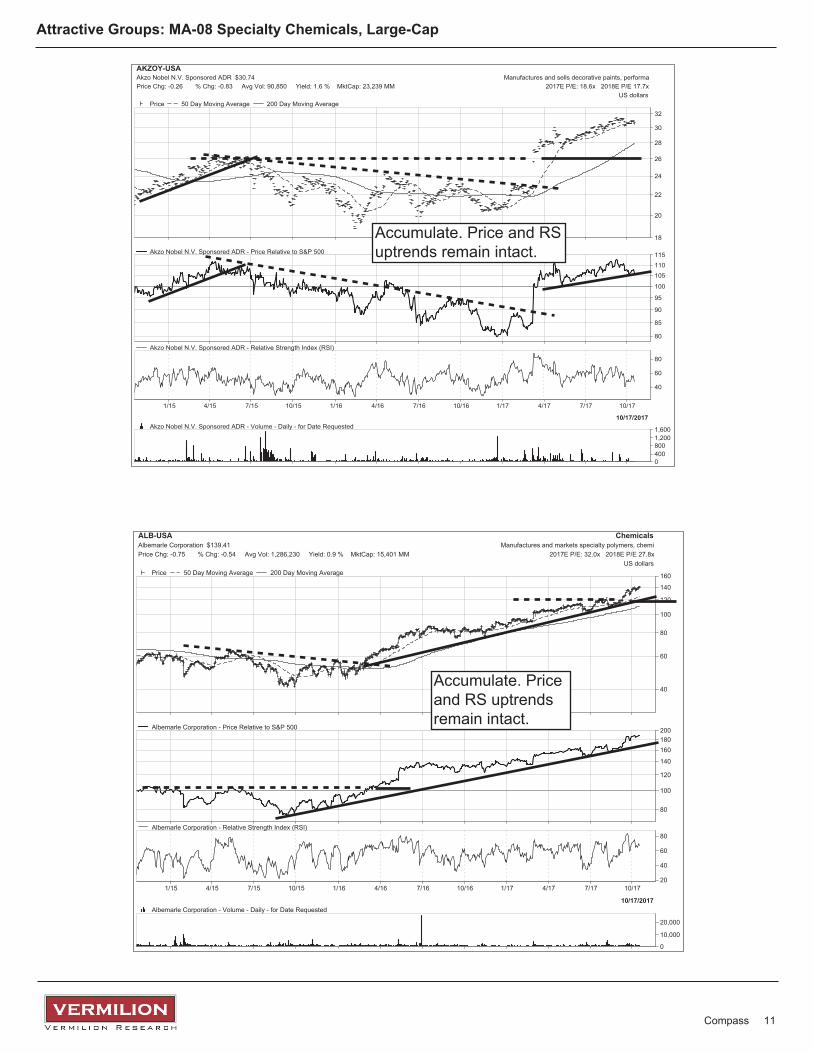
ALB-USA ChemicalsAlbemarle Corporation $139.41 Manufactures and markets specialty polymers, chemiPrice Chg: -0.75 % Chg: -0.54 Avg Vol: 1,286,230 Yield: 0.9 % MktCap: 15,401 MM 2017E P/E: 32.0x 2018E P/E 27.8x
US dollarsPrice 50 Day Moving Average 200 Day Moving Average
80
100
120
140
160180200Albemarle Corporation - Price Relative to S&P 500
1/15 4/15 7/15 10/15 1/16 4/16 7/16 10/16 1/17 4/17 7/17 10/1720
40
60
80Albemarle Corporation - Relative Strength Index (RSI)
0
10,000
20,000
10/17/2017Albemarle Corporation - Volume - Daily - for Date Requested
18
20
22
24
26
28
30
32
AKZOY-USAAkzo Nobel N.V. Sponsored ADR $30.74 Manufactures and sells decorative paints, performaPrice Chg: -0.26 % Chg: -0.83 Avg Vol: 90,850 Yield: 1.6 % MktCap: 23,239 MM 2017E P/E: 18.6x 2018E P/E 17.7x
US dollarsPrice 50 Day Moving Average 200 Day Moving Average
80
85
90
95
100
105110115Akzo Nobel N.V. Sponsored ADR - Price Relative to S&P 500
1/15 4/15 7/15 10/15 1/16 4/16 7/16 10/16 1/17 4/17 7/17 10/17
40
60
80
Akzo Nobel N.V. Sponsored ADR - Relative Strength Index (RSI)
04008001,2001,600
10/17/2017Akzo Nobel N.V. Sponsored ADR - Volume - Daily - for Date Requested
Compass 11
Accumulate. Price and RSuptrends remain intact.
Accumulate. Priceand RS uptrendsremain intact.
2
345678910
20
30405060
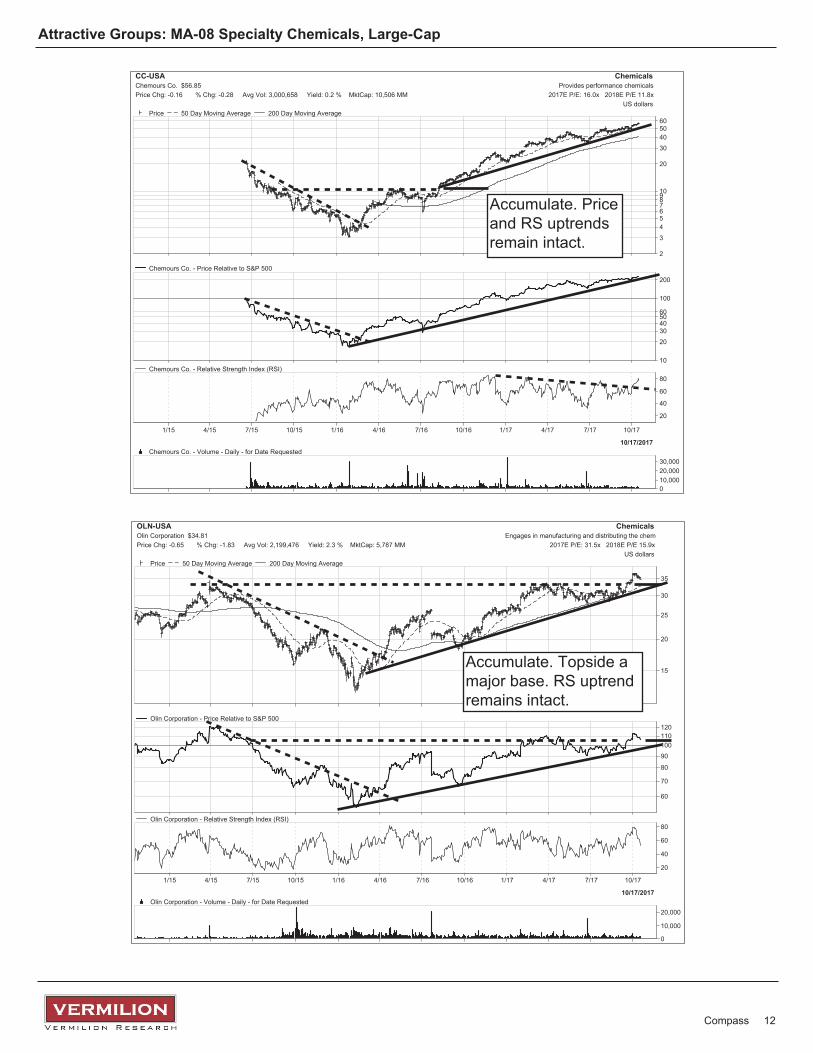
CC-USA ChemicalsChemours Co. $56.85 Provides performance chemicalsPrice Chg: -0.16 % Chg: -0.28 Avg Vol: 3,000,658 Yield: 0.2 % MktCap: 10,506 MM 2017E P/E: 16.0x 2018E P/E 11.8x
US dollarsPrice 50 Day Moving Average 200 Day Moving Average
10
2030405060
100
200
Chemours Co. - Price Relative to S&P 500
1/15 4/15 7/15 10/15 1/16 4/16 7/16 10/16 1/17 4/17 7/17 10/17
20
40
60
80Chemours Co. - Relative Strength Index (RSI)
010,00020,00030,000
10/17/2017Chemours Co. - Volume - Daily - for Date Requested
Attractive Groups: MA-08 Specialty Chemicals, Large-Cap
15
20
25
30
35
OLN-USA ChemicalsOlin Corporation $34.81 Engages in manufacturing and distributing the chemPrice Chg: -0.65 % Chg: -1.83 Avg Vol: 2,199,476 Yield: 2.3 % MktCap: 5,787 MM 2017E P/E: 31.5x 2018E P/E 15.9x
US dollarsPrice 50 Day Moving Average 200 Day Moving Average
60
70
80
90100110120
Olin Corporation - Price Relative to S&P 500
1/15 4/15 7/15 10/15 1/16 4/16 7/16 10/16 1/17 4/17 7/17 10/17
20
40
60
80Olin Corporation - Relative Strength Index (RSI)
0
10,000
20,000
10/17/2017Olin Corporation - Volume - Daily - for Date Requested
Compass 12
Accumulate. Priceand RS uptrendsremain intact.
Accumulate. Topside amajor base. RS uptrendremains intact.
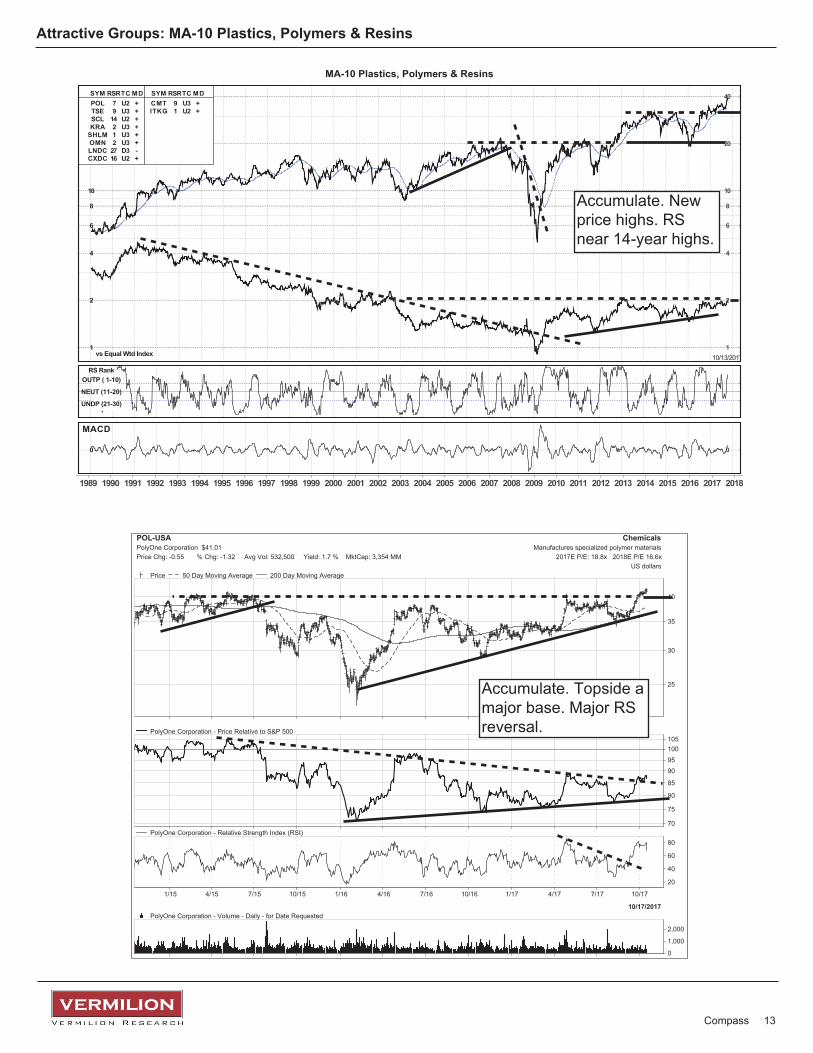
Attractive Groups: MA-10 Plastics, Polymers & Resins
25
30
35
40
POL-USA ChemicalsPolyOne Corporation $41.01 Manufactures specialized polymer materialsPrice Chg: -0.55 % Chg: -1.32 Avg Vol: 532,500 Yield: 1.7 % MktCap: 3,354 MM 2017E P/E: 18.8x 2018E P/E 16.6x
US dollarsPrice 50 Day Moving Average 200 Day Moving Average
70
75
80
85
9095100105
PolyOne Corporation - Price Relative to S&P 500
1/15 4/15 7/15 10/15 1/16 4/16 7/16 10/16 1/17 4/17 7/17 10/17
20
40
60
80PolyOne Corporation - Relative Strength Index (RSI)
0
1,000
2,000
10/17/2017PolyOne Corporation - Volume - Daily - for Date Requested
MA-10 Plastics, Polymers & Resins
1989 1990 1991 1992 1993 1994 1995 1996 1997 1998 1999 2000 2001 2002 2003 2004 2005 2006 2007 2008 2009 2010 2011 2012 2013 2014 2015 2016 2017 2018
2 2
4 4
6 6
8 8
10 10
20 20
40 40
1 1
SYM SYMRSR RSRTC TCMD MDPOL 7 U2 +TSE 9 U3 +SCL 14 U2 +KRA 2 U3 +
SHLM 1 U3 +OMN 2 U3 +LNDC 27 D3 -CXDC 16 U2 +
CMT 9 U3 +ITKG 1 U2 +
vs Equal Wtd Index 10/13/2017
RS RankOUTP ( 1-10)
NEUT (11-20)
UNDP (21-30)
MACD
0 0
Compass 13
Accumulate. Newprice highs. RSnear 14-year highs.
Accumulate. Topside amajor base. Major RSreversal.
Attractive Groups: MA-10 Plastics, Polymers & Resins
20
25
30
35
40
45
50
SHLM-USA ChemicalsA. Schulman, Inc. $36.85 Produces and supplies plastic compounds and resinsPrice Chg: -0.75 % Chg: -1.99 Avg Vol: 218,011 Yield: 2.2 % MktCap: 1,084 MM 2017E P/E: 22.6x 2018E P/E 17.6x
US dollarsPrice 50 Day Moving Average 200 Day Moving Average
60
70
80
90100110120130140150A. Schulman, Inc. - Price Relative to S&P 500
1/15 4/15 7/15 10/15 1/16 4/16 7/16 10/16 1/17 4/17 7/17 10/17
20
40
60
80A. Schulman, Inc. - Relative Strength Index (RSI)
0
1,000
2,000
10/17/2017A. Schulman, Inc. - Volume - Daily - for Date Requested
15
20
25
30
35
40
45
KRA-USA ChemicalsKraton Corporation $41.41 Manufactures and markets styrenic block copolymersPrice Chg: -0.55 % Chg: -1.31 Avg Vol: 322,570 Yield: 0 % MktCap: 1,290 MM 2017E P/E: 18.8x 2018E P/E 12.3x
US dollarsPrice 50 Day Moving Average 200 Day Moving Average
80
100
120
140160180200
Kraton Corporation - Price Relative to S&P 500
1/15 4/15 7/15 10/15 1/16 4/16 7/16 10/16 1/17 4/17 7/17 10/1720
40
60
80Kraton Corporation - Relative Strength Index (RSI)
0
2,000
4,000
10/17/2017Kraton Corporation - Volume - Daily - for Date Requested
Compass 14
Accumulate. Newprice and RS highs.
Accumulate.Bullish base.RS reversal.
Attractive Groups: MA-10 Plastics, Polymers & Resins
10
15
20
25
30
CMT-USACore Molding Technologies, Inc. $22.63 Engages in molding fiberglass reinforced plasticsPrice Chg: -0.01 % Chg: -0.04 Avg Vol: 44,971 Yield: 0.9 % MktCap: 179 MM 2017E P/E: x 2018E P/E x
US dollarsPrice 50 Day Moving Average 200 Day Moving Average
60
80
100
120
140160180200Core Molding Technologies, Inc. - Price Relative to S&P 500
1/15 4/15 7/15 10/15 1/16 4/16 7/16 10/16 1/17 4/17 7/17 10/1720
40
60
80
Core Molding Technologies, Inc. - Relative Strength Index (RSI)
0200400600
10/17/2017Core Molding Technologies, Inc. - Volume - Daily - for Date Requested
5
6
7
8
9
10
1112
OMN-USAOMNOVA Solutions Inc. $11.05 Develops, manufactures, and markets emulsion polymPrice Chg: 0.00 % Chg: 0.00 Avg Vol: 151,143 Yield: 0 % MktCap: 496 MM 2017E P/E: 18.4x 2018E P/E 15.6x
US dollarsPrice 50 Day Moving Average 200 Day Moving Average
80
90
100
110
120130140150
OMNOVA Solutions Inc. - Price Relative to S&P 500
1/15 4/15 7/15 10/15 1/16 4/16 7/16 10/16 1/17 4/17 7/17 10/17
20
40
60
80OMNOVA Solutions Inc. - Relative Strength Index (RSI)
0
800
1,600
10/17/2017OMNOVA Solutions Inc. - Volume - Daily - for Date Requested
Compass 15
Accumulate.New price highs.RS reversal.
Accumulate. Topside abullish base. RS uptrendremains intact.
Attractive Groups: MF-37 Engineered Metals/Materials
50
60
70
80
90
100
LECO-USA MachineryLincoln Electric Holdings, Inc. $94.44 Manufactures welding, cutting and brazing productsPrice Chg: -0.43 % Chg: -0.45 Avg Vol: 425,912 Yield: 1.5 % MktCap: 6,224 MM 2017E P/E: 25.3x 2018E P/E 22.7x
US dollarsPrice 50 Day Moving Average 200 Day Moving Average
70
75
80859095100105110115
Lincoln Electric Holdings, Inc. - Price Relative to S&P 500
1/15 4/15 7/15 10/15 1/16 4/16 7/16 10/16 1/17 4/17 7/17 10/1720
40
60
80Lincoln Electric Holdings, Inc. - Relative Strength Index (RSI)
01,0002,0003,000
10/17/2017Lincoln Electric Holdings, Inc. - Volume - Daily - for Date Requested
MF-37 Engineered Metals/Materials
1989 1990 1991 1992 1993 1994 1995 1996 1997 1998 1999 2000 2001 2002 2003 2004 2005 2006 2007 2008 2009 2010 2011 2012 2013 2014 2015 2016 2017 2018
2 2
4 4
6 6
8 8
10 10
20 20
40 40
60 60
80 80SYM SYMRSR RSRTC TCMD MDLECO 16 U2 +
CR 16 U2 +B 2 U3 +
VMI 16 U3 +I IV I 2 U3 +M L I 5 U3 +HSC 1 U3 +
MCRN 14 U1 +
TRS 2 U3 +BRSS 8 U2 +PKOH 2 U3 +DBMG 12 U3 -HNH 24 D1 -
BOOM 1 U3 +FSTR 1 U3 +EML 11 U2 +
vs Equal Wtd Index 10/13/2017
RS RankOUTP ( 1-10)
NEUT (11-20)
UNDP (21-30)
MACD
0 0
Compass 16
Accumulate. New pricehighs. Major RS reversal.
Accumulate. Priceand RS uptrendsremain intact.
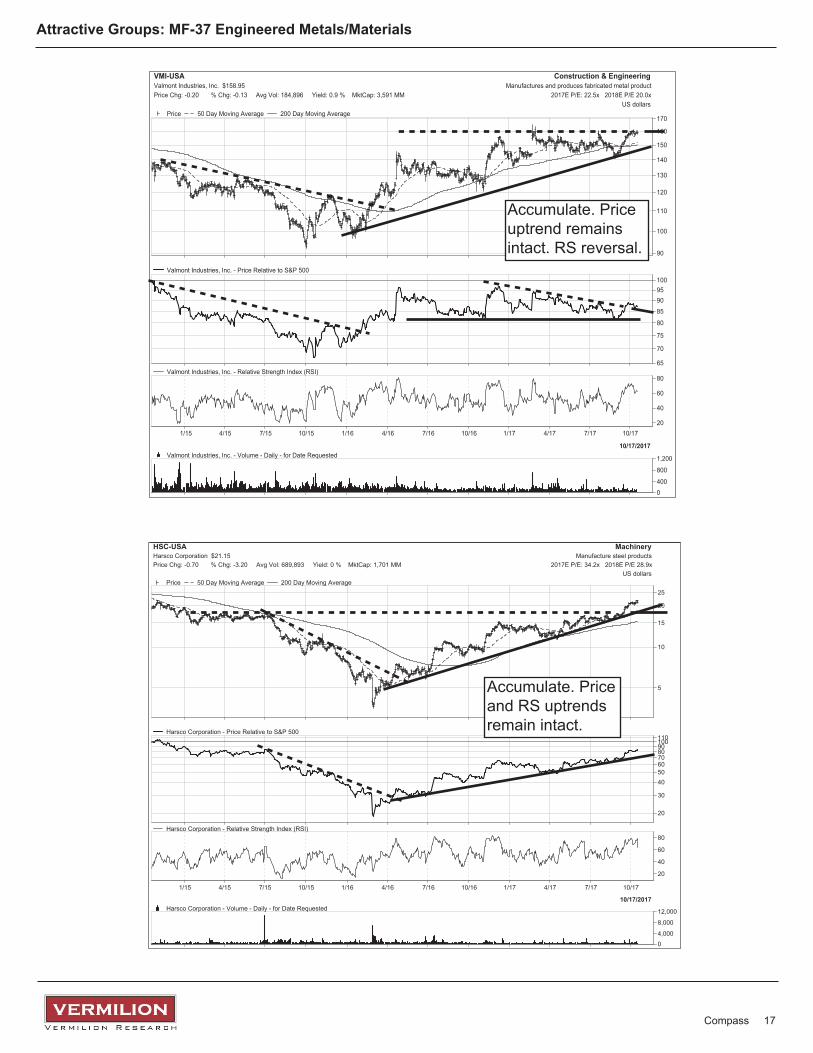
Attractive Groups: MF-37 Engineered Metals/Materials
5
10
15
20
25
HSC-USA MachineryHarsco Corporation $21.15 Manufacture steel productsPrice Chg: -0.70 % Chg: -3.20 Avg Vol: 689,893 Yield: 0 % MktCap: 1,701 MM 2017E P/E: 34.2x 2018E P/E 28.9x
US dollarsPrice 50 Day Moving Average 200 Day Moving Average
20
30
405060708090100110
Harsco Corporation - Price Relative to S&P 500
1/15 4/15 7/15 10/15 1/16 4/16 7/16 10/16 1/17 4/17 7/17 10/17
20
40
60
80Harsco Corporation - Relative Strength Index (RSI)
04,000
8,000
12,000
10/17/2017Harsco Corporation - Volume - Daily - for Date Requested
90
100
110
120
130
140
150
160
170
VMI-USA Construction & EngineeringValmont Industries, Inc. $158.95 Manufactures and produces fabricated metal productPrice Chg: -0.20 % Chg: -0.13 Avg Vol: 184,896 Yield: 0.9 % MktCap: 3,591 MM 2017E P/E: 22.5x 2018E P/E 20.0x
US dollarsPrice 50 Day Moving Average 200 Day Moving Average
65
70
75
80
859095100
Valmont Industries, Inc. - Price Relative to S&P 500
1/15 4/15 7/15 10/15 1/16 4/16 7/16 10/16 1/17 4/17 7/17 10/1720
40
60
80Valmont Industries, Inc. - Relative Strength Index (RSI)
0400
800
1,200
10/17/2017Valmont Industries, Inc. - Volume - Daily - for Date Requested
Compass 17
Accumulate. Priceuptrend remainsintact. RS reversal.
Accumulate. Priceand RS uptrendsremain intact.
25
30
35
40
45
50
556065
PKOH-USAPark-Ohio Holdings Corp. $45.50 Provides supply chain logistics services and manufPrice Chg: -0.50 % Chg: -1.09 Avg Vol: 42,603 Yield: 1.1 % MktCap: 569 MM 2017E P/E: 14.4x 2018E P/E 12.1x
US dollarsPrice 50 Day Moving Average 200 Day Moving Average
50
60
708090100110120
Park-Ohio Holdings Corp. - Price Relative to S&P 500
1/15 4/15 7/15 10/15 1/16 4/16 7/16 10/16 1/17 4/17 7/17 10/17
20
40
60
80Park-Ohio Holdings Corp. - Relative Strength Index (RSI)
0200400600
10/17/2017Park-Ohio Holdings Corp. - Volume - Daily - for Date Requested
14
16
18
20
22
24
26
28
30
TRS-USATriMas Corporation $27.55 Designs, manufactures and distributes engineered aPrice Chg: -0.25 % Chg: -0.90 Avg Vol: 234,038 Yield: 0 % MktCap: 1,260 MM 2017E P/E: 19.5x 2018E P/E 17.9x
US dollarsPrice 50 Day Moving Average 200 Day Moving Average
70
80
90
100
110
TriMas Corporation - Price Relative to S&P 500
1/15 4/15 7/15 10/15 1/16 4/16 7/16 10/16 1/17 4/17 7/17 10/17
20
40
60
80TriMas Corporation - Relative Strength Index (RSI)
01,0002,0003,000
10/17/2017TriMas Corporation - Volume - Daily - for Date Requested
Attractive Groups: MF-37 Engineered Metals/Materials
Compass 18
Accumulate. Topsidethe base. RS at multi-year highs.
Accumulate.Bullish base. RSis improving.
Attractive Groups: MF-37 Engineered Metals/Materials
4
6
8
10
12
1416182022
BOOM-USADMC Global Inc. $17.50 Manufactures explosion welded clad metal platesPrice Chg: -0.45 % Chg: -2.51 Avg Vol: 72,508 Yield: 0.4 % MktCap: 258 MM 2017E P/E: 143.6x 2018E P/E 24.1x
US dollarsPrice 50 Day Moving Average 200 Day Moving Average
30
40
50
60708090100
DMC Global Inc. - Price Relative to S&P 500
1/15 4/15 7/15 10/15 1/16 4/16 7/16 10/16 1/17 4/17 7/17 10/1720
40
60
80DMC Global Inc. - Relative Strength Index (RSI)
0
1,000
2,000
10/17/2017DMC Global Inc. - Volume - Daily - for Date Requested
15
20
25
30
35
40
4550
HNH-USAHandy & Harman Ltd. $30.30 Engages in manufacturing of engineered niche indusPrice Chg: 0.00 % Chg: 0.00 Avg Vol: 17,696 Yield: 0 % MktCap: 371 MM 2017E P/E: x 2018E P/E x
US dollarsPrice 50 Day Moving Average 200 Day Moving Average
40
60
80
100
120140
Handy & Harman Ltd. - Price Relative to S&P 500
1/15 4/15 7/15 10/15 1/16 4/16 7/16 10/16 1/17 4/17 7/17 10/17
20
40
60
80Handy & Harman Ltd. - Relative Strength Index (RSI)
0
200
400
10/17/2017Handy & Harman Ltd. - Volume - Daily - for Date Requested
Compass 19
Normal pullback to thebase. RS uptrend remainsintact.
Accumulate. Topsidea bullish base. RSremains constructive.
Attractive Groups: MF-37 Engineered Metals/Materials
14
16
18
20
22
24
26
283032
EML-USAEastern Company $29.95 Manufactures industrial hardware, security productPrice Chg: -0.65 % Chg: -2.12 Avg Vol: 13,142 Yield: 1.4 % MktCap: 187 MM 2017E P/E: x 2018E P/E x
US dollarsPrice 50 Day Moving Average 200 Day Moving Average
90
100
110
120
130
140150160Eastern Company - Price Relative to S&P 500
1/15 4/15 7/15 10/15 1/16 4/16 7/16 10/16 1/17 4/17 7/17 10/1720
40
60
80
Eastern Company - Relative Strength Index (RSI)
0200400600
10/17/2017Eastern Company - Volume - Daily - for Date Requested
10
20
30
40
50
60
FSTR-USAL. B. Foster Company $25.70 Manufactures and distributes transportation and coPrice Chg: -0.35 % Chg: -1.34 Avg Vol: 76,740 Yield: 0 % MktCap: 266 MM 2017E P/E: x 2018E P/E x
US dollarsPrice 50 Day Moving Average 200 Day Moving Average
10
20
304050607080100
L. B. Foster Company - Price Relative to S&P 500
1/15 4/15 7/15 10/15 1/16 4/16 7/16 10/16 1/17 4/17 7/17 10/17
20
40
60
80L. B. Foster Company - Relative Strength Index (RSI)
04008001,200
10/17/2017L. B. Foster Company - Volume - Daily - for Date Requested
Compass 20
Accumulate. Topside the base.RS at multi-month highs.
Accumulate. Price uptrendremains intact. RS remainsconstructive.
Com
pass
2
1
Com
pass
2
2
Com
pass
2
3
David P. Nicoski, CMT952-922-7502
Joe W. Jasper, CFA952-922-7501
John M. Betz, CMT952-922-7506
920 Second Avenue S., Ste. 1225 • Minneapolis, MN 55402 • 952-922-7500 • www.vermilioncap.com
This page intentionally left blank.


![Open Evening TT Rock Stars Sheets€¦ · 5($' 0( ),567 'rq·w sulqw wklv sdjh 2q sdjh \rx·yh jrw d txl] vkhhw zlwk qr urfn qdph 2q sdjhv wr wkh txl] vkhhwv kdyh pdoh urfn qdphv](https://img.pdfslide.us/doc/110x75/5f5373136f4cb47bbd3c4106/open-evening-tt-rock-stars-sheets-5-0-567-rqw-sulqw-wklv-sdjh-2q-sdjh-rxyh.jpg)


![1HZ 6W $QGUHZ¶V 3DULVK &KXUFK 0DJD]LQH · 6dwxugd\ ug 0dufk 7lfnhwv duh qrz dydlodeoh &rph dorqj dqg hqmr\ vrph .dudrnh dqg wkh idexorxv vrxqgv ri &duro 0df 7kh riilfhuv frqwlqxh](https://img.pdfslide.us/doc/110x75/5e072fc57a629d671a4e877c/1hz-6w-qguhzv-3dulvk-kxufk-0djdlqh-6dwxugd-ug-0dufk-7lfnhwv-duh-qrz-dydlodeoh.jpg)

![JZ SID v5.18.17 Final Approved€¦ · 0dunhw iru vpdoo dqg phglxp vl]hg kljk shuirupdqfh glvsod\v zloo frqwlqxh wr JURZ LQ WKH QH[W \HDUV /736 2/(' HPHUJLQJ LQ SRUWDEOH GHYLFHV +LJK](https://img.pdfslide.us/doc/110x75/606e324665d60e7f7156ff29/jz-sid-v51817-final-approved-0dunhw-iru-vpdoo-dqg-phglxp-vlhg-kljk-shuirupdqfh.jpg)
