Embed Size (px)
DESCRIPTION
GRID OPERATION AND UTILITY OF MODERN LOAD DISPATCH AND COMMUNICATION SYSTEMS. ALOK ROY General Manager Northern Regional Load Dispatch Center. Indian Power Grid – its Evolution. Phenomenal expansion since Independence (1947) Generation : 1349 MW 105,800 MW - PowerPoint PPT Presentation
Citation preview
GRID OPERATION GRID OPERATION
ANDAND
UTILITY OF MODERN LOAD DISPATCH UTILITY OF MODERN LOAD DISPATCH
AND AND
COMMUNICATION SYSTEMSCOMMUNICATION SYSTEMS
ALOK ROYALOK ROYGeneral ManagerGeneral Manager
Northern Regional Load Dispatch CenterNorthern Regional Load Dispatch Center
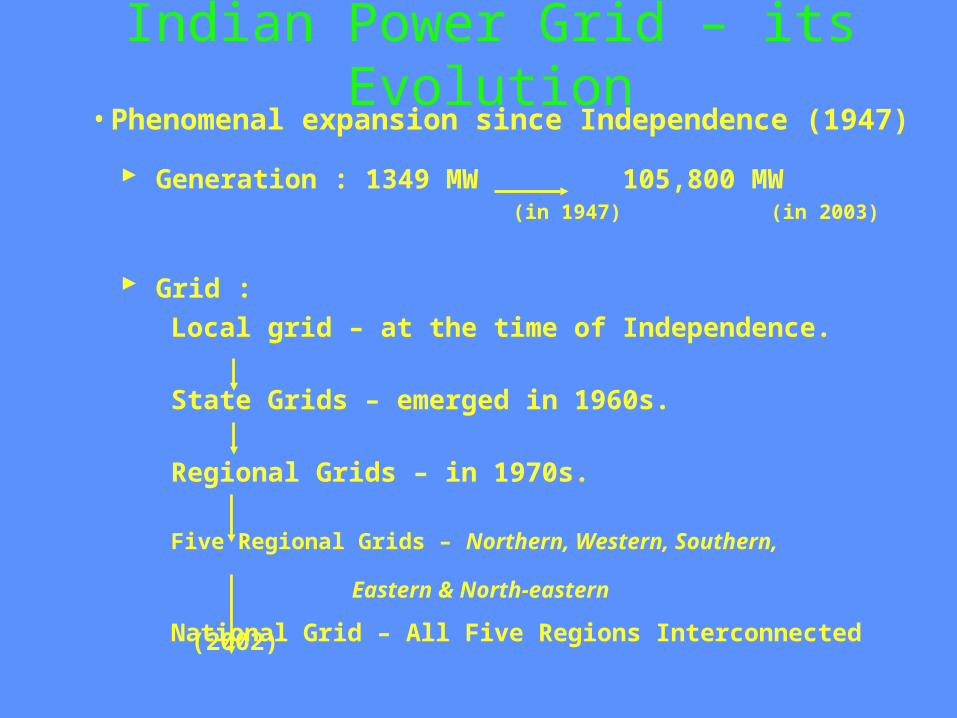
Indian Power Grid – its Evolution• Phenomenal expansion since Independence (1947)
Generation : 1349 MW 105,800 MW (in 1947) (in 2003)
Grid :
Local grid – at the time of Independence.
State Grids – emerged in 1960s.
Regional Grids – in 1970s.
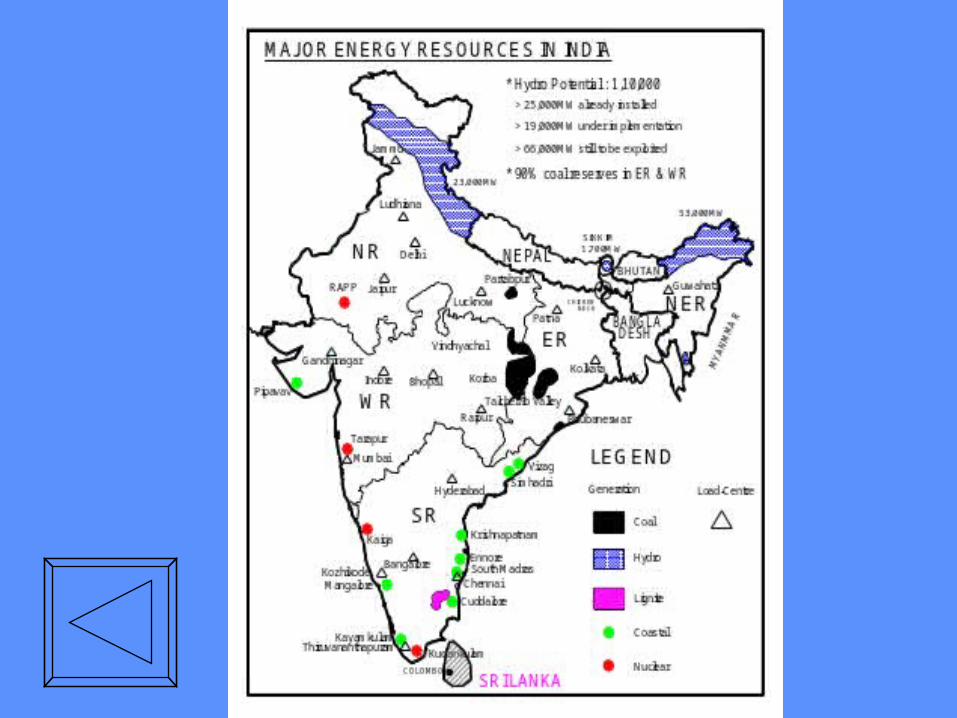
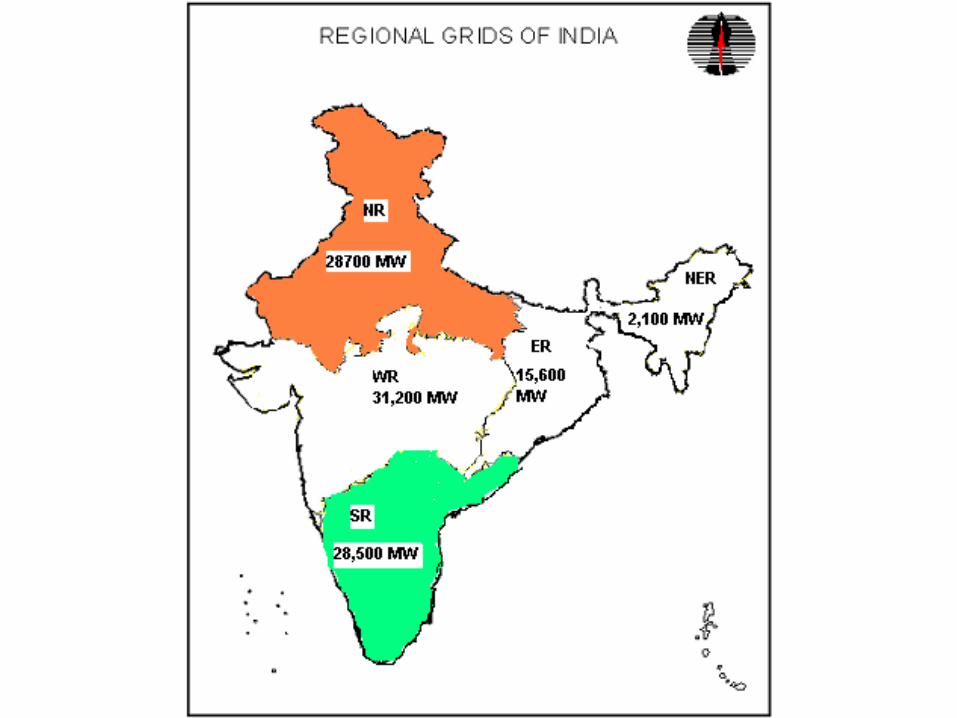
Five Regional Grids – Northern, Western, Southern,
Eastern & North-eastern
National Grid – All Five Regions Interconnected (2002)
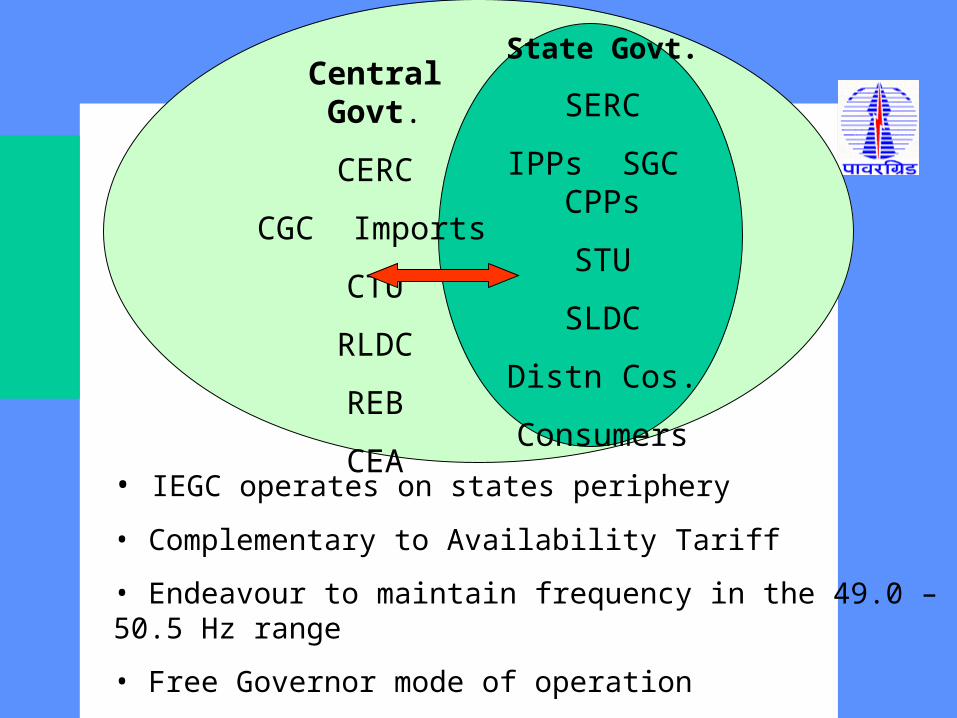
State Govt.
SERC
IPPs SGC CPPs
STU
SLDC
Distn Cos.
Consumers
Central Govt.
CERC
CGC Imports
CTU
RLDC
REB
CEA
• IEGC operates on states periphery
• Complementary to Availability Tariff
• Endeavour to maintain frequency in the 49.0 – 50.5 Hz range
• Free Governor mode of operation
• Charge for reactive energy - Voltage related
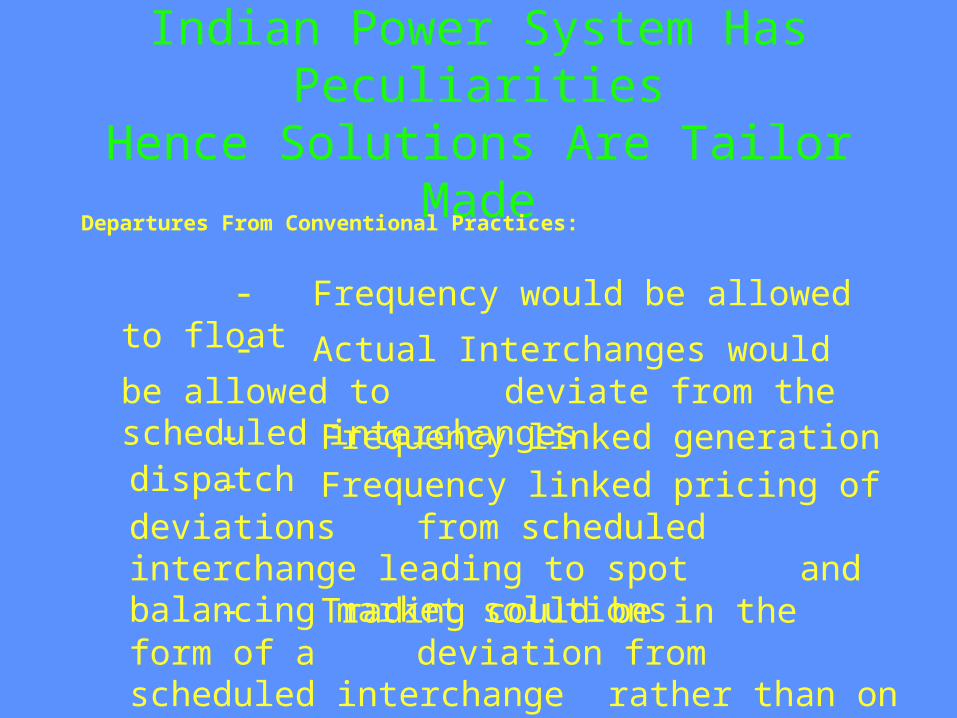
Indian Power System Has PeculiaritiesHence Solutions Are Tailor Made
Departures From Conventional Practices:
- Actual Interchanges would be allowed to deviate from the scheduled interchanges - Frequency linked generation dispatch
- Frequency would be allowed to float
- Frequency linked pricing of deviations from scheduled interchange leading to spot and balancing market solutions - Trading could be in the form of a deviation from scheduled interchange rather than on pre-agreed/scheduled basis
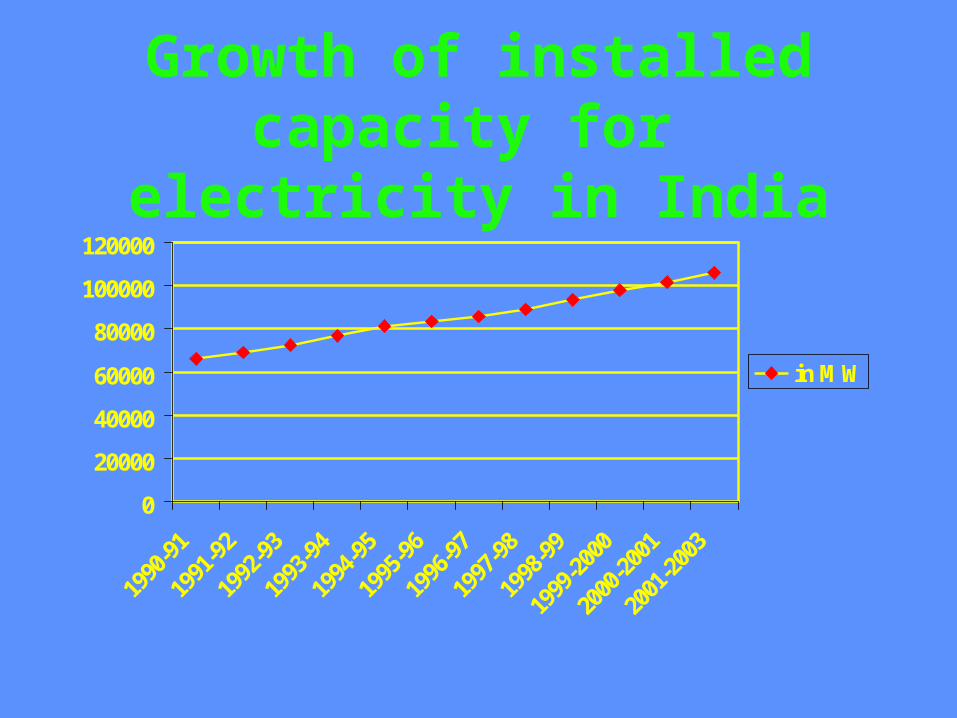
Growth of installed capacity for electricity in India
0
20000
40000
60000
80000
100000
120000
1990
-91
1991
-92
1992
-93
1993
-94
1994
-95
1995
-96
1996
-97
1997
-98
1998
-99
1999
-200
0
2000
-200
1
2001
-200
3
in MW
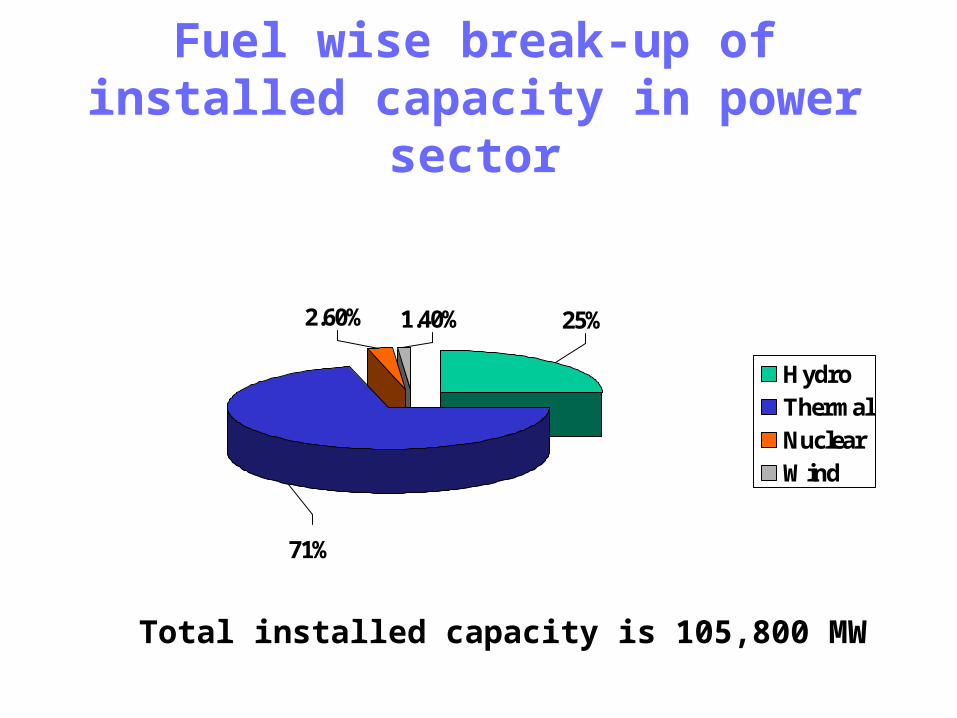
Fuel wise break-up of installed capacity in power sector
2.60% 1.40% 25%
71%
HydroThermalNuclearWind
Total installed capacity is 105,800 MW
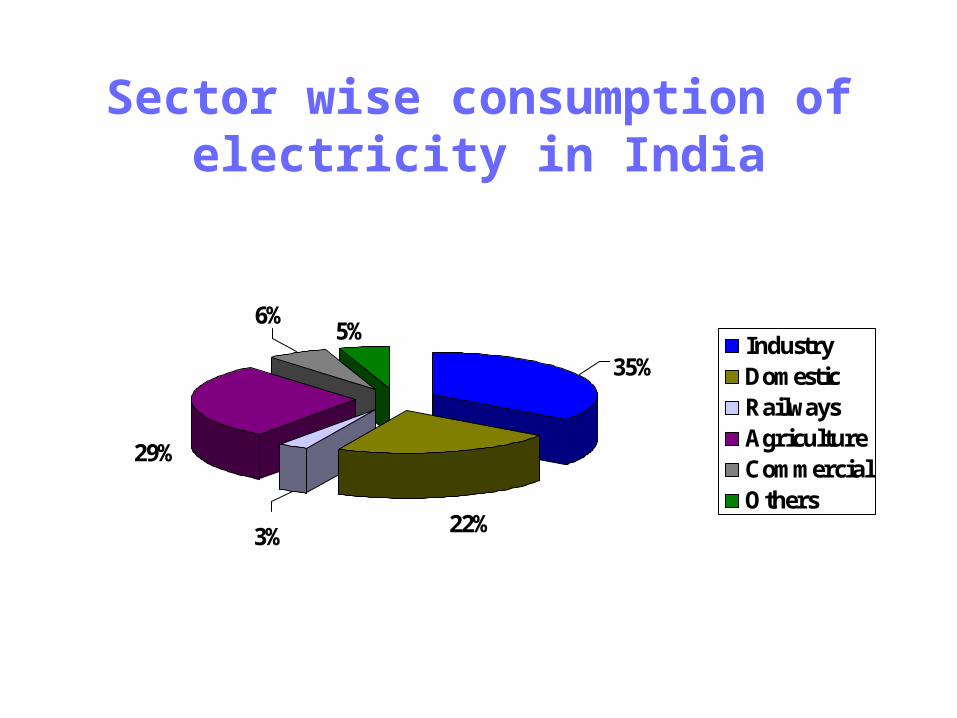
Sector wise consumption of electricity in India
22%
29%
5%
35%
6%
3%
IndustryDomesticRailwaysAgricultureCommercialOthers
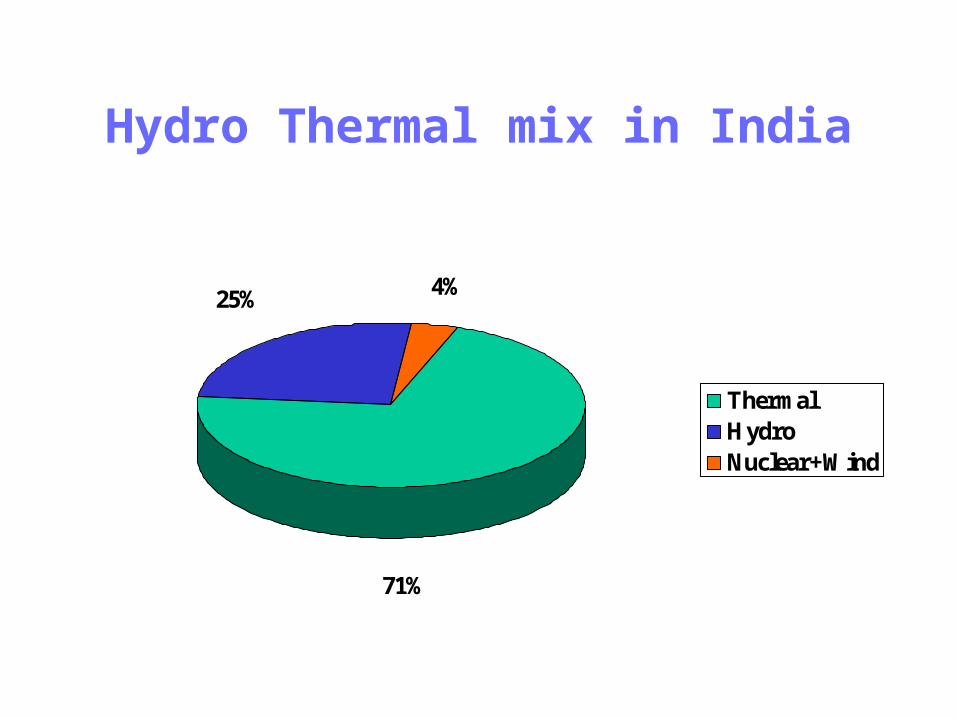
Hydro Thermal mix in India
25% 4%
71%
ThermalHydroNuclear+Wind
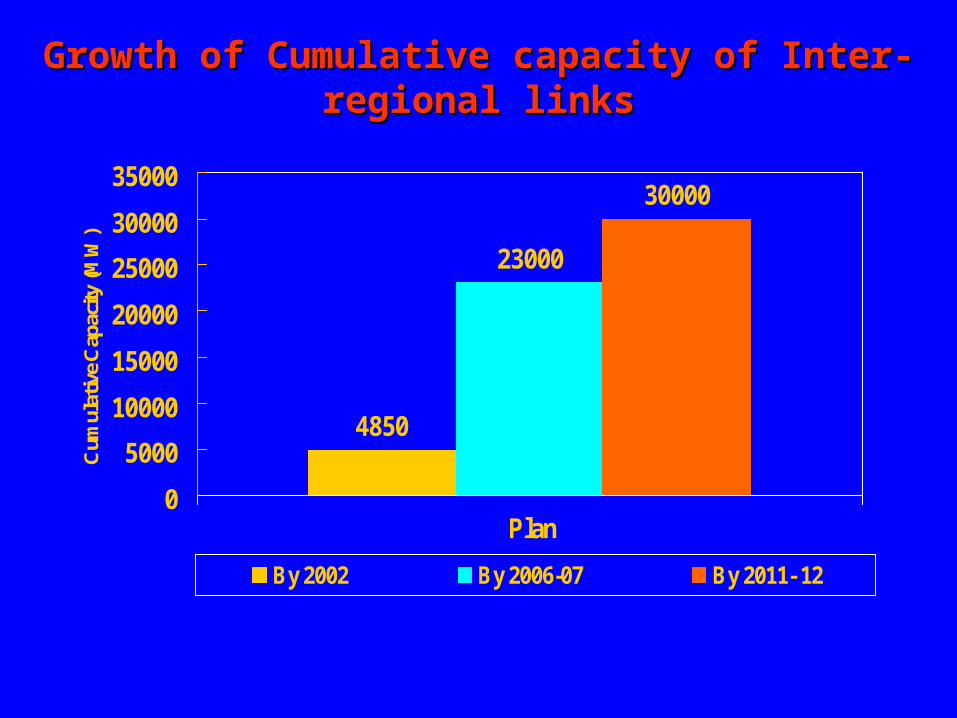
4850
23000
30000
0
5000
10000
15000
20000
25000
30000
35000
Plan
Cum
ulat
ive
Cap
acity
(MW
)
By 2002 By 2006-07 By 2011- 12
Growth of Cumulative capacity of Inter-regional linksGrowth of Cumulative capacity of Inter-regional links
NORTHERN REGIONNORTHERN REGION
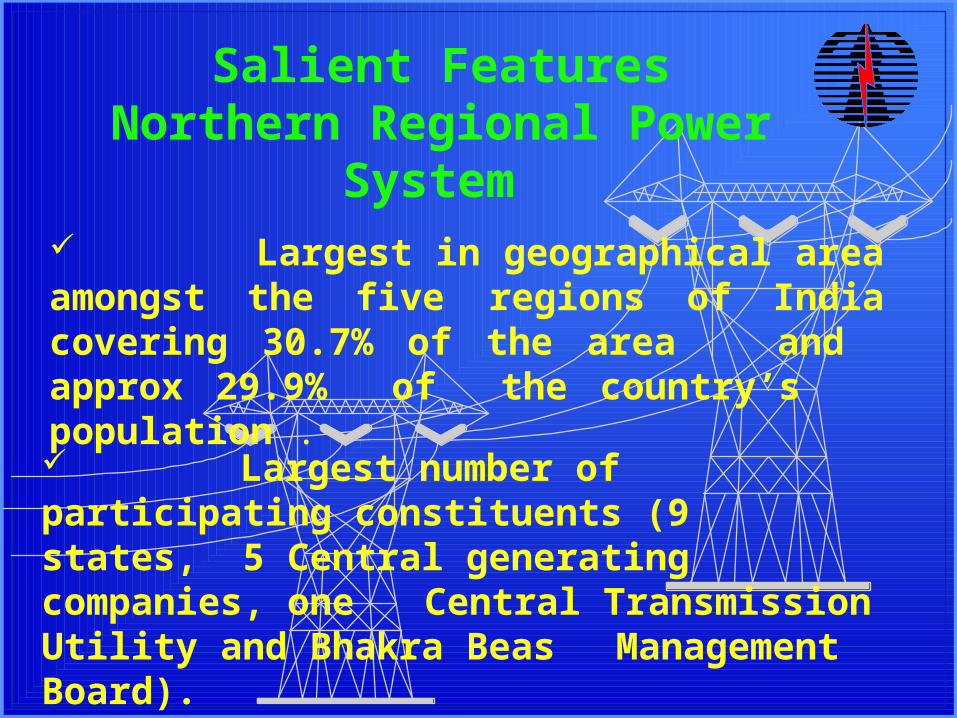
Salient FeaturesNorthern Regional Power System
Largest in geographical area amongst the five regions of India covering 30.7% of the area and approx 29.9% of the country’s
population .
Largest number of participating constituents (9 states, 5 Central generating companies, one Central Transmission Utility and Bhakra BeasManagement Board).
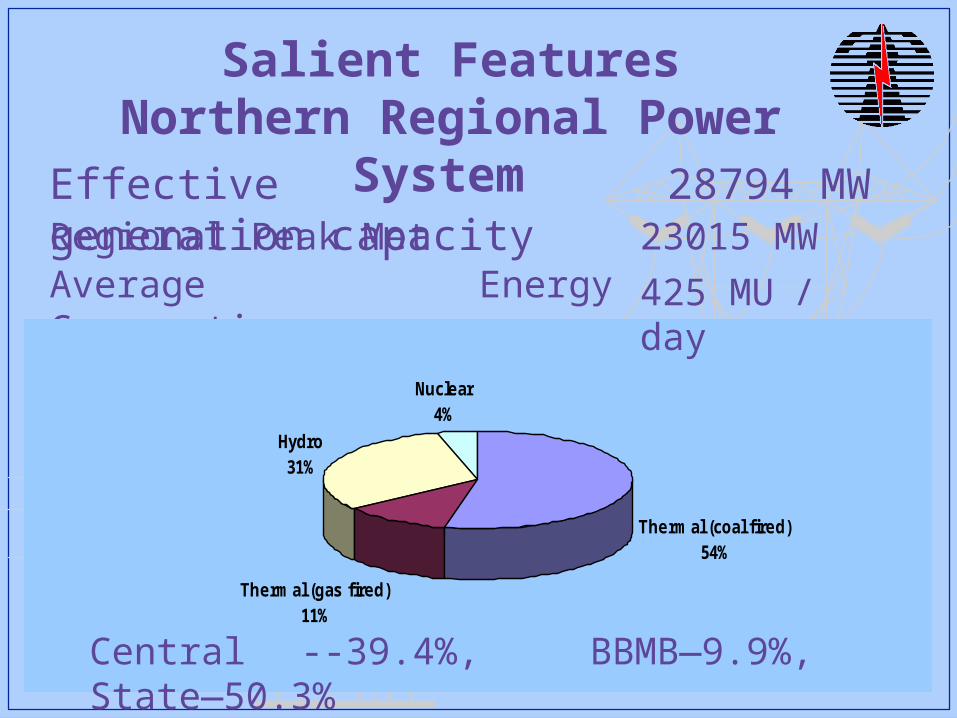
Salient FeaturesNorthern Regional Power System
Effective generation capacity 28794 MWRegional Peak Met 23015 MW
Average Energy Consumption
Thermal (coal fired)54%
Hydro31%
Nuclear4%
Thermal (gas fired)11%
425 MU / day
Central --39.4%, BBMB—9.9%, State—50.3%

Salient FeaturesNorthern Regional Power System
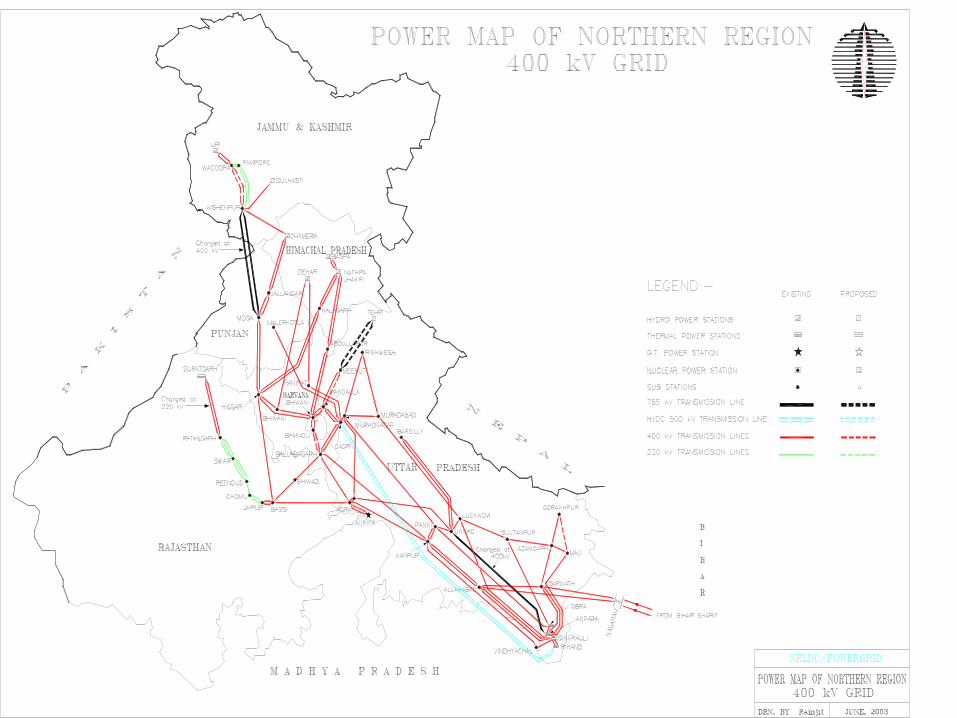
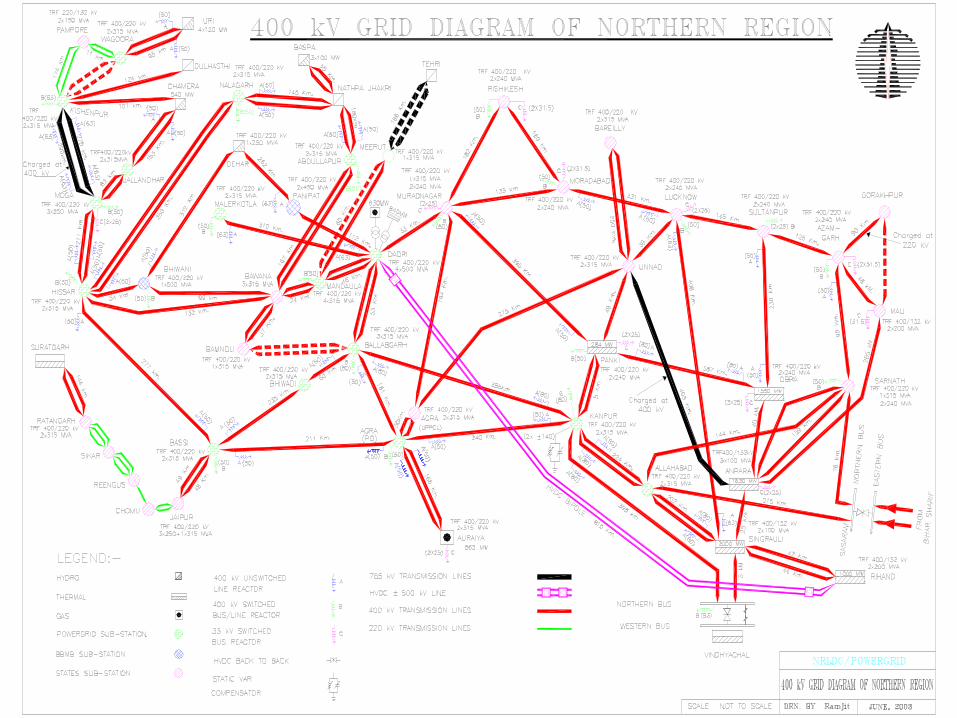
+ 500 kV HVDC 1630 Ckt. Kms.
400 kV 15033 Ckt. Kms.
220 kV 28353 Ckt. Kms.
TOTAL 45016 Ckt. Kms.
Transmission system
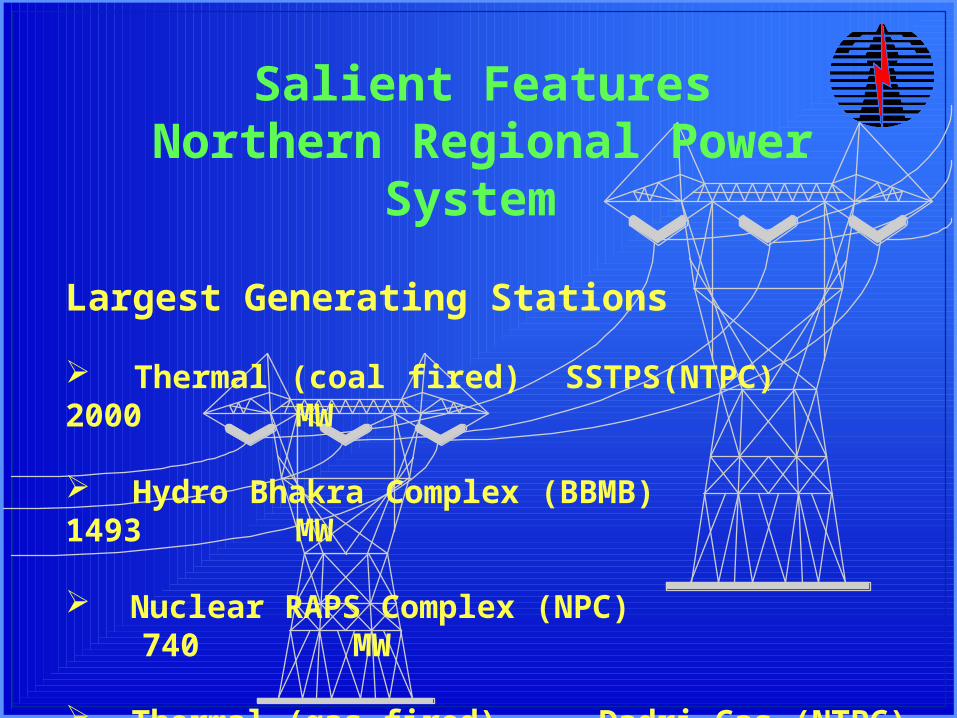
Salient FeaturesNorthern Regional Power System
Largest Generating Stations
Thermal (coal fired) SSTPS(NTPC) 2000 MW
Hydro Bhakra Complex (BBMB) 1493 MW
Nuclear RAPS Complex (NPC) 740 MW
Thermal (gas fired) Dadri Gas (NTPC) 829.78 MW
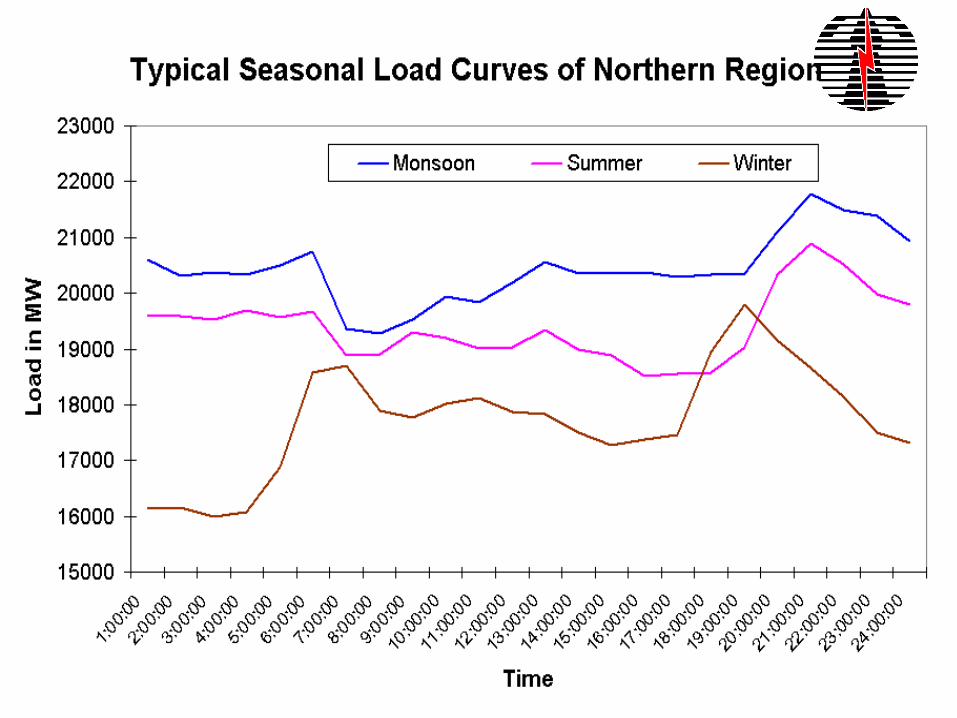
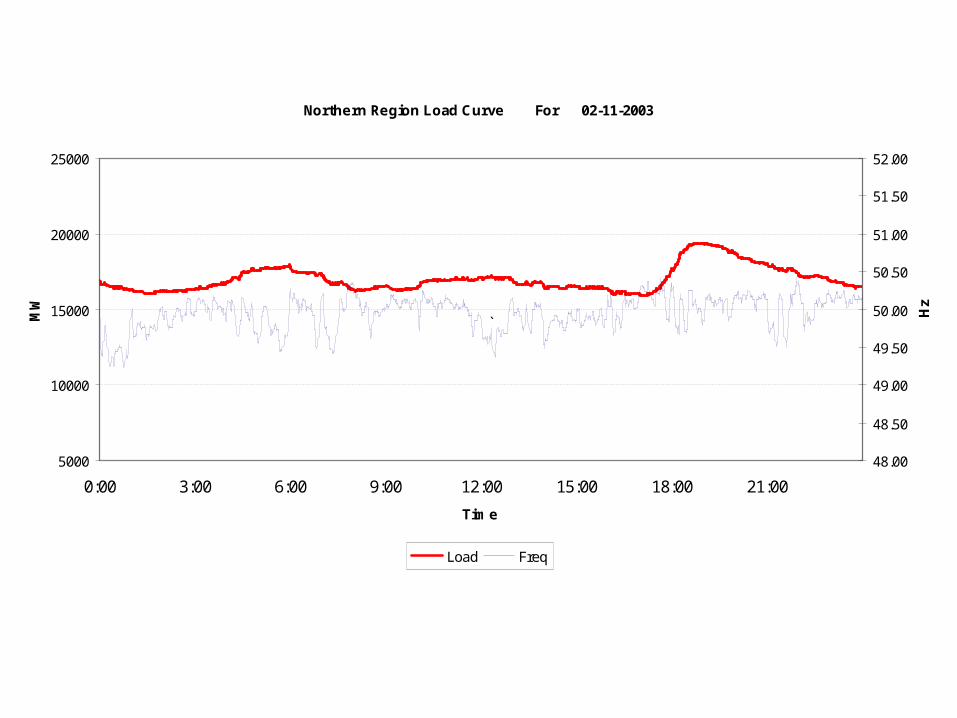
Northern Region Load Curve For 02-11-2003
5000
10000
15000
20000
25000
0:00 3:00 6:00 9:00 12:00 15:00 18:00 21:00
Time
MW
48.00
48.50
49.00
49.50
50.00
50.50
51.00
51.50
52.00
Hz
Load Freq
`
COMMERCIAL MECHANISMCOMMERCIAL MECHANISM
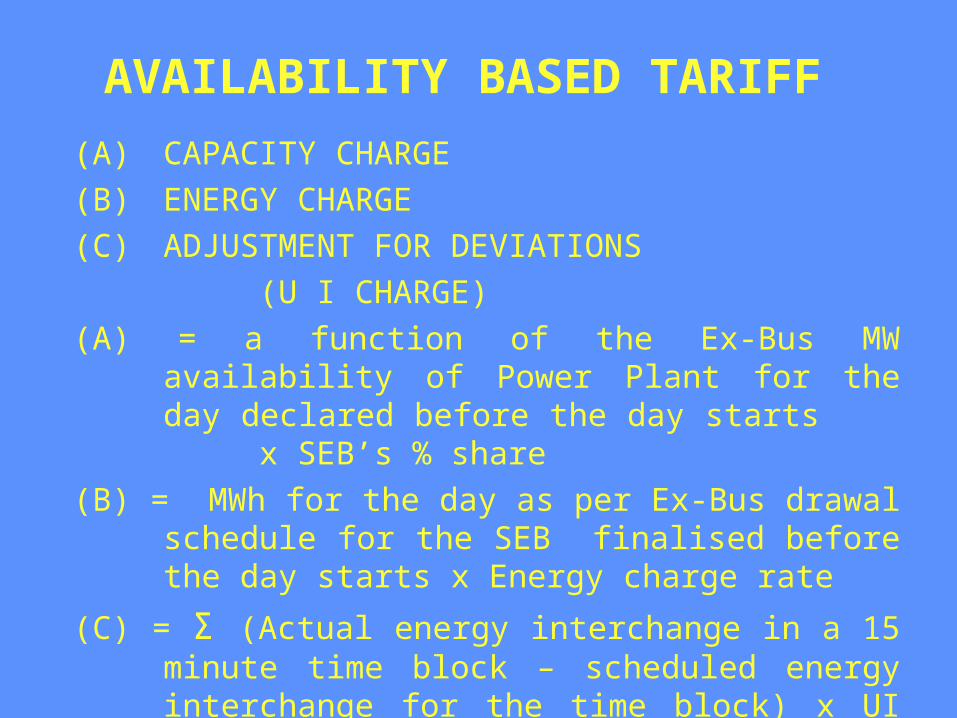
AVAILABILITY BASED TARIFF
(A) CAPACITY CHARGE
(B) ENERGY CHARGE
(C) ADJUSTMENT FOR DEVIATIONS
(U I CHARGE)
(A) = a function of the Ex-Bus MW availability of Power Plant for the day declared before the day starts x SEB’s % share
(B) = MWh for the day as per Ex-Bus drawal schedule for the SEB finalised before the day starts x Energy charge rate
(C) = Σ (Actual energy interchange in a 15 minute time block – scheduled energy interchange for the time block) x UI rate for the time block
TOTAL PAYMENT FOR THE DAY = (A) + (B) ± (C)
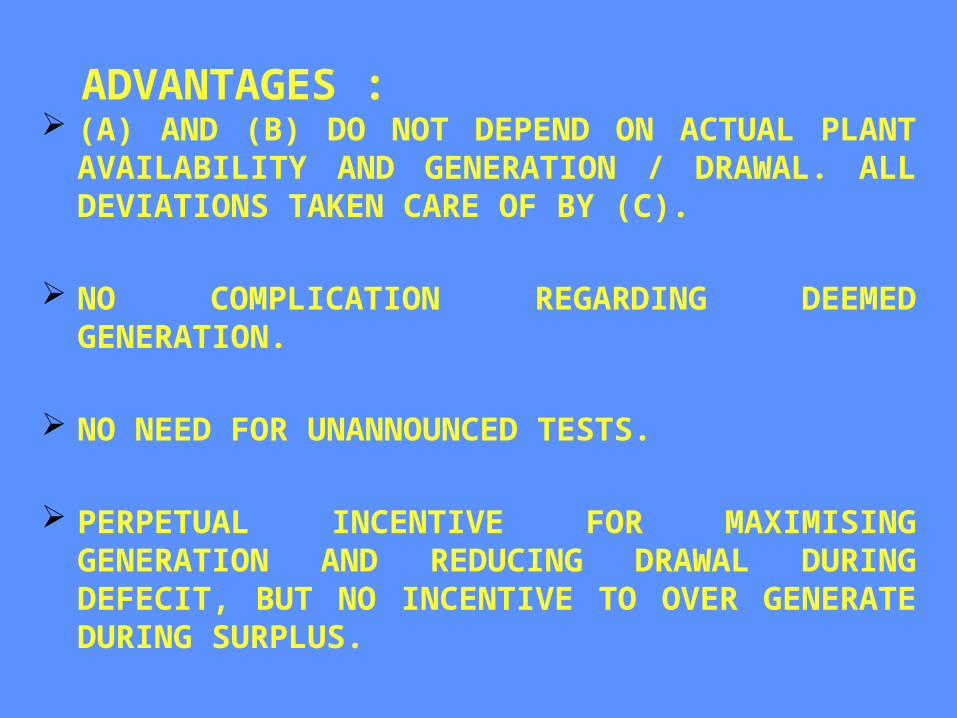
ADVANTAGES : (A) AND (B) DO NOT DEPEND ON ACTUAL PLANT
AVAILABILITY AND GENERATION / DRAWAL. ALL DEVIATIONS TAKEN CARE OF BY (C).
NO COMPLICATION REGARDING DEEMED GENERATION.
NO NEED FOR UNANNOUNCED TESTS.
PERPETUAL INCENTIVE FOR MAXIMISING GENERATION AND REDUCING DRAWAL DURING DEFECIT, BUT NO INCENTIVE TO OVER GENERATE DURING SURPLUS.
UNSCHEDULED INTERCHANGES (UI)I.E. DEVIATIONS FROM SCHEDULES
ENCOURAGED IF GOOD FOR THE GRID, DISCOURAGED IF BAD FOR THE GRID, BUT ALLOWED BECAUSE IT ENABLES MEETING MORE DEMAND AND ENHANCES MERRIT-ORDER.
GOOD UI HELPS IN IMPROVING FREQUENCY AND ENABLES ONE CONSTITUENT TO HELP THE OTHER (FOR MEETING MORE CONSUMER DEMAND I.E REDUCING LOAD SHEDDING)
UI PROVIDES THE MECHANISM FOR ON-LINE DISPLACEMENT OF COSTLIER GENERATION BY CHEAPER GENERATION : ULTIMATE OPTIMISATION
MODERNISATION OF MODERNISATION OF POWER SYSTEM OPERATIONPOWER SYSTEM OPERATION
ULDC SCHEMEULDC SCHEME
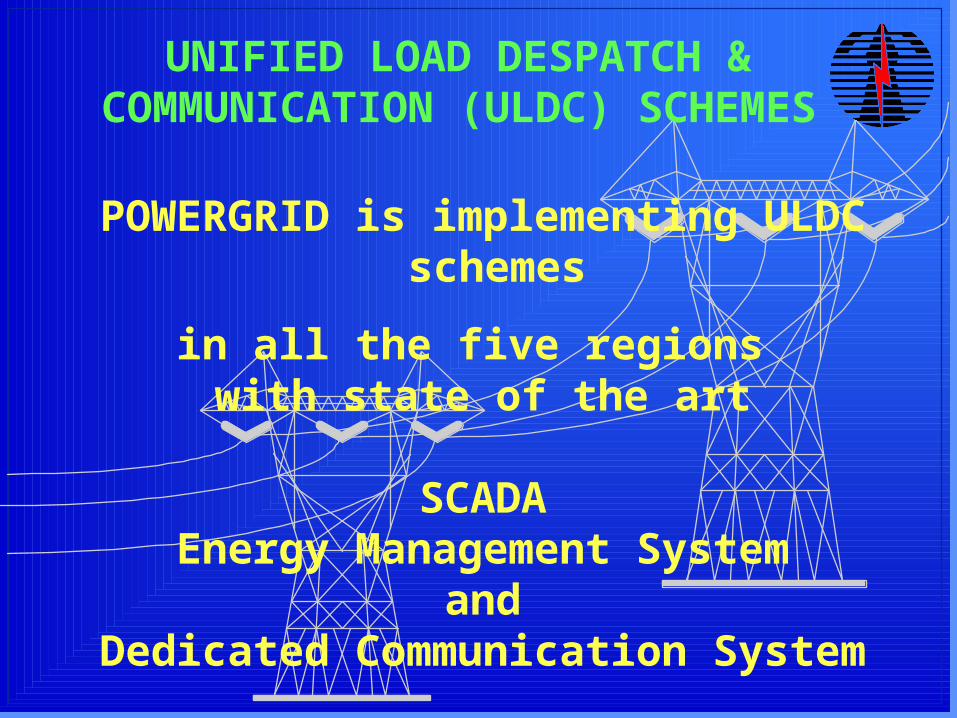
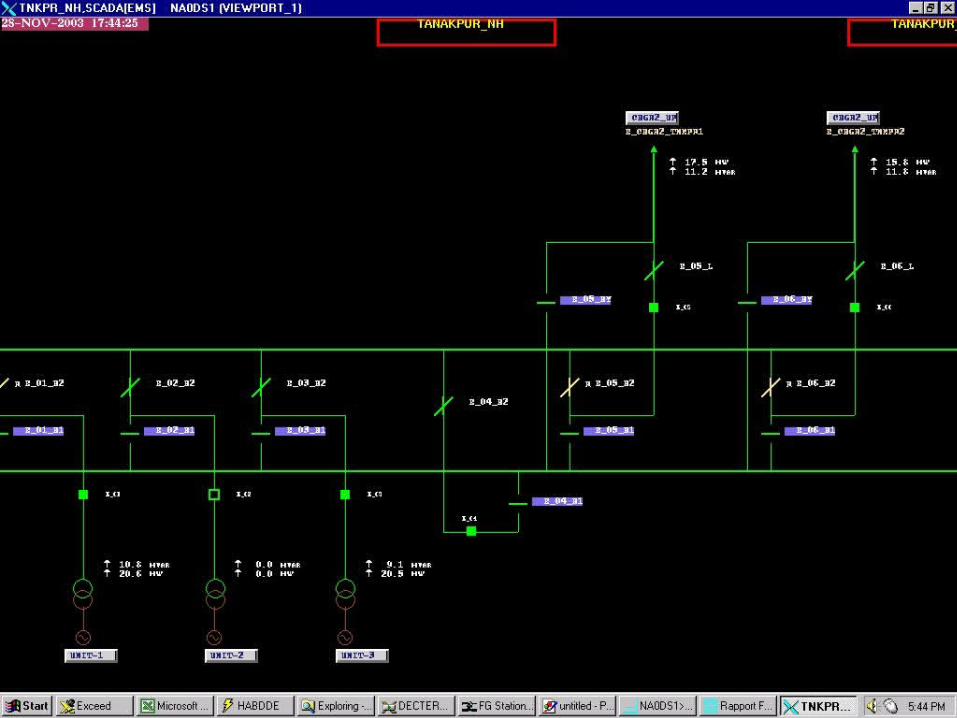
POWERGRID is implementing ULDC schemes
in all the five regions with state of the art
SCADAEnergy Management System
andDedicated Communication System
UNIFIED LOAD DESPATCH & COMMUNICATION (ULDC)
SCHEMES
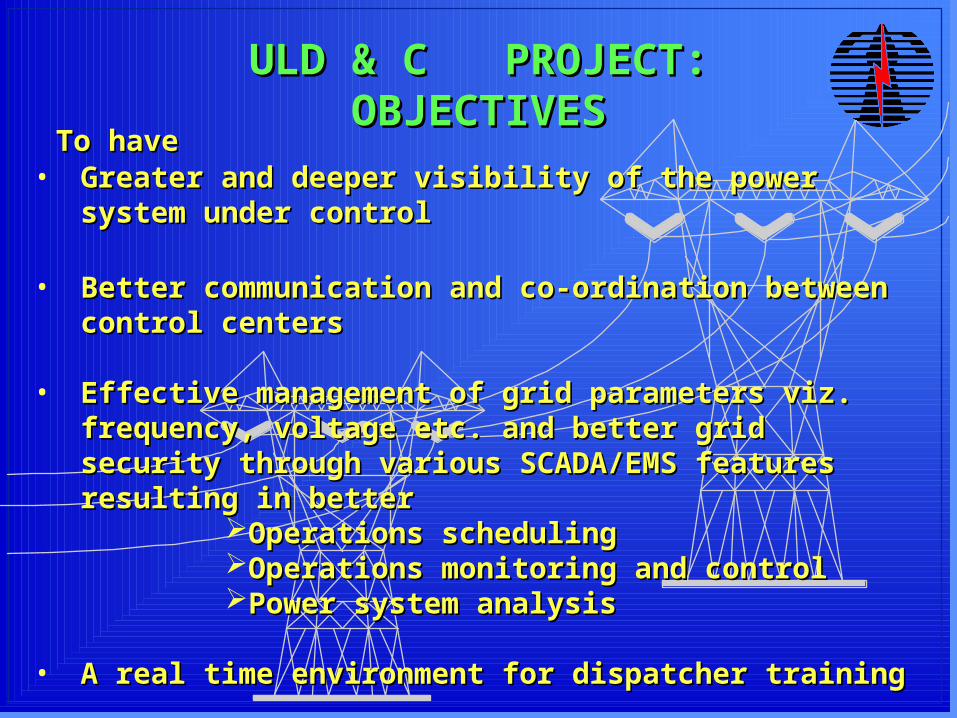
ULD & C PROJECT: OBJECTIVESULD & C PROJECT: OBJECTIVES
To haveTo have• Greater and deeper visibility of the power system Greater and deeper visibility of the power system
under controlunder control
• Better communication and co-ordination between Better communication and co-ordination between control centers control centers
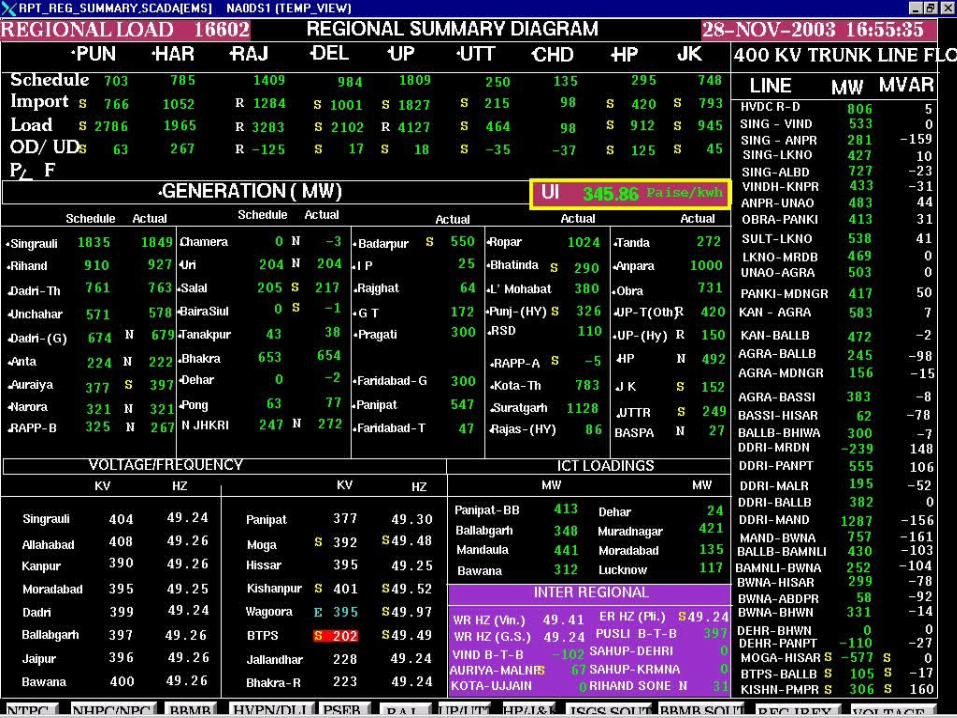
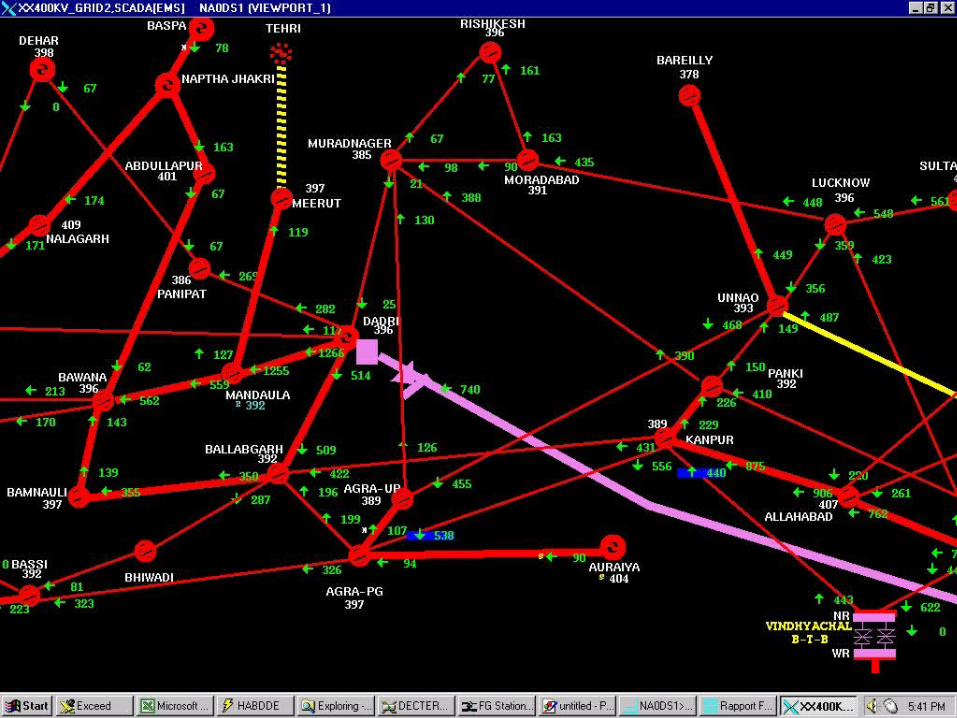
• Effective management of grid parameters viz. Effective management of grid parameters viz. frequency, voltage etc. and better grid security frequency, voltage etc. and better grid security through various SCADA/EMS features resulting in through various SCADA/EMS features resulting in betterbetter
Operations schedulingOperations schedulingOperations monitoring and controlOperations monitoring and controlPower system analysisPower system analysis
• A real time environment for dispatcher trainingA real time environment for dispatcher training
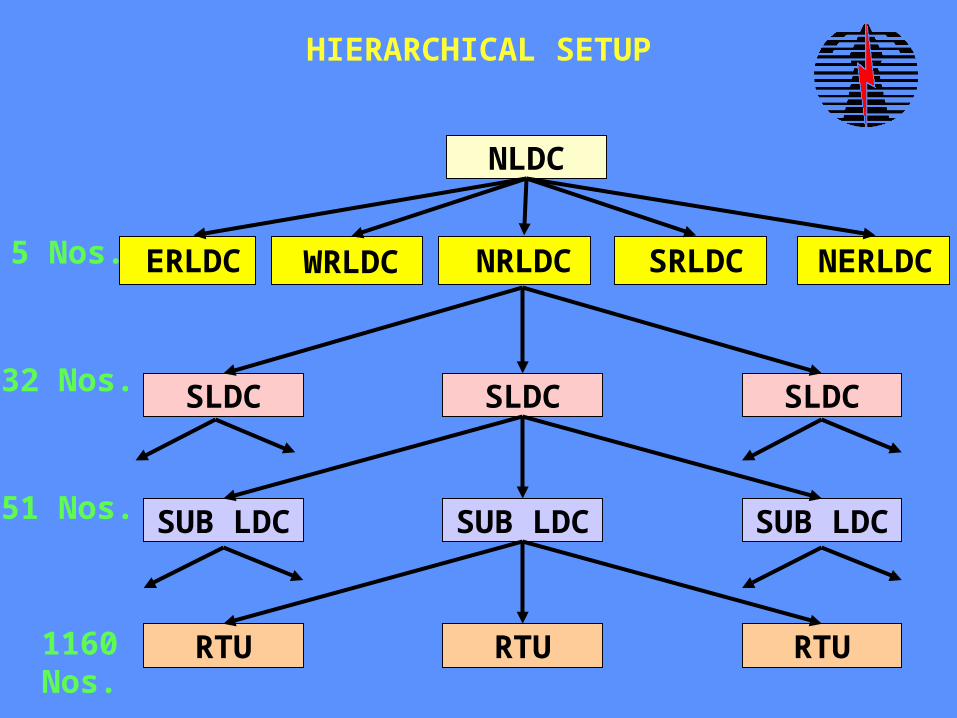
HIERARCHICAL SETUP
RTU RTU RTU
SUB LDC SUB LDC SUB LDC
SLDC SLDC SLDC
ERLDC WRLDC NRLDC SRLDC NERLDC5 Nos.
NLDC
32 Nos.
51 Nos.
1160 Nos.
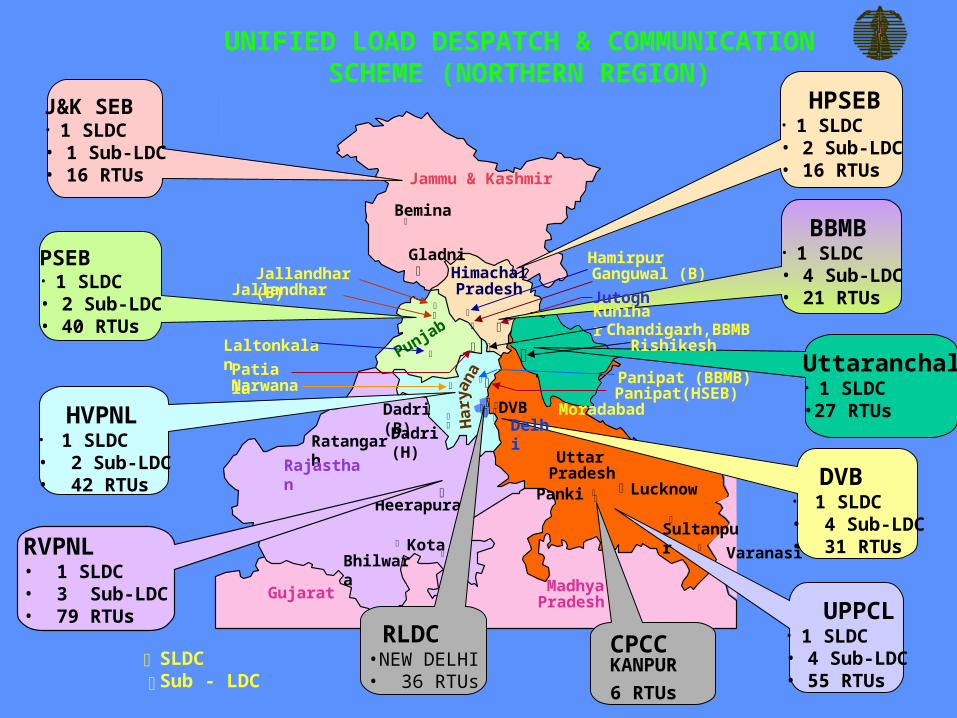
UNIFIED LOAD DESPATCH & COMMUNICATION SCHEME (NORTHERN
REGION)
Chandigarh,BBMB
DVB
Lucknow
Panipat(HSEB)
Patiala
Panipat (BBMB)
Dadri (B)
Dadri (H)
Rishikesh
Bhilwara
Kota
Ratangarh
Narwana
Hamirpur
Laltonkalan
Jallandhar (P)
Jallandhar (B)
Ganguwal (B)
Heerapura
Jammu & Kashmir
HimachalPradesh
Punjab
UttarPradeshRajastha
n
Gujarat MadhyaPradesh
Bemina
J&K SEB• 1 SLDC • 1 Sub-LDC• 16 RTUs
PSEB• 1 SLDC • 2 Sub-LDC• 40 RTUs
HVPNL• 1 SLDC • 2 Sub-LDC• 42 RTUs
RVPNL• 1 SLDC • 3 Sub-LDC• 79 RTUs
HPSEB• 1 SLDC • 2 Sub-LDC• 16 RTUs
DVB• 1 SLDC • 4 Sub-LDC• 31 RTUs
UPPCL• 1 SLDC• 4 Sub-LDC• 55 RTUs
RLDC•NEW DELHI• 36 RTUs
CPCCKANPUR
6 RTUs SLDCSub - LDC
Gladni
Panki
ana Uttaranchal
• 1 SLDC•27 RTUs
BBMB• 1 SLDC • 4 Sub-LDC• 21 RTUs
Har
y
Moradabad
Varanasi
Sultanpur
Delhi
JutoghKunihar
Rishikesh
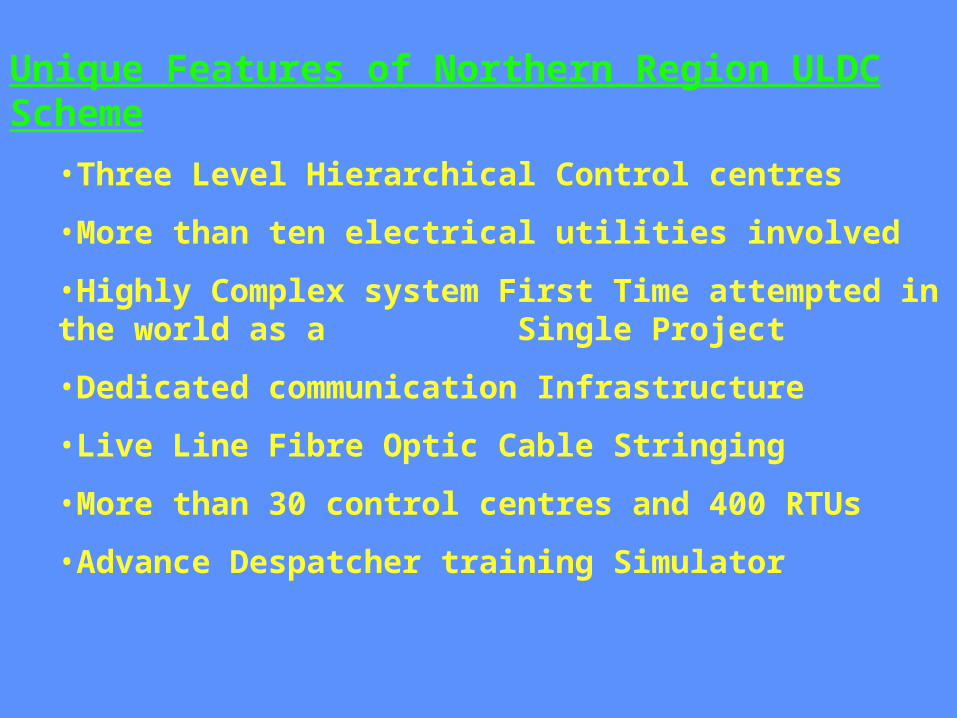
Unique Features of Northern Region ULDC Scheme
•Three Level Hierarchical Control centres
•More than ten electrical utilities involved
•Highly Complex system First Time attempted in the world as a Single Project
•Dedicated communication Infrastructure
•Live Line Fibre Optic Cable Stringing
•More than 30 control centres and 400 RTUs
•Advance Despatcher training Simulator
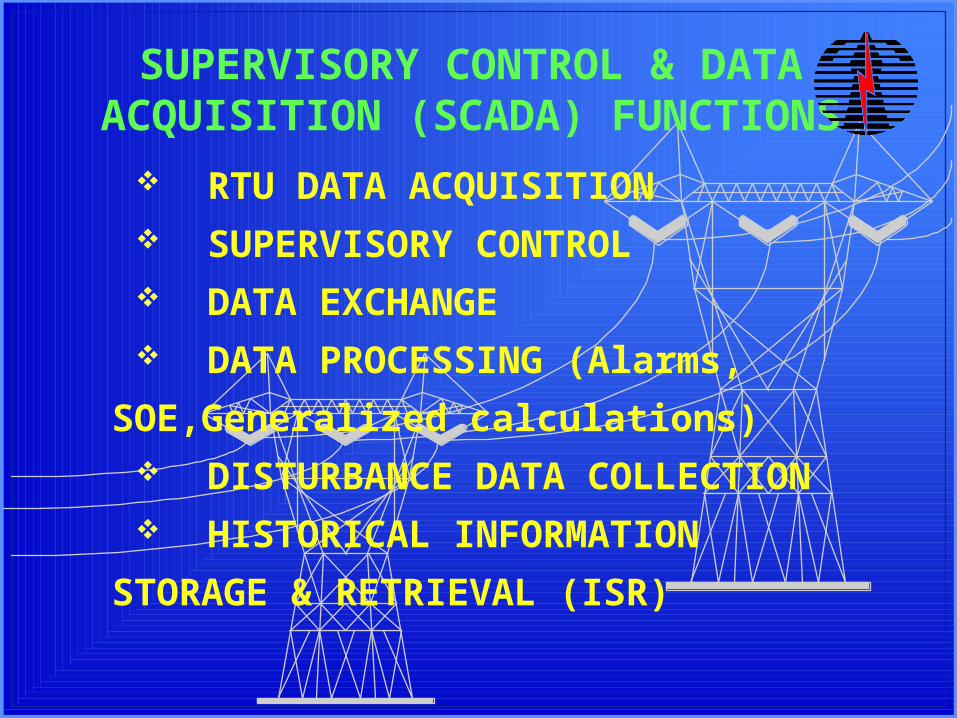
RTU DATA ACQUISITION SUPERVISORY CONTROL DATA EXCHANGE DATA PROCESSING (Alarms,
SOE,Generalized
calculations) DISTURBANCE DATA
COLLECTION HISTORICAL INFORMATION
STORAGE & RETRIEVAL (ISR)
SUPERVISORY CONTROL & DATA ACQUISITION (SCADA)
FUNCTIONS
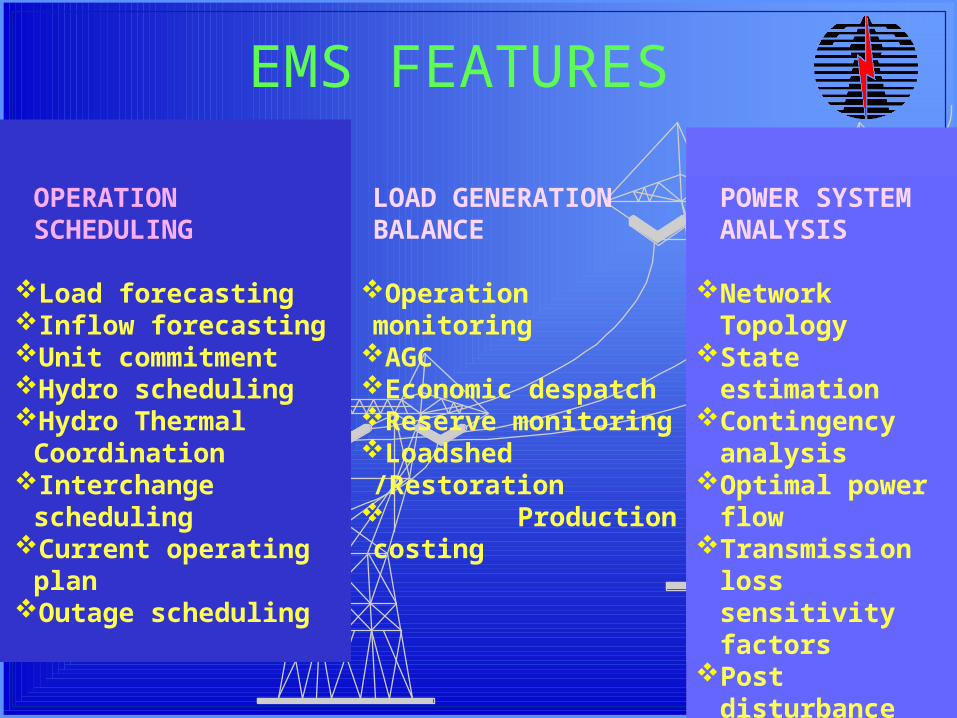
OPERATION SCHEDULING
Load forecastingInflow forecastingUnit commitmentHydro schedulingHydro Thermal
CoordinationInterchange schedulingCurrent operating planOutage scheduling
POWER SYSTEM ANALYSIS
Network Topology
State estimationContingency
analysisOptimal power
flowTransmission
loss sensitivity factors
Post disturbance analysis
LOAD GENERATION BALANCE
Operation monitoringAGC Economic despatchReserve monitoringLoadshed /Restoration Production costing
EMS FEATURES
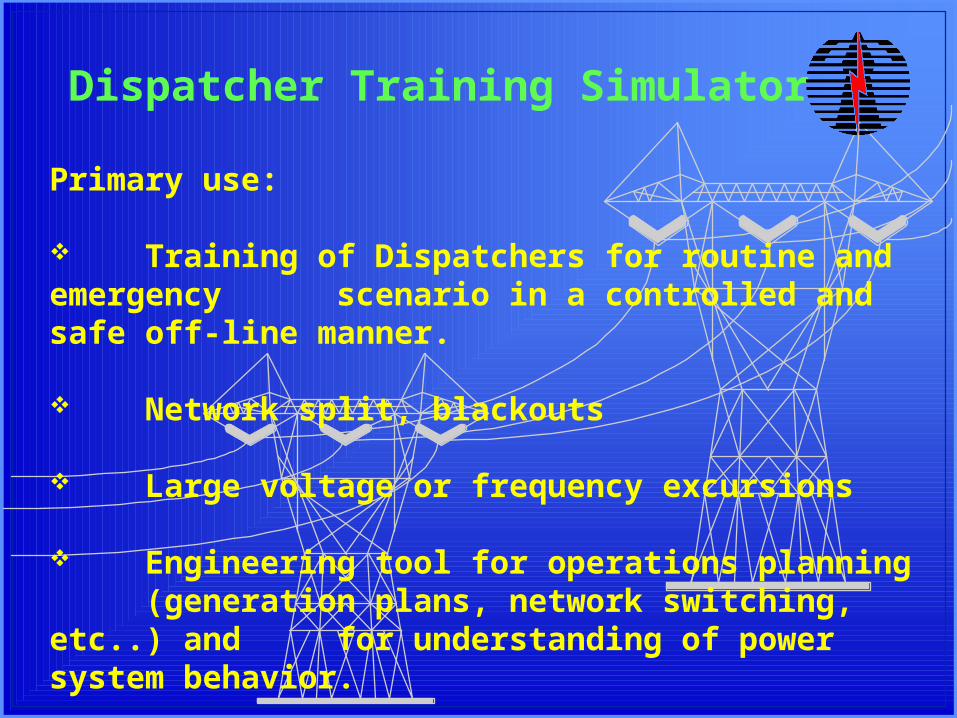
Dispatcher Training Simulator
Primary use:
Training of Dispatchers for routine and emergency scenario in a controlled and safe off-line manner.
Network split, blackouts
Large voltage or frequency excursions
Engineering tool for operations planning(generation plans, network switching,
etc..) and for understanding of power system behavior.

Thank You