Embed Size (px)
DESCRIPTION
Grid Infrastructure Monitoring. James Casey, CERN, IT-GT-TOM 1 st ROC LA Workshop, 6 th October 2010. Tools for WLCG Monitoring. WLCG provides a set of tools for operational monitoring and management Aim is to Enable sites to operate a reliable infrastructure - PowerPoint PPT Presentation
Citation preview
James Casey, CERN, IT-GT-TOM
1st ROC LA Workshop, 6th October 2010
Grid Infrastructure Monitoring
Tools for WLCG Monitoring
• WLCG provides a set of tools for operational monitoring and management
• Aim is to – Enable sites to operate a reliable infrastructure– Report on the reliability and usage to WLCG users
• Many of the tools developed previously within EGEE/OSG– Now operated by EGI.eu, OSG, other NGIs
Tools
• GOCDB– Configuration management
• SAM/Nagios– Checking the operational status of resources
• Gstat– Information system monitoring and reporting
• Gridview– Availability/reliability calculation and reporting
• Gridmap– High level views of the infrastructure
Tools
• I will talk about most of the previous tools– SAM/Nagios, GStat, Gridview, Gridmap
• Other exist too– Accounting – APEL– VO Cards - CIC Portal– 1st line support - Operations Dashboard
• And in OSG– OIM, MyOSG, Gratia, …
Open-source at the core – Avoid NIH !
• All these tools depend on common low-level components– Nagios – an open-source monitoring system– Apache ActiveMQ – an open source messaging
system
• We many other open-source components when developing these tools– Python, Django, Jquery, RRD, Google charts
• A short detour on what they are and why we use them
Nagios
• What is Nagios?– open source monitoring framework– highly flexible with advanced features– widely used & actively developed
• Why do we need it?– Many tests need to be scheduled for execution– avoid development & maintenance of home-grown
tools– provide solution that site admins are familiar with
• Nagios is a standard monitoring component at many sites
6
Nagios Architecture
• Nagios Core– Scheduler: Runs checks at a predefined interval
• Plugins– Scripts used to check particular pieces of
functionality
• Web interface• Powerful notification system
– E-mail, SMS, Pager, …
• All parts are pluggable and extensible

Nagios Web Interface

Site Nagios – CE Tests
Messaging
• What is a messaging system?– Method of communication between applications– Standardized, asynchronous and scalable
communication between distributed entities– Reliable network of brokers that provides
guaranteed delivery of messages– Messaging is for applications what IM is for people
– Mainly acts as an integration framework between many separate applications
10
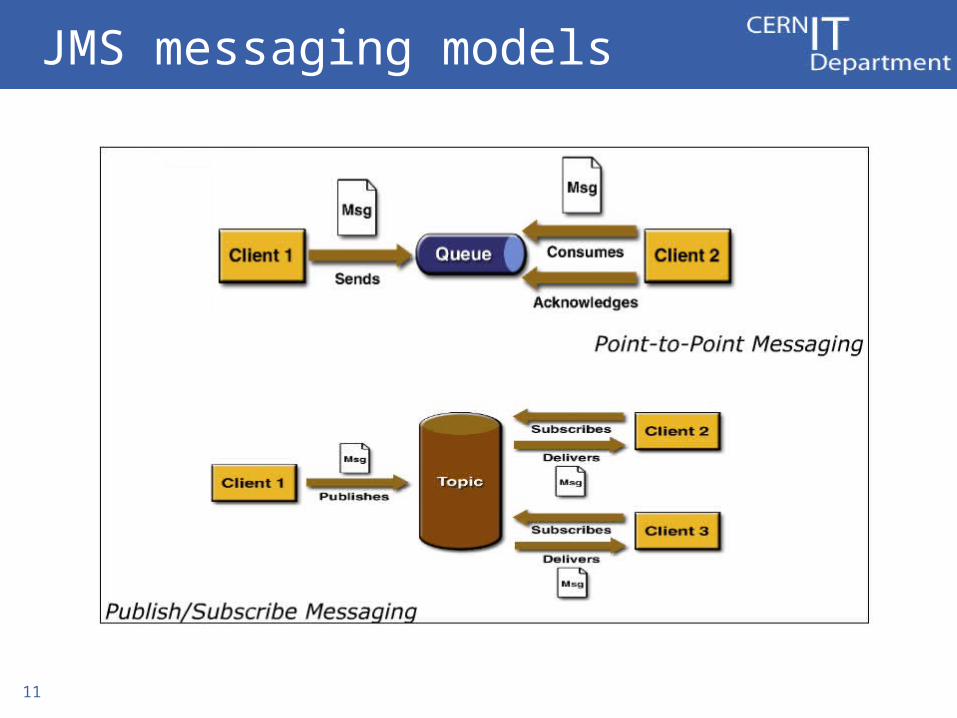
JMS messaging models
11
Why messaging ?
• Why do we need it?– Interaction between distributed monitoring
components– Standard interfaces enables easy integration of
monitoring software– Scalable
• Main use-cases are in finance for high message rate ( > 1M/sec)reliable multicast e.g. trading floor
– Reliable– Distributed
Messaging is pre-existing grid-scale technology
Implementation details
• FUSE Message Broker – based on Apache ActiveMQ
• Good performance characteristics– 1K – 20K messages per second depending on
features used
• Distributed network of 4 brokers, hosted by EGI.eu– CERN, Croatia, Greece– Provides reliability and locality
13
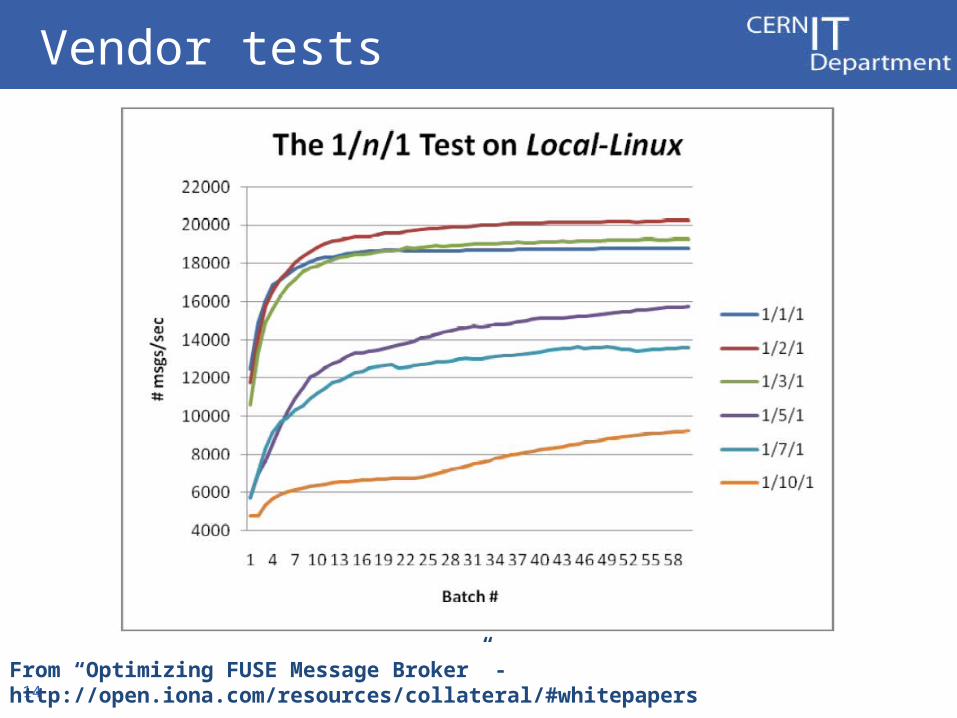
Vendor tests
14From “Optimizing FUSE Message Broker” - http://open.iona.com/resources/collateral/#whitepapers
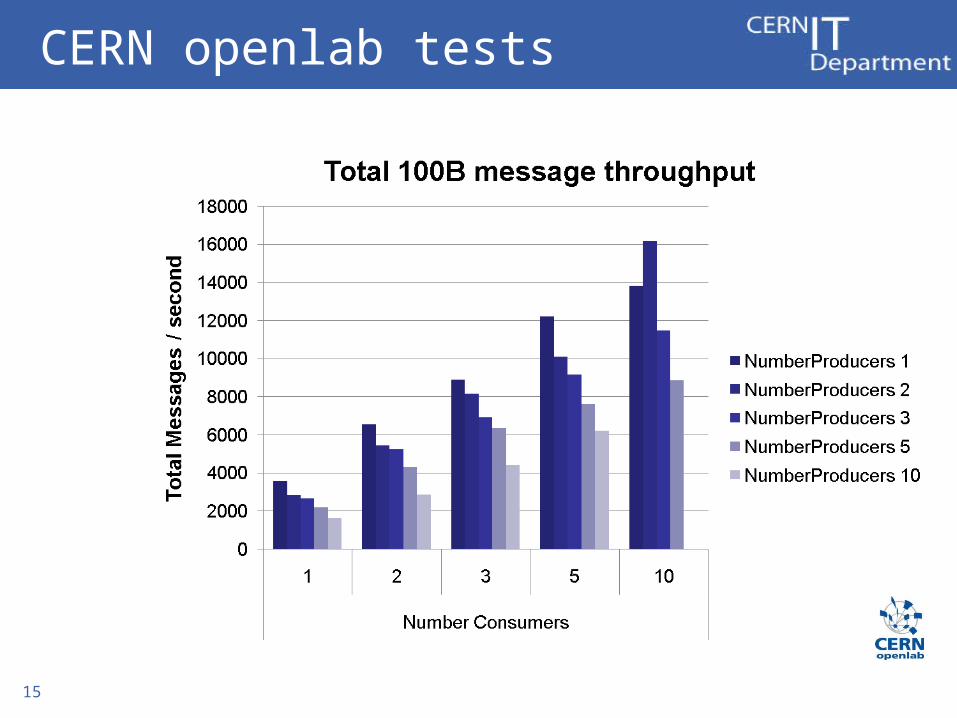
CERN openlab tests
15
Messaging is a key technology for WLCG
• WLCG Experiments are buying into messaging– ATLAS DDM
• Moving to a production messaging service
– Ganga– VO Job monitoring– Alice data transfers
• dCache can use it for distributed pools– Developments by NDGF
• CERN Beams use it for monitoring in the control room
SAM and Nagios
• Service Availability Monitoring (SAM)– A distributed monitoring system– Based on open-source components
• Nagios for test execution• ActiveMQ for communication via messaging
– With custom visualization• MyEGEE/MyWGI/MyWLCG/...
• Aims to test all resources on the production grid– And provides data to other components for
availability and reliability calculation
Nagios at a Site
• Simplest model– A site wants fabric monitoring for the grid services
1.Download ‘EGEE-Nagios’ meta-package2.Configure it as a site Nagios
– Point at your site BDII– Give it a certificate & email of local administrator
3.Nagios now will test all resources in your site– Mail admin list on errors– Provides web interface for more details– Detailed low-level tests for all services
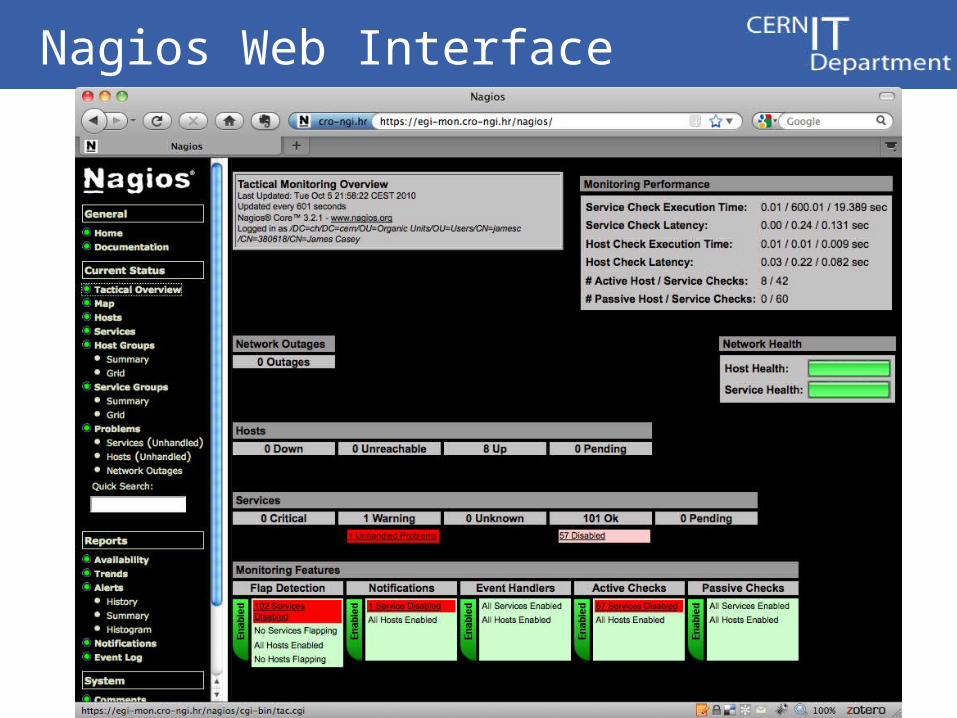
Nagios Web Interface
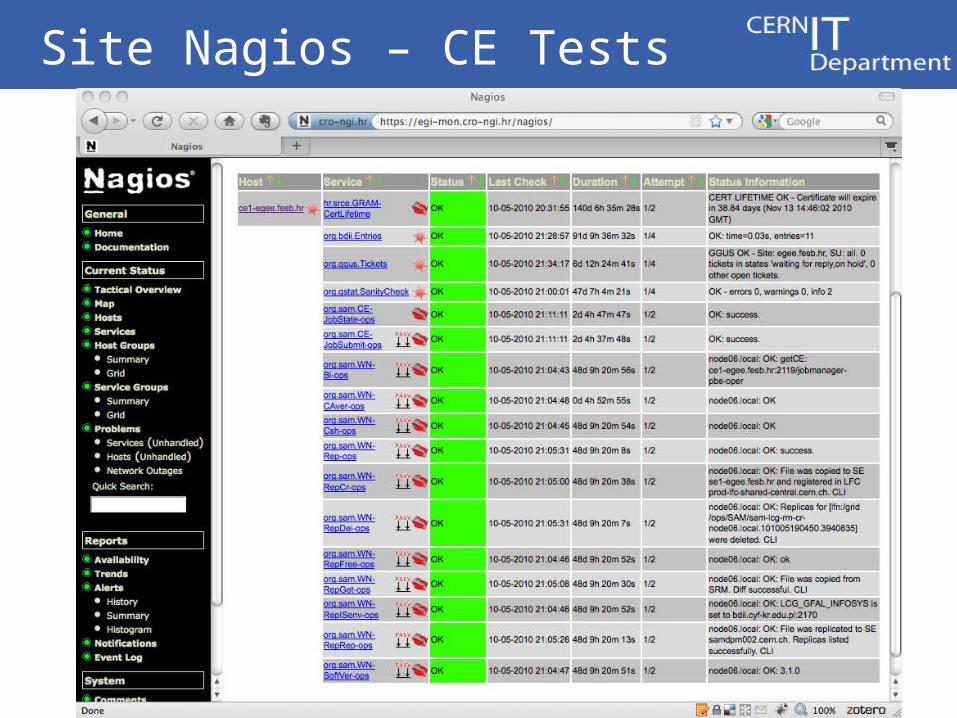
Site Nagios – CE Tests
Nagios at the region
• A NGI or ROC monitors all it’s sites– “Simulates users actions via the public interfaces”– At a higher level than the site monitoring
• Allows regional operations to help manage the site
• Feeds into availability calculations• Feeds back into the site monitoring
– You see the view the ROC has of you– And it can trigger local alerts into the operational
process
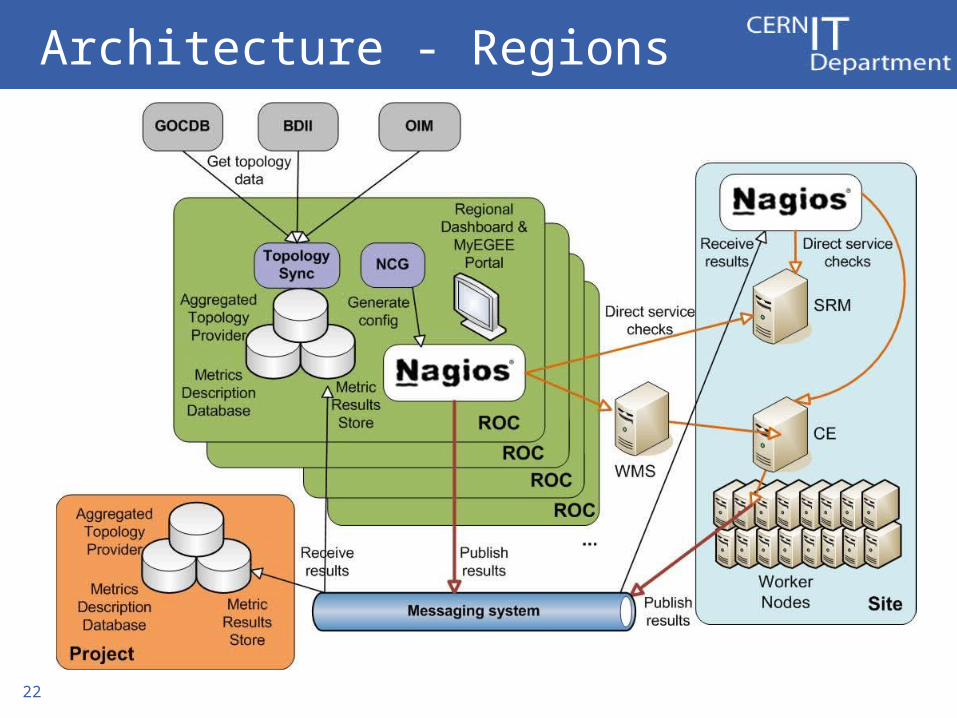
Architecture - Regions
22
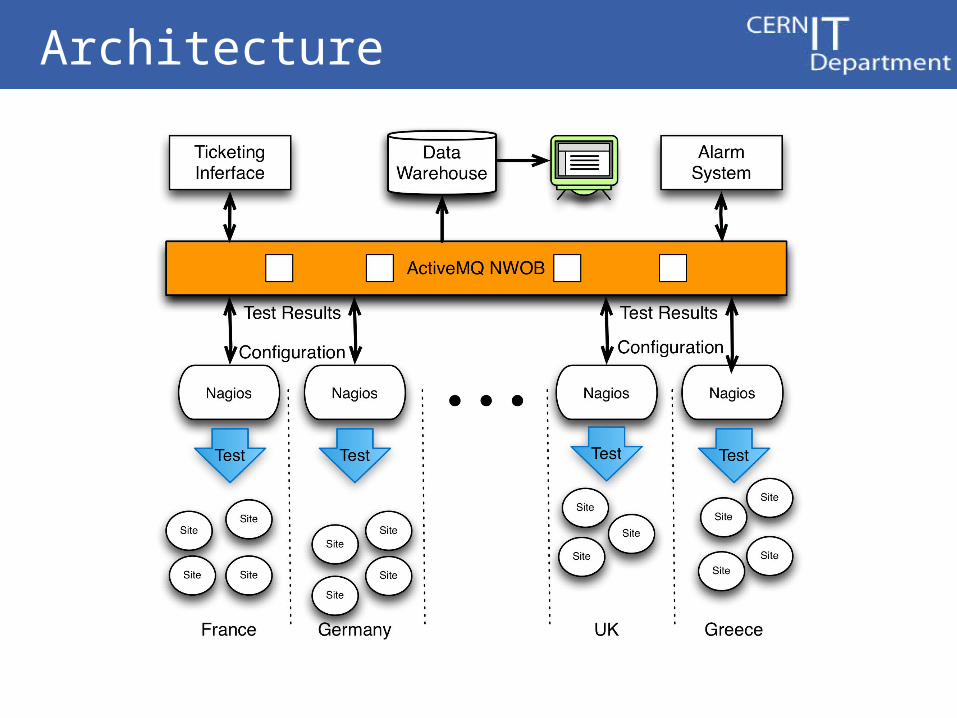
Architecture
Current Status
• 27 national level Nagios servers– Should grow out to full WLCG scale in next few
months
• Clients distributed across 40 countries• 315 sites• 5K services• 500,000 test results/day• 5 consumers of full data stream to database for
analysis and post processing
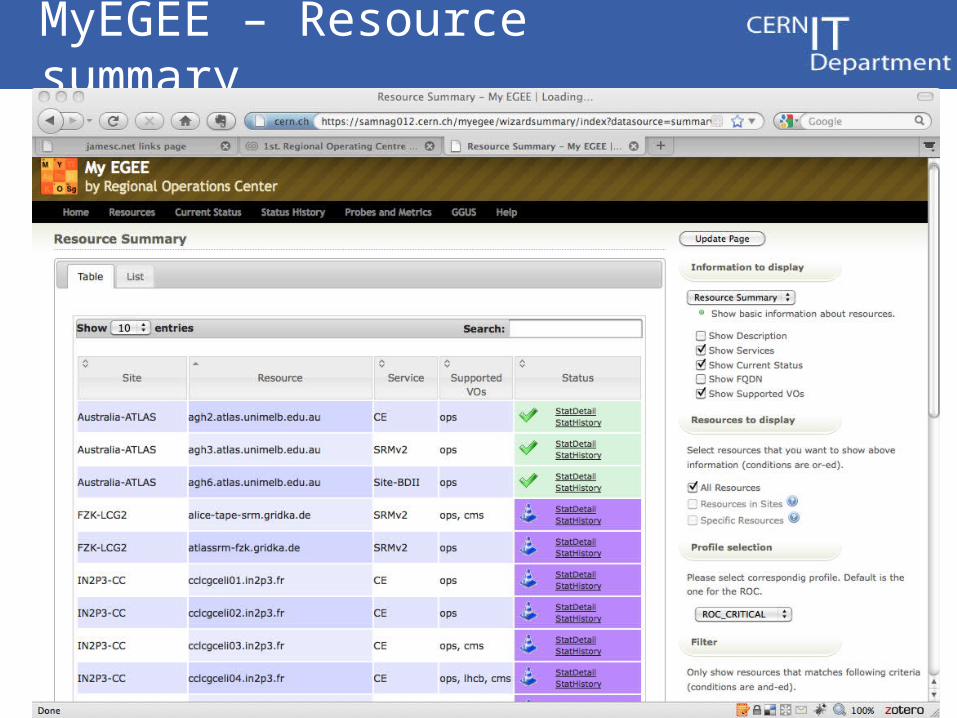
MyEGEE – Resource summary

MyEGEE – Status history
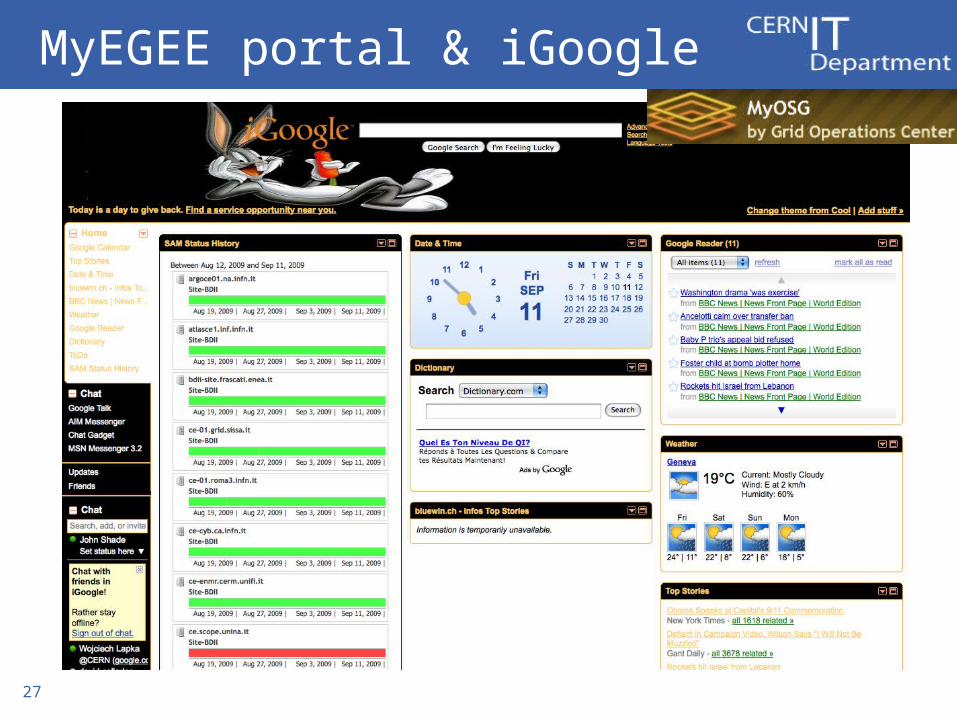
MyEGEE portal & iGoogle
27
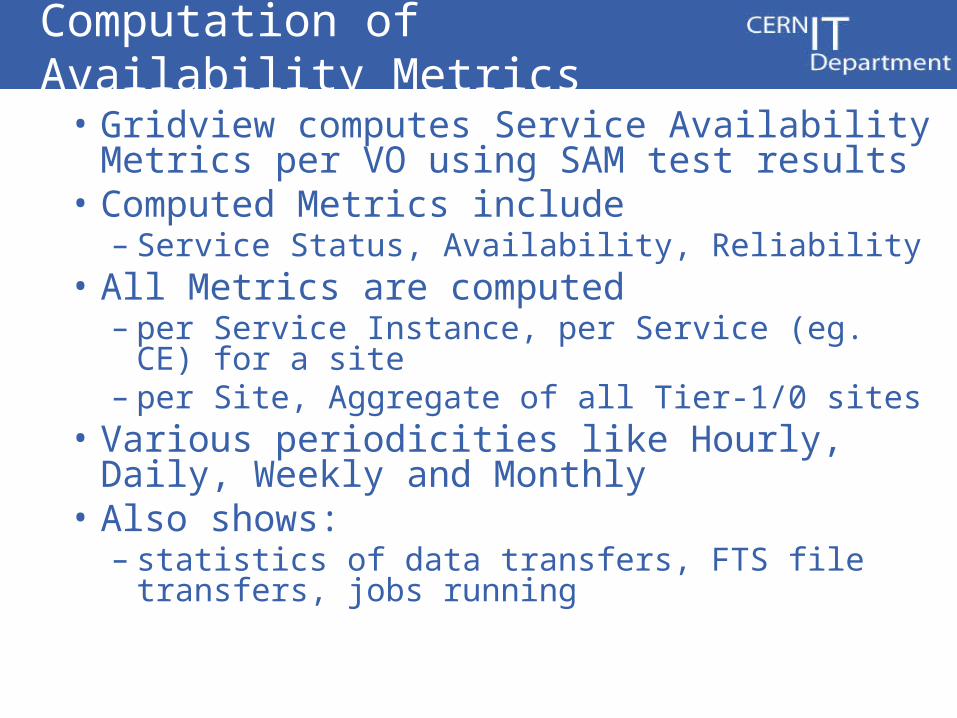
Computation of Availability Metrics
• Gridview computes Service Availability Metrics per VO using SAM test results
• Computed Metrics include– Service Status, Availability, Reliability
• All Metrics are computed– per Service Instance, per Service (eg. CE) for a site – per Site, Aggregate of all Tier-1/0 sites
• Various periodicities like Hourly, Daily, Weekly and Monthly
• Also shows:– statistics of data transfers, FTS file transfers, jobs
running
29
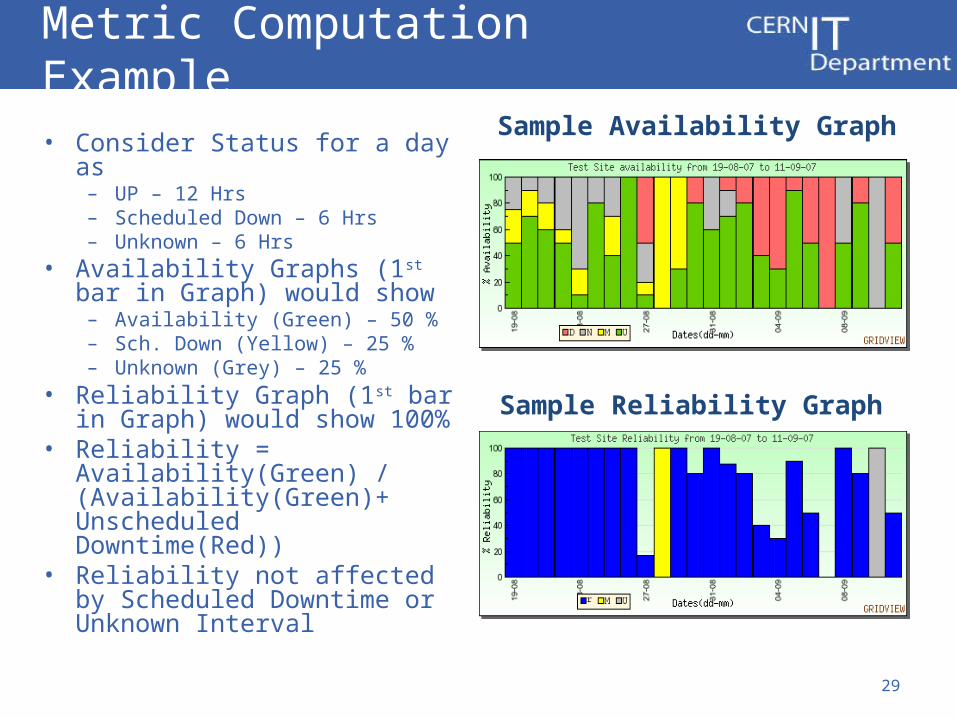
Metric Computation Example
• Consider Status for a day as– UP – 12 Hrs– Scheduled Down – 6 Hrs– Unknown – 6 Hrs
• Availability Graphs (1st bar in Graph) would show
– Availability (Green) – 50 %– Sch. Down (Yellow) – 25 %– Unknown (Grey) – 25 %
• Reliability Graph (1st bar in Graph) would show 100%
• Reliability = Availability(Green) / (Availability(Green)+ Unscheduled Downtime(Red))
• Reliability not affected by Scheduled Downtime or Unknown Interval
Sample Reliability Graph
Sample Availability Graph
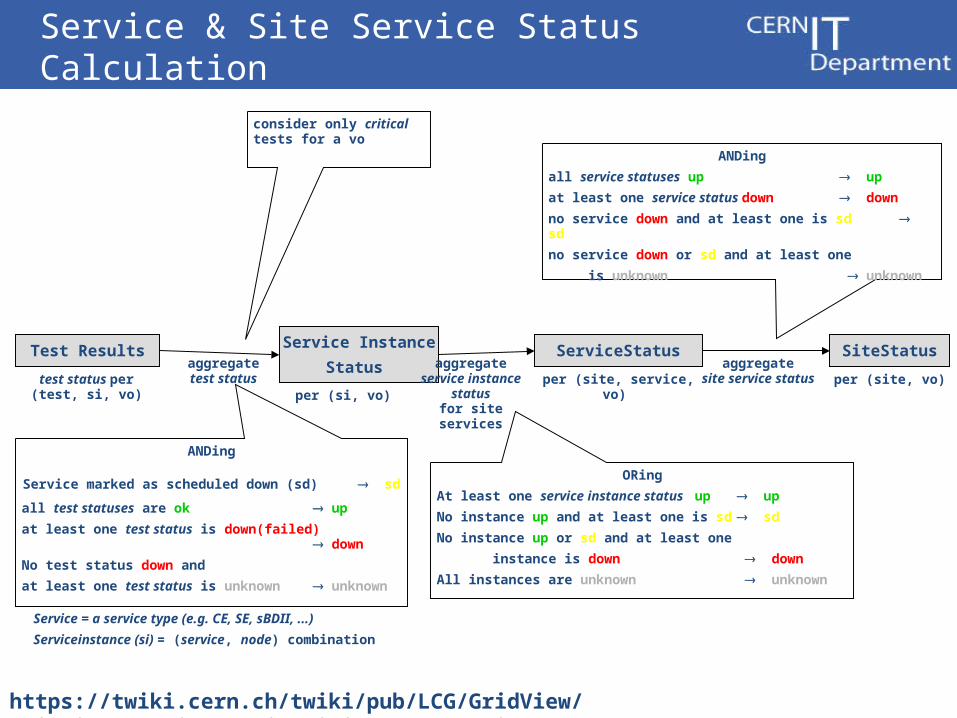
Service & Site Service Status Calculation
test status per (test, si, vo)
Test Results Service Instance
Status ServiceStatus SiteStatus
aggregatetest status
per (si, vo)
Service = a service type (e.g. CE, SE, sBDII, ...)
Serviceinstance (si) = (service, node) combination
consider only critical tests for a vo
ANDing
Service marked as scheduled down (sd) sd
all test statuses are ok up
at least one test status is down(failed) down
No test status down and
at least one test status is unknown unknown
aggregateservice instance
statusfor site services
per (site, service, vo)
ORing
At least one service instance status up up
No instance up and at least one is sd sd
No instance up or sd and at least one
instance is down down
All instances are unknown unknown
aggregatesite service
statusper (site, vo)
ANDing
all service statuses up up
at least one service status down down
no service down and at least one is sd sd
no service down or sd and at least one
is unknown unknown
https://twiki.cern.ch/twiki/pub/LCG/GridView/Gridview_Service_Availability_Computation.pdf
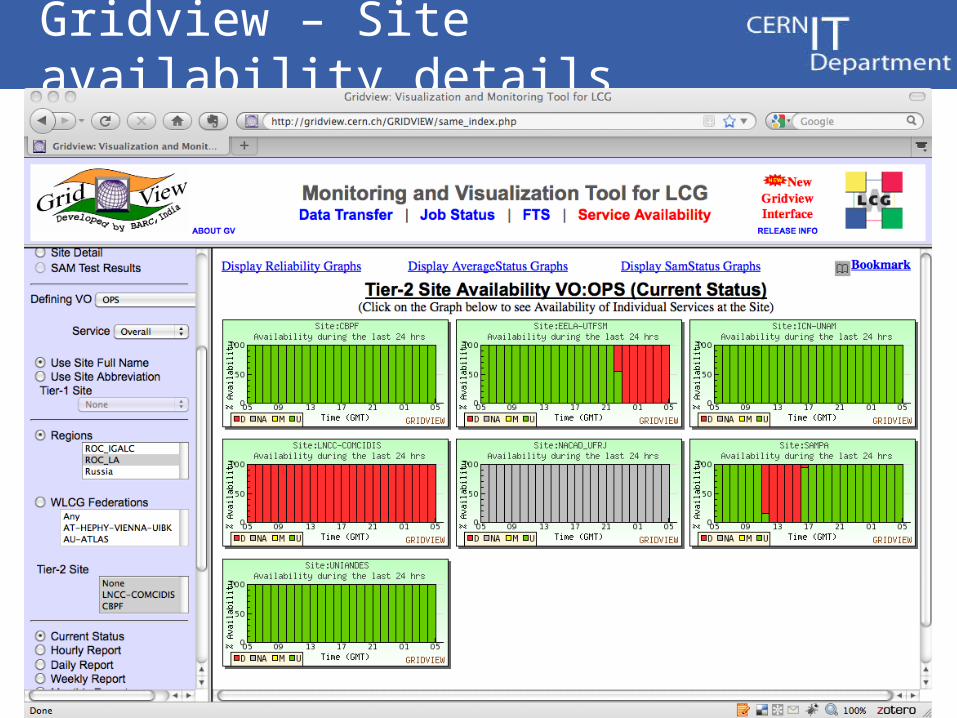
Gridview – Site availability details
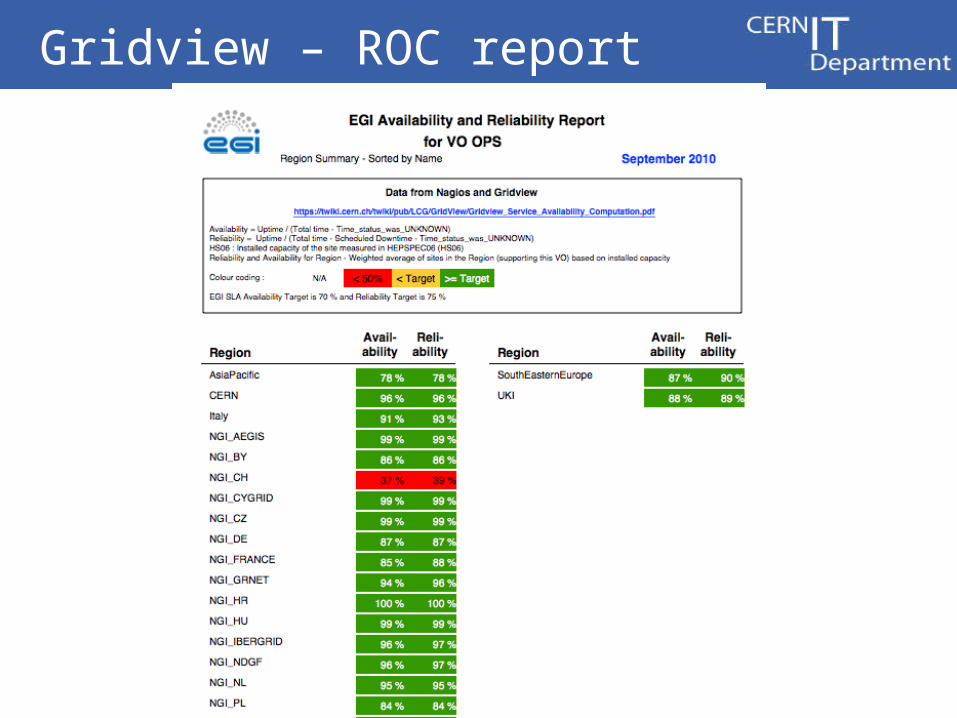
Gridview – ROC report
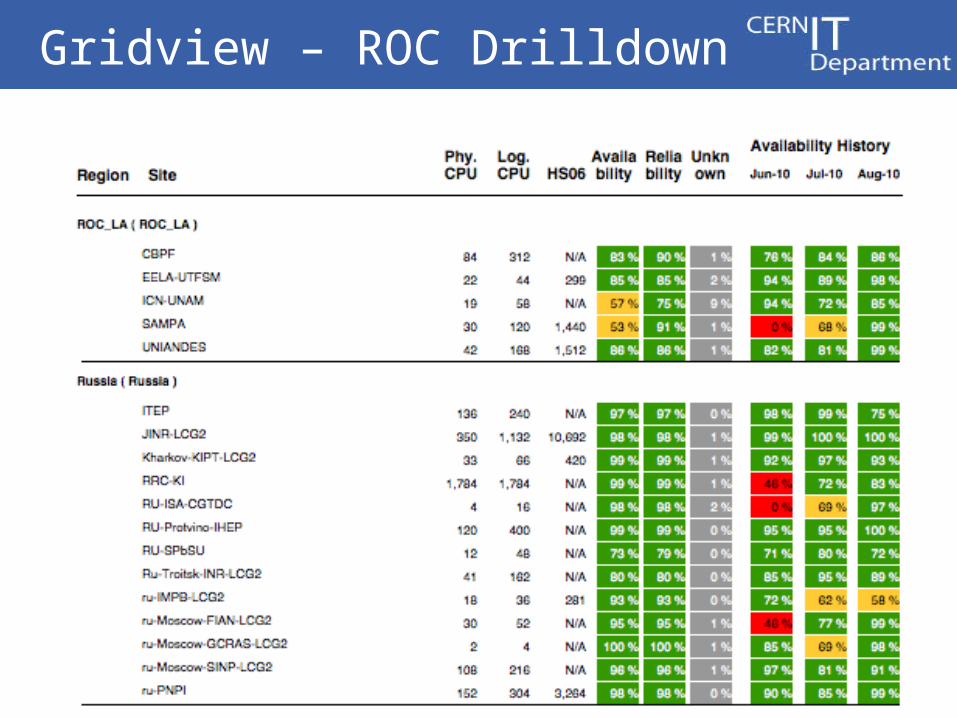
Gridview – ROC Drilldown
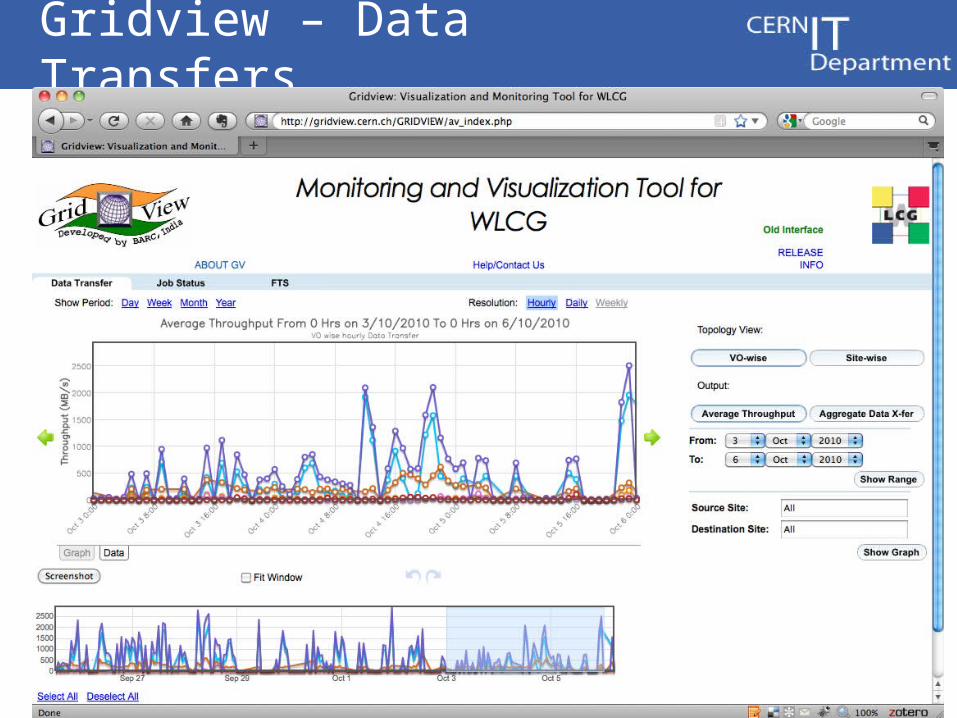
Gridview – Data Transfers
Gstat – Information System visualization
• Information system contains the middleware view of the infrastructure
• Main usage:– Service Discovery – what is there?– Installed Capacity – how much is there ?– VO Views – what can a VO use ?
• Gstat provides visual representation of this– Management tool for NGI/WLCG managers– Debugging tool for site admins
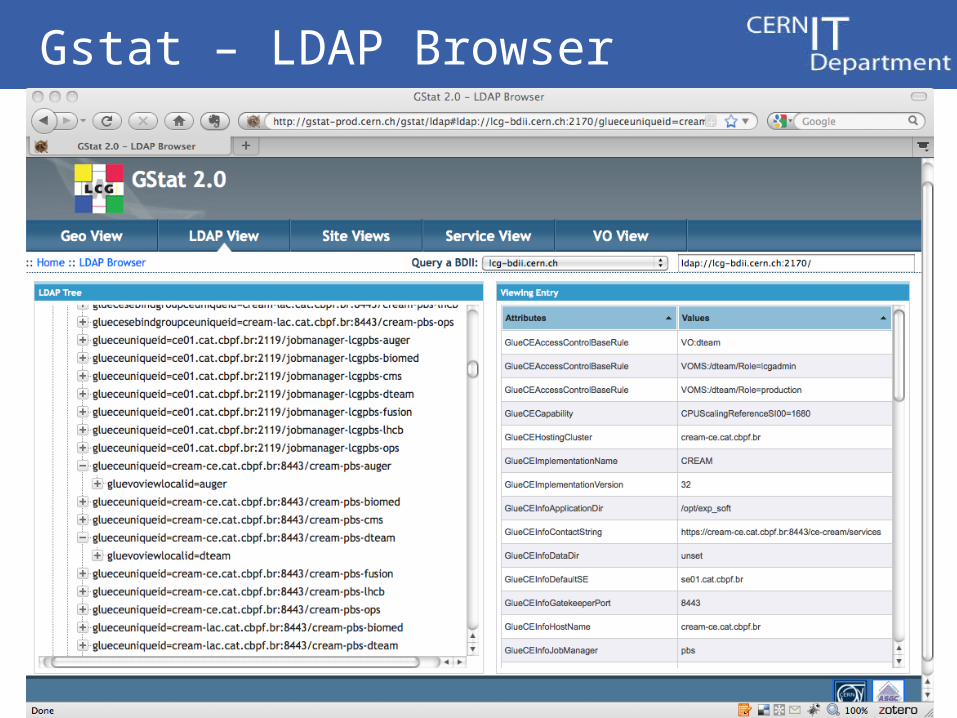
Gstat – LDAP Browser
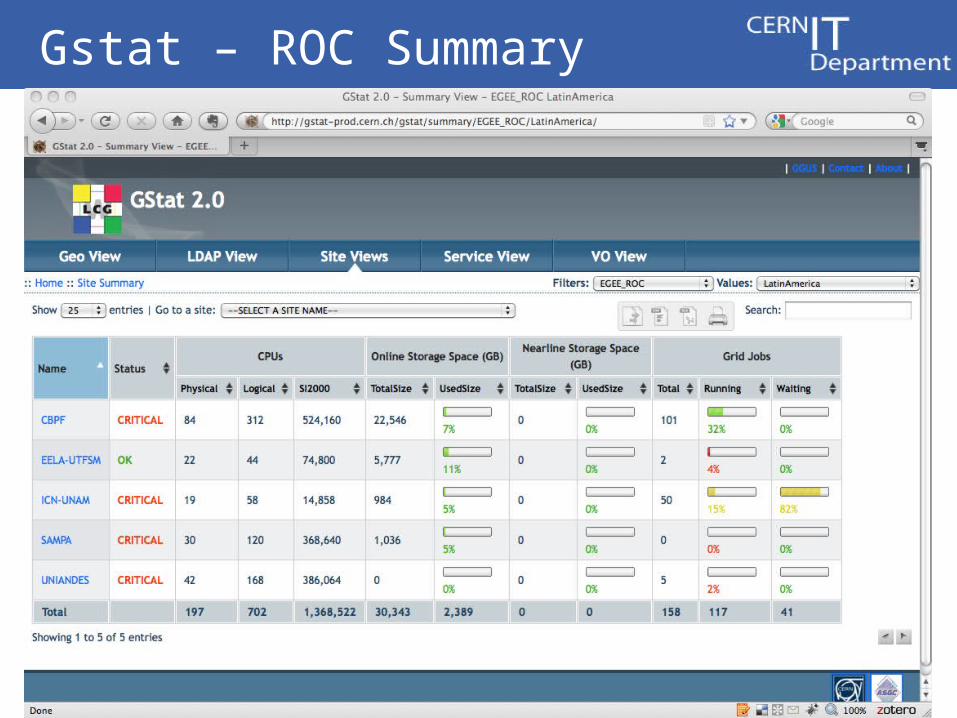
Gstat – ROC Summary
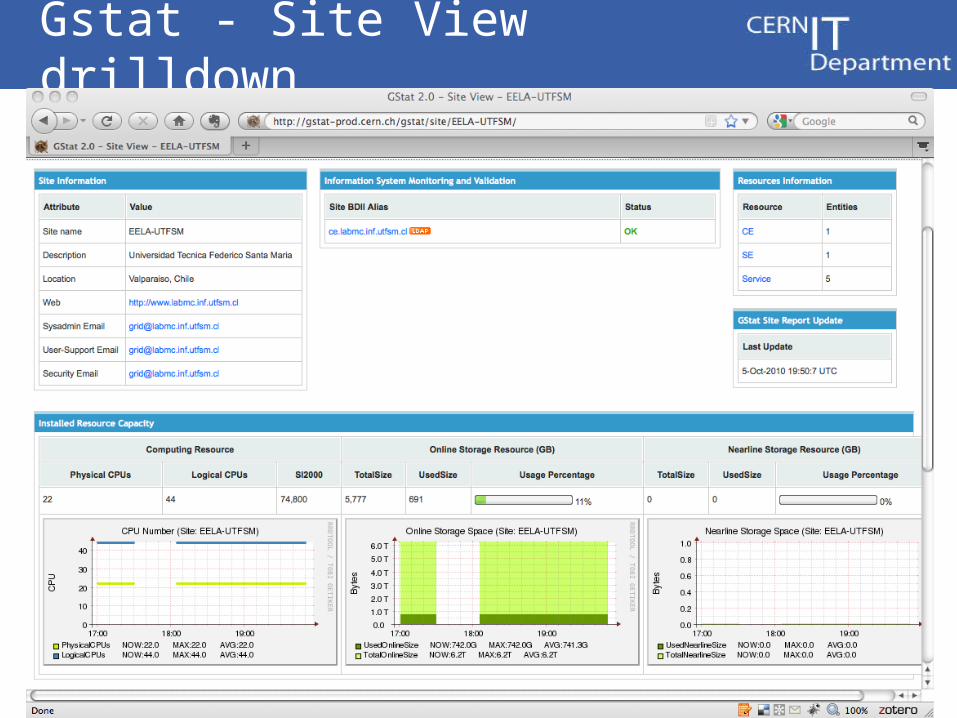
Gstat - Site View drilldown
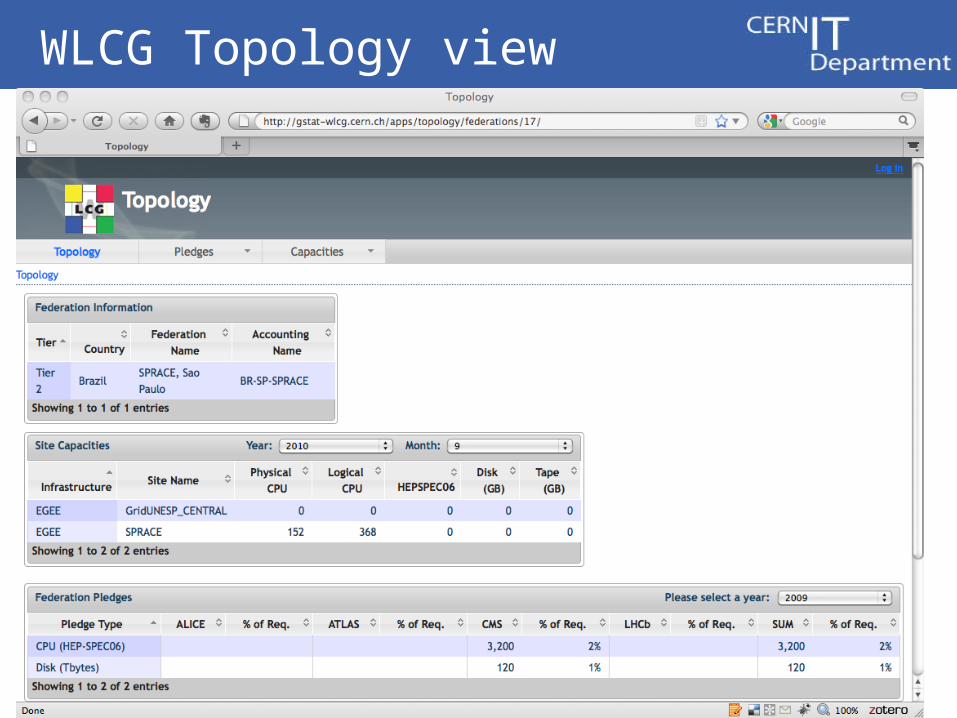
WLCG Topology view
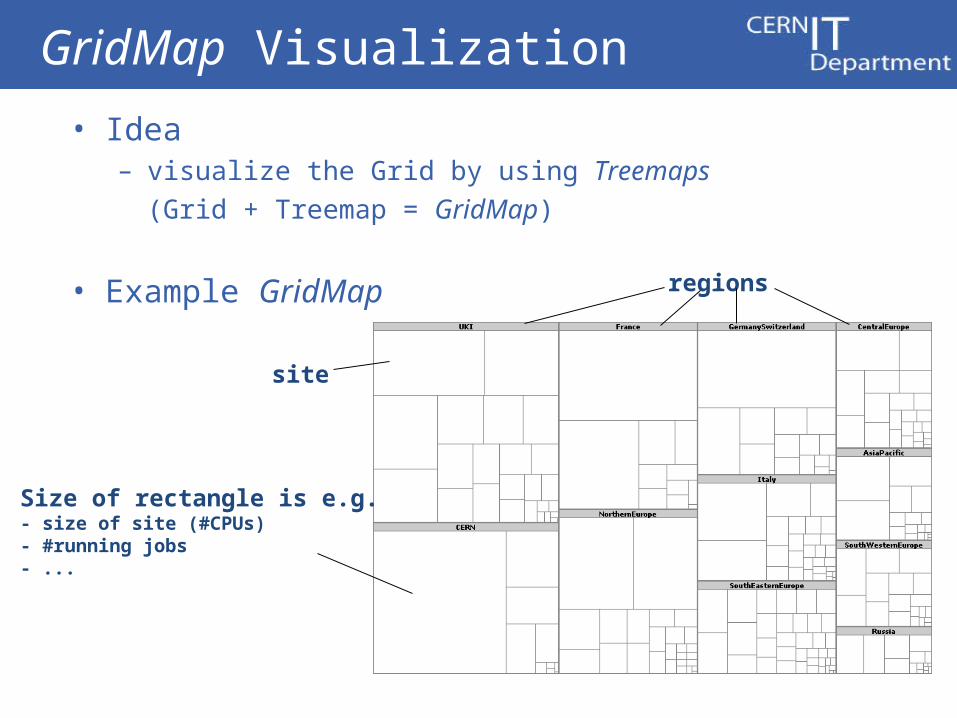
GridMap Visualization
site
regions
Size of rectangle is e.g.- size of site (#CPUs)- #running jobs- ...
• Idea– visualize the Grid by using Treemaps
(Grid + Treemap = GridMap)
• Example GridMap
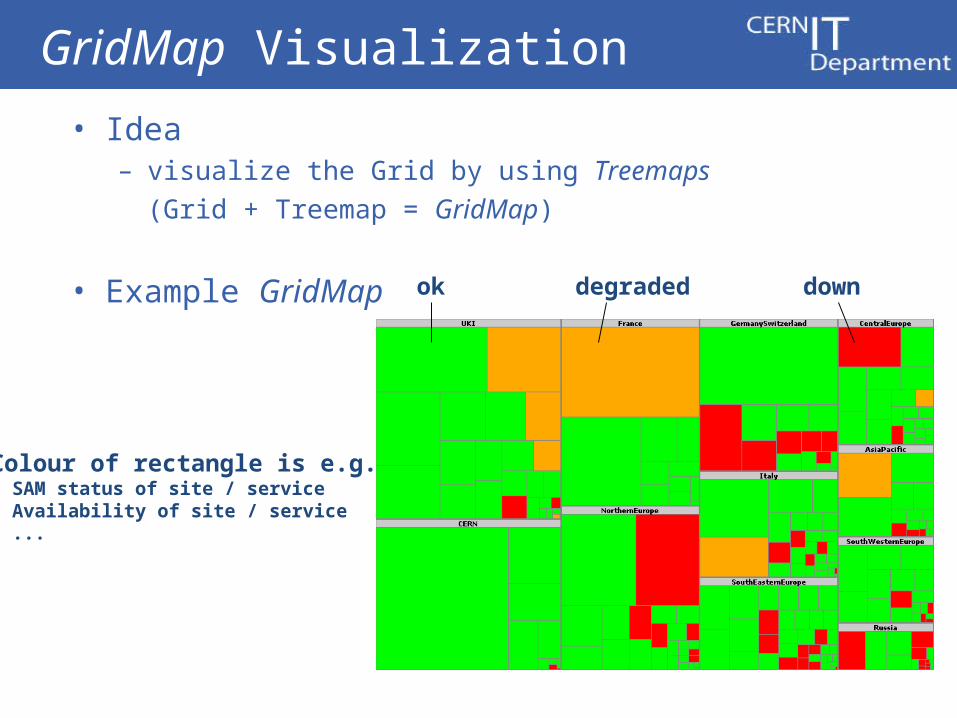
GridMap Visualization
• Idea– visualize the Grid by using Treemaps
(Grid + Treemap = GridMap)
• Example GridMap
Colour of rectangle is e.g.- SAM status of site / service- Availability of site / service- ...
ok degraded down
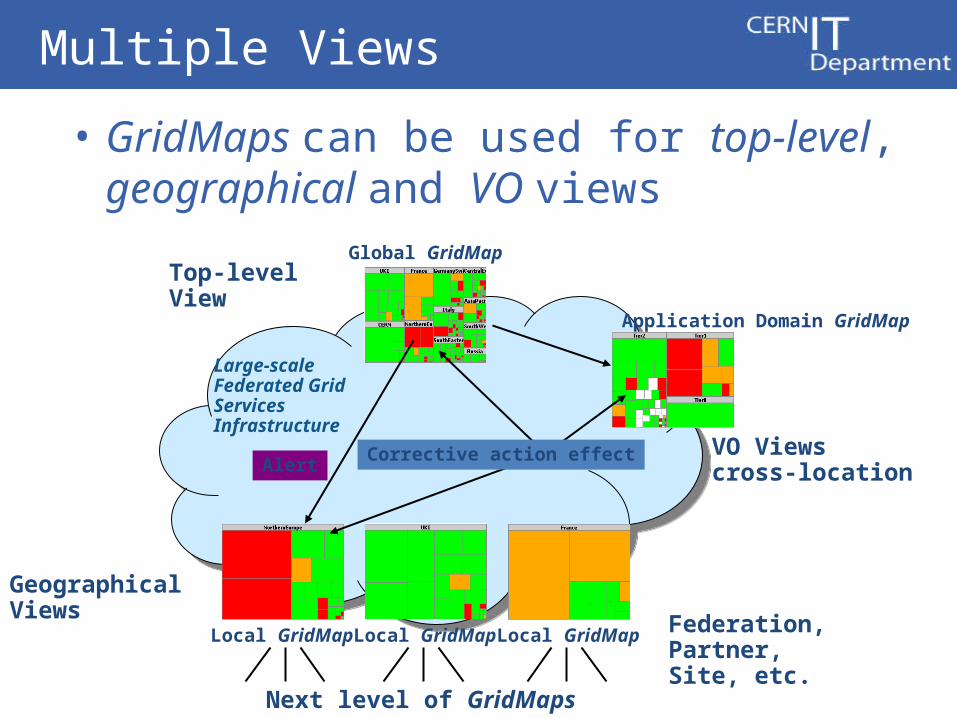
Multiple Views
• GridMaps can be used for top-level, geographical and VO views
VO Viewscross-location
Top-level View
GeographicalViews
Federation,Partner,Site, etc.
Next level of GridMaps
Large-scale Federated Grid Services Infrastructure
Global GridMap
Application Domain GridMap
Local GridMap Local GridMap Local GridMap
AlertCorrective action effect
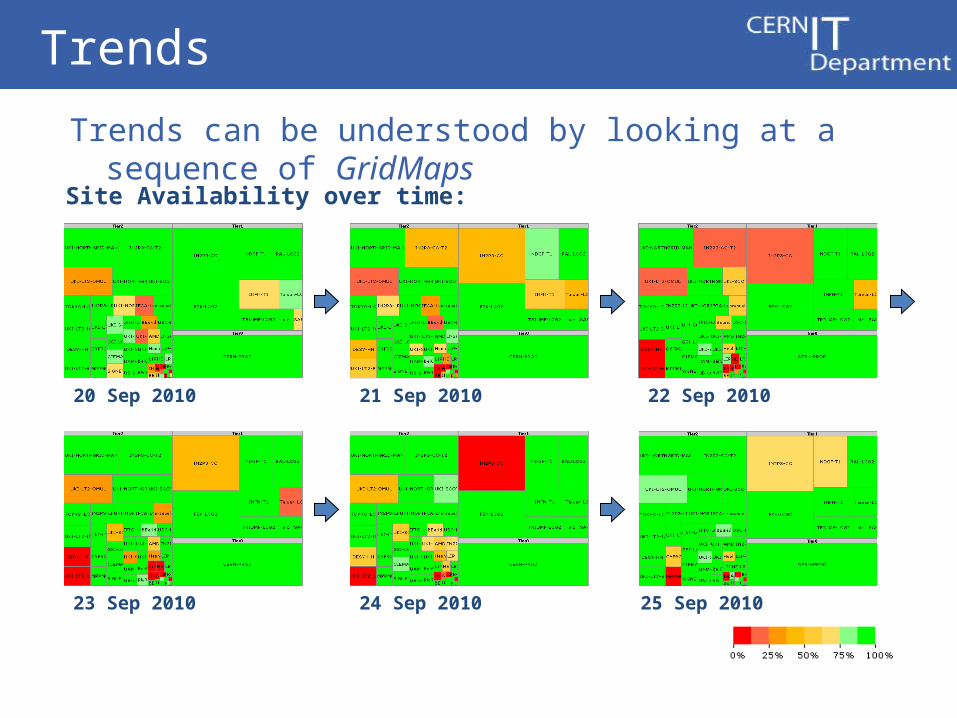
Trends
Trends can be understood by looking at a sequence of GridMaps
25 Sep 201024 Sep 201023 Sep 2010
Site Availability over time:
22 Sep 201021 Sep 201020 Sep 2010
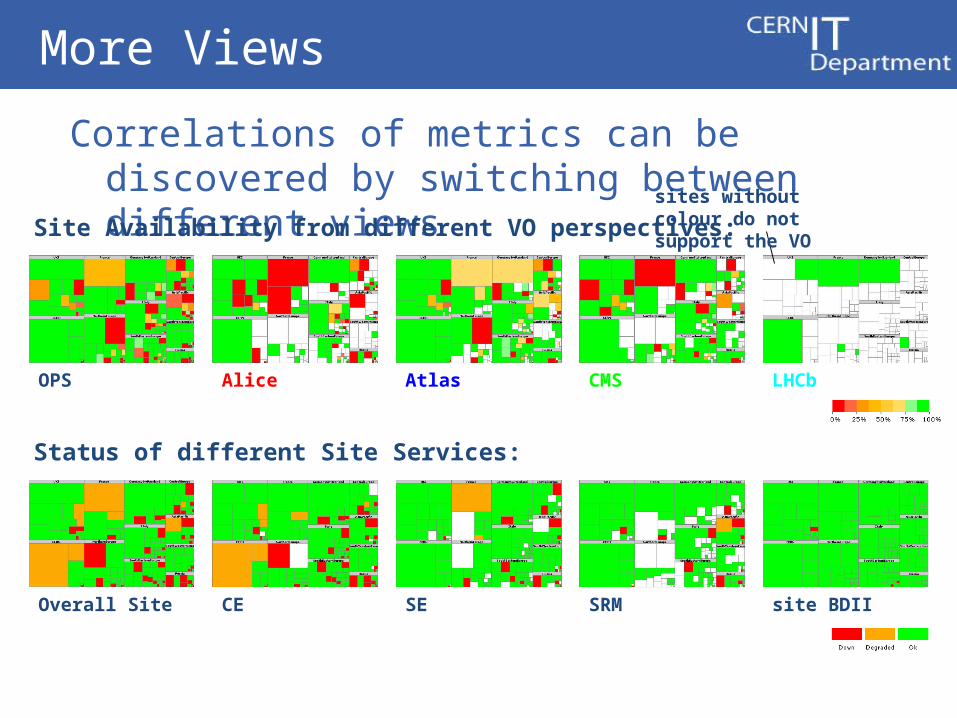
More Views
Correlations of metrics can be discovered by switching between different views
LHCbCMSAtlasAliceOPS
Site Availability from different VO perspectives:
site BDIISRMSECEOverall Site
Status of different Site Services:
sites without colour do not support the VO
MyEGEE…EGI…WLCG – The future
• An integration of the existing visualization tools– Gridmap– MyEGEE– Gridview
• Being developed for EGI right now– To satisfy the NGI and site manager requirements
• A single portal for operational information
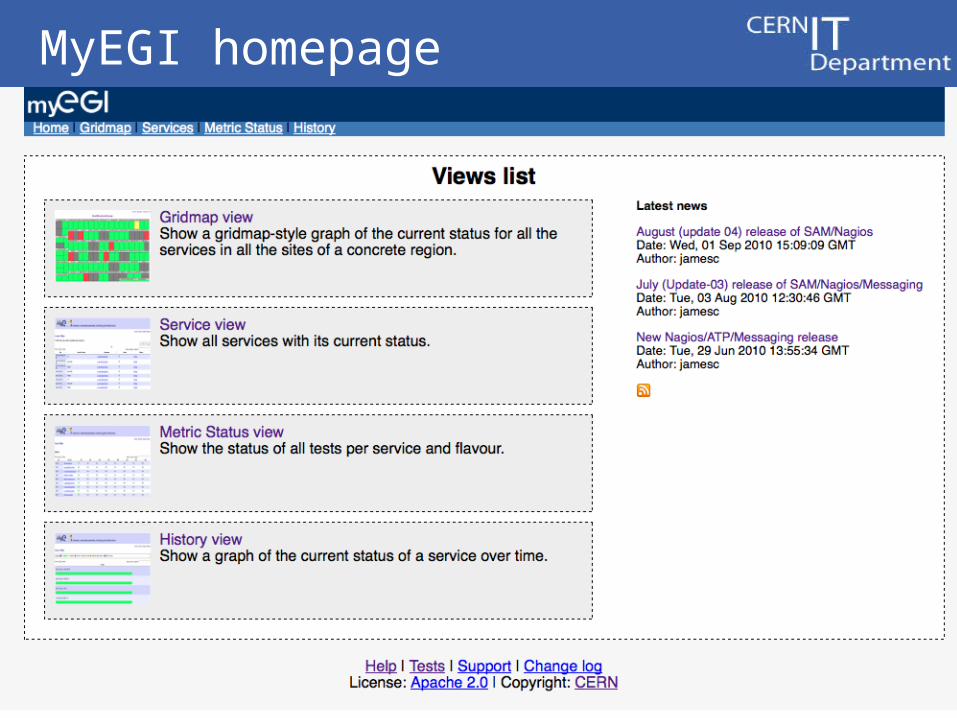
MyEGI homepage
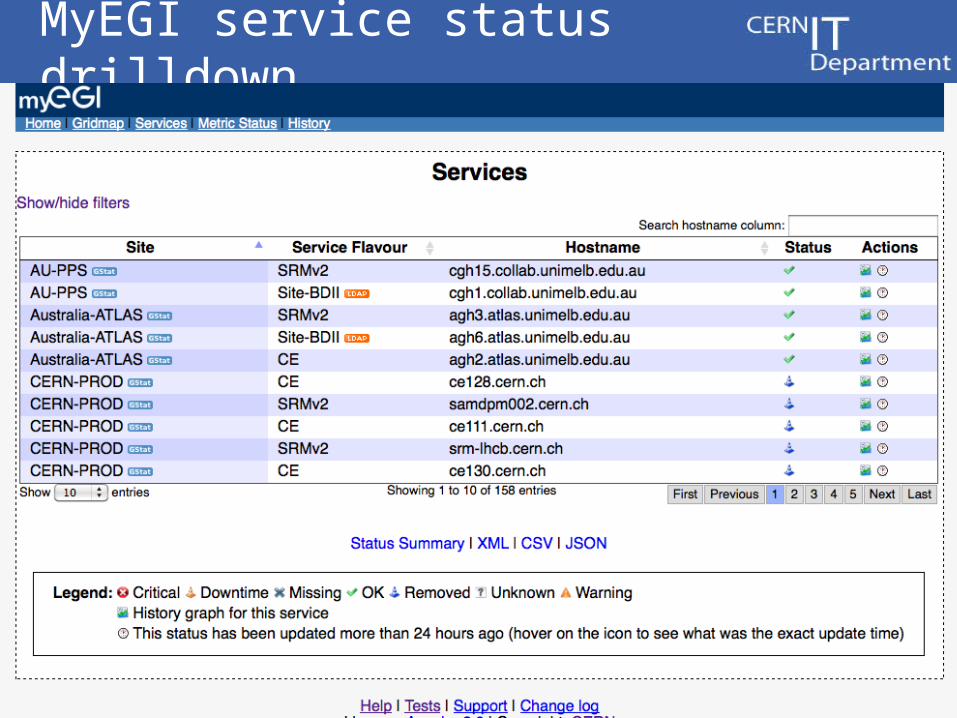
MyEGI service status drilldown
Summary
• Wide range of tools available for you• Aim is to help you to manage your site• Integrates well with the Glite middleware and
WLCG operational processes
• The future leads towards better integrated portals for complete monitoring of your systems– All open source– Contributions always welcome !!!
48
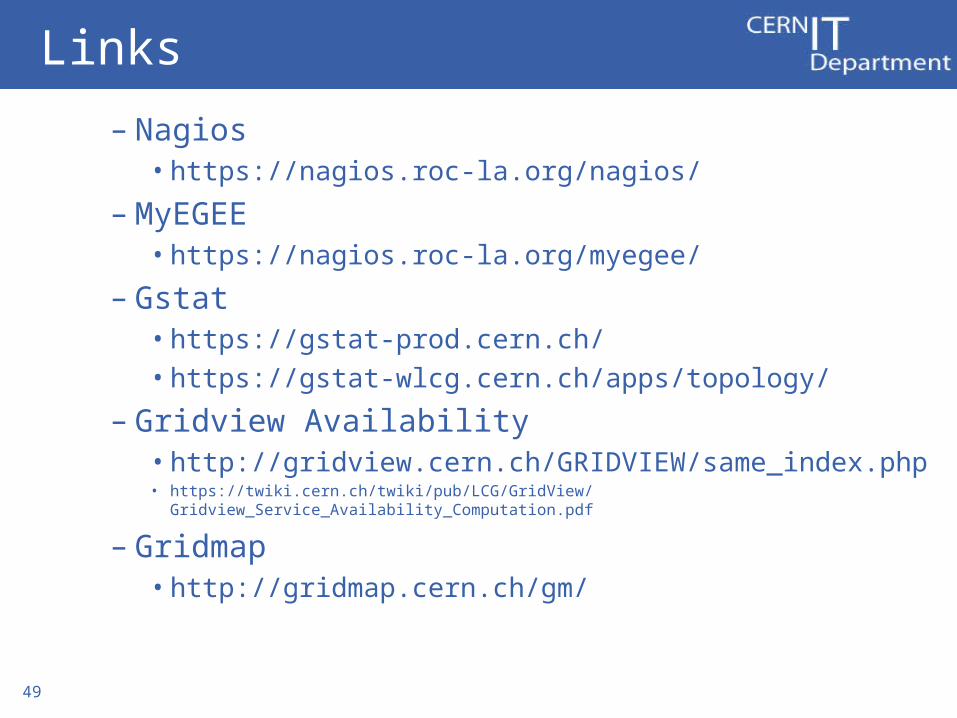
Links
– Nagios• https://nagios.roc-la.org/nagios/
– MyEGEE• https://nagios.roc-la.org/myegee/
– Gstat• https://gstat-prod.cern.ch/• https://gstat-wlcg.cern.ch/apps/topology/
– Gridview Availability• http://gridview.cern.ch/GRIDVIEW/same_index.php• https://twiki.cern.ch/twiki/pub/LCG/GridView/Gridview_Service_Availability_Computation.pdf
– Gridmap• http://gridmap.cern.ch/gm/
49
SAM Demo
• Watch our demo:– http://tinyurl.com/EgeeSAM (YouTube)– http://www.youtube.com/watch?v=PADq2x8q0kw
50