Embed Size (px)
Citation preview
Grid Connected Solar Power in India:
Status and Prospects
Rangan Banerjee
Forbes Marshall Chair Professor
Department of Energy Science and Engineering
Indian Institute of Technology Bombay
CEIC Seminar, CMU , March 27th 2013, via video-conference
2
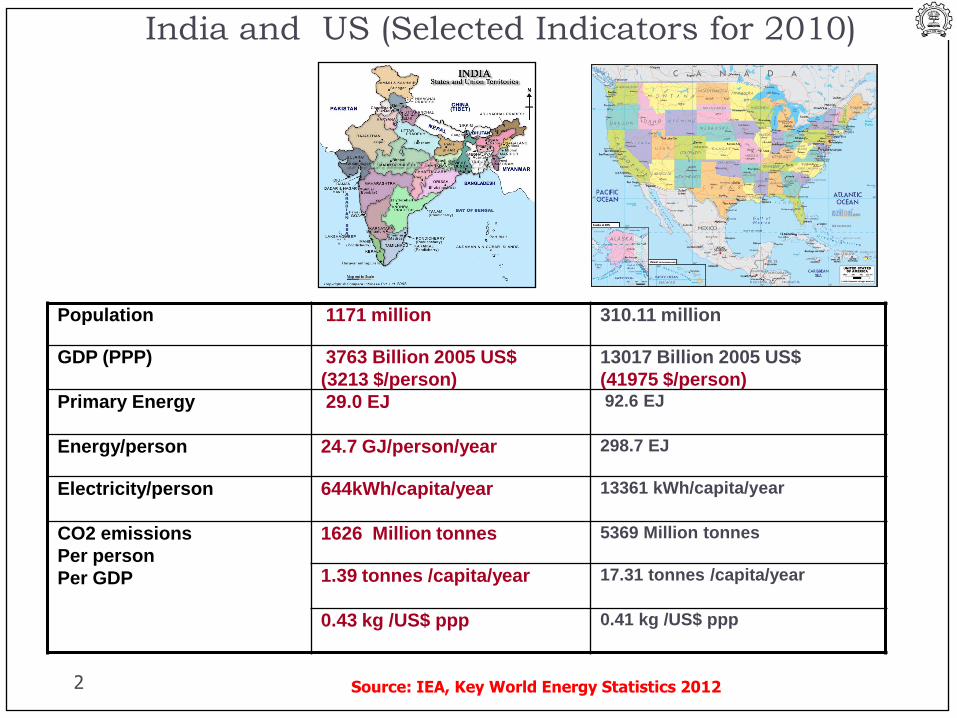
India and US (Selected Indicators for 2010)
Population 1171 million 310.11 million
GDP (PPP) 3763 Billion 2005 US$
(3213 $/person)
13017 Billion 2005 US$
(41975 $/person)
Primary Energy 29.0 EJ 92.6 EJ
Energy/person 24.7 GJ/person/year 298.7 EJ
Electricity/person 644kWh/capita/year 13361 kWh/capita/year
CO2 emissions
Per person
Per GDP
1626 Million tonnes 5369 Million tonnes
1.39 tonnes /capita/year 17.31 tonnes /capita/year
0.43 kg /US$ ppp 0.41 kg /US$ ppp
Source: IEA, Key World Energy Statistics 2012
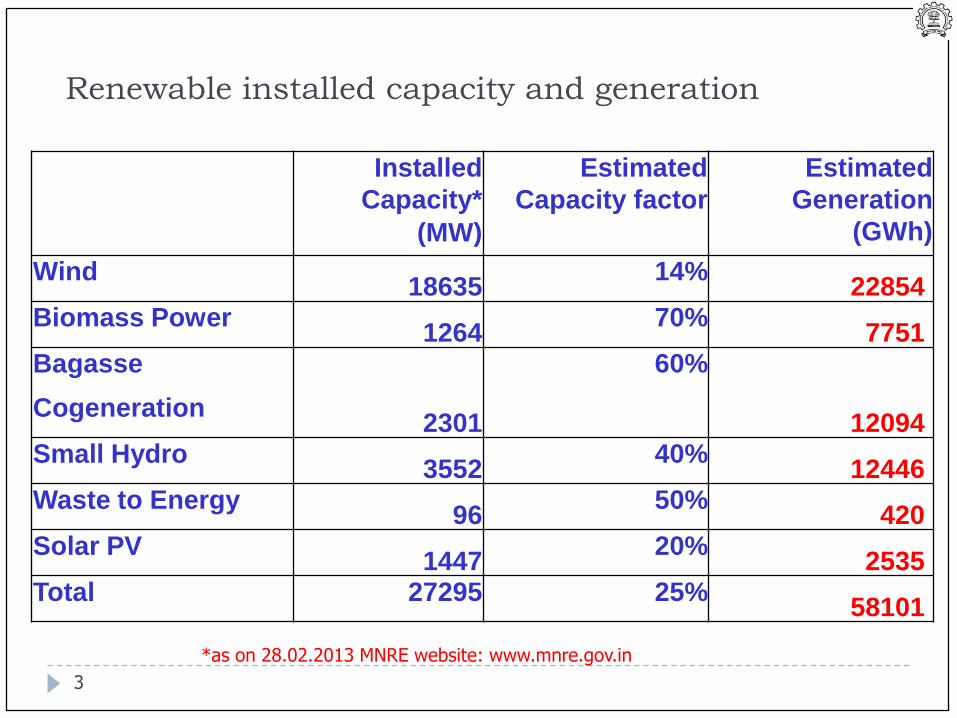
Installed
Capacity*
Estimated
Capacity factor
Estimated
Generation
(GWh) (MW)
Wind18635
14%22854
Biomass Power1264
70%7751
Bagasse
2301
60%
12094Cogeneration
Small Hydro3552
40%12446
Waste to Energy96
50%420
Solar PV1447
20%2535
Total 27295 25%58101
Renewable installed capacity and generation
*as on 28.02.2013 MNRE website: www.mnre.gov.in
3
44
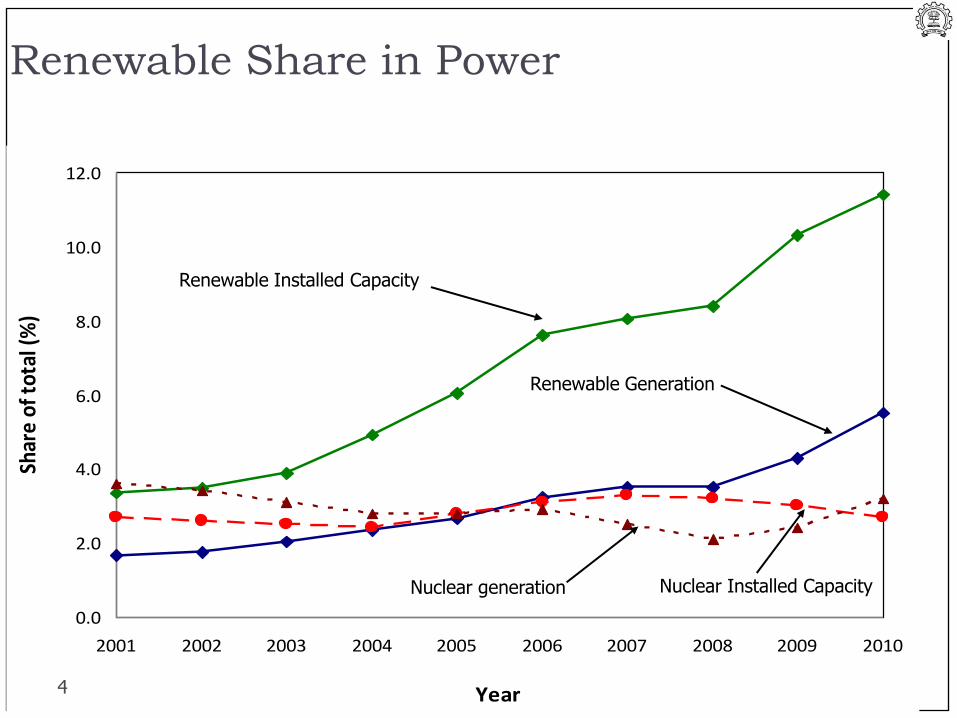
Renewable Share in Power
0.0
2.0
4.0
6.0
8.0
10.0
12.0
2001 2002 2003 2004 2005 2006 2007 2008 2009 2010
Year
Shar
e of
tot
al (%
)
Renewable Installed Capacity
Renewable Generation
Nuclear Installed CapacityNuclear generation
4
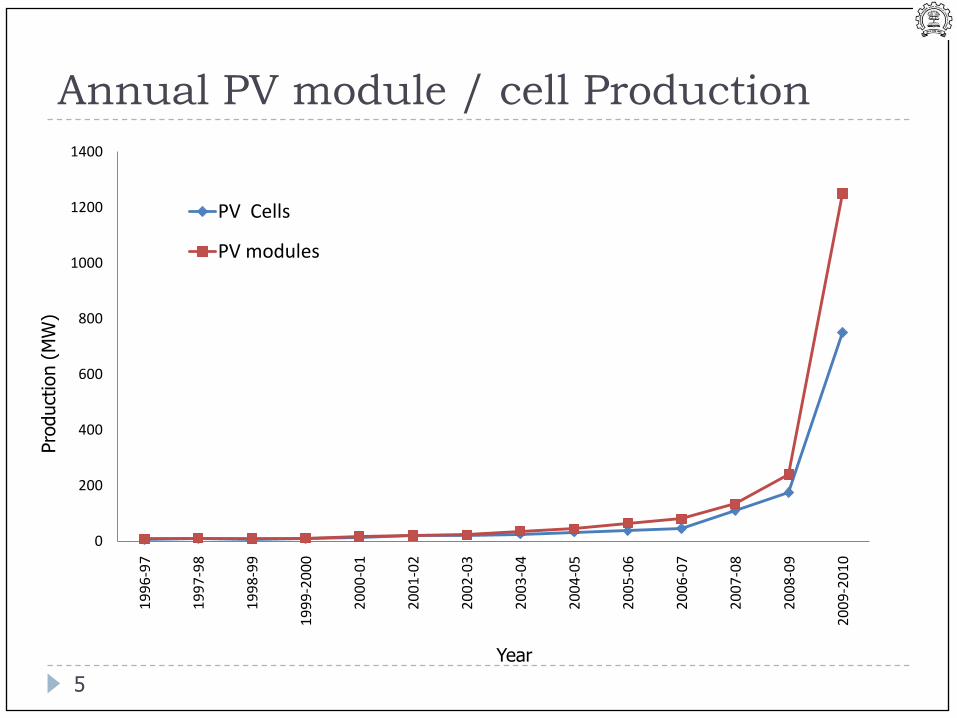
Annual PV module / cell ProductionPro
duct
ion (
MW
)
Year
0
200
400
600
800
1000
1200
14001
99
6-9
7
19
97
-98
19
98
-99
19
99
-20
00
20
00
-01
20
01
-02
20
02
-03
20
03
-04
20
04
-05
20
05
-06
20
06
-07
20
07
-08
20
08
-09
20
09
-20
10
PV Cells
PV modules
5
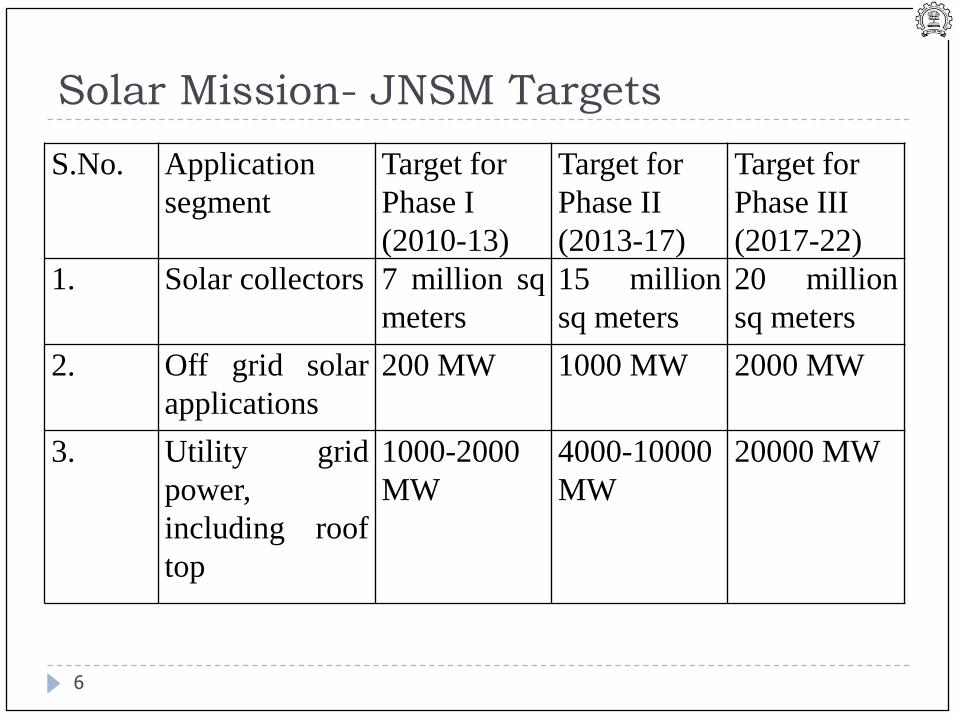
Solar Mission- JNSM Targets
6
S.No. Application
segment
Target for
Phase I
(2010-13)
Target for
Phase II
(2013-17)
Target for
Phase III
(2017-22)
1. Solar collectors 7 million sq
meters
15 million
sq meters
20 million
sq meters
2. Off grid solar
applications
200 MW 1000 MW 2000 MW
3. Utility grid
power,
including roof
top
1000-2000
MW
4000-10000
MW
20000 MW
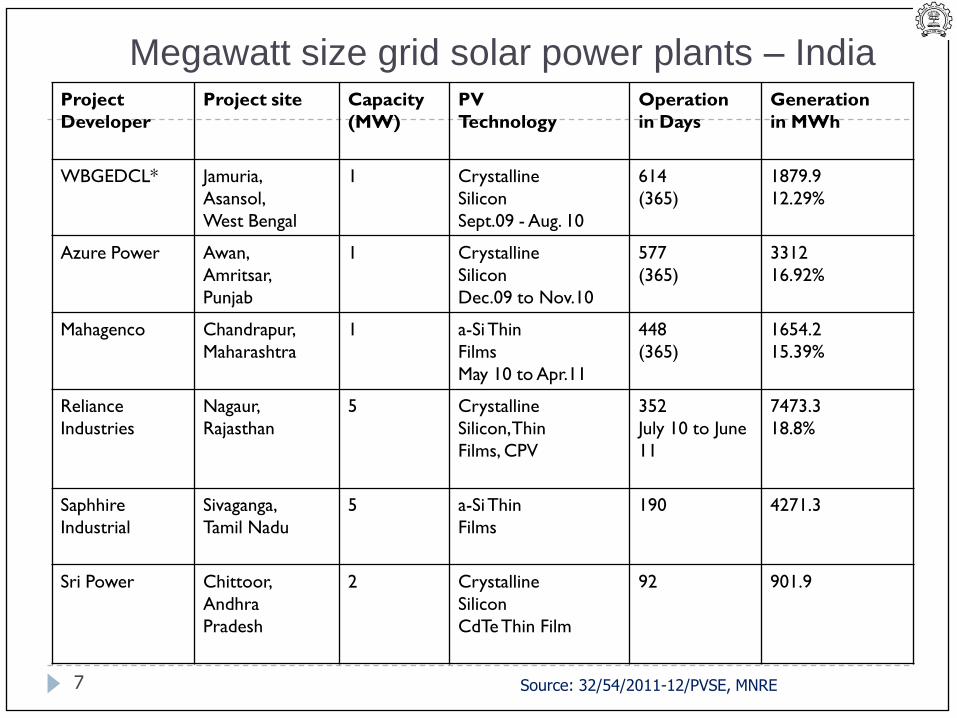
Megawatt size grid solar power plants – India
7
Project
Developer
Project site Capacity
(MW)
PV
Technology
Operation
in Days
Generation
in MWh
WBGEDCL* Jamuria,
Asansol,
West Bengal
1 Crystalline
Silicon
Sept.09 - Aug. 10
614
(365)
1879.9
12.29%
Azure Power Awan,
Amritsar,
Punjab
1 Crystalline
Silicon
Dec.09 to Nov.10
577
(365)
3312
16.92%
Mahagenco Chandrapur,
Maharashtra
1 a-Si Thin
Films
May 10 to Apr.11
448
(365)
1654.2
15.39%
Reliance
Industries
Nagaur,
Rajasthan
5 Crystalline
Silicon, Thin
Films, CPV
352
July 10 to June
11
7473.3
18.8%
Saphhire
Industrial
Sivaganga,
Tamil Nadu
5 a-Si Thin
Films
190 4271.3
Sri Power Chittoor,
Andhra
Pradesh
2 Crystalline
Silicon
CdTeThin Film
92 901.9
Source: 32/54/2011-12/PVSE, MNRE

8
0
50
100
150
200
250
300
Jan Feb Mar Apr May Jun Jul Aug Sep Oct Nov Dec
Avera
ge M
on
thly
Gen
era
tio
n (
kW
)Punjab
Model
Punjab
Model
WB
mod
el
WB
2010
Actual
WB
2011
Actual
Actual
Punjab
2010
9
0
0.2
0.4
0.6
0.8
1
1.2
23:30 1:00 2:30 4:00 5:30 7:00 8:30 10:00 11:30 13:00 14:30 16:00 17:30 19:00 20:30 22:00 23:30
No
. of
Un
its
Gen
era
ted
Th
ou
san
ds
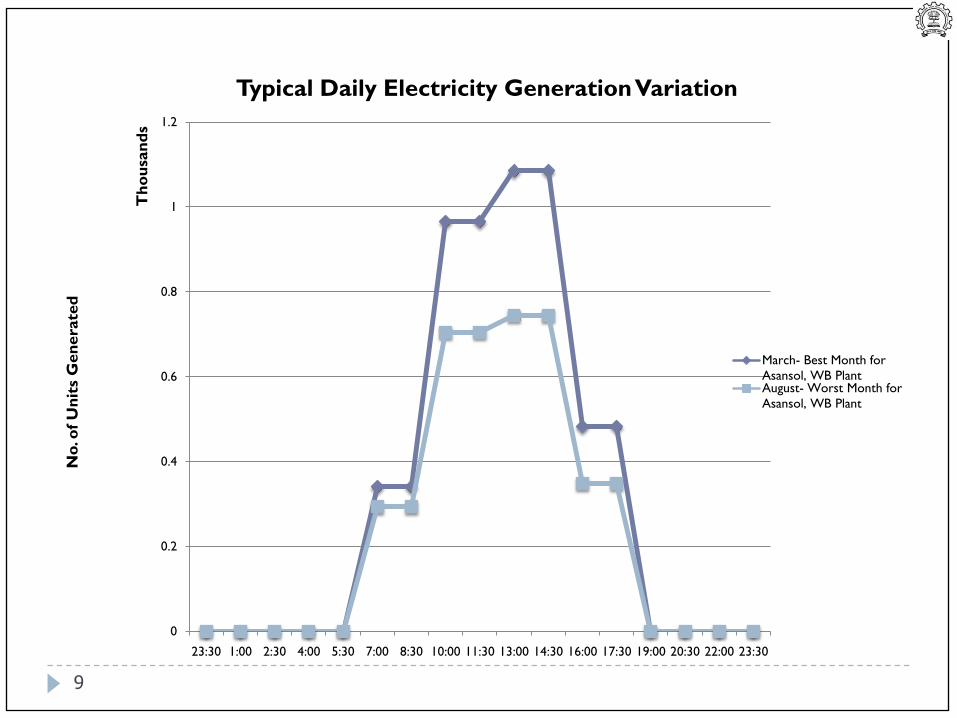
Typical Daily Electricity Generation Variation
March- Best Month for
Asansol, WB PlantAugust- Worst Month for
Asansol, WB Plant
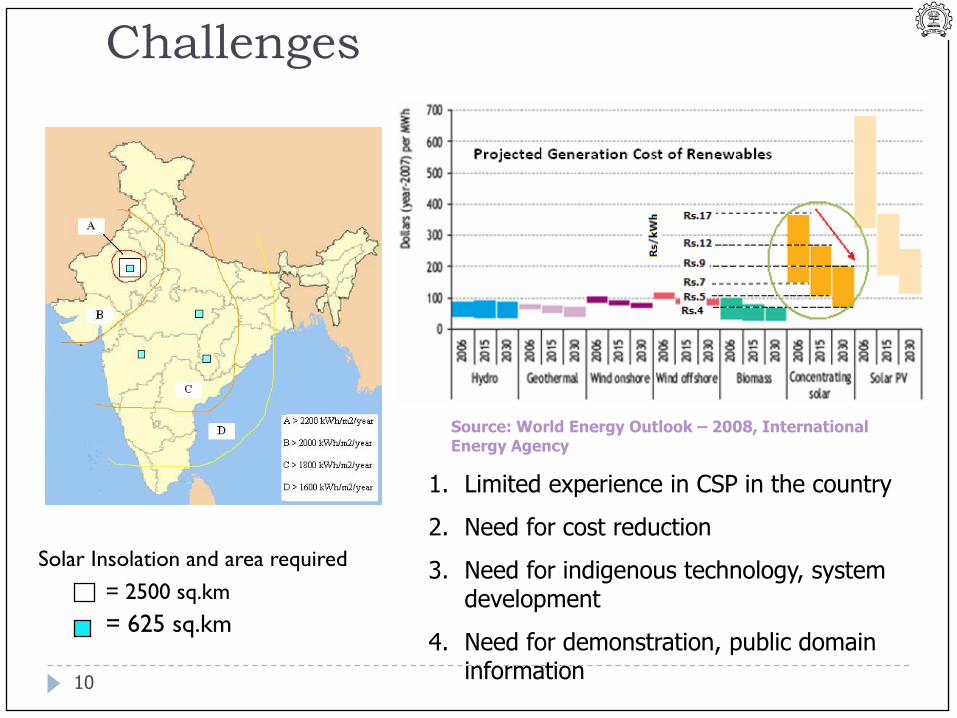
10
Challenges
Solar Insolation and area required
= 2500 sq.km
= 625 sq.km
Source: World Energy Outlook – 2008, International Energy Agency
1. Limited experience in CSP in the country
2. Need for cost reduction
3. Need for indigenous technology, system development
4. Need for demonstration, public domain information
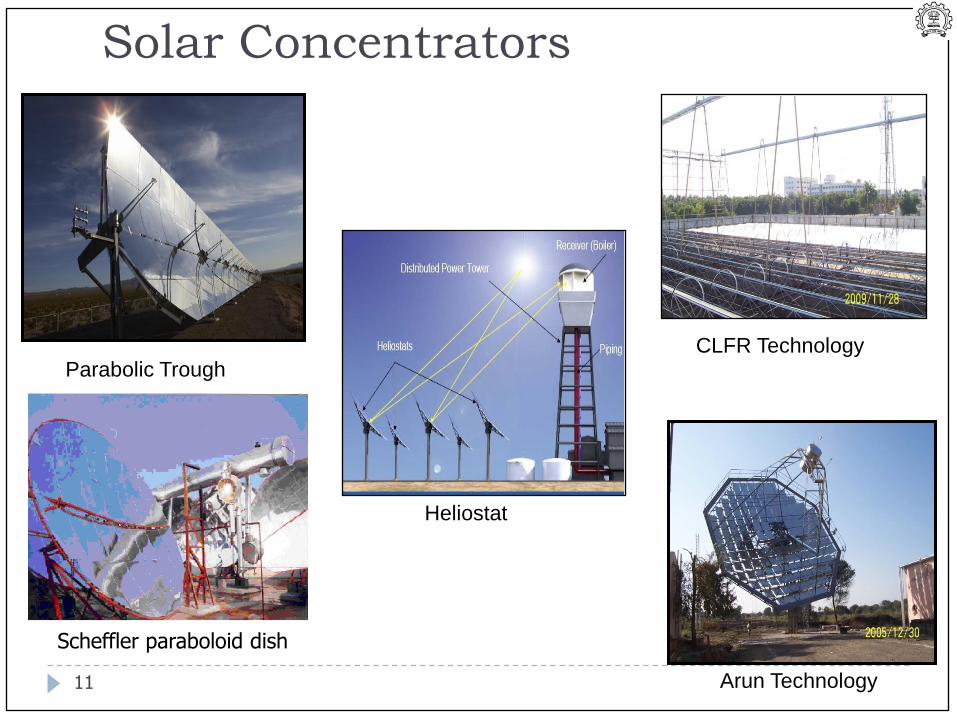
Solar Concentrators
Arun Technology
CLFR TechnologyParabolic Trough
Scheffler paraboloid dish
Heliostat
11
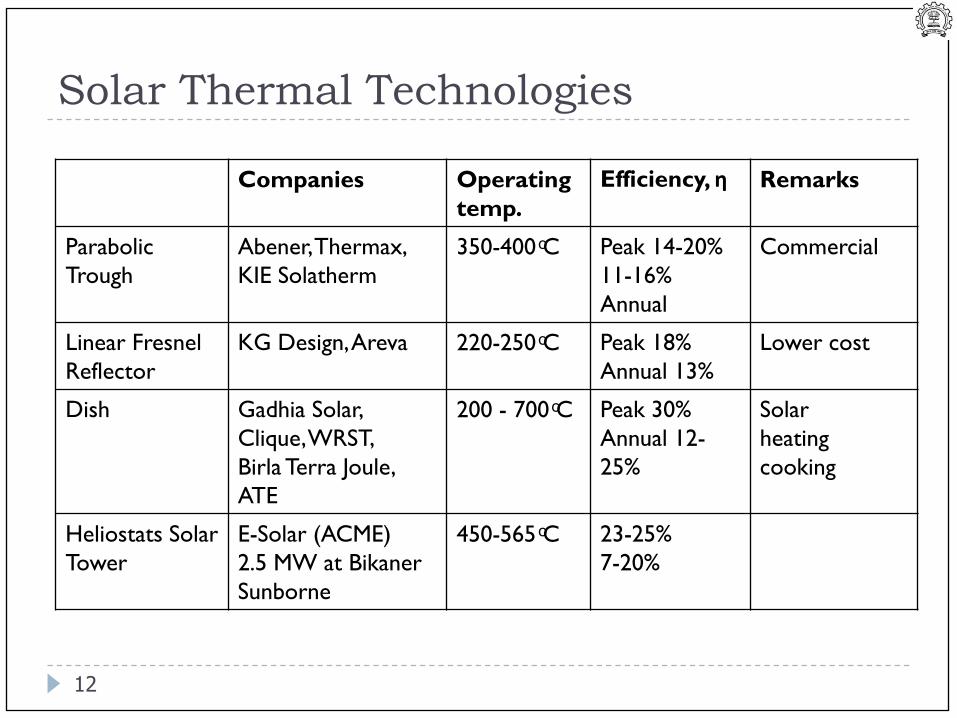
Solar Thermal Technologies
12
Companies Operating
temp.
Efficiency, η Remarks
Parabolic
Trough
Abener, Thermax,
KIE Solatherm
350-400 ͦC Peak 14-20%
11-16%
Annual
Commercial
Linear Fresnel
Reflector
KG Design, Areva 220-250 ͦC Peak 18%
Annual 13%
Lower cost
Dish Gadhia Solar,
Clique, WRST,
Birla Terra Joule,
ATE
200 - 700 ͦC Peak 30%
Annual 12-
25%
Solar
heating
cooking
Heliostats Solar
Tower
E-Solar (ACME)
2.5 MW at Bikaner
Sunborne
450-565 ͦC 23-25%
7-20%
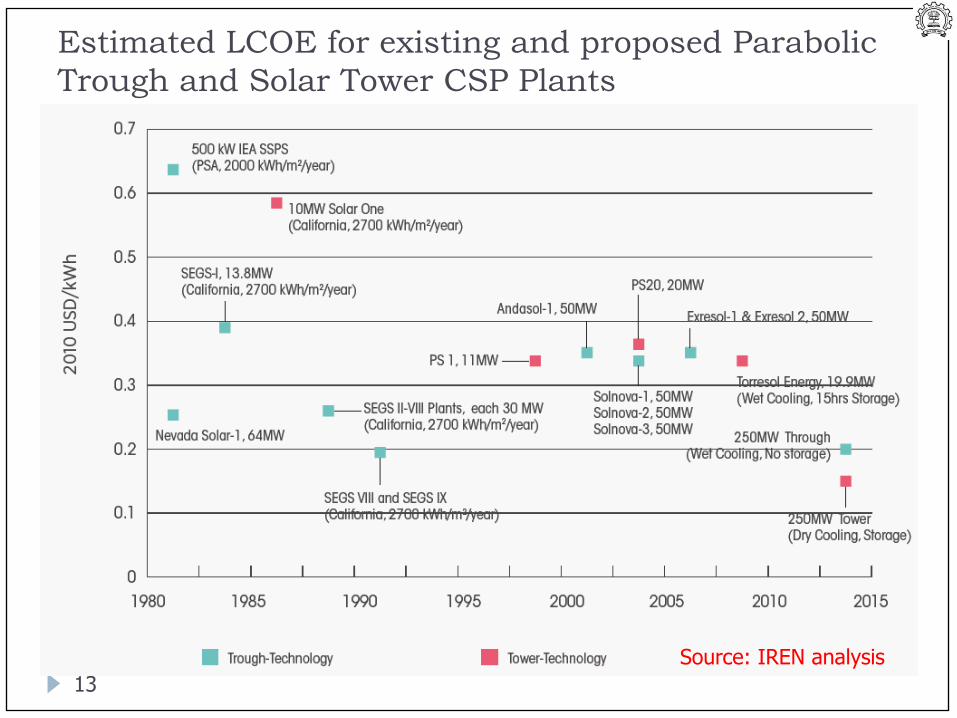
Estimated LCOE for existing and proposed Parabolic
Trough and Solar Tower CSP Plants
13
Source: IREN analysis
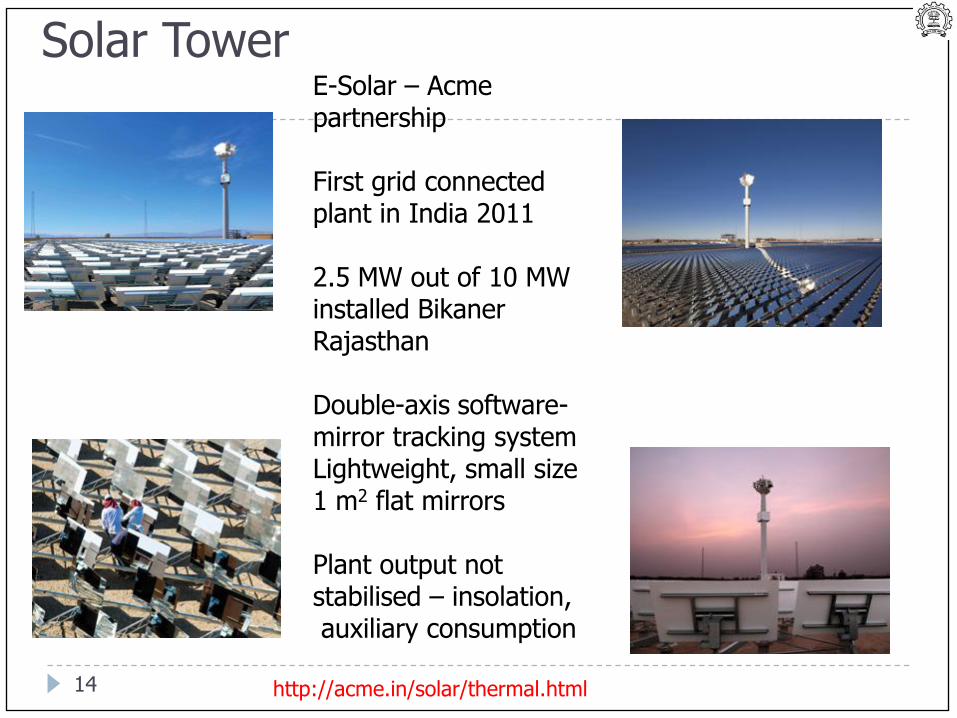
Solar Tower
14
E-Solar – Acme partnership
First grid connected plant in India 2011
2.5 MW out of 10 MW installed Bikaner Rajasthan
Double-axis software-mirror tracking system Lightweight, small size 1 m2 flat mirrors
Plant output not stabilised – insolation, auxiliary consumption
http://acme.in/solar/thermal.html
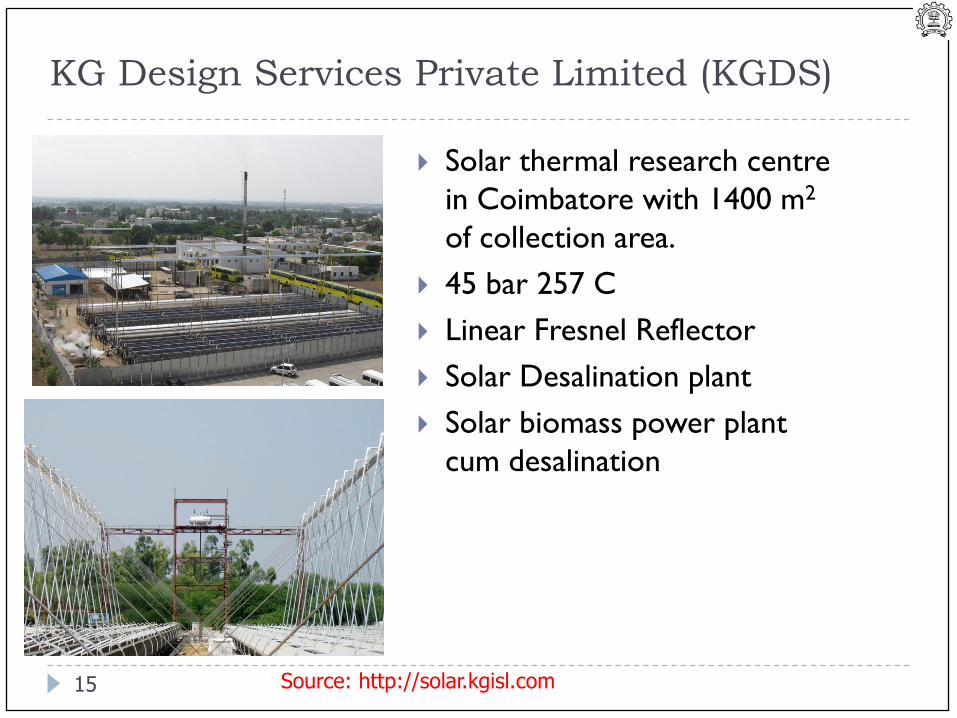
KG Design Services Private Limited (KGDS)
15
Solar thermal research centre
in Coimbatore with 1400 m2
of collection area.
45 bar 257 C
Linear Fresnel Reflector
Solar Desalination plant
Solar biomass power plant
cum desalination
Source: http://solar.kgisl.com
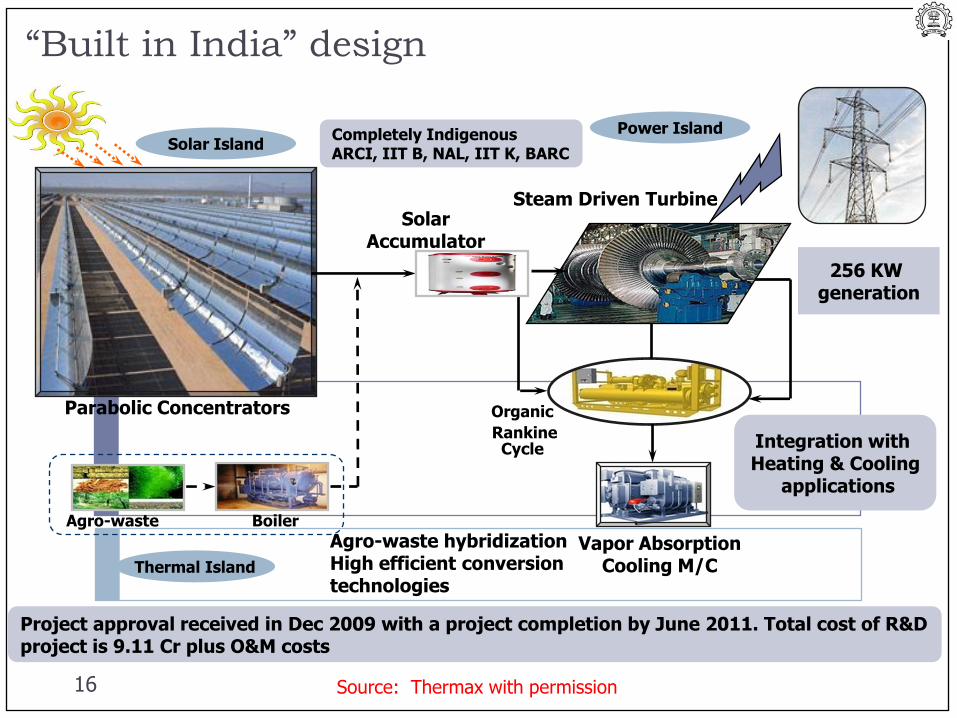
Integration with Heating & Cooling
applications
Boiler
“Built in India” design
Parabolic Concentrators
Agro-waste
Steam Driven Turbine
Completely IndigenousARCI, IIT B, NAL, IIT K, BARC
Agro-waste hybridizationHigh efficient conversion technologies
Project approval received in Dec 2009 with a project completion by June 2011. Total cost of R&D project is 9.11 Cr plus O&M costs
Solar IslandPower Island
Thermal Island
Vapor Absorption Cooling M/C
Organic
Rankine Cycle
Solar Accumulator
256 KW generation
Source: Thermax with permission16
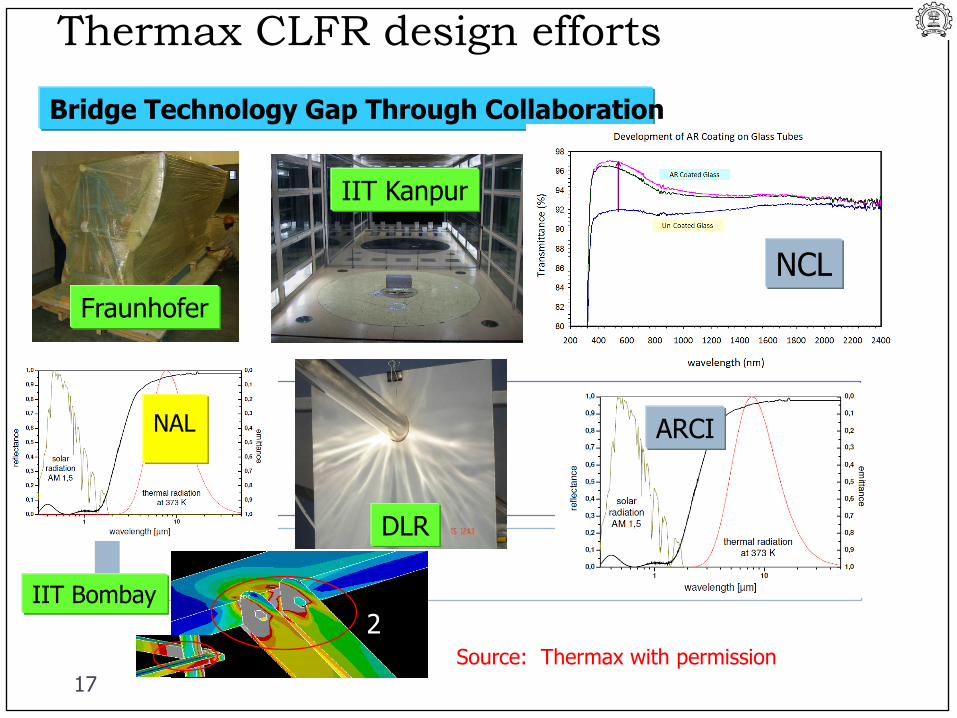
Thermax CLFR design efforts
Bridge Technology Gap Through Collaboration
IIT Bombay
Fraunhofer
IIT Kanpur
DLR
NCL
NAL ARCI
2Source: Thermax with permission
17
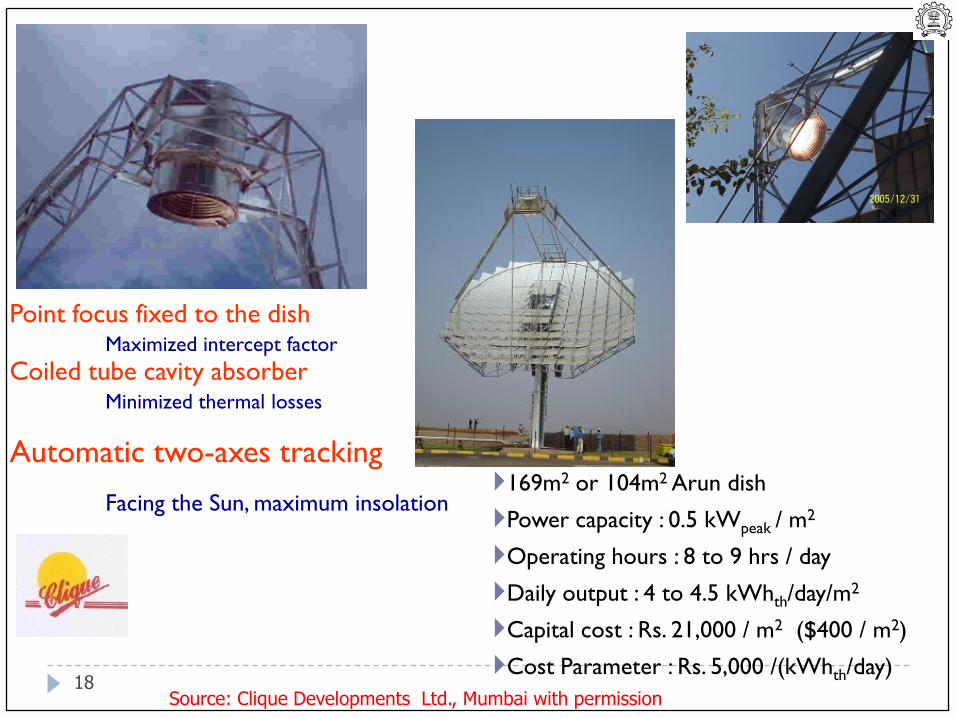
Point focus fixed to the dishMaximized intercept factor
Coiled tube cavity absorberMinimized thermal losses
Automatic two-axes tracking
Facing the Sun, maximum insolation169m2 or 104m2 Arun dish
Power capacity : 0.5 kWpeak / m2
Operating hours : 8 to 9 hrs / day
Daily output : 4 to 4.5 kWhth/day/m2
Capital cost : Rs. 21,000 / m2 ($400 / m2)
Cost Parameter : Rs. 5,000 /(kWhth/day)
Source: Clique Developments Ltd., Mumbai with permission 18
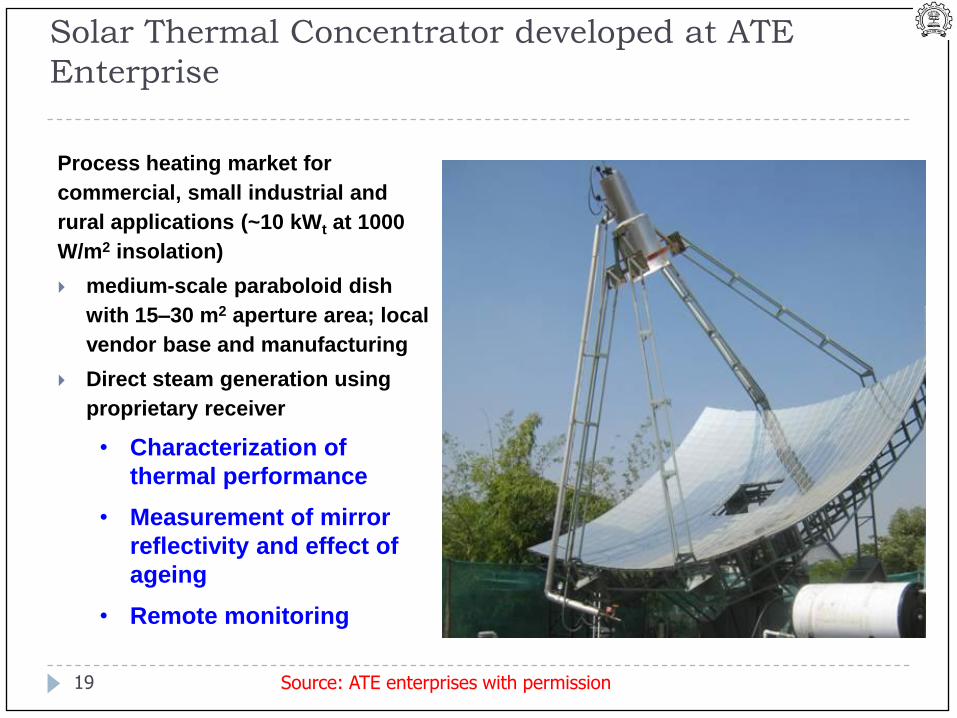
Solar Thermal Concentrator developed at ATE
Enterprise
19
Process heating market for
commercial, small industrial and
rural applications (~10 kWt at 1000
W/m2 insolation)
medium-scale paraboloid dish
with 15–30 m2 aperture area; local
vendor base and manufacturing
Direct steam generation using
proprietary receiver
• Characterization of
thermal performance
• Measurement of mirror
reflectivity and effect of
ageing
• Remote monitoring
Source: ATE enterprises with permission
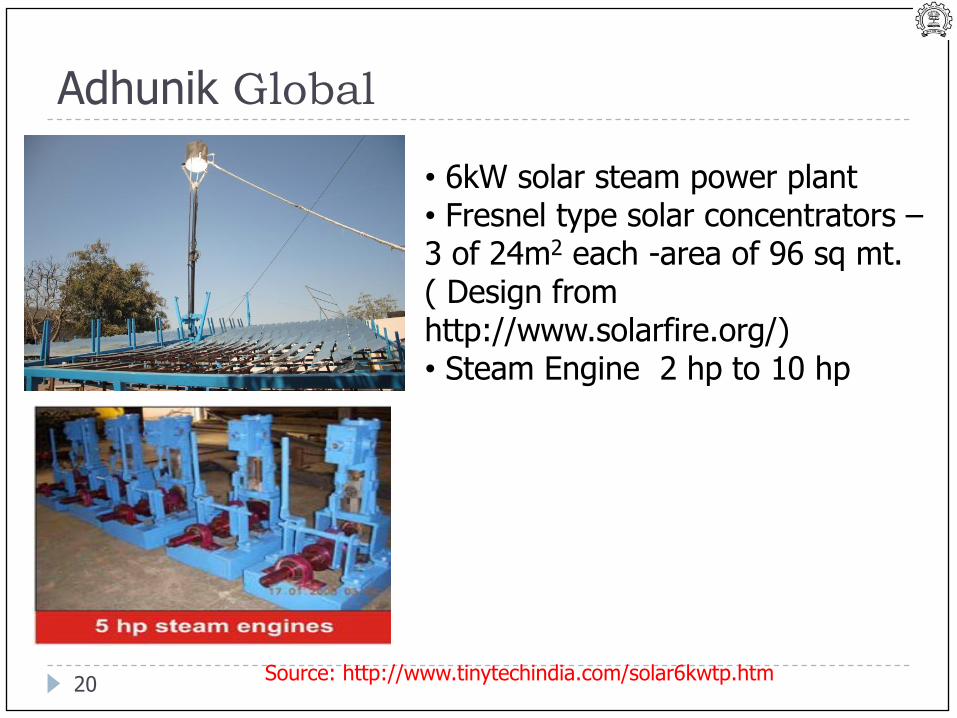
Adhunik Global
20
• 6kW solar steam power plant• Fresnel type solar concentrators –3 of 24m2 each -area of 96 sq mt.( Design from http://www.solarfire.org/)• Steam Engine 2 hp to 10 hp
Solar Oven
Source: http://www.tinytechindia.com/solar6kwtp.htm
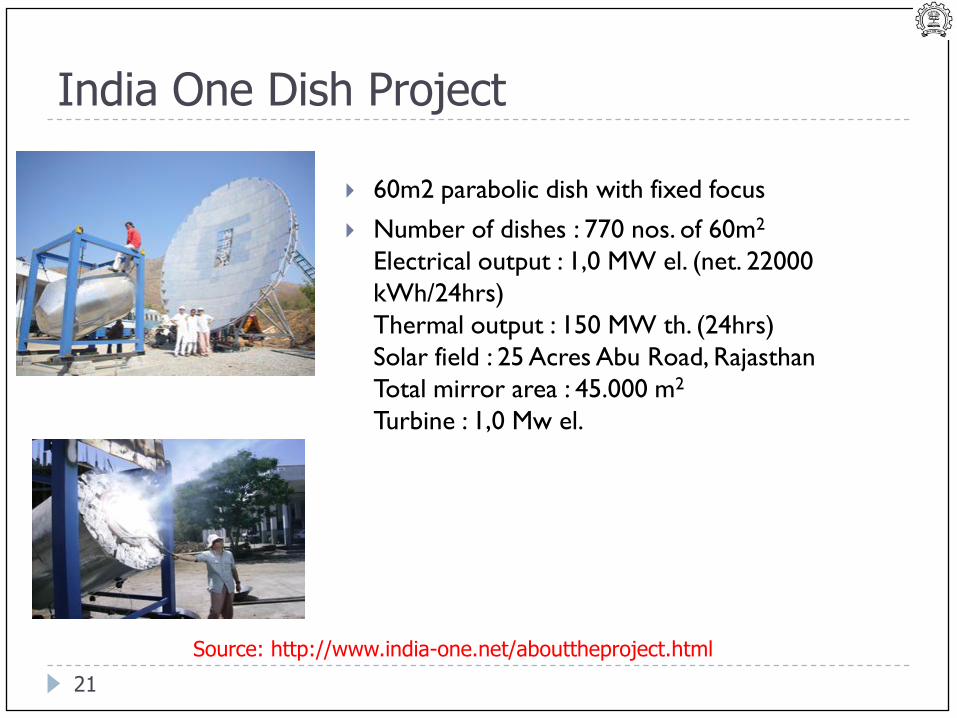
India One Dish Project
21
60m2 parabolic dish with fixed focus
Number of dishes : 770 nos. of 60m2
Electrical output : 1,0 MW el. (net. 22000
kWh/24hrs)
Thermal output : 150 MW th. (24hrs)
Solar field : 25 Acres Abu Road, Rajasthan
Total mirror area : 45.000 m2
Turbine : 1,0 Mw el.
Source: http://www.india-one.net/abouttheproject.html
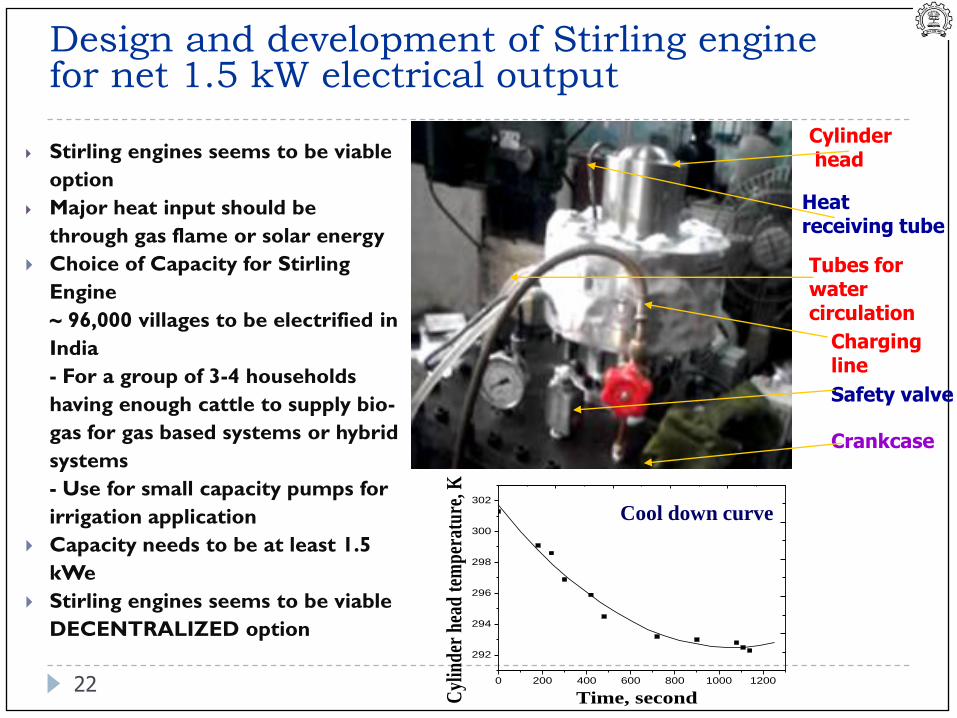
Stirling engines seems to be viable
option
Major heat input should be
through gas flame or solar energy
Choice of Capacity for Stirling
Engine
~ 96,000 villages to be electrified in
India
- For a group of 3-4 households
having enough cattle to supply bio-
gas for gas based systems or hybrid
systems
- Use for small capacity pumps for
irrigation application
Capacity needs to be at least 1.5
kWe
Stirling engines seems to be viable
DECENTRALIZED option
Cylinderhead
Safety valve
Charging line
Crankcase
Heat receiving tube
Tubes for water circulation
Design and development of Stirling engine for net 1.5 kW electrical output
0 200 400 600 800 1000 1200
292
294
296
298
300
302
Cyl
ind
er h
ead
tem
per
atu
re, K
Time, second
Cool down curve
22
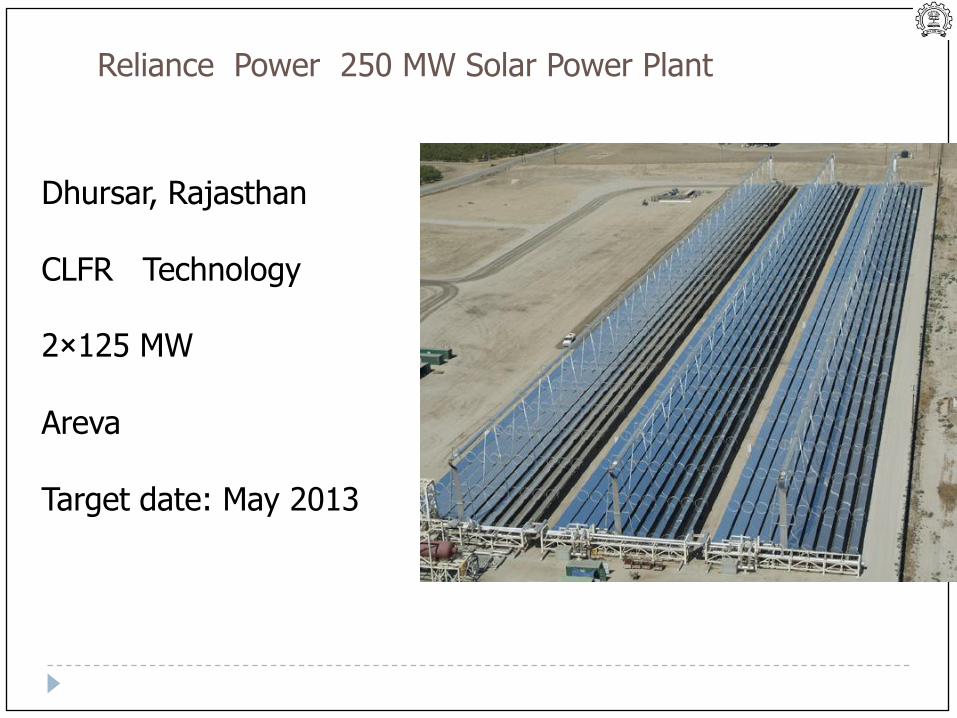
Reliance Power 250 MW Solar Power Plant
Dhursar, Rajasthan
CLFR Technology
2×125 MW
Areva
Target date: May 2013
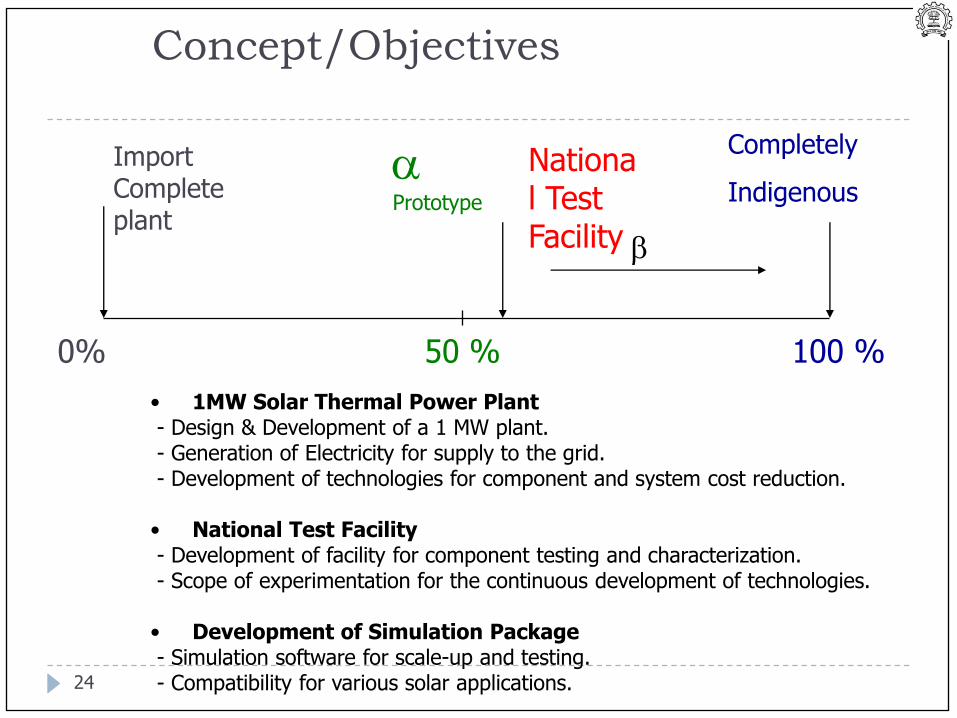
Concept/Objectives
24
0% 100 %
Completely
Indigenous
Import Complete plant
Prototype
• 1MW Solar Thermal Power Plant- Design & Development of a 1 MW plant. - Generation of Electricity for supply to the grid.- Development of technologies for component and system cost reduction.
• National Test Facility- Development of facility for component testing and characterization.- Scope of experimentation for the continuous development of technologies.
• Development of Simulation Package- Simulation software for scale-up and testing.- Compatibility for various solar applications.
50 %
National Test Facility
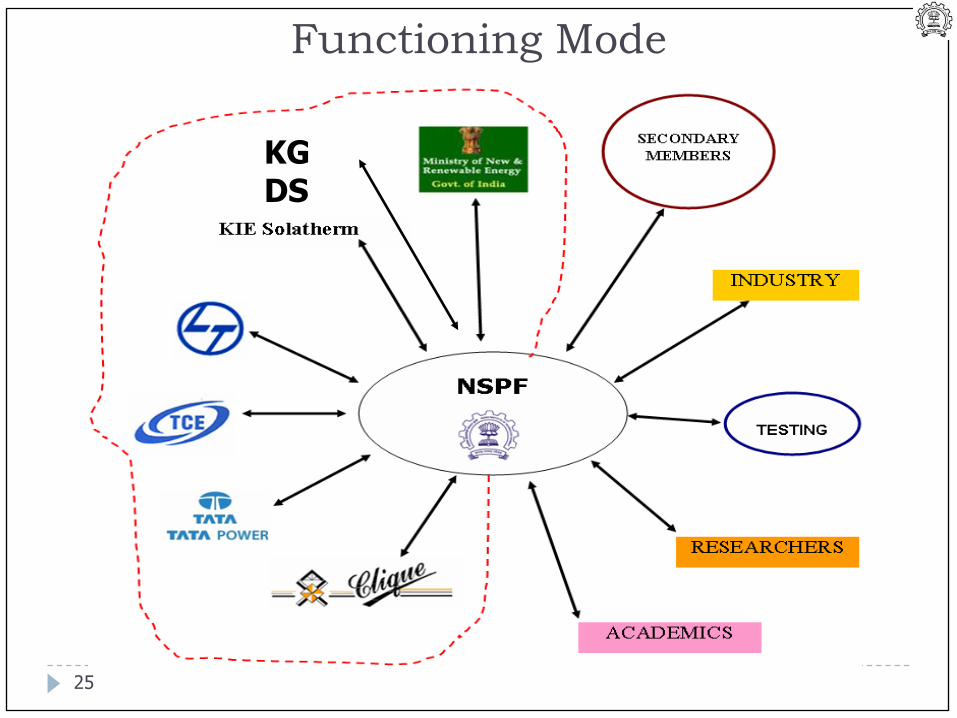
KG DS
Functioning Mode
25
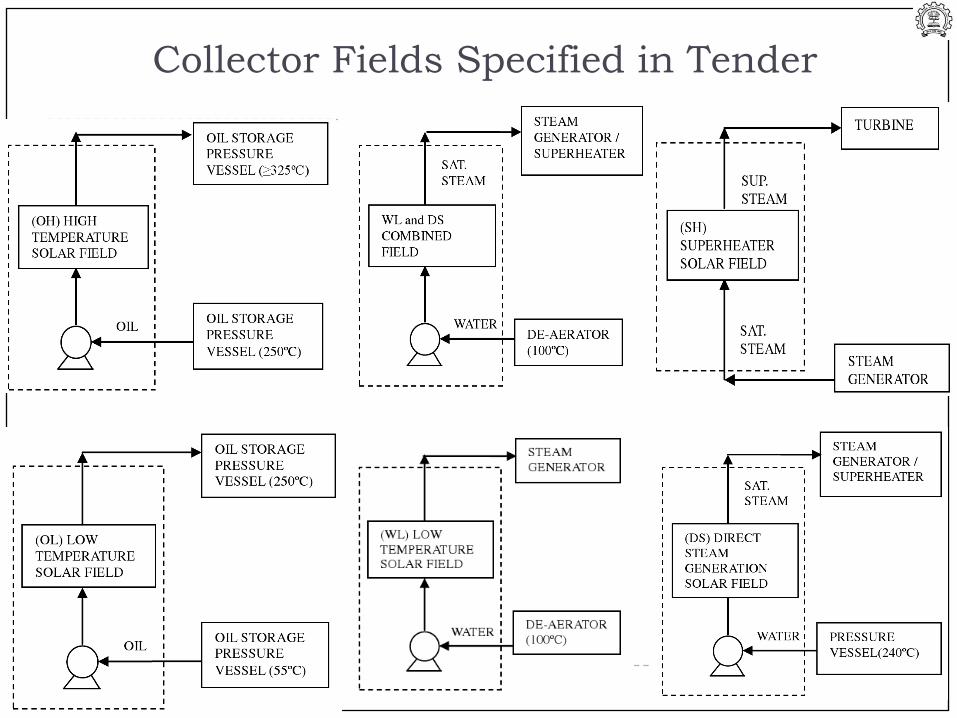
Collector Fields Specified in Tender
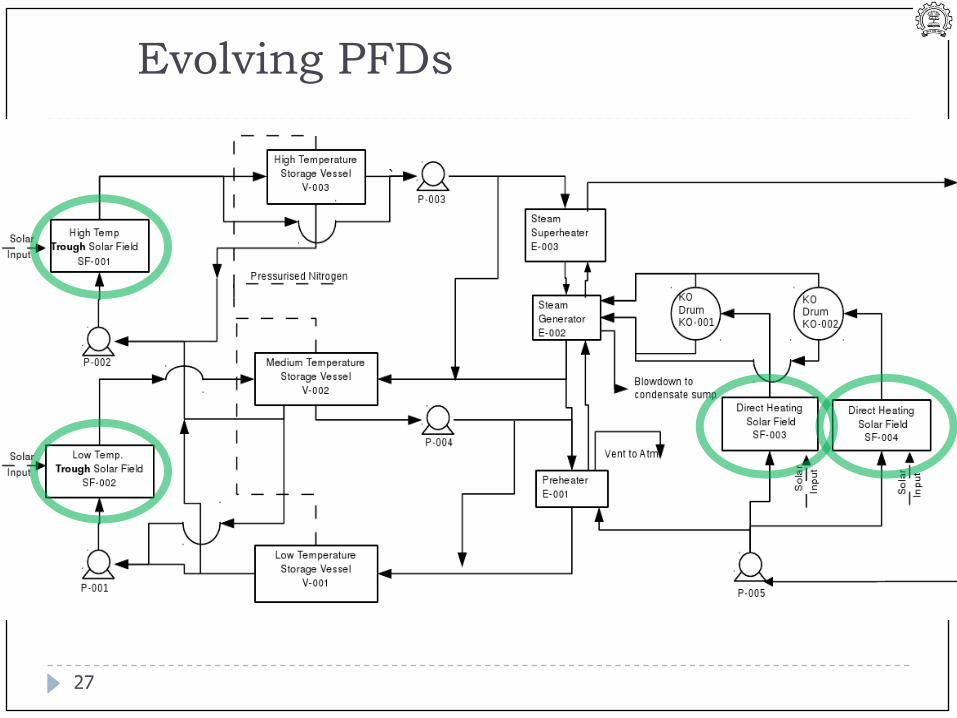
Evolving PFDs
27
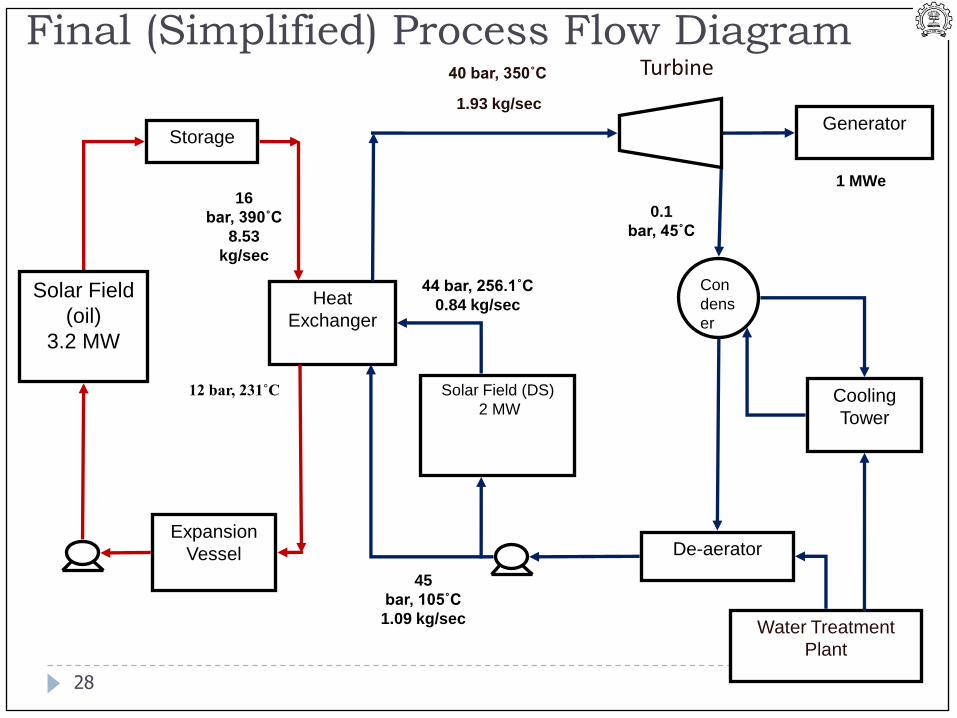
Solar Field
(oil)
3.2 MW
Solar Field (DS)
2 MW
Storage
Expansion
Vessel
Heat
Exchanger
Generator
Cooling
Tower
De-aerator
Water Treatment
Plant
Con
dens
er
16
bar, 390˚C
8.53
kg/sec
45
bar, 105˚C
1.09 kg/sec
44 bar, 256.1˚C
0.84 kg/sec
1 MWe
0.1
bar, 45˚C
40 bar, 350˚C
12 bar, 231˚C
Turbine
1.93 kg/sec
Final (Simplified) Process Flow Diagram
28
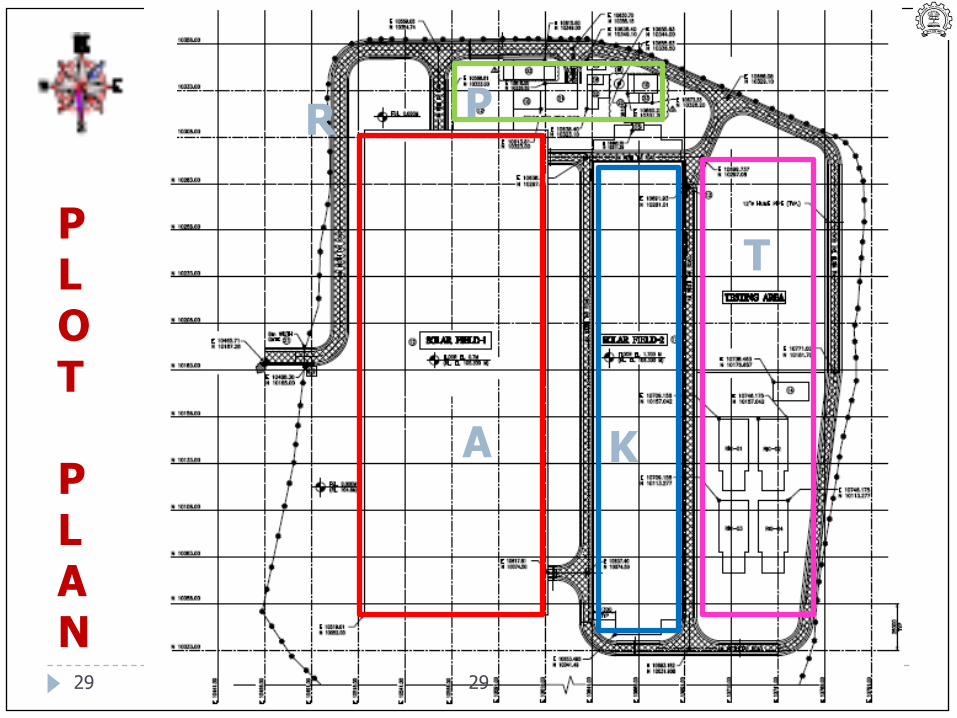
A K
T
PR
PLOT
PLAN
2929
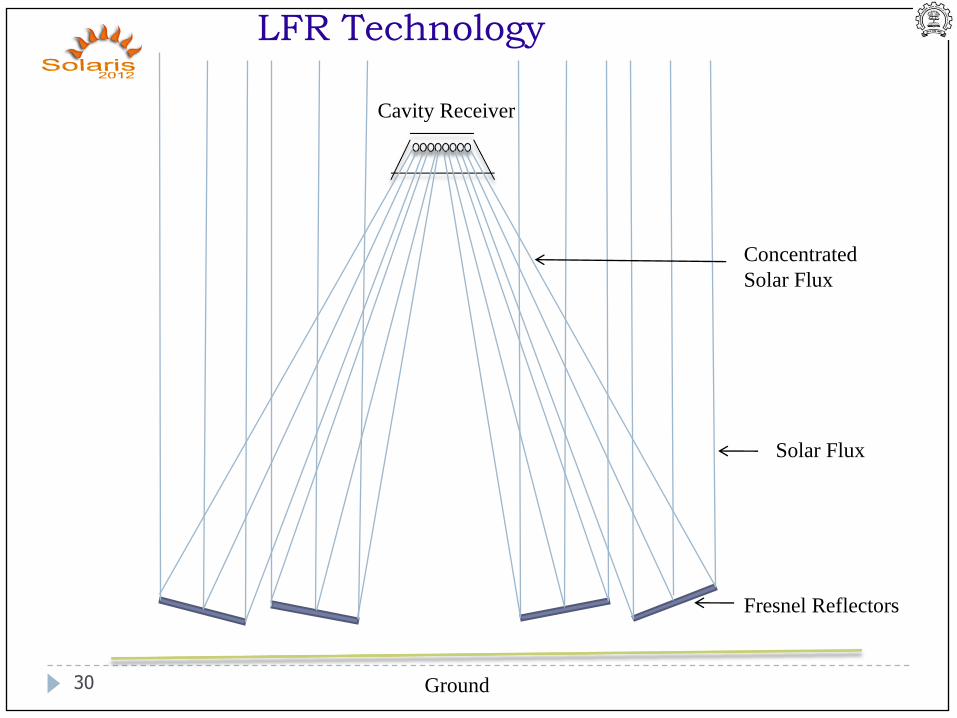
Cavity Receiver
Ground
Fresnel Reflectors
Solar Flux
Concentrated
Solar Flux
LFR Technology
30
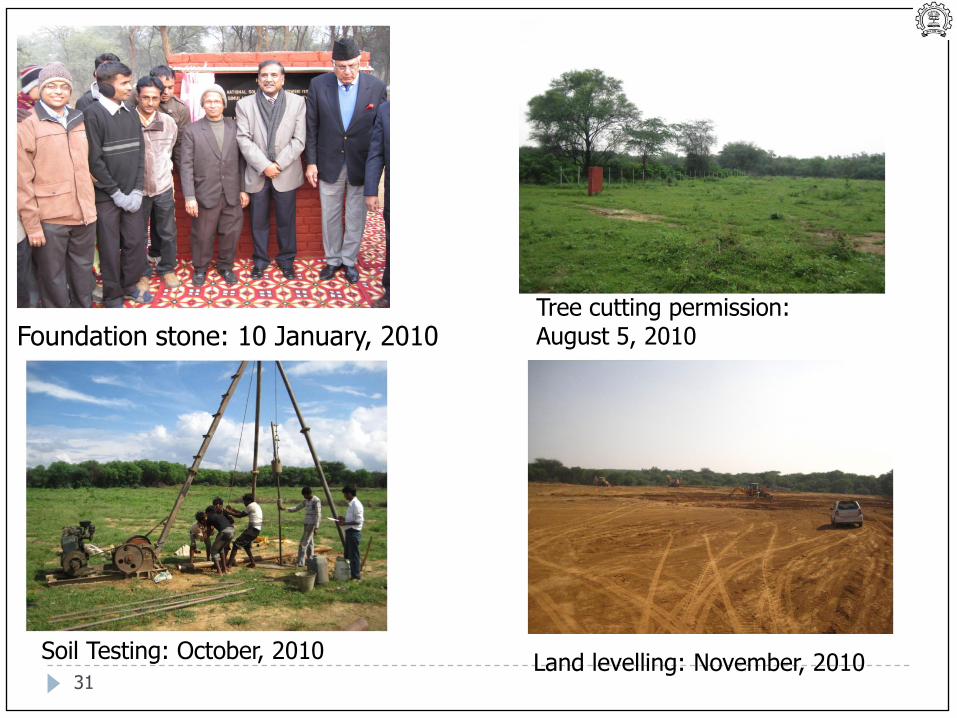
Foundation stone: 10 January, 2010Tree cutting permission: August 5, 2010
Land levelling: November, 2010Soil Testing: October, 2010
31
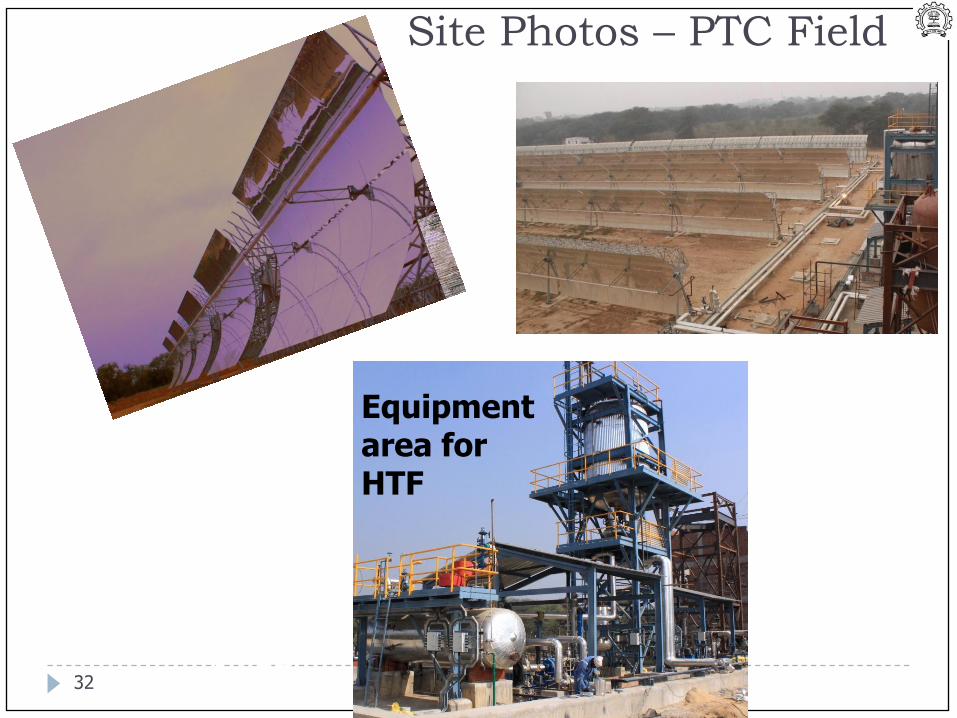
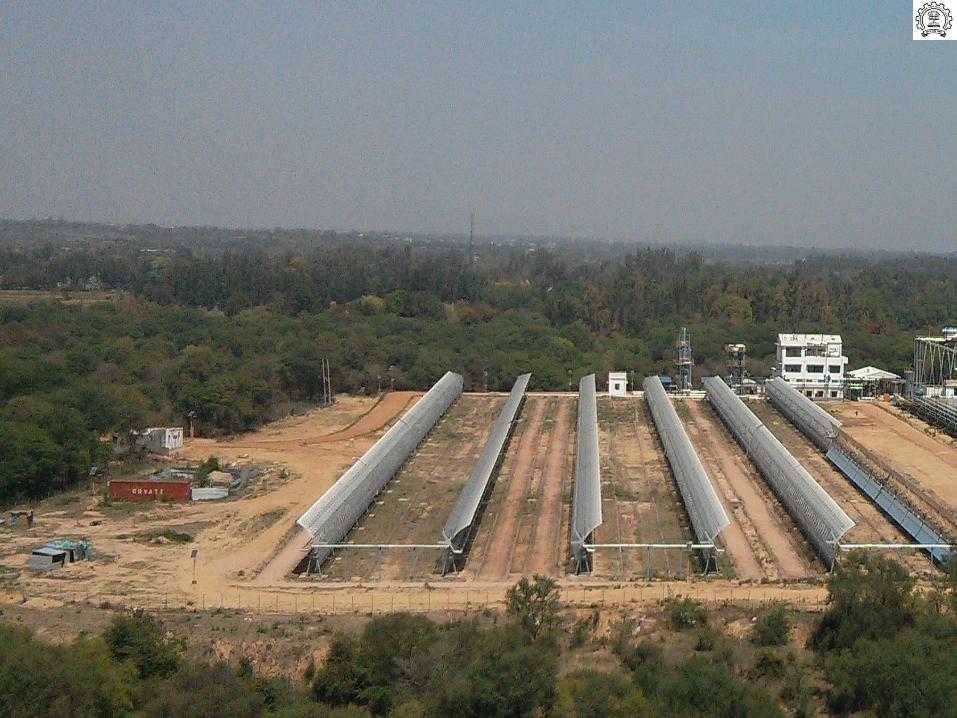
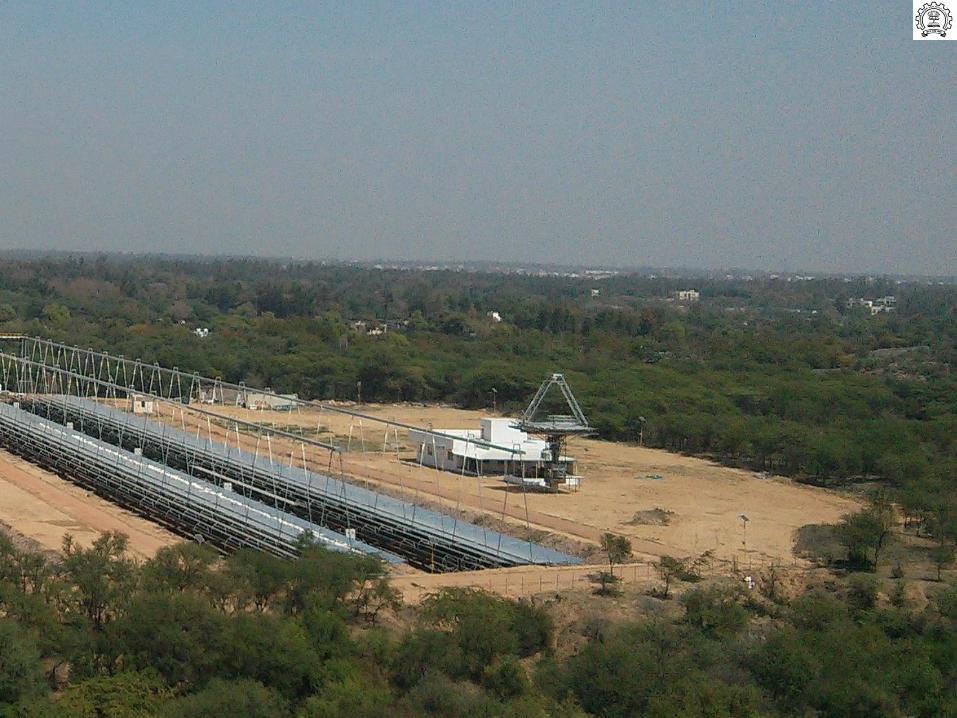
Site Photos – PTC Field
CLFR
PTC Solar Field
Equipment area for HTF
32
HTF Area
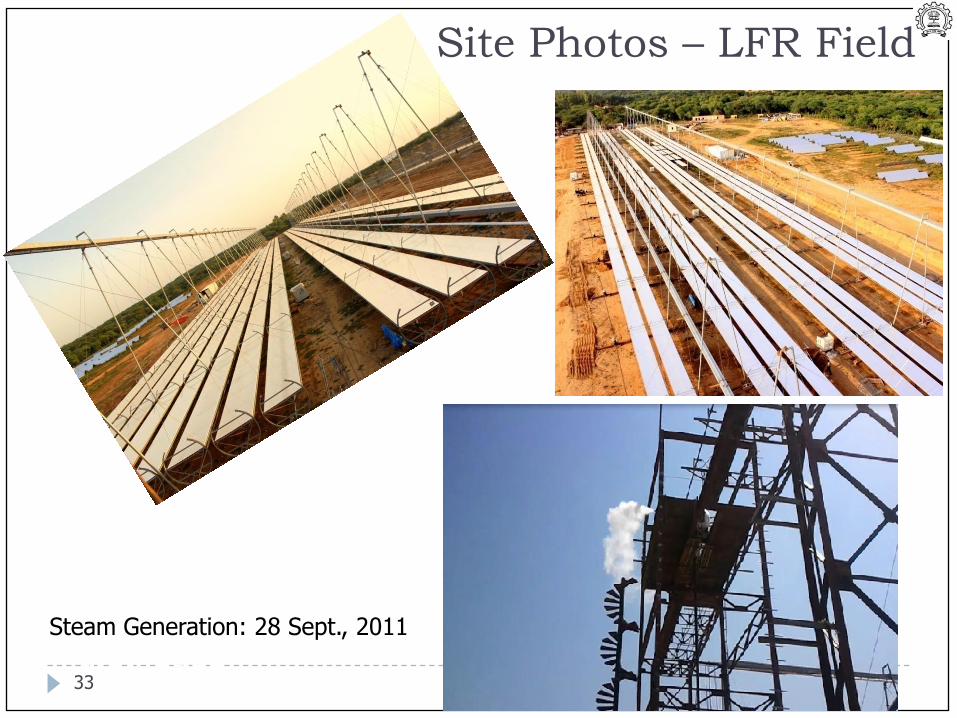
HTF Area CLFR Steam Drum
Site Photos – LFR Field
Steam Generation: 28 Sept., 2011
33
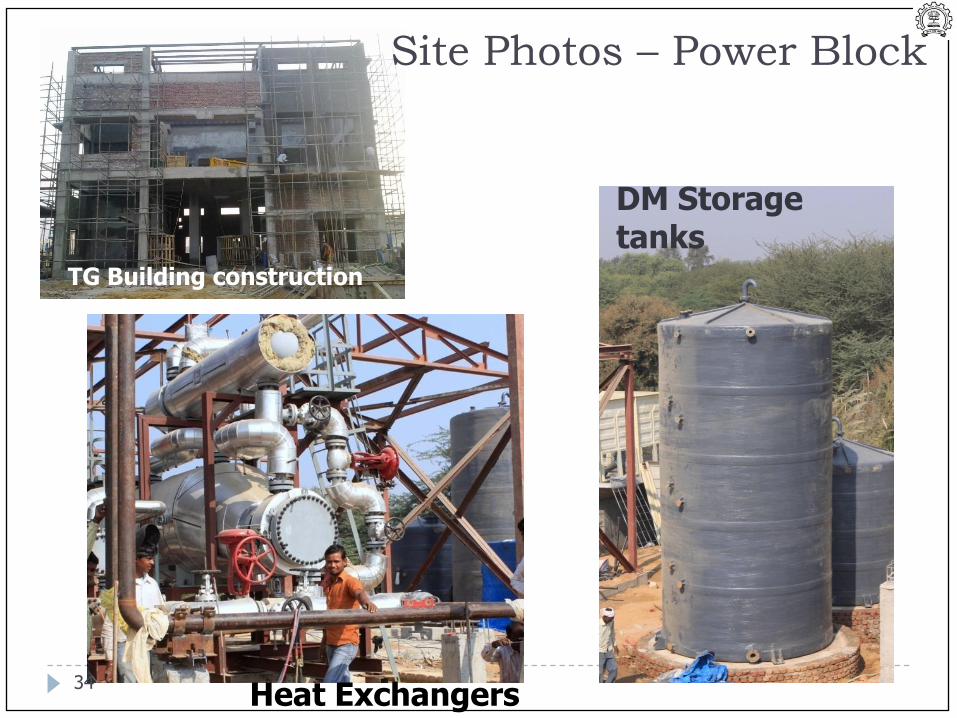
Site Photos – Power Block
DM Storage tanks
TG Building construction
Heat Exchangers34
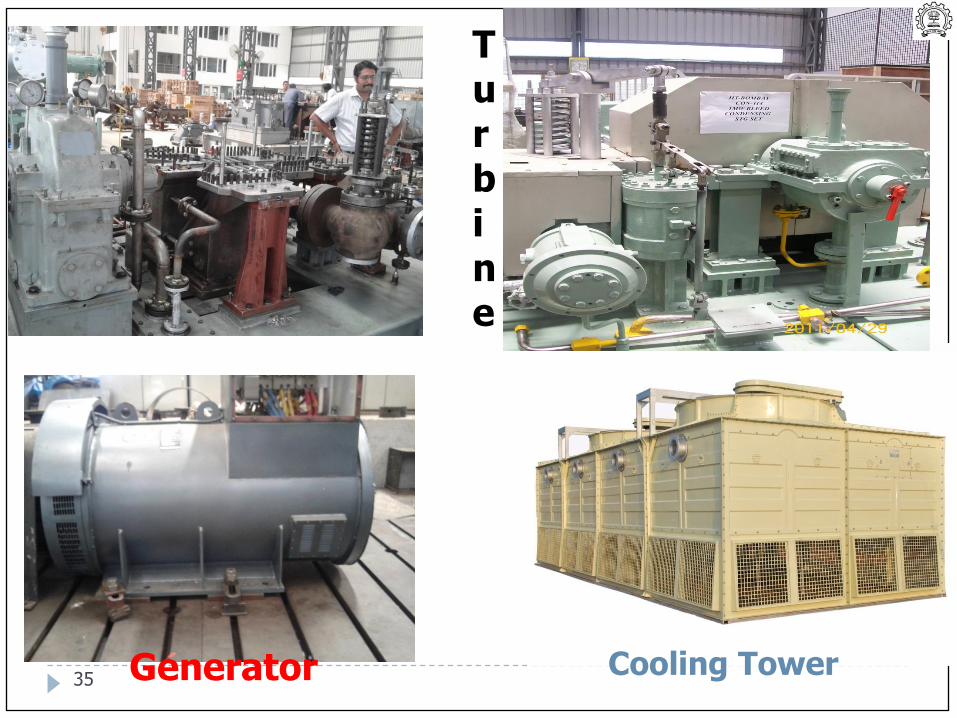
Turbine
Generator Cooling Tower35
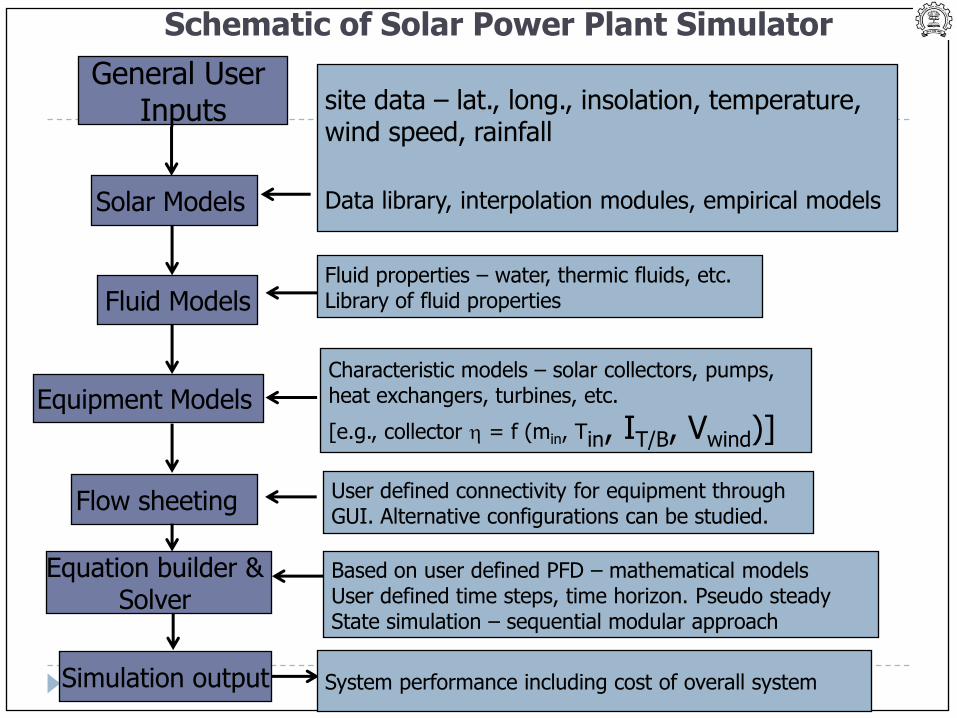
General User Inputs
Solar Models
Equipment Models
Fluid Models
Flow sheeting
Equation builder & Solver
Simulation output
Fluid properties – water, thermic fluids, etc.Library of fluid properties
Characteristic models – solar collectors, pumps, heat exchangers, turbines, etc.
[e.g., collector = f (min, Tin, IT/B, Vwind)]
site data – lat., long., insolation, temperature,wind speed, rainfall
Data library, interpolation modules, empirical models
User defined connectivity for equipment through GUI. Alternative configurations can be studied.
Based on user defined PFD – mathematical modelsUser defined time steps, time horizon. Pseudo steadyState simulation – sequential modular approach
System performance including cost of overall system
Schematic of Solar Power Plant Simulator
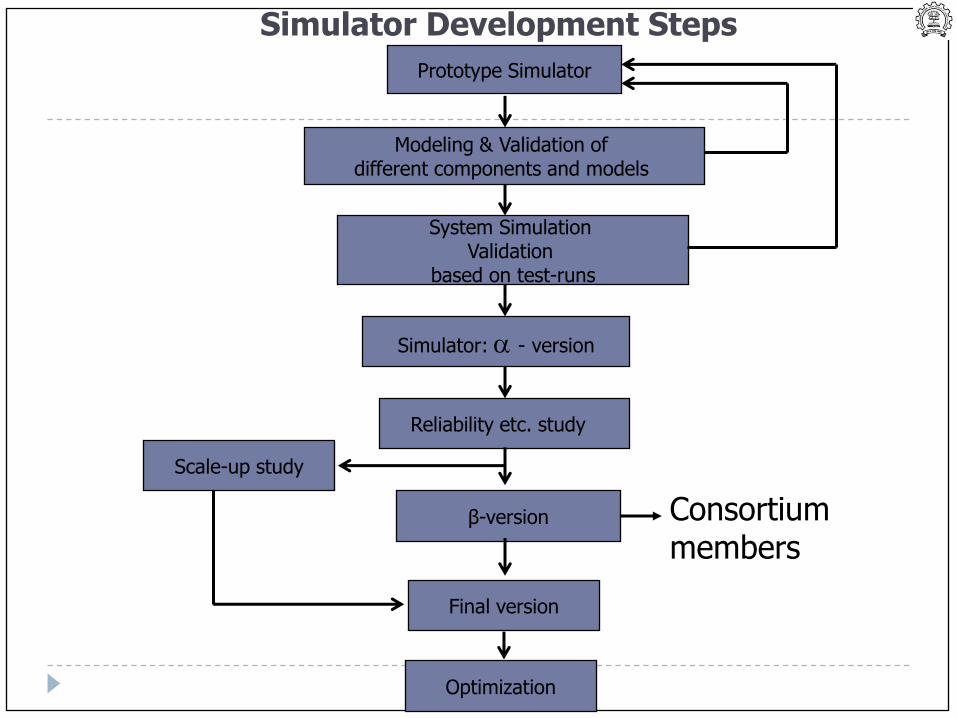
Scale-up study
Prototype Simulator
Modeling & Validation of different components and models
Simulator: - version
System Simulation Validation
based on test-runs
Reliability etc. study
β-version
Final version
Optimization
Consortium members
Simulator Development Steps
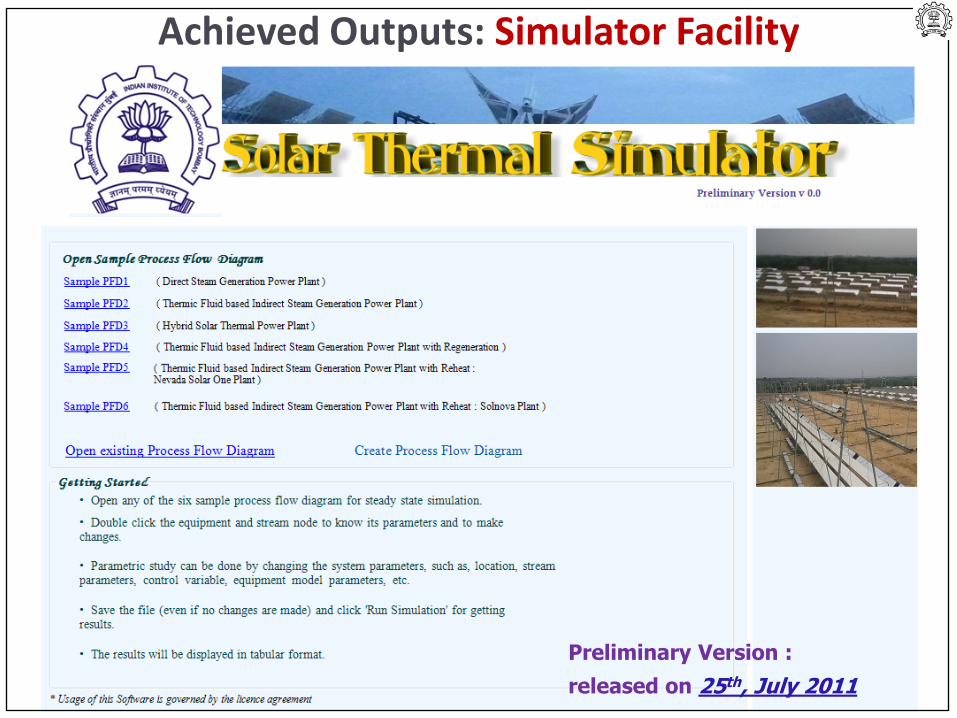
Preliminary Version :
released on 25th, July 2011
Achieved Outputs: Simulator Facility
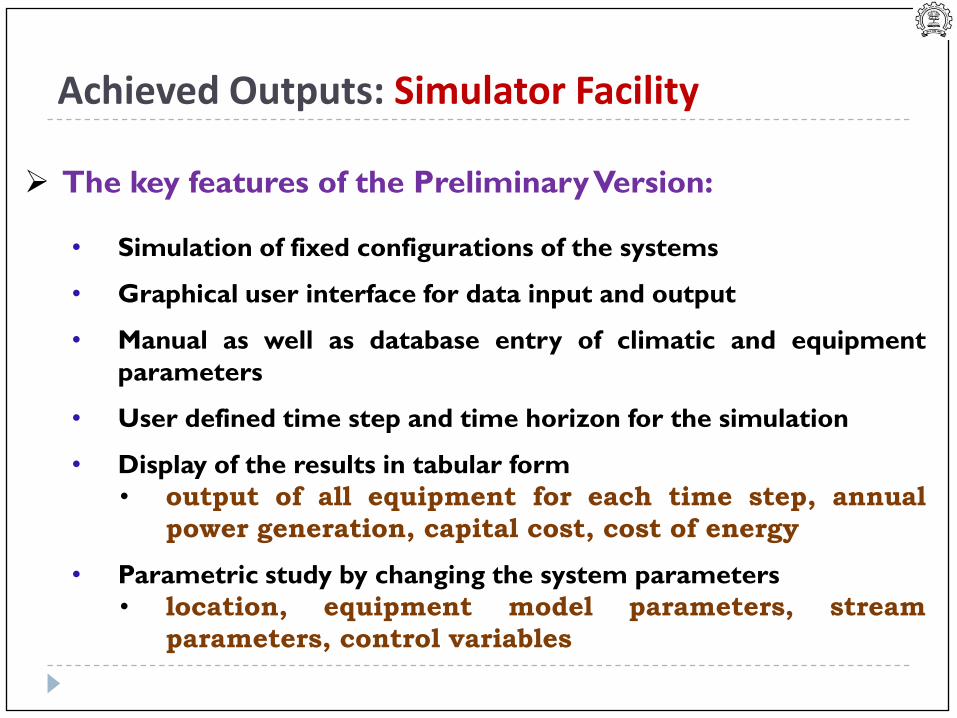
Achieved Outputs: Simulator Facility
The key features of the Preliminary Version:
• Simulation of fixed configurations of the systems
• Graphical user interface for data input and output
• Manual as well as database entry of climatic and equipment
parameters
• User defined time step and time horizon for the simulation
• Display of the results in tabular form
• output of all equipment for each time step, annual
power generation, capital cost, cost of energy
• Parametric study by changing the system parameters
• location, equipment model parameters, stream
parameters, control variables
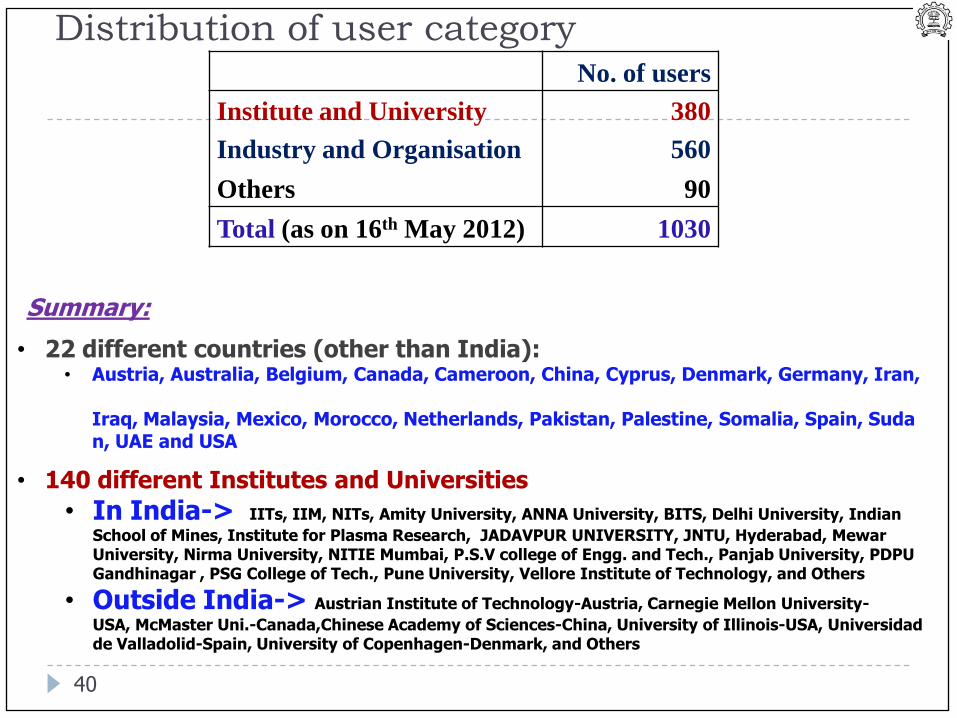
No. of users
Institute and University 380
Industry and Organisation 560
Others 90
Total (as on 16th May 2012) 1030
Distribution of user category
Summary:
• 22 different countries (other than India):• Austria, Australia, Belgium, Canada, Cameroon, China, Cyprus, Denmark, Germany, Iran,
Iraq, Malaysia, Mexico, Morocco, Netherlands, Pakistan, Palestine, Somalia, Spain, Sudan, UAE and USA
• 140 different Institutes and Universities
• In India-> IITs, IIM, NITs, Amity University, ANNA University, BITS, Delhi University, Indian
School of Mines, Institute for Plasma Research, JADAVPUR UNIVERSITY, JNTU, Hyderabad, MewarUniversity, Nirma University, NITIE Mumbai, P.S.V college of Engg. and Tech., Panjab University, PDPU Gandhinagar , PSG College of Tech., Pune University, Vellore Institute of Technology, and Others
• Outside India-> Austrian Institute of Technology-Austria, Carnegie Mellon University-
USA, McMaster Uni.-Canada,Chinese Academy of Sciences-China, University of Illinois-USA, Universidad de Valladolid-Spain, University of Copenhagen-Denmark, and Others
40
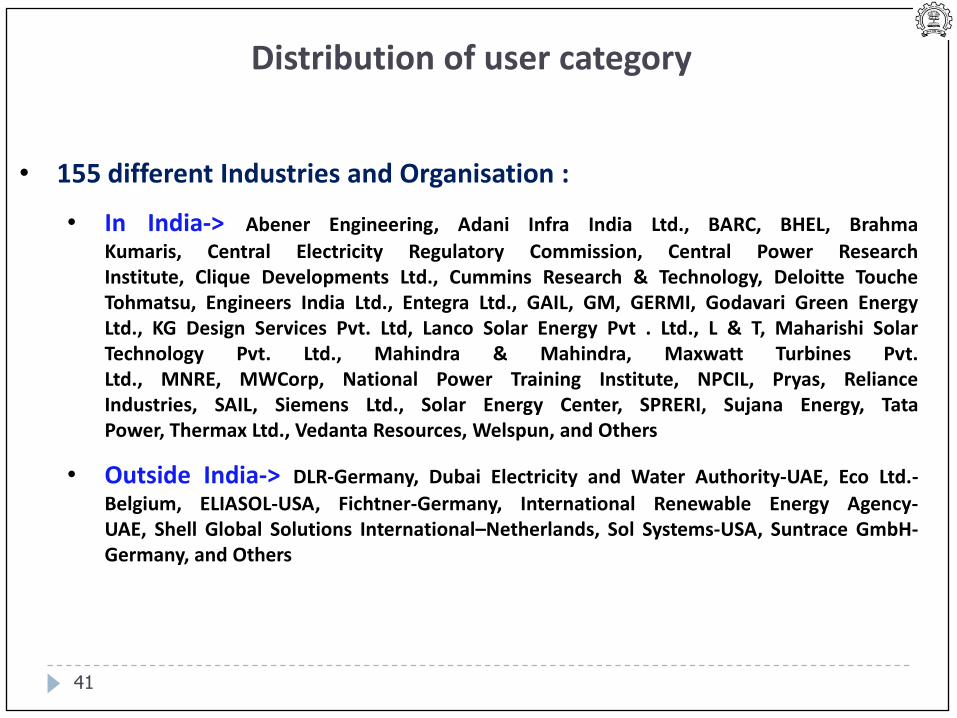
• 155 different Industries and Organisation :
• In India-> Abener Engineering, Adani Infra India Ltd., BARC, BHEL, Brahma
Kumaris, Central Electricity Regulatory Commission, Central Power ResearchInstitute, Clique Developments Ltd., Cummins Research & Technology, Deloitte ToucheTohmatsu, Engineers India Ltd., Entegra Ltd., GAIL, GM, GERMI, Godavari Green EnergyLtd., KG Design Services Pvt. Ltd, Lanco Solar Energy Pvt . Ltd., L & T, Maharishi SolarTechnology Pvt. Ltd., Mahindra & Mahindra, Maxwatt Turbines Pvt.Ltd., MNRE, MWCorp, National Power Training Institute, NPCIL, Pryas, RelianceIndustries, SAIL, Siemens Ltd., Solar Energy Center, SPRERI, Sujana Energy, TataPower, Thermax Ltd., Vedanta Resources, Welspun, and Others
• Outside India-> DLR-Germany, Dubai Electricity and Water Authority-UAE, Eco Ltd.-
Belgium, ELIASOL-USA, Fichtner-Germany, International Renewable Energy Agency-UAE, Shell Global Solutions International–Netherlands, Sol Systems-USA, Suntrace GmbH-Germany, and Others
Distribution of user category
41
Added Features of α-version
Scope for user defined plant configurations• Flexibility to simulate user defined small subset of
a complete plant or a complete plant
Addition of equipment like pipe
element, auxiliary boiler, pressure reducing valve
and storage vessel
Database as well as manual entry of cost co-
efficient
Facility of exporting results to MS Excel filePotential users are identified for the α-
version42
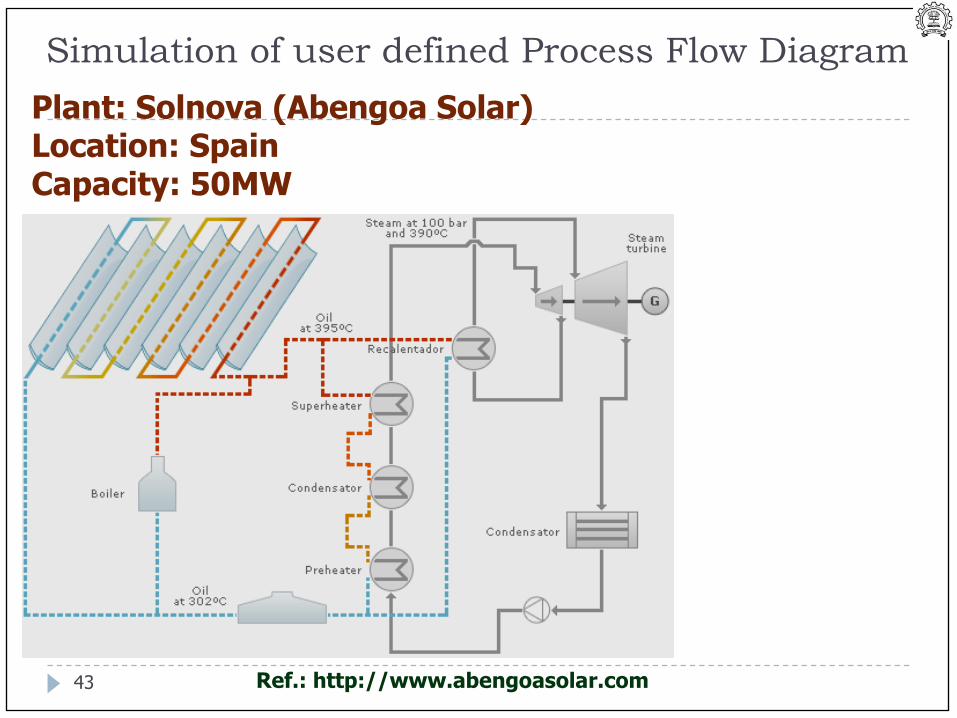
Plant: Solnova (Abengoa Solar)Location: SpainCapacity: 50MW
Ref.: http://www.abengoasolar.com
Simulation of user defined Process Flow Diagram
43
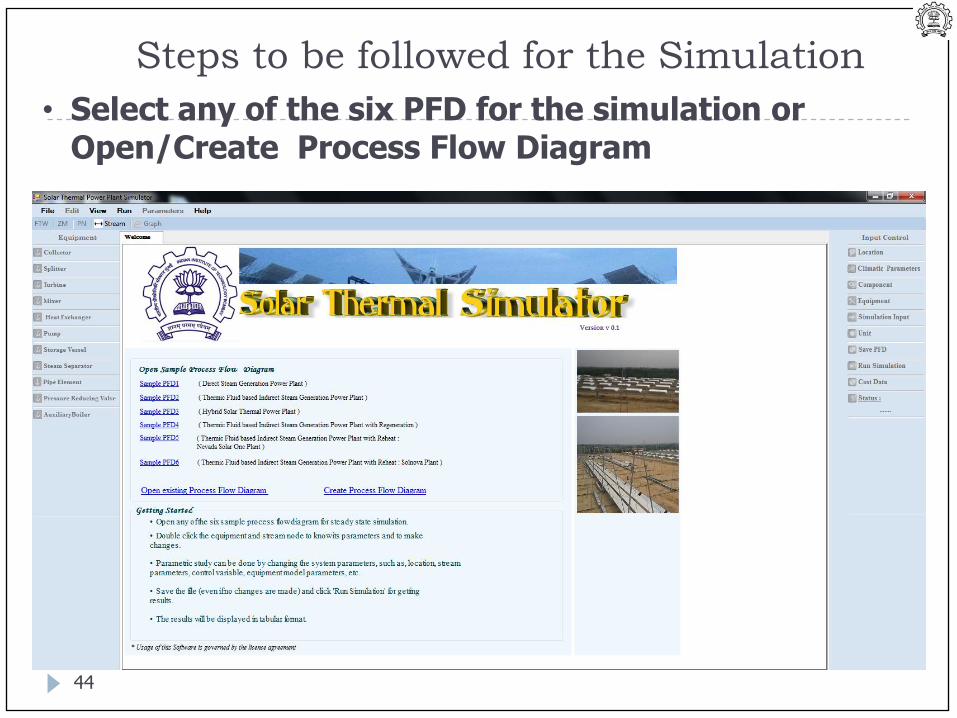
Steps to be followed for the Simulation
• Select any of the six PFD for the simulation orOpen/Create Process Flow Diagram
44
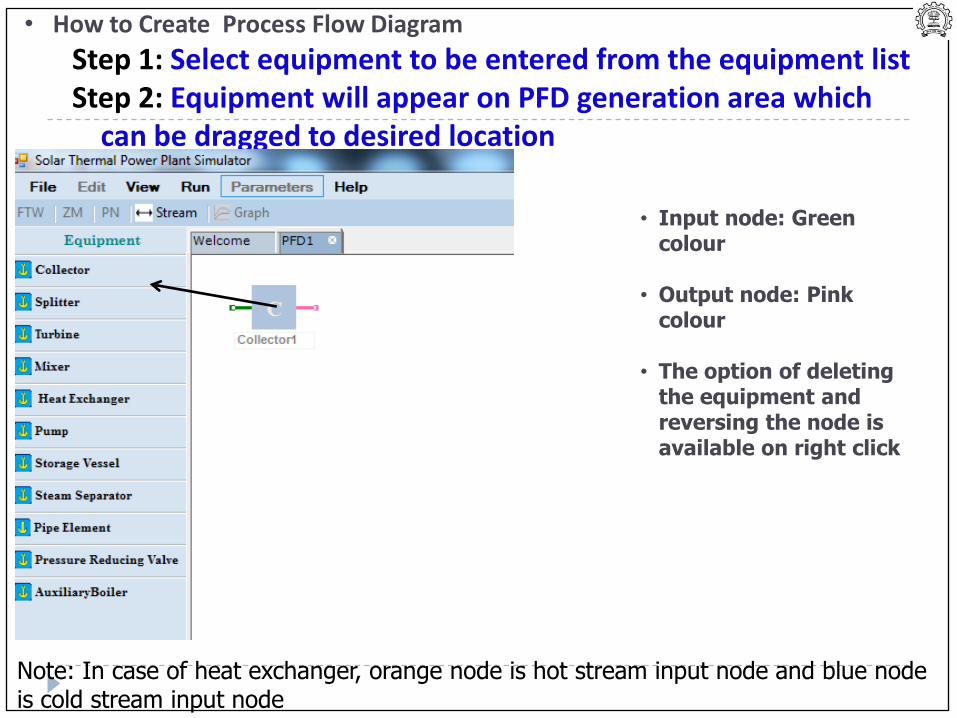
• How to Create Process Flow Diagram
Step 1: Select equipment to be entered from the equipment listStep 2: Equipment will appear on PFD generation area which
can be dragged to desired location
Note: In case of heat exchanger, orange node is hot stream input node and blue node is cold stream input node
• Input node: Green colour
• Output node: Pink colour
• The option of deleting the equipment and reversing the node is available on right click
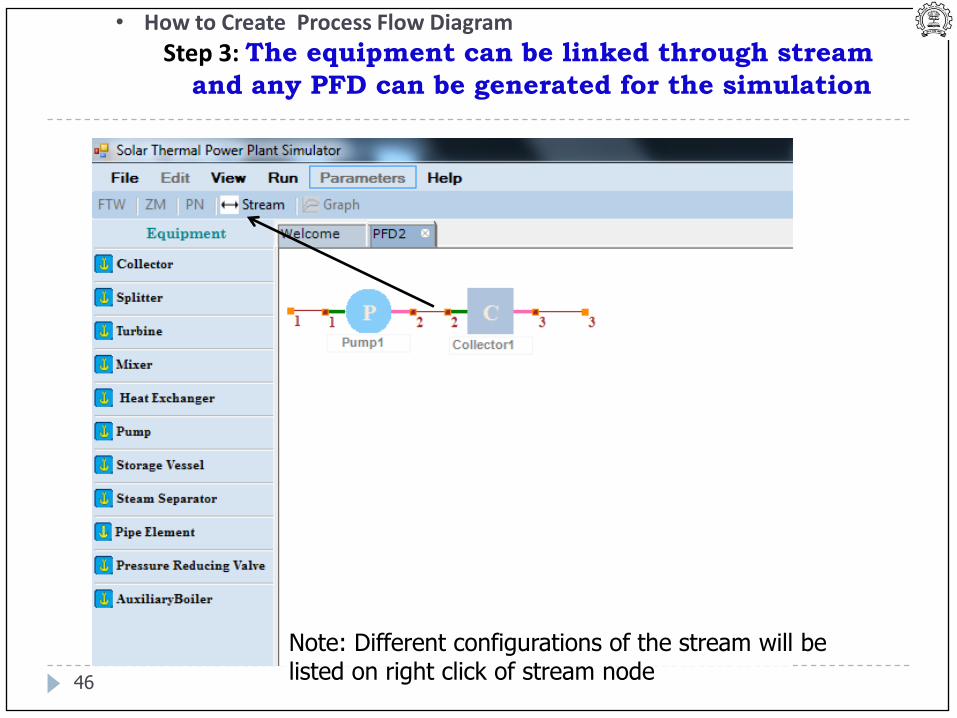
• How to Create Process Flow Diagram
Step 3: The equipment can be linked through stream
and any PFD can be generated for the simulation
Note: Different configurations of the stream will be listed on right click of stream node
46
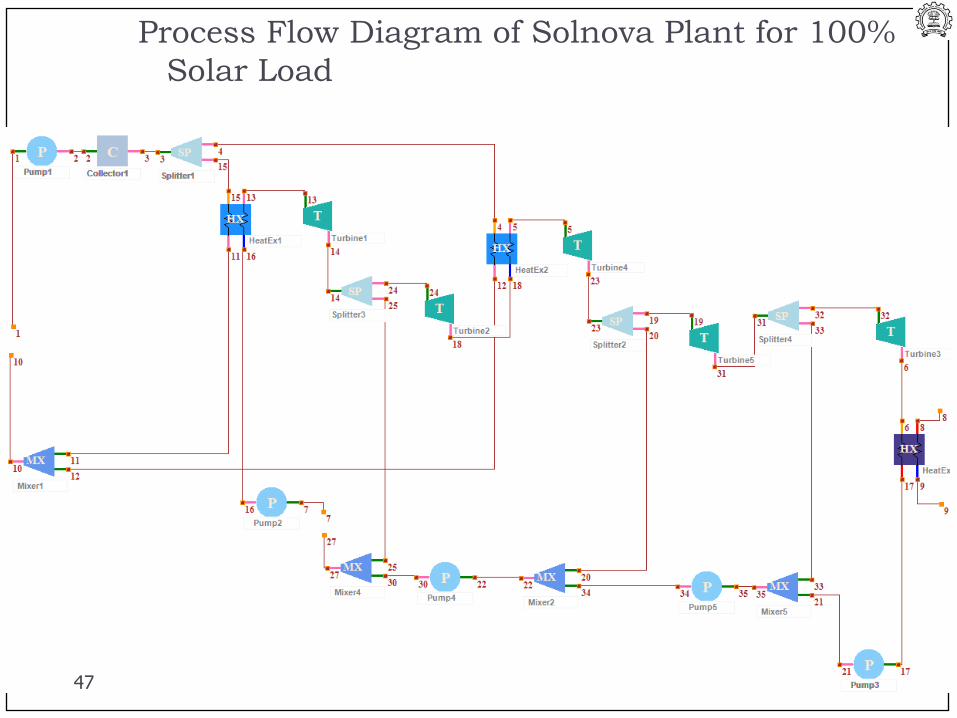
Process Flow Diagram of Solnova Plant for 100%
Solar Load
47
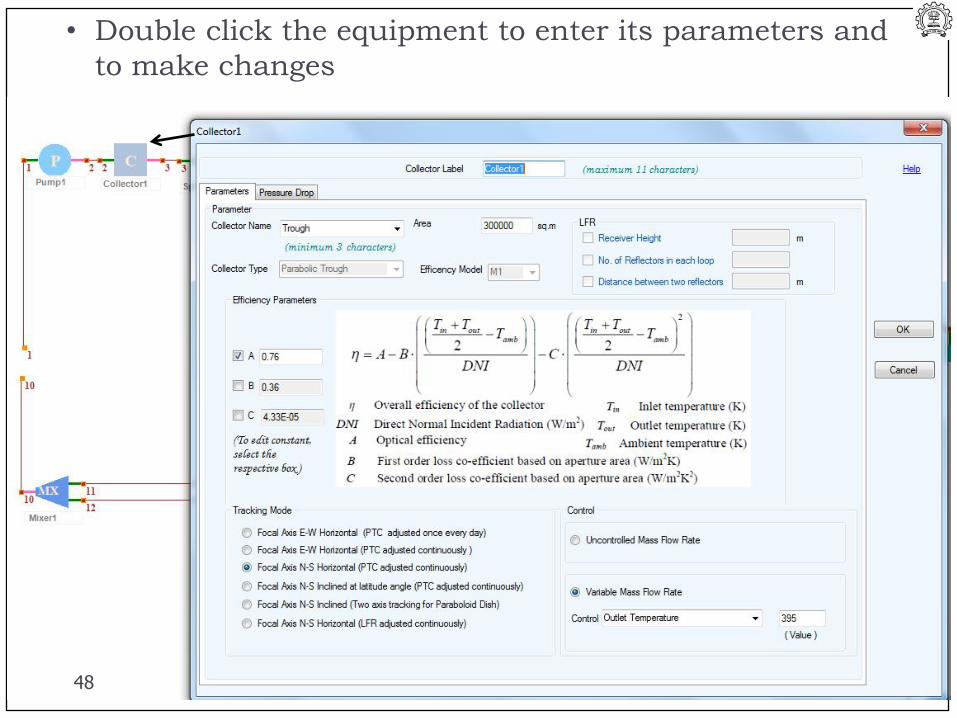
• Double click the equipment to enter its parameters and
to make changes
48
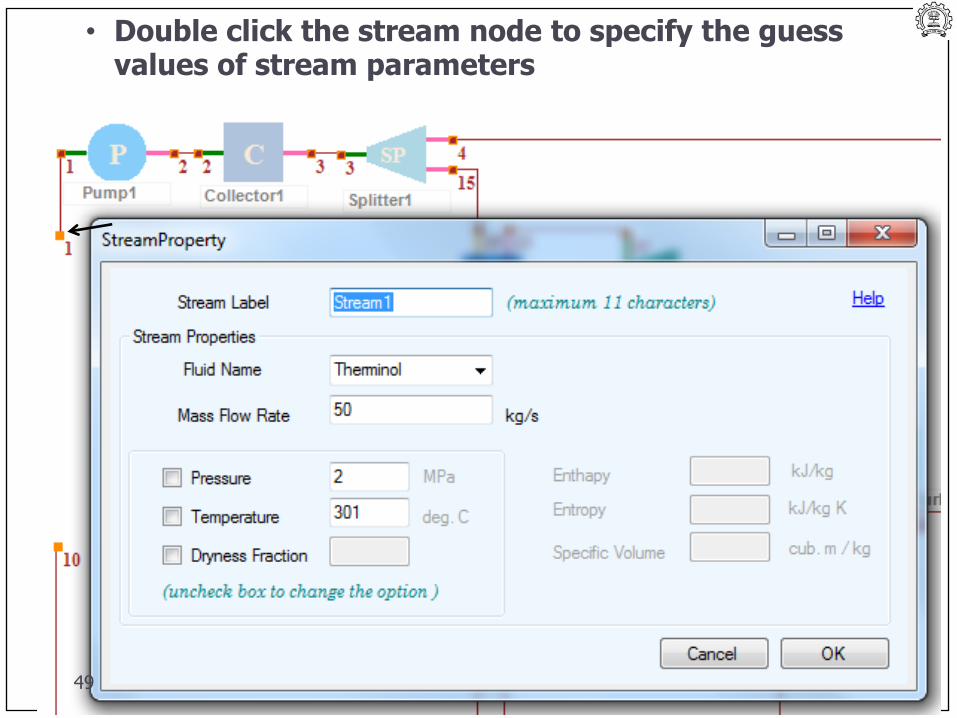
• Double click the stream node to specify the guess values of stream parameters
49
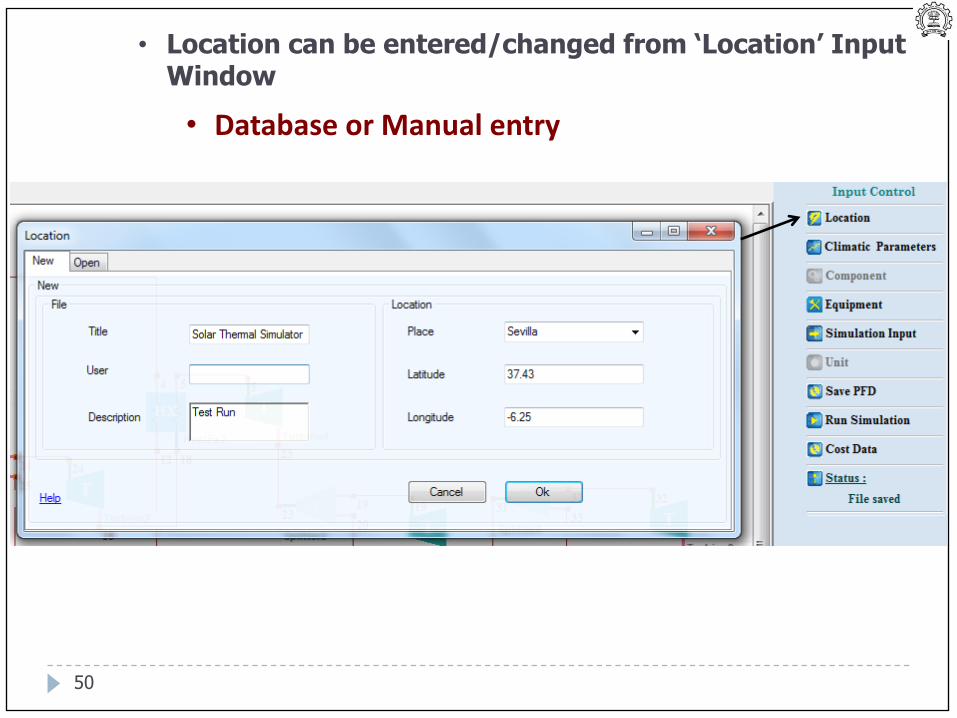
• Location can be entered/changed from ‘Location’ Input Window
• Database or Manual entry
50
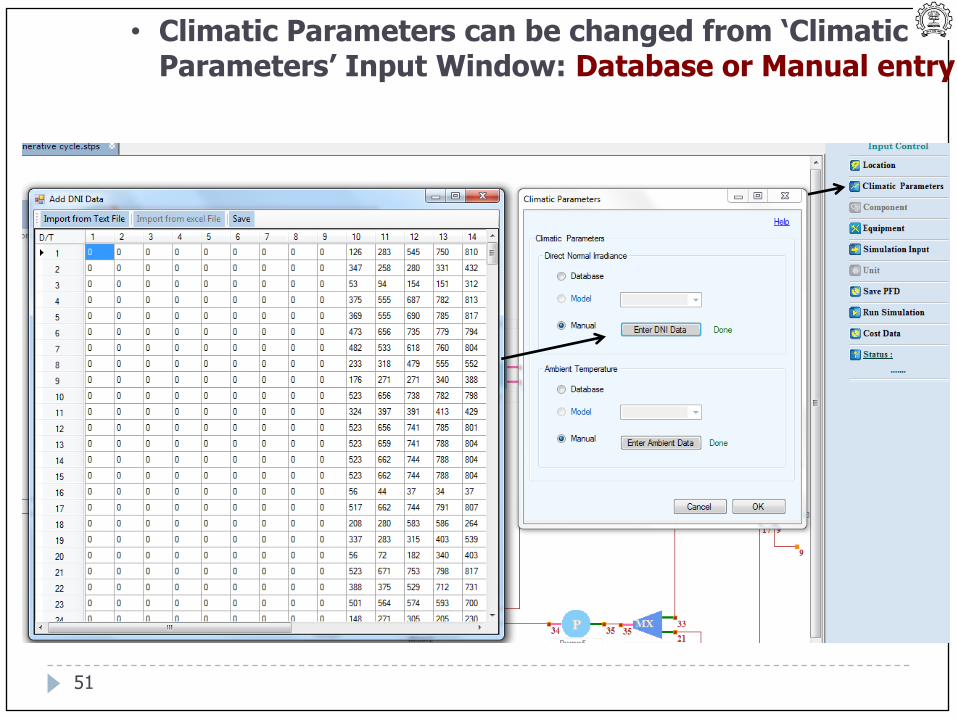
• Climatic Parameters can be changed from ‘Climatic Parameters’ Input Window: Database or Manual entry
51
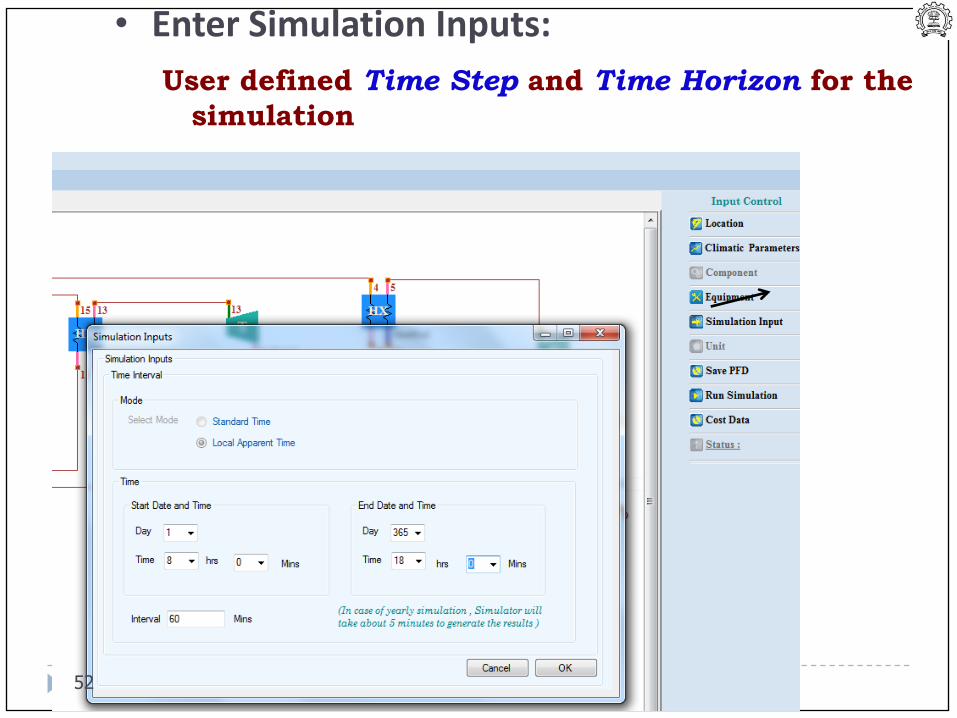
• Enter Simulation Inputs:
User defined Time Step and Time Horizon for the
simulation
52
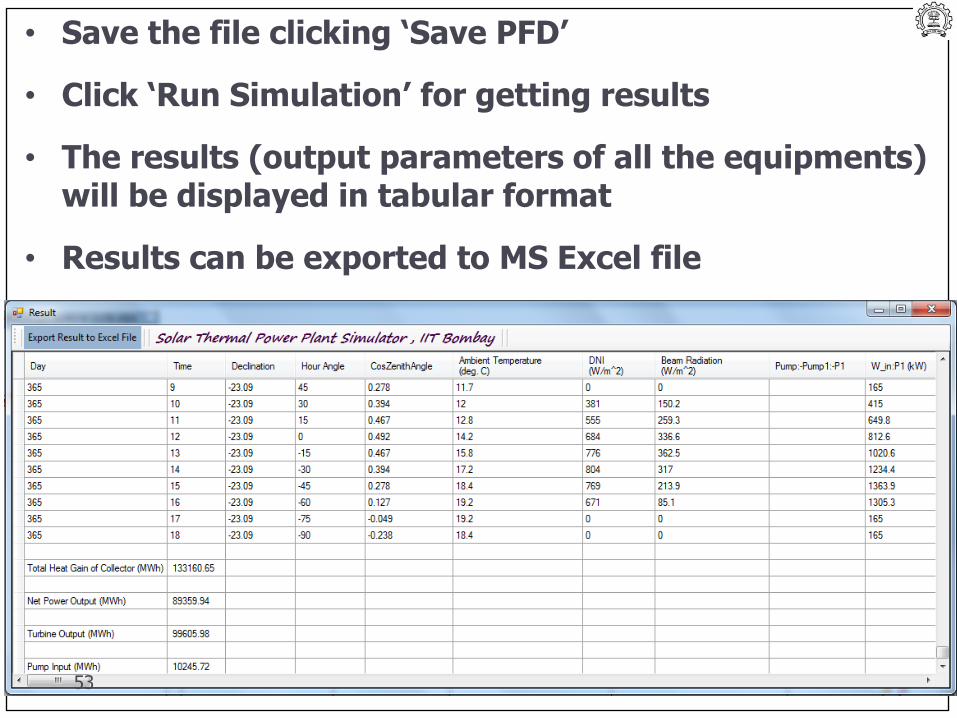
• Save the file clicking ‘Save PFD’
• Click ‘Run Simulation’ for getting results
• The results (output parameters of all the equipments)will be displayed in tabular format
• Results can be exported to MS Excel file
53
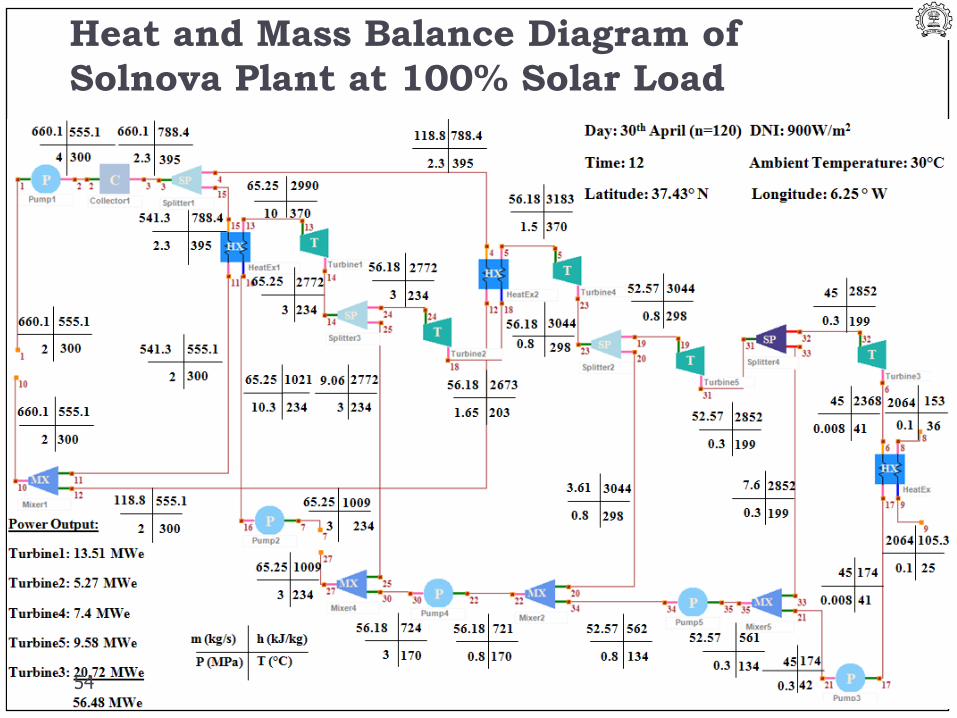
Heat and Mass Balance Diagram of
Solnova Plant at 100% Solar Load
54
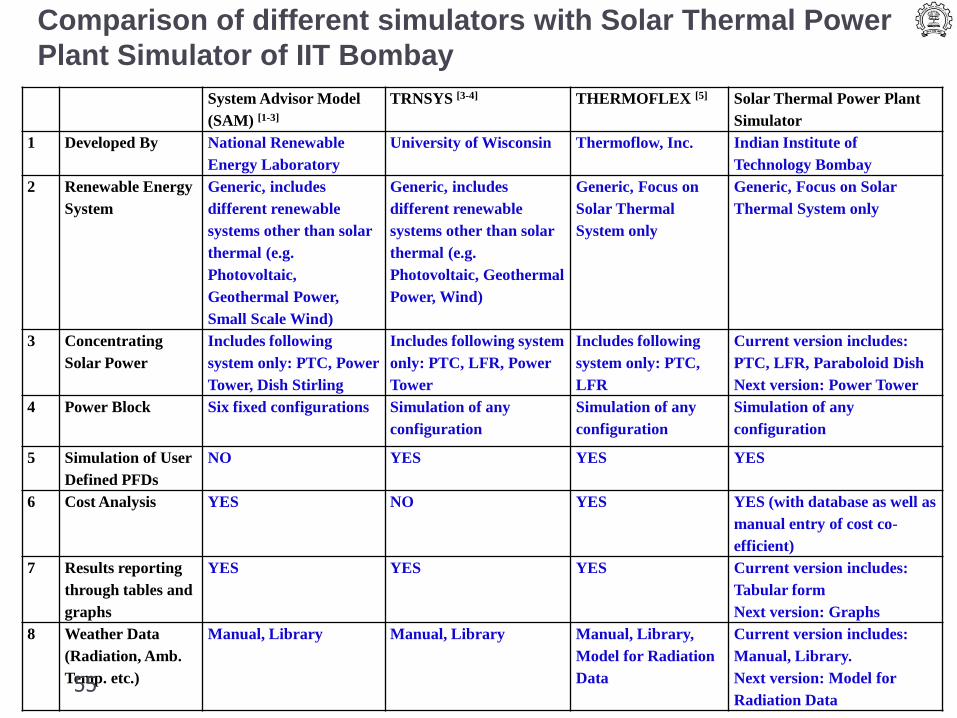
System Advisor Model
(SAM) [1-3]
TRNSYS [3-4] THERMOFLEX [5] Solar Thermal Power Plant
Simulator
1 Developed By National Renewable
Energy Laboratory
University of Wisconsin Thermoflow, Inc. Indian Institute of
Technology Bombay
2 Renewable Energy
System
Generic, includes
different renewable
systems other than solar
thermal (e.g.
Photovoltaic,
Geothermal Power,
Small Scale Wind)
Generic, includes
different renewable
systems other than solar
thermal (e.g.
Photovoltaic, Geothermal
Power, Wind)
Generic, Focus on
Solar Thermal
System only
Generic, Focus on Solar
Thermal System only
3 Concentrating
Solar Power
Includes following
system only: PTC, Power
Tower, Dish Stirling
Includes following system
only: PTC, LFR, Power
Tower
Includes following
system only: PTC,
LFR
Current version includes:
PTC, LFR, Paraboloid Dish
Next version: Power Tower
4 Power Block Six fixed configurations Simulation of any
configuration
Simulation of any
configuration
Simulation of any
configuration
5 Simulation of User
Defined PFDs
NO YES YES YES
6 Cost Analysis YES NO YES YES (with database as well as
manual entry of cost co-
efficient)
7 Results reporting
through tables and
graphs
YES YES YES Current version includes:
Tabular form
Next version: Graphs
8 Weather Data
(Radiation, Amb.
Temp. etc.)
Manual, Library Manual, Library Manual, Library,
Model for Radiation
Data
Current version includes:
Manual, Library.
Next version: Model for
Radiation Data
Comparison of different simulators with Solar Thermal Power
Plant Simulator of IIT Bombay
55
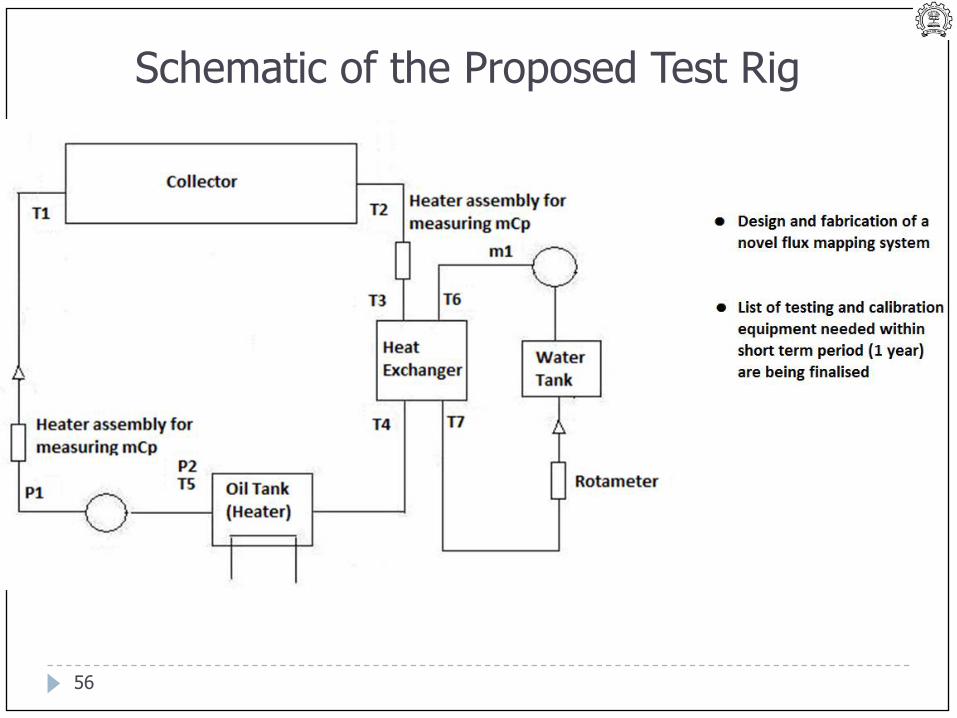
Schematic of the Proposed Test Rig
56
Test Facility
Methodology for tests developed
Test loops finalized
Test rigs designed
Lab testing at IITB in progress
Procurement of test equipment and instruments
done
Test centre building plan finalized
Provisional Patent is filed on
• Flux mapping system for receivers used in
concentrating solar collectors57
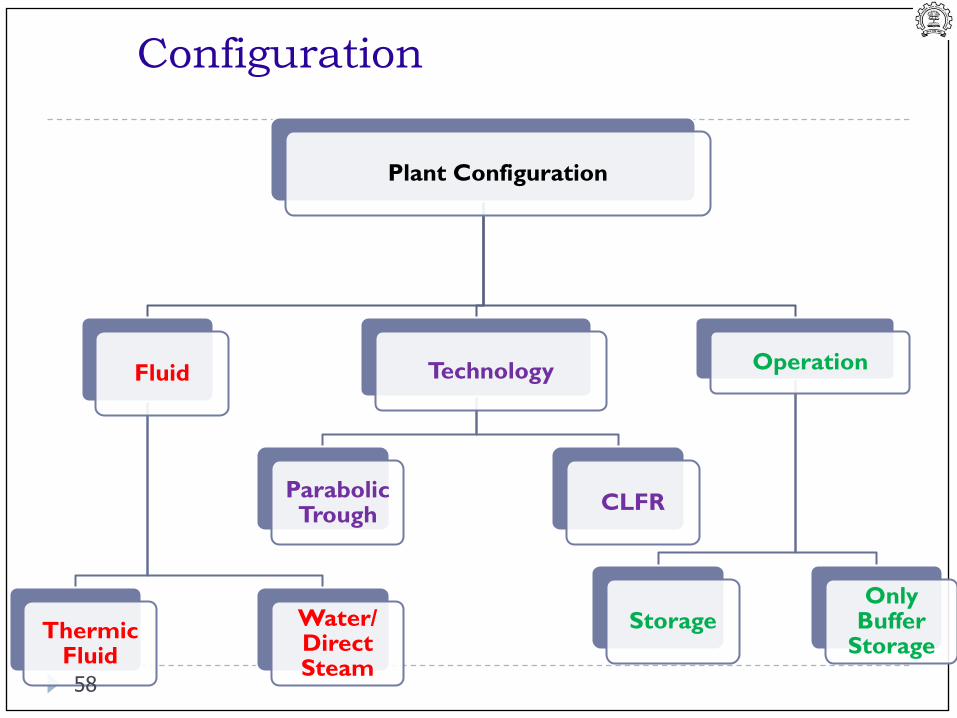
Configuration
Plant Configuration
Fluid
ThermicFluid
Water/ Direct Steam
Technology
Parabolic Trough
CLFR
Operation
StorageOnly
Buffer Storage
58
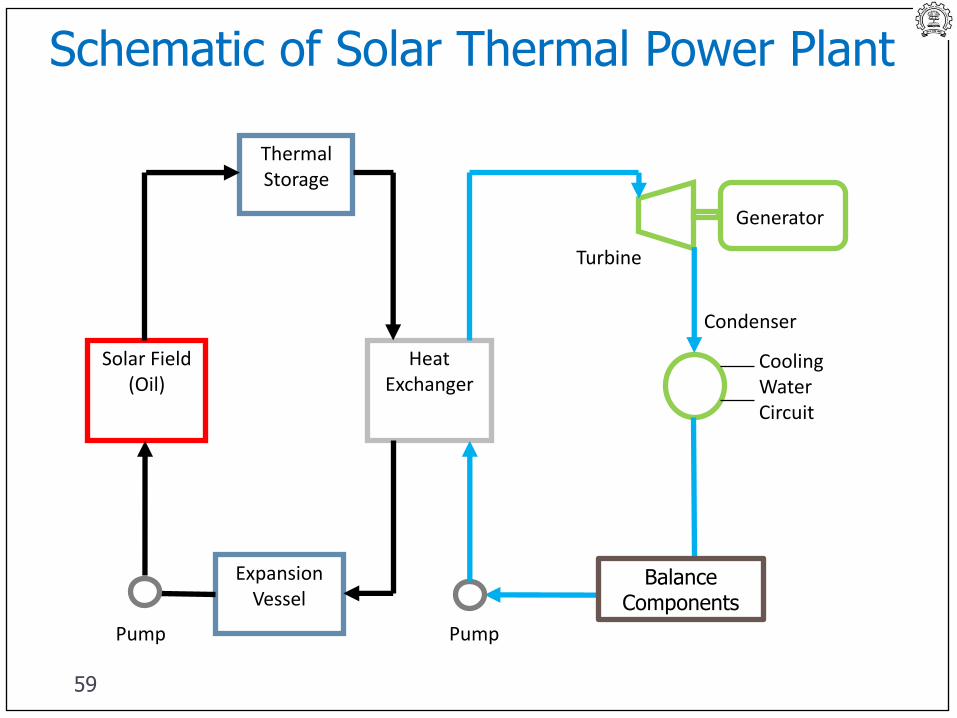
Schematic of Solar Thermal Power Plant
Thermal Storage
Solar Field (Oil)
Expansion Vessel
Heat Exchanger
Generator
Condenser
Turbine
PumpPump
Cooling Water Circuit
Balance Components
59
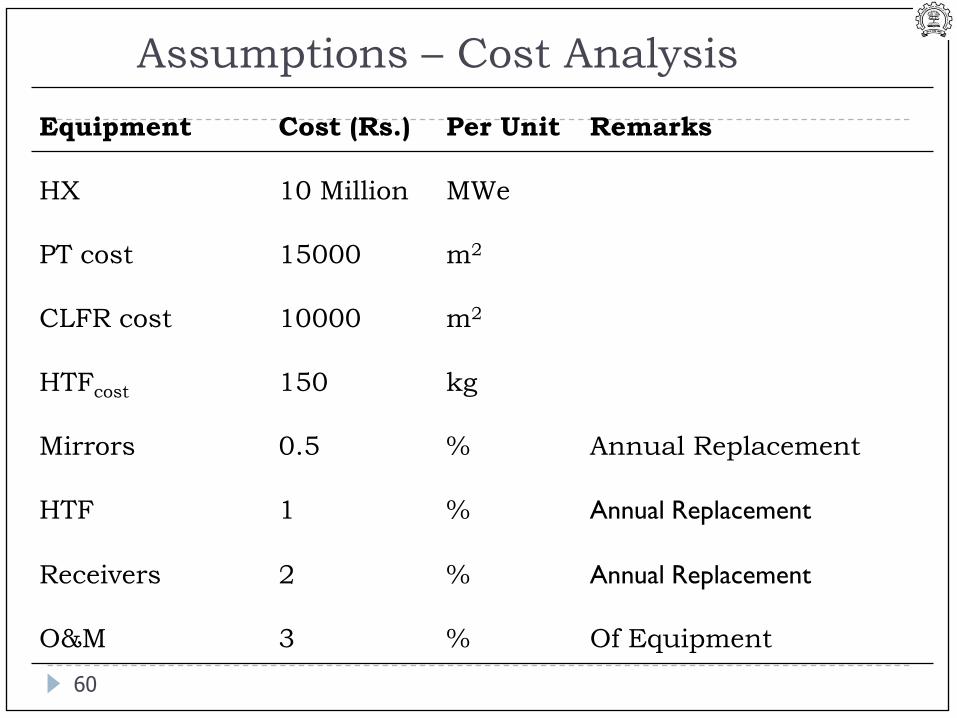
Assumptions – Cost Analysis
Equipment Cost (Rs.) Per Unit Remarks
HX 10 Million MWe
PT cost 15000 m2
CLFR cost 10000 m2
HTFcost 150 kg
Mirrors 0.5 % Annual Replacement
HTF 1 % Annual Replacement
Receivers 2 % Annual Replacement
O&M 3 % Of Equipment
60
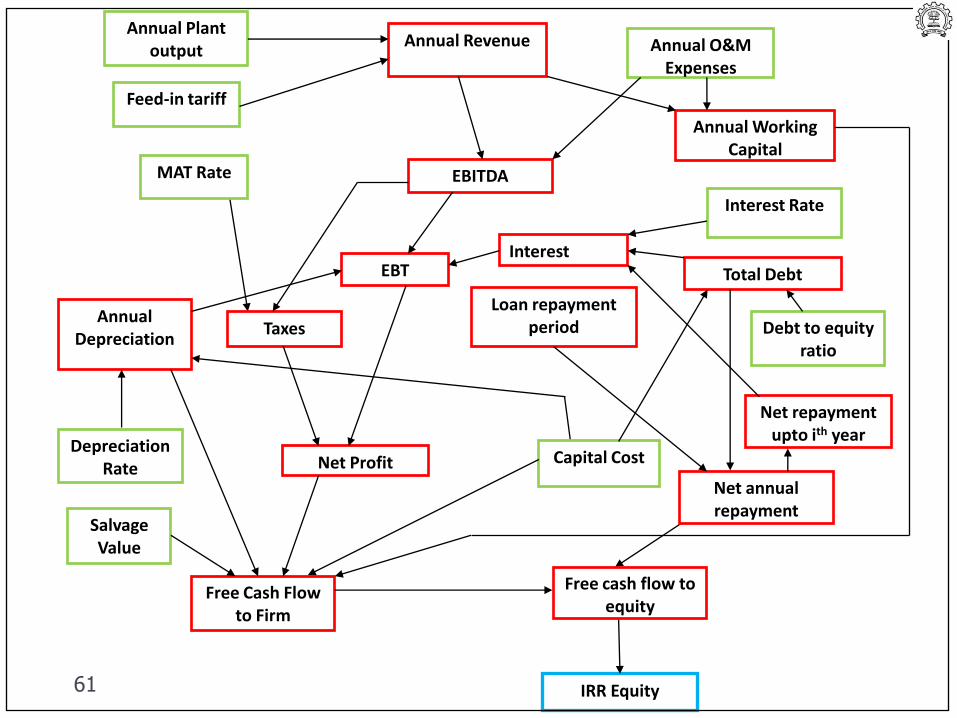
Annual Plant output
Feed-in tariff
Annual Revenue Annual O&M Expenses
Annual Working Capital
EBITDA
Capital Cost
Annual Depreciation
Debt to equity ratio
Total Debt
Interest Rate
Interest EBT
MAT Rate
Taxes
Net Profit Depreciation
Rate
Salvage Value
Free Cash Flow to Firm
Loan repayment period
Net annual repayment
Free cash flow to equity
IRR Equity
Net repayment upto ith year
61
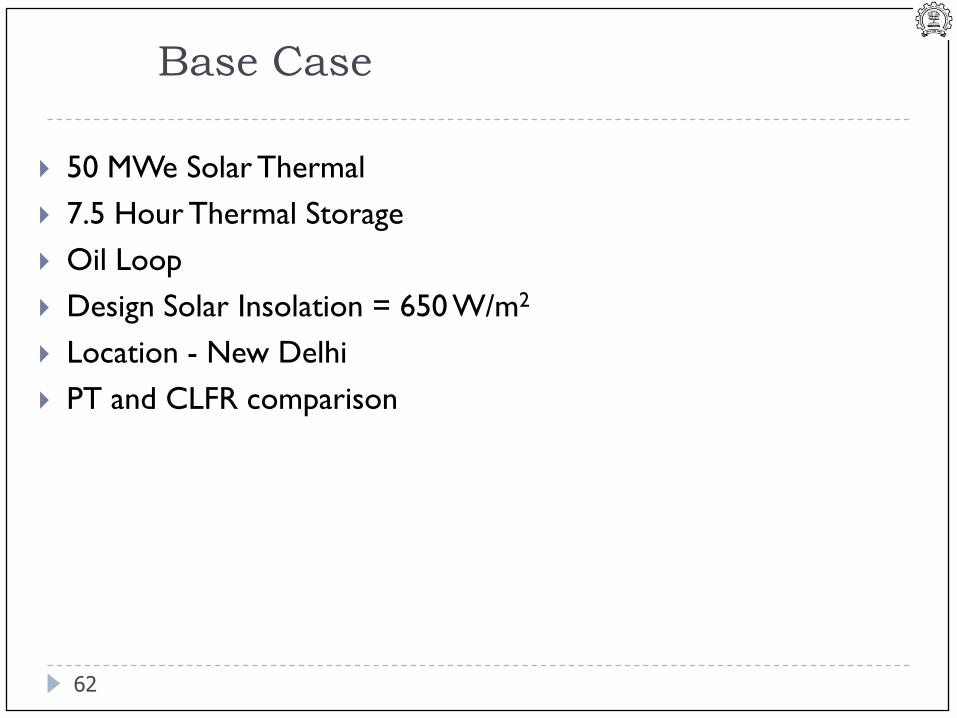
Base Case
50 MWe Solar Thermal
7.5 Hour Thermal Storage
Oil Loop
Design Solar Insolation = 650 W/m2
Location - New Delhi
PT and CLFR comparison
62
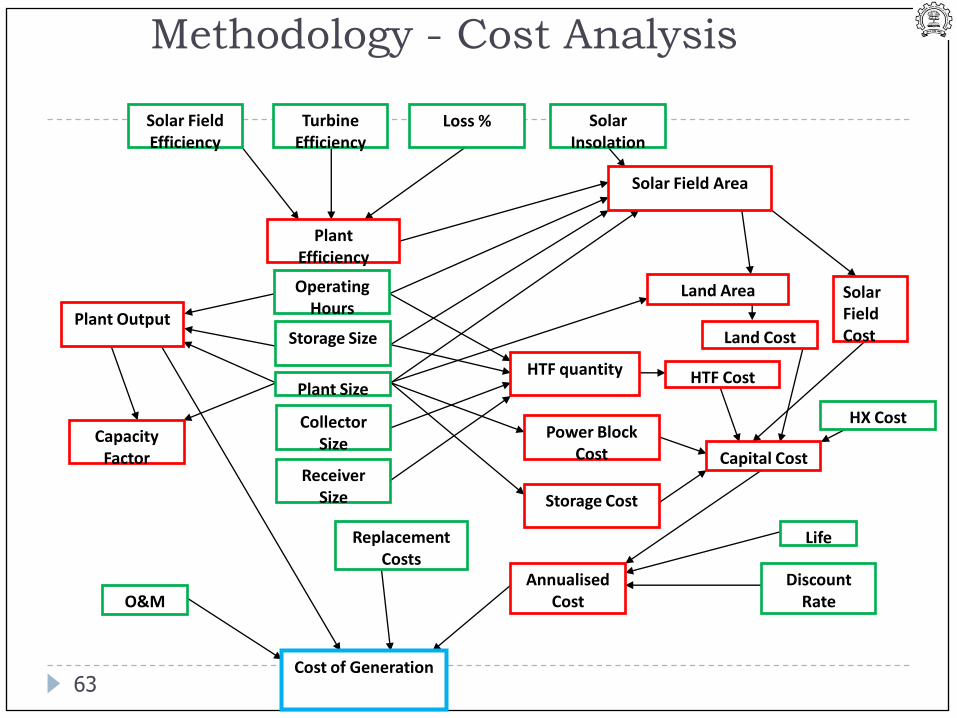
Methodology - Cost Analysis
Solar Field Cost
Solar Field Efficiency
Turbine Efficiency
Loss %
Plant Efficiency
Operating Hours
Storage Size
Plant Size
Collector Size
Receiver Size
Solar Field Area
Land Area
Land Cost
HX Cost
HTF quantity HTF Cost
Power Block Cost
Storage Cost
Capital Cost
Plant Output
Solar Insolation
Capacity Factor
Discount Rate
Life
AnnualisedCost O&M
Replacement Costs
Cost of Generation 63
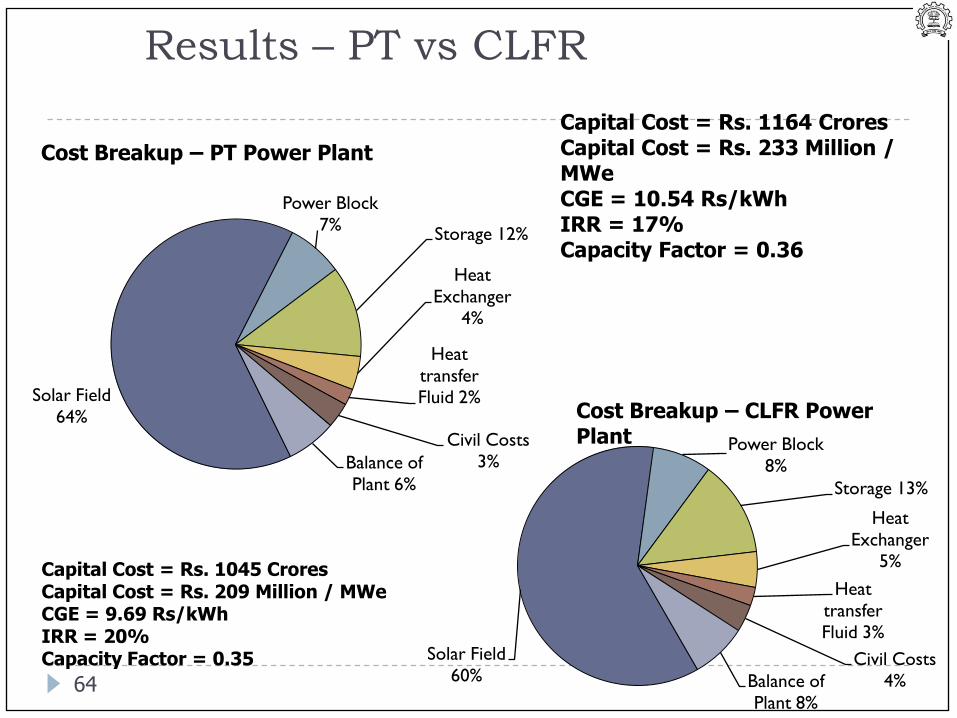
Results – PT vs CLFR
Cost Breakup – PT Power Plant
Capital Cost = Rs. 1164 Crores Capital Cost = Rs. 233 Million / MWe CGE = 10.54 Rs/kWhIRR = 17%Capacity Factor = 0.36
Solar Field
64%
Power Block
7%Storage 12%
Heat
Exchanger
4%
Heat
transfer
Fluid 2%
Civil Costs
3%Balance of
Plant 6%
Solar Field
60%
Power Block
8%
Storage 13%
Heat
Exchanger
5%
Heat
transfer
Fluid 3%
Civil Costs
4%Balance of
Plant 8%
Cost Breakup – CLFR Power Plant
Capital Cost = Rs. 1045 Crores Capital Cost = Rs. 209 Million / MWe CGE = 9.69 Rs/kWhIRR = 20%Capacity Factor = 0.35
64
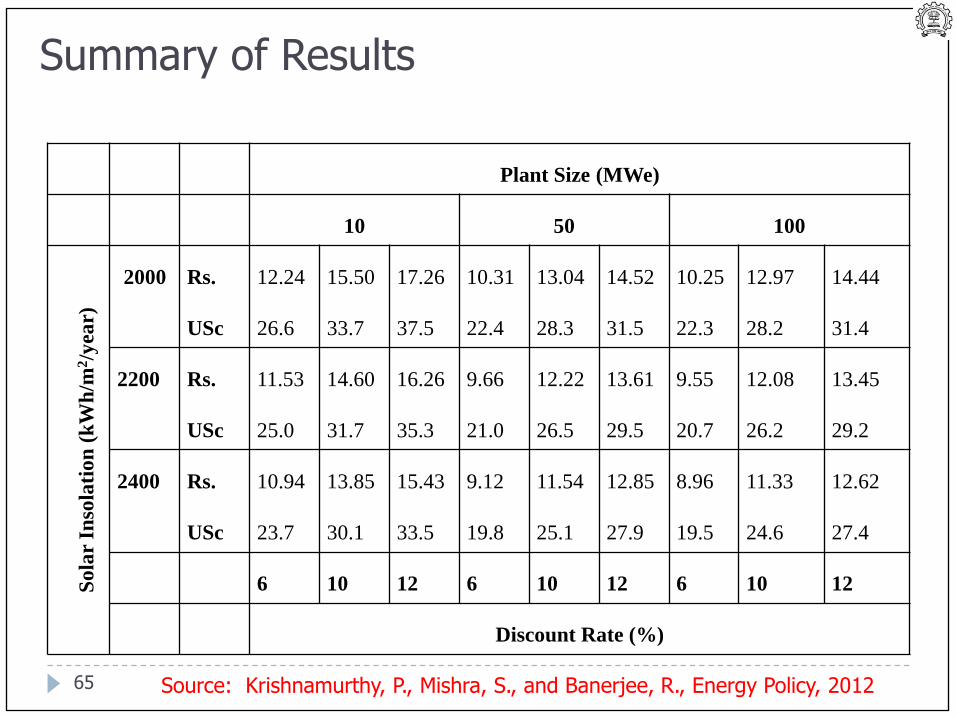
Plant Size (MWe)
10 50 100
So
lar
Inso
lati
on
(k
Wh
/m2/y
ear)
2000 Rs.
USc
12.24
26.6
15.50
33.7
17.26
37.5
10.31
22.4
13.04
28.3
14.52
31.5
10.25
22.3
12.97
28.2
14.44
31.4
2200 Rs.
USc
11.53
25.0
14.60
31.7
16.26
35.3
9.66
21.0
12.22
26.5
13.61
29.5
9.55
20.7
12.08
26.2
13.45
29.2
2400 Rs.
USc
10.94
23.7
13.85
30.1
15.43
33.5
9.12
19.8
11.54
25.1
12.85
27.9
8.96
19.5
11.33
24.6
12.62
27.4
6 10 12 6 10 12 6 10 12
Discount Rate (%)
Summary of Results
Source: Krishnamurthy, P., Mishra, S., and Banerjee, R., Energy Policy, 201265
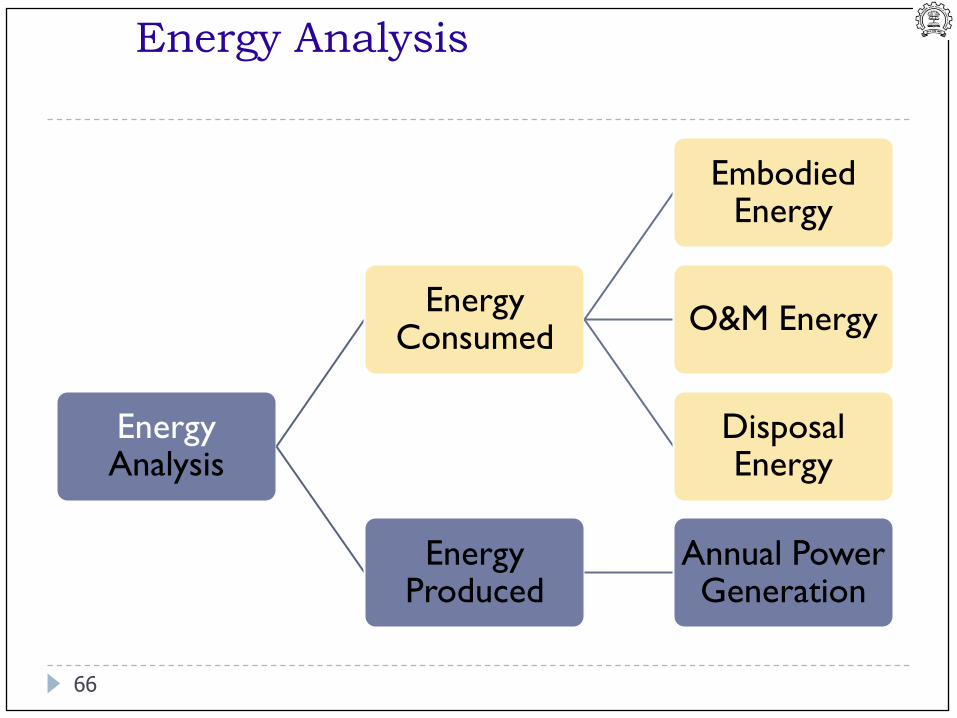
Energy Analysis
EnergyAnalysis
Energy Consumed
Embodied Energy
O&M Energy
Disposal Energy
Energy Produced
Annual Power Generation
66
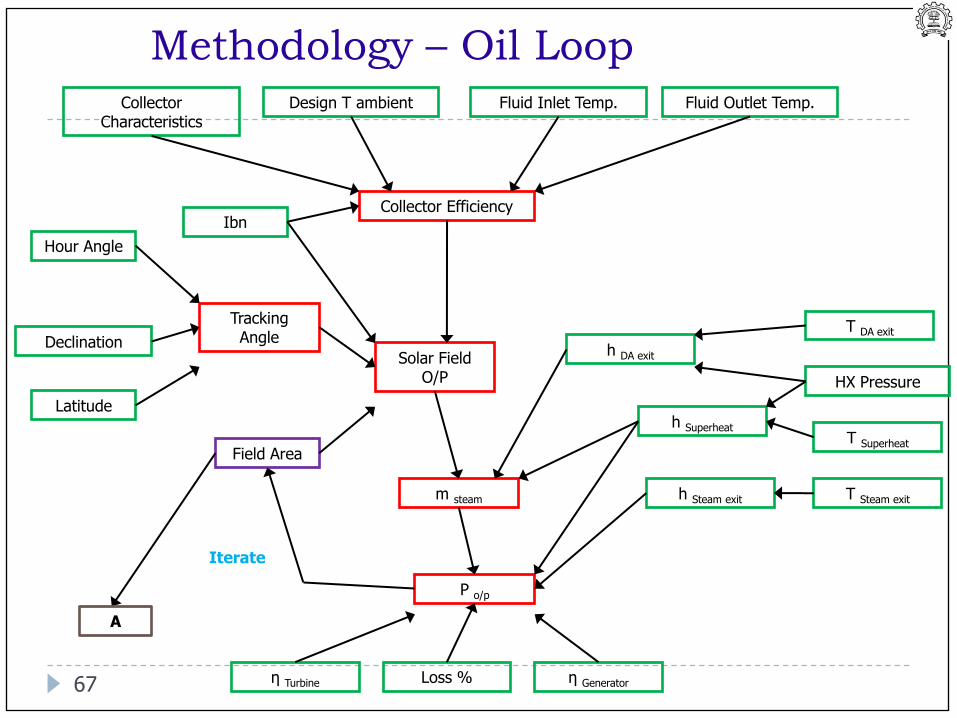
Methodology – Oil LoopCollector
CharacteristicsDesign T ambient Fluid Inlet Temp. Fluid Outlet Temp.
Collector Efficiency
Hour Angle
Declination
Latitude
Tracking Angle
Solar Field O/P
Field Area
Ibn
T DA exit
HX Pressure
T Superheat
T Steam exit
h DA exit
h Superheat
h Steam exitm steam
P o/p
η Turbine η GeneratorLoss %
Iterate
A
67
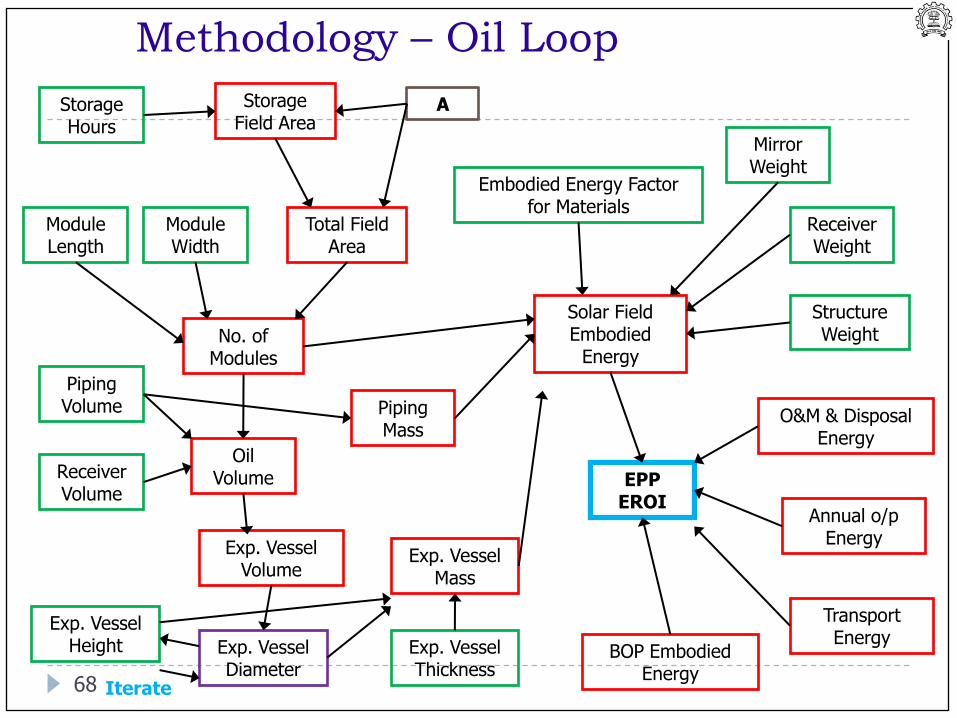
Methodology – Oil Loop
AStorage Hours
Storage Field Area
Total Field Area
Module Length
Module Width
No. of Modules
Piping Volume
Receiver Volume
Oil Volume
Piping Mass
Embodied Energy Factor for Materials
Exp. Vessel Volume
Exp. Vessel Height Exp. Vessel
DiameterIterate
Exp. Vessel Mass
Exp. Vessel Thickness
Mirror Weight
Receiver Weight
Structure Weight
Solar Field Embodied
Energy
BOP Embodied Energy
Transport Energy
O&M & Disposal Energy
Annual o/p Energy
EPPEROI
68
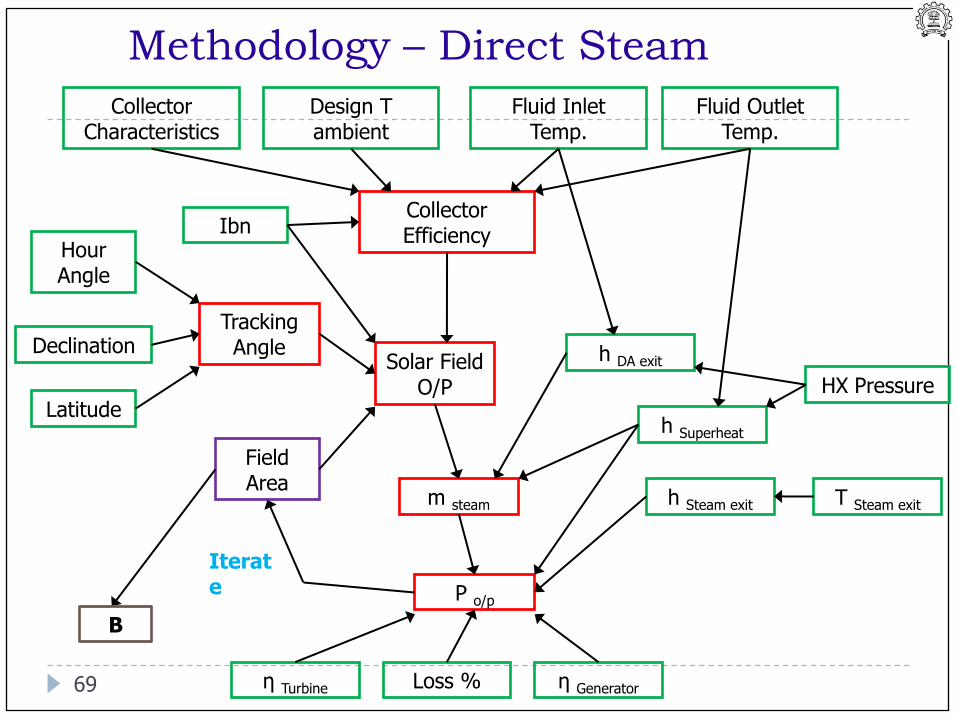
Methodology – Direct Steam
Collector Characteristics
Design T ambient
Fluid Inlet Temp.
Fluid Outlet Temp.
Collector Efficiency
Hour Angle
Declination
Latitude
Tracking Angle
Solar Field O/P
Field Area
Ibn
HX Pressure
T Steam exit
h DA exit
h Superheat
h Steam exitm steam
P o/p
η Turbine η GeneratorLoss %
Iterate
B
69
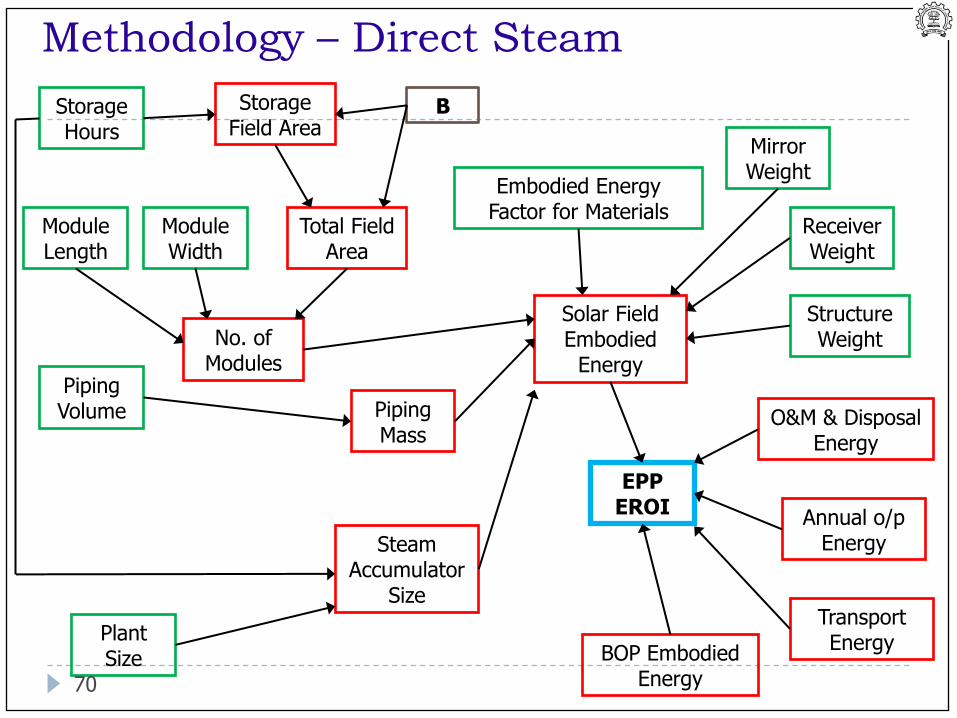
Methodology – Direct Steam
BStorage Hours
Storage Field Area
Total Field Area
Module Length
Module Width
No. of Modules
Piping Volume Piping
Mass
Embodied Energy Factor for Materials
Steam Accumulator
Size
Mirror Weight
Receiver Weight
Structure Weight
Solar Field Embodied
Energy
BOP Embodied Energy
Transport Energy
O&M & Disposal Energy
Annual o/p Energy
EPPEROI
Plant Size
70
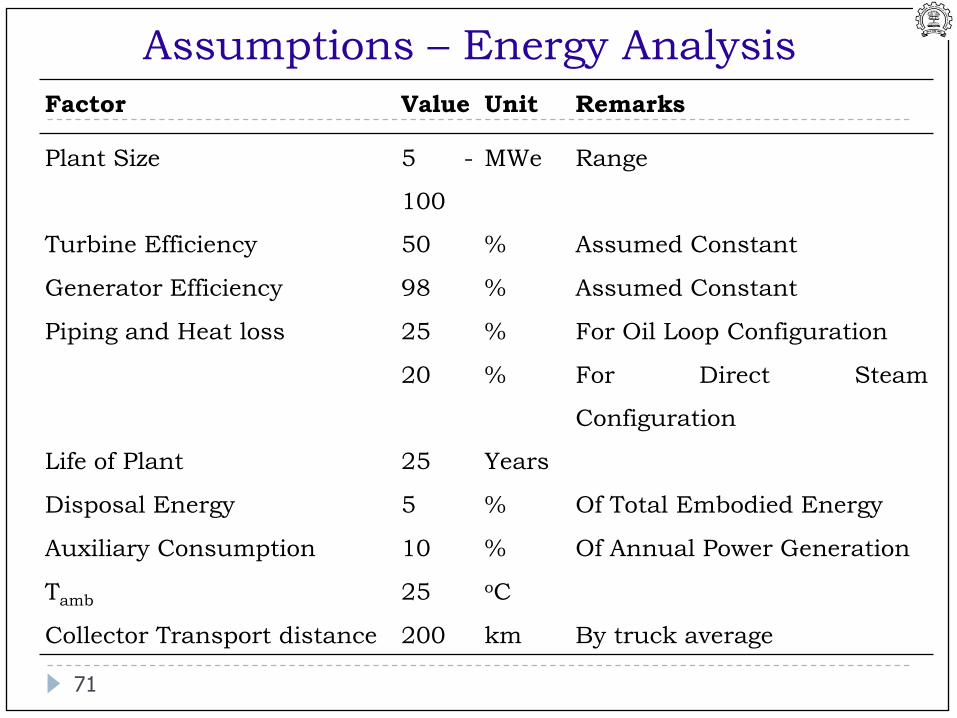
Assumptions – Energy Analysis
Factor Value Unit Remarks
Plant Size 5 -
100
MWe Range
Turbine Efficiency 50 % Assumed Constant
Generator Efficiency 98 % Assumed Constant
Piping and Heat loss 25 % For Oil Loop Configuration
20 % For Direct Steam
Configuration
Life of Plant 25 Years
Disposal Energy 5 % Of Total Embodied Energy
Auxiliary Consumption 10 % Of Annual Power Generation
Tamb 25 oC
Collector Transport distance 200 km By truck average
71
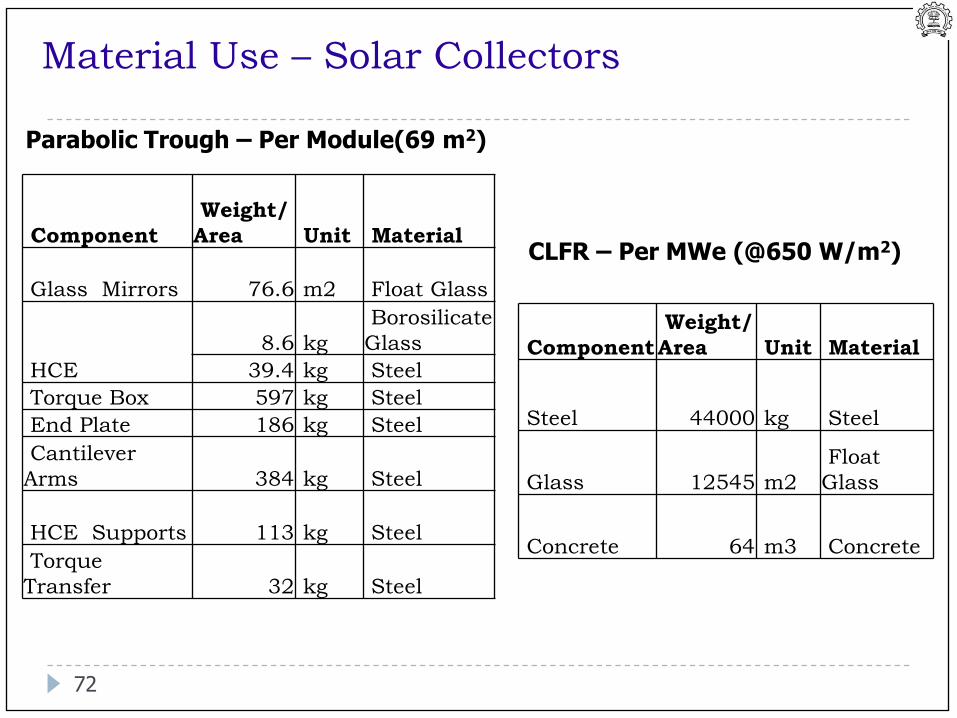
Material Use – Solar Collectors
Component
Weight/
Area Unit Material
Glass Mirrors 76.6 m2 Float Glass
HCE
8.6 kg
Borosilicate
Glass
39.4 kg Steel
Torque Box 597 kg Steel
End Plate 186 kg Steel
Cantilever
Arms 384 kg Steel
HCE Supports 113 kg Steel
Torque
Transfer 32 kg Steel
Component
Weight/
Area Unit Material
Steel 44000 kg Steel
Glass 12545 m2
Float
Glass
Concrete 64 m3 Concrete
Parabolic Trough – Per Module(69 m2)
CLFR – Per MWe (@650 W/m2)
72
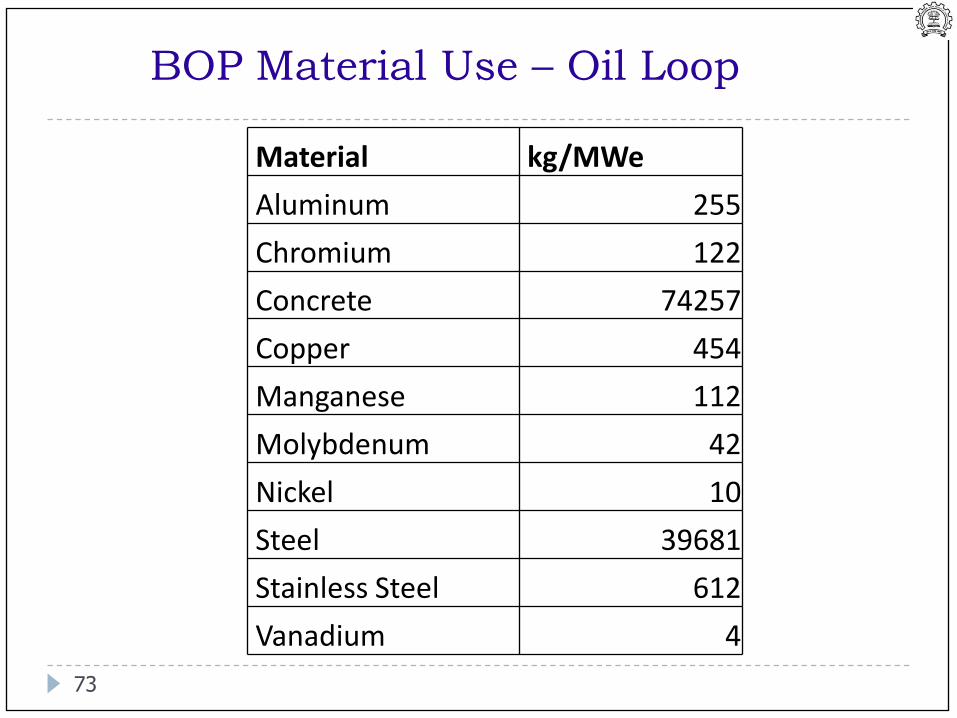
BOP Material Use – Oil Loop
Material kg/MWe
Aluminum 255
Chromium 122
Concrete 74257
Copper 454
Manganese 112
Molybdenum 42
Nickel 10
Steel 39681
Stainless Steel 612
Vanadium 4
73
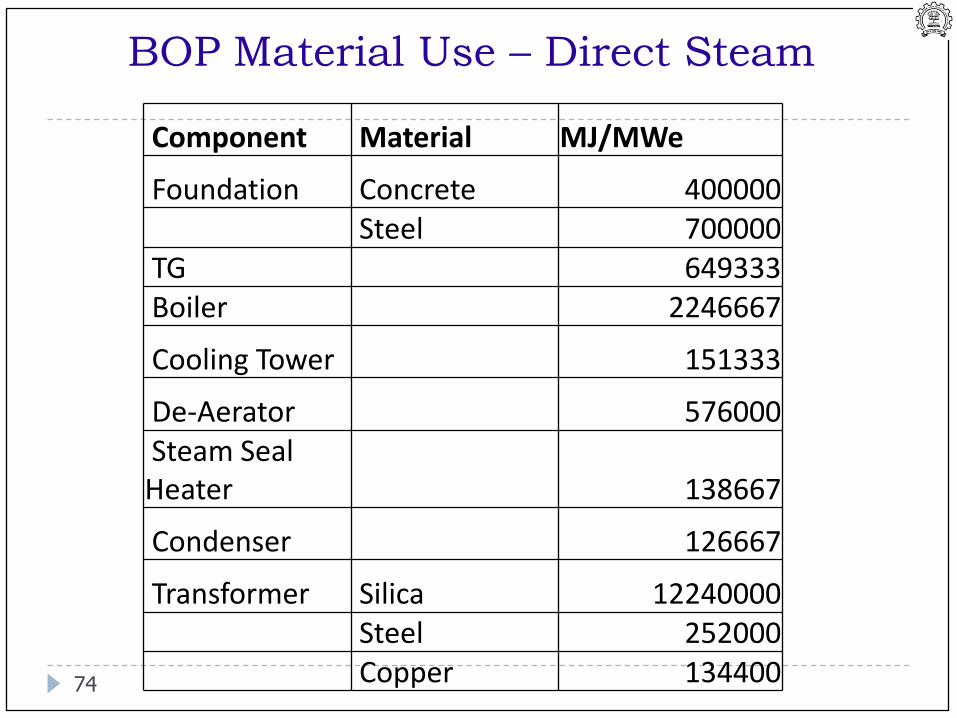
BOP Material Use – Direct Steam
Component Material MJ/MWe
Foundation Concrete 400000Steel 700000
TG 649333Boiler 2246667
Cooling Tower 151333
De-Aerator 576000Steam Seal Heater 138667
Condenser 126667
Transformer Silica 12240000Steel 252000Copper 13440074
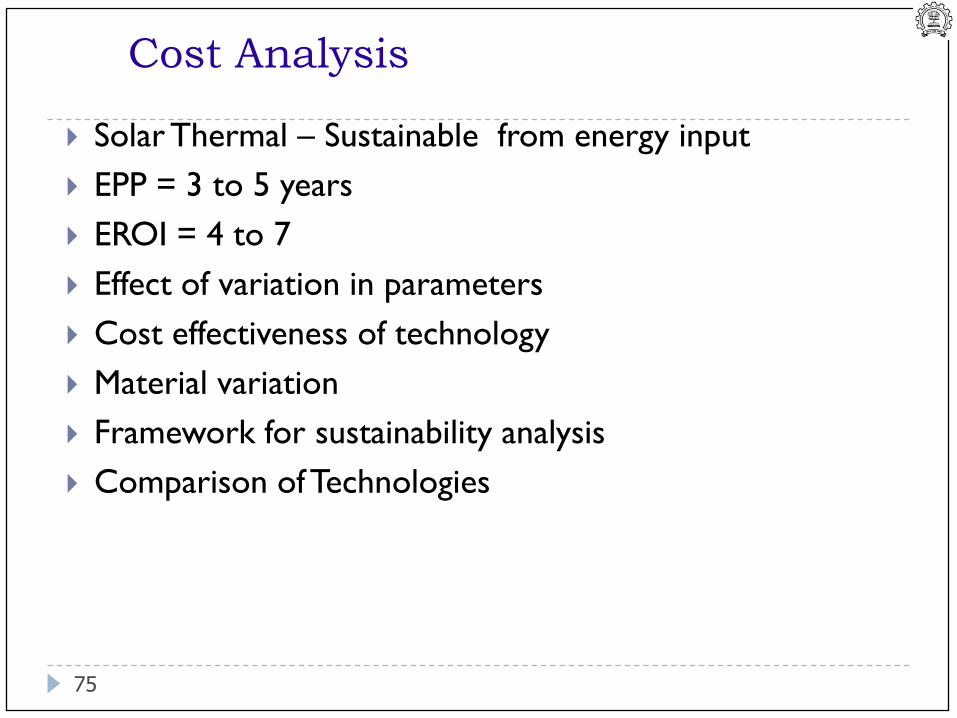
Cost Analysis
Solar Thermal – Sustainable from energy input
EPP = 3 to 5 years
EROI = 4 to 7
Effect of variation in parameters
Cost effectiveness of technology
Material variation
Framework for sustainability analysis
Comparison of Technologies
75
76
77
Summing up
PV – growth, diffusion – need to enhance roof top
systems
Solar Thermal – Test facility – MW scale – enable future
cost effective plants
Limited experience in power plant and solar field,Sub-
critical base of researchers
No evidence of cost reduction
Need for public domain performance data
Most collaborations – ‘turnkey plants’ –no focus on
indigenisation
CSP – significant potential for cost reduction
78
79
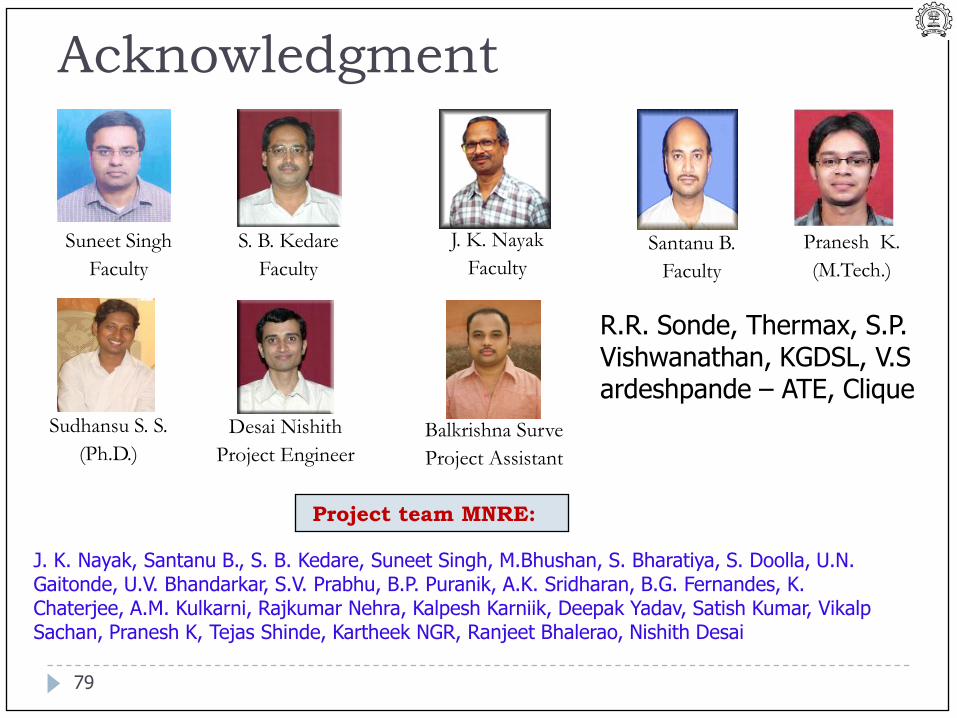
Acknowledgment
Balkrishna Surve
Project Assistant
Suneet Singh
Faculty
Project team MNRE:
Santanu B.
Faculty
S. B. Kedare
Faculty
J. K. Nayak
Faculty
Sudhansu S. S.
(Ph.D.)
Pranesh K.
(M.Tech.)
Desai Nishith
Project Engineer
J. K. Nayak, Santanu B., S. B. Kedare, Suneet Singh, M.Bhushan, S. Bharatiya, S. Doolla, U.N. Gaitonde, U.V. Bhandarkar, S.V. Prabhu, B.P. Puranik, A.K. Sridharan, B.G. Fernandes, K. Chaterjee, A.M. Kulkarni, Rajkumar Nehra, Kalpesh Karniik, Deepak Yadav, Satish Kumar, Vikalp Sachan, Pranesh K, Tejas Shinde, Kartheek NGR, Ranjeet Bhalerao, Nishith Desai
R.R. Sonde, Thermax, S.P. Vishwanathan, KGDSL, V.Sardeshpande – ATE, Clique
References Desai N.B. and Bandyopadhyay S., Solar Thermal Power Plant Simulator, SOLARIS, Varanasi, India, Feb. 7-9, 2012.
Krishnamurthy P. and Banerjee R., "Energy analysis of solar thermal concentrating systems for power plants“. The
International Conference on Future Electrical Power and Energy Systems, 2012 . China
Sahoo S.S., Singh S. and Banerjee R., "Parametric studies on parabolic trough solar collector", WREC, Abu
Dhabi, UAE, Sep. 25-30, 2010.
Sahoo S.S., Varghese S.M., Ashwin Kumar, Suresh Kumar C., Singh S., Banerjee R., " experimental and computational
investigation of heat losses from the cavity receiver used in linear Fresnel reflectors", ICAER, Mumbai, Dec. 9-11, 2011.
Sahoo S.S., Singh S., Banerjee R.," Hydrothermal analysis of the absorber tubes used in linear Fresnel reflector solar
thermal system", 10th ISHMT- ASME Heat and Mass transfer conference, Chennai, India, Dec. 27-30, 2011.
Sahoo S.S., Varghese S.M., Suresh Kumar C., Viswanathan S.P., Singh S., Banerjee R., " Experimental investigation of
convective boiling in the absorber tube of the linear Fresnel reflector solar thermal
system", SOLARIS, Varanasi, India, Feb. 7-9, 2012
National Renewable Energy Laboratory (NREL), System Advisor Model (SAM) software, Version 2011.5.4, 2011.
P. Gilman, Solar Advisor Model User Manual, Technical report, National Renewable Energy
Laboratory, Golden, Colorado, USA, 2010.
K. H. Clifford, Software and Codes for Analysis of Concentrating Solar Power Technologies, SANDIA Report SAND2008-
8053, 2008.
Solar Energy Laboratory, TRNSYS, A Transient Simulation Program, University of Wisconsin, Madison, Demo Version
17.00.0018, 2010.
Thermoflow Inc., THERMOFLEX User Manual, Version 19, 2009.
Ministry of New and Renewable Energy, New Delhi, website: www.mnre.gov.in
Thank you Email: [email protected]
80