Embed Size (px)
Citation preview

ROADWAY HORIZONTAL ALIGNMENTS
By:
Gregory J. Taylor, P.E.
PDHLibrary Course No 0010071 5 PDH HOURS

ROADWAY HORIZONTAL
ALIGNMENTS
by
Gregory J. Taylor, P.E.

Roadway Horizontal Alignments
Copyright 2015 Gregory J. Taylor, P.E. Page 2 of 61
INTRODUCTION The roadway horizontal alignment is a series of horizontal tangents (straight roadway
sections), circular curves, and spiral transitions. It shows the proposed roadway
location in relation to the existing terrain and adjacent land conditions. Together with
the vertical alignment (grades and vertical curves) and roadway cross-sections (lanes,
shoulders, curbs, medians, roadside slopes, ditches, sidewalks), the horizontal
alignment (tangents and curves) helps to provide a three-dimensional roadway layout.
This course focuses on the geometric design of horizontal alignments for modern roads
and highways. Its contents are intended to serve as guidance and not as an absolute
standard or rule.
Upon course completion, you should be familiar with the general design of horizontal
roadway alignments. The course objective is to give engineers and designers an in-
depth look at the principles to be considered when designing horizontal alignments.
Subjects covered include:
Sight Distance
Stopping
Decision
Passing
Intersection
Design Considerations
Cross slopes
Superelevation
Radii
Grades
Horizontal Curves
Compound
Spiral
Coordination of Horizontal & Vertical Curves

Roadway Horizontal Alignments
Copyright 2015 Gregory J. Taylor, P.E. Page 3 of 61
A Policy on Geometric Design of Highways and Streets (also known as the �Green
Book�) published by the American Association of State Highway and Transportation
Officials (AASHTO) is considered to be the primary guidance for U.S. roadway design.
For this course, Chapter 3 (Section 3.3 Horizontal Alignment) will be used exclusively
for fundamental roadway geometric design principles.
BACKGROUND
Roadway geometric design consists of the following fundamental three-dimensional
features:
Vertical alignment - grades and vertical curves
Horizontal alignment - tangents and curves
Cross section - lanes and shoulders, curbs, medians, roadside slopes and
ditches, sidewalks
Combined, these elements contribute to the roadway�s operational quality and safety by
providing a smooth-flowing, crash-free facility.

Roadway Horizontal Alignments
Copyright 2015 Gregory J. Taylor, P.E. Page 4 of 61
Engineers must understand how all of the roadway elements contribute to overall
safety and operation. Applying design standards and criteria to �solve� a problem is not
enough.
The fundamental objective of good geometric design will remain as it has always been �
to produce a roadway that is safe, efficient, reasonably economic and sensitive to
conflicting concerns.
HORIZONTAL ALIGNMENT
The horizontal alignment is a series of horizontal tangents (straight roadway sections),
circular curves, and spiral transitions used for the roadway�s geometry. This design
shows the proposed roadway location in relation to the existing terrain and adjacent
land conditions. The main objective of geometric roadway design is to integrate these
elements to produce a compatible speed with the road�s function and location. Safety,
operational quality, and project costs can be significantly influenced by coordinating the
horizontal and vertical alignments.
DESIGN SPEED
AASHTO defines design speed as �the maximum safe speed that can be maintained
over a specified section of highway when conditions are so favorable that the design
features of the highway govern�. It is an overall design control for horizontal
alignments in roadway design that may equal or exceed the legal statutory speed limit.
The level of service is directly related to the speed of operation - it should meet driver
expectations and be consistent with the facility�s functional classification and location.
Design speed selection is a critical decision that should be done at the beginning of the
planning and design process. This speed should balance safety, mobility, and efficiency
with potential environmental quality, economics, aesthetics, social and political
impacts. Roadway design features (curve radii, superelevation, sight distance, etc.) are
impacted by the design speed, as well as other characteristics not directly related to

Roadway Horizontal Alignments
Copyright 2015 Gregory J. Taylor, P.E. Page 5 of 61
speed. Therefore, any changes to design speed may affect many roadway design
elements.
Design speeds for rural roads should be as high as practicable to supply an optimal
degree of safety and operational efficiency. Data has shown that drivers operate quite
comfortably at speeds that are higher than typical design speeds.
Lower design speeds may be appropriate for certain urban roadways (residential
streets, school zones, etc.). Traffic calming techniques have proven to be a viable option
for residential traffic operations. Designers should evaluate high speed compatibility
with safety (pedestrians, driveways, parking, etc.) for urban arterials.
HORIZONTAL CURVES
Roadway horizontal curve design is based on the laws of physics and driver reaction to
lateral acceleration. Any geometric alignment needs to address curve location; curve
sharpness; tangent lengths; and how they relate to the vertical profile. All of these
components should be balanced to operate at appropriate speeds under normal
conditions.
Elements of Curve Design
o Curve radius
o Superelevation
o Side friction
o Assumed vehicle speed
Horizontal curves depend on specific values for a minimum radius (based on speed
limit), curve length, and sight obstructions (sight distance). An increased superelevation
(bank) may be required to assure safety for high speed locations with small curve radii.
Roadway Horizontal Alignments
Copyright 2015 Gregory J. Taylor, P.E. Page 6 of 61
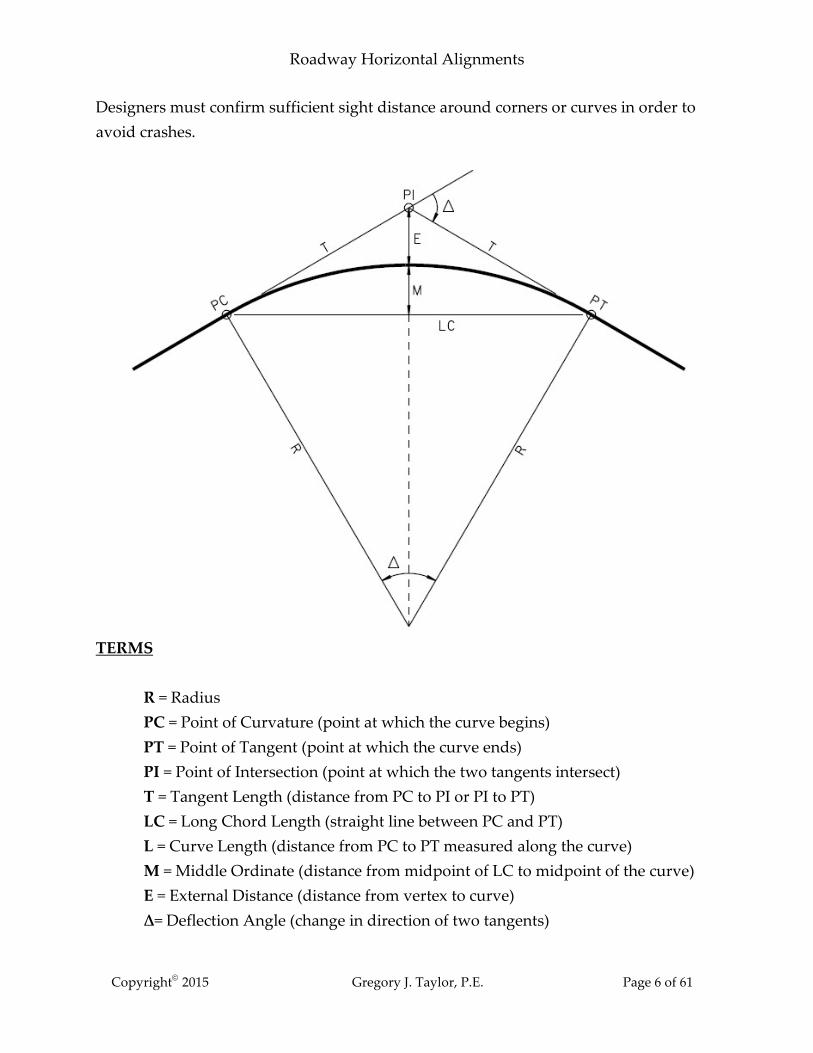
Designers must confirm sufficient sight distance around corners or curves in order to
avoid crashes.
TERMS
R = Radius
PC = Point of Curvature (point at which the curve begins)
PT = Point of Tangent (point at which the curve ends)
PI = Point of Intersection (point at which the two tangents intersect)
T = Tangent Length (distance from PC to PI or PI to PT)
LC = Long Chord Length (straight line between PC and PT)
L = Curve Length (distance from PC to PT measured along the curve)
M = Middle Ordinate (distance from midpoint of LC to midpoint of the curve)
E = External Distance (distance from vertex to curve)
∆= Deflection Angle (change in direction of two tangents)
Roadway Horizontal Alignments
Copyright 2015 Gregory J. Taylor, P.E. Page 7 of 61
The upper limits for superelevation on horizontal curves address constructability, land
usage, slow-moving vehicles, and climate. For regular snow or ice locations, the
superelevation should not exceed rates where slow-moving vehicles would slide
toward the center of the curve. Hydroplaning can occur at high speed locations with
poor drainage that allow a build-up of water.
SIDE FRICTION FACTOR
A vehicle�s need for side friction (side friction demand) is represented by the side friction
factor. This term also depicts the lateral acceleration acting on a vehicle which is the
product of the side friction demand factor and the gravitational constant. Vehicle
speeds on horizontal curves create tire side thrust which is offset by the frictional forces
between the tires and the riding surface.
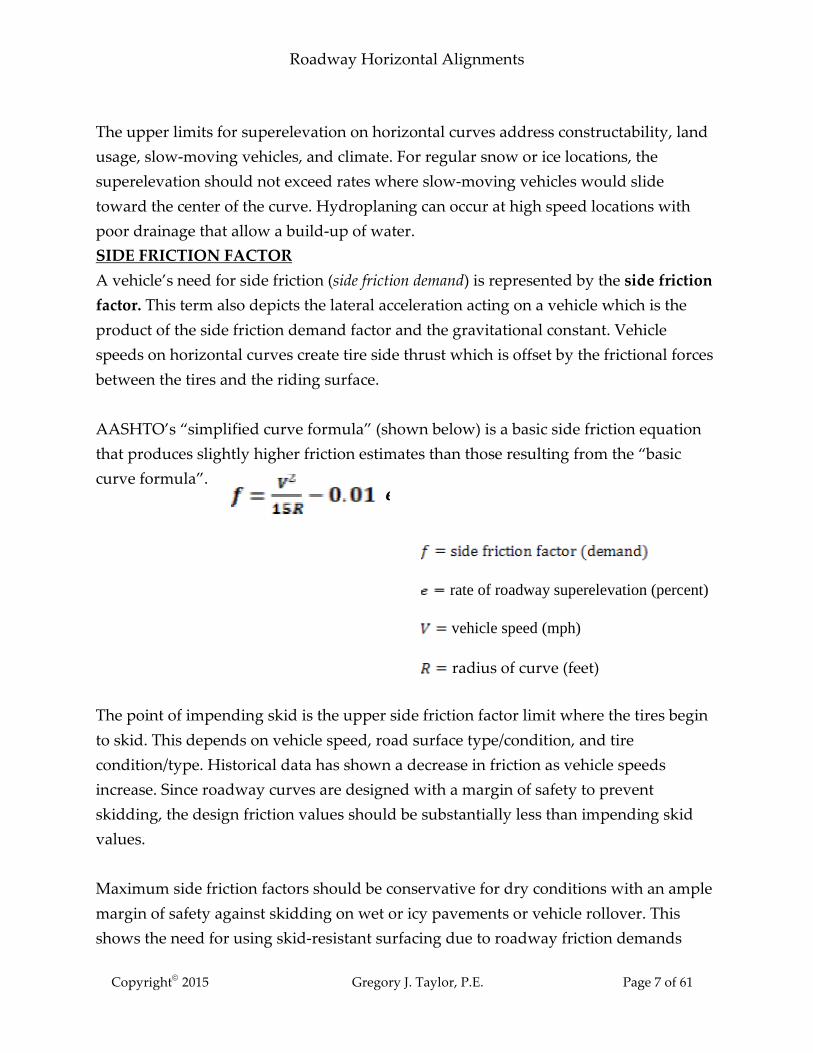
AASHTO�s �simplified curve formula� (shown below) is a basic side friction equation
that produces slightly higher friction estimates than those resulting from the �basic
curve formula�.
The point of impending skid is the upper side friction factor limit where the tires begin
to skid. This depends on vehicle speed, road surface type/condition, and tire
condition/type. Historical data has shown a decrease in friction as vehicle speeds
increase. Since roadway curves are designed with a margin of safety to prevent
skidding, the design friction values should be substantially less than impending skid
values.
Maximum side friction factors should be conservative for dry conditions with an ample
margin of safety against skidding on wet or icy pavements or vehicle rollover. This
shows the need for using skid-resistant surfacing due to roadway friction demands
e
rate of roadway superelevation (percent)
vehicle speed (mph)
radius of curve (feet)

Roadway Horizontal Alignments
Copyright 2015 Gregory J. Taylor, P.E. Page 8 of 61
from driving maneuvers (braking, lane changes, directional changes, etc.). Recent
studies confirm that side friction factors need to be lower for high-speed designs versus
low-speed ones.
Side Friction Design Factors
Speed Side Friction
Factor (mph) (f)
10 0.38
Low-Speed 20 0.26
Design 30 0.20
40 0.17
50 0.14
High-Speed 60 0.12
Design 70 0.10
80 0.08
Figure 3-6 from AASHTO�s �Green Book� shows the recommended side friction factors
for horizontal curve design with maximum values ranging from 0.14 (50 mph) to 0.08
(80 mph).
The level of lateral acceleration that causes drivers to avoid higher speeds is the key to
selecting maximum side friction factors.
NORMAL CROSS SLOPE

Roadway Horizontal Alignments
Copyright 2015 Gregory J. Taylor, P.E. Page 9 of 61
Roadway drainage determines the minimum rate of cross slope for the traveled way.
Acceptable minimum cross slope values range from 1.5 to 2.0 percent (with 2.0 typically
used for paved, uncurbed pavements) depending on the roadway type and weather
conditions.
MAXIMUM SUPERELEVATION RATES
No single maximum superelevation rate is universally applicable. In order to promote
design consistency, a maximum rate is desirable for locations with similar
characteristics (land usage, climate, etc.). This uniformity encompasses the roadway�s
alignment as well as its associated design elements and driver expectations. Consistent
designs are associated with lower workloads and crash frequencies.
Controls for Maximum Superelevation
Climate (amount of precipitation)
Terrain (flat, rolling, or mountainous)
Area type (rural or urban)
Slow-moving vehicles (frequency)
Eight percent (8%) is considered to be a reasonable maximum superelevation rate. The
highest superelevation rate for highways is typically 10 percent - rates greater than 12%
are considered beyond practical limits but may be used in some cases (i.e. low-volume
gravel roads for cross drainage).
Recommendations
� Several maximum superelevation rates should be used for design controls for
horizontal curves
� Do not exceed a rate of 12 percent
� Rates of 4 or 6 percent may be used for urban areas with few constraints
� Superelevation may be omitted on low-speed urban roads with severe
constraints

Roadway Horizontal Alignments
Copyright 2015 Gregory J. Taylor, P.E. Page 10 of 61
MINIMUM CURVATURE
The minimum radius for horizontal curves is a limiting value for design speeds based
on the maximum superelevation and maximum side friction factor. Actual design
values were developed from the laws of mechanics and depend on practical limits and
factors that were determined empirically. Sharper radii would require superelevation
above the limits for comfortable operation. The minimum radius values maintain a
margin of safety against vehicle rollover and skidding.
The �basic curve equation� governs vehicle operation on a horizontal curve.
The following equation can be used to calculate the minimum radius of curvature,
from the �simplified curve formula�.
rate of roadway superelevation (percent)
vehicle speed (feet/second)
gravitational constant (32.2 ft/sec²)
vehicle speed (mph)
radius of curve (feet)
=
maximum rate of roadway superelevation (percent)
vehicle speed (mph)
radius of curve (feet)

Roadway Horizontal Alignments
Copyright 2015 Gregory J. Taylor, P.E. Page 11 of 61
Horizontal curve equations utilize a radius measured to vehicle center of gravity (center
of inner travel lane). These equations neglect roadway width or horizontal control
location. The difference between the centerline and center of gravity is minor for two-
lane roadways � so this curve radius should be measured to the road�s centerline. GRADES
Motorists typically drive faster on downgrades versus upgrades for long or steep
roadway grades. Data has shown greater side friction demands on
downgrades � due to braking forces
and steep upgrades � from tractive forces.
For grades steeper than 5 percent, adjusting superelevation rates may be considered
since this is crucial to roadways with heavy truck volume or intermediate curves with
high levels of side friction. This adjustment may be done without reducing the design
speed for the upgrade. The proper speed variation depends on specific conditions
(grade rate, length, curve radius, etc.) compared to other curves on the roadway�s
approaches.
Additional superelevation for upgrades on two-lane and multilane undivided roads can
counter side friction loss due to tractive forces. This addition on long upgrades may
cause negative side friction for slow moving vehicles (heavy trucks, etc.) but may be
alleviated by slower speeds, more time for counter steering, and increased driver
experience/training.
For rural highways, urban freeways, and high speed urban streets, a balanced design of
superelevated, successive horizontal curves is desired to provide a smooth transition
with maximum side friction factors varying from 0.14 (50 mph) to 0.08 (80 mph).
On low-speed urban streets, superelevation on horizontal curves may be minimized or
eliminated with lateral forces being sustained by side friction only. Various factors that
may make superelevation unsuited for low-speed urban areas include:

Roadway Horizontal Alignments
Copyright 2015 Gregory J. Taylor, P.E. Page 12 of 61
� Wide pavement areas
� Need to meet adjacent property grades
� Surface drainage
� Low-speed operation concerns
� Intersection frequency
TURNING ROADWAYS
Turning roadways include interchanges (loop or diamond configurations with tangents
and curves) and intersections (diamond configurations with compound curves) for
right-turning vehicles.
The minimum radii for right-turning vehicles on turning roads must be measured from
the inner edge of the traveled way. The radius and superelevation are determined from
design speed and other values. Sharper curves with shorter lengths have a reduced
opportunity for larger superelevation rates. The desirable turning speed is the average
running speed of traffic approaching the turn. Maximum superelevation values should
be used on ramps to prevent skidding/overturning, when possible.
Compound curves can be used exclusively for turning roadways with design speeds of
45 mph or less. Higher design speeds make their use impractical due to the large
amounts of right-of-way required and should include a mixture of tangents and curves.
TRANSITION DESIGN CONTROLS
A number of factors determine horizontal curve safety, including

Roadway Horizontal Alignments
Copyright 2015 Gregory J. Taylor, P.E. Page 13 of 61
curve length radius spiral transitions roadway superelevation.
Since roadway crashes are more probable at curves with small radii or insufficient
superelevation, spiral transitions may be used to decrease these mishaps.
Horizontal alignment transition section designs include:
Superelevation transition
� transitions in the roadway cross slope
� consists of superelevation runoff section for outside-lane cross slope
changes (flat to full superelevation); and tangent runout section (normal to
flat)
Alignment transition
� transitional curves in the horizontal alignment
� spiral or compound curve may be used
� produces gradual change in roadway curvature
When both transition sections are used, these are integrated at the beginning and end of
the mainline circular curves.
There is no standard accepted empirical basis for determining runoff lengths.
Superelevation runoff lengths are mainly governed by appearance. Control runoff
lengths (100 to 650 ft range) are commonly determined as a function of the slope of the
outside edge of the traveled way relative to the roadway centerline profile.

Roadway Horizontal Alignments
Copyright 2015 Gregory J. Taylor, P.E. Page 14 of 61
TANGENT-TO-CURVE
TRANSITIONS �Tangent-to-curve� transitions are used for locations where roadway tangents directly
adjoin the main circular curve - without using transition curves. Superelevation runoff
is the length of roadway needed to transition the lane cross slope from flat to full
superelevation and conversely. This length should be based on a maximum acceptable
difference between the longitudinal grades of the axis of rotation (alignment centerline
or pavement reference lines) and the pavement edge. The grade difference (relative
gradient) should be limited to a maximum value of 0.50 percent or a longitudinal slope
of 1:200 at 50 mph. Greater slopes may be used for design speeds less than 50 mph.
Maximum relative gradients vary with design speed to provide shorter runoff lengths
at lower speed and longer lengths at higher speeds. Relative gradient values of 0.78 and
0.35 percent have been shown to provide adequate runoff lengths for 15 and 80 mph.
Maximum Relative Gradients
Design Maximum Relative Equivalent Speed Gradient Maximum (mph) (%) Relative Slope
20 0.74 1:135
30 0.66 1:152
40 0.58 1:172
50 0.50 1:200
60 0.45 1:222
70 0.40 1:250
80 0.35 1:286
Source: AASHTO �Green Book� Table 3-15
Roadway Horizontal Alignments
Copyright 2015 Gregory J. Taylor, P.E. Page 15 of 61
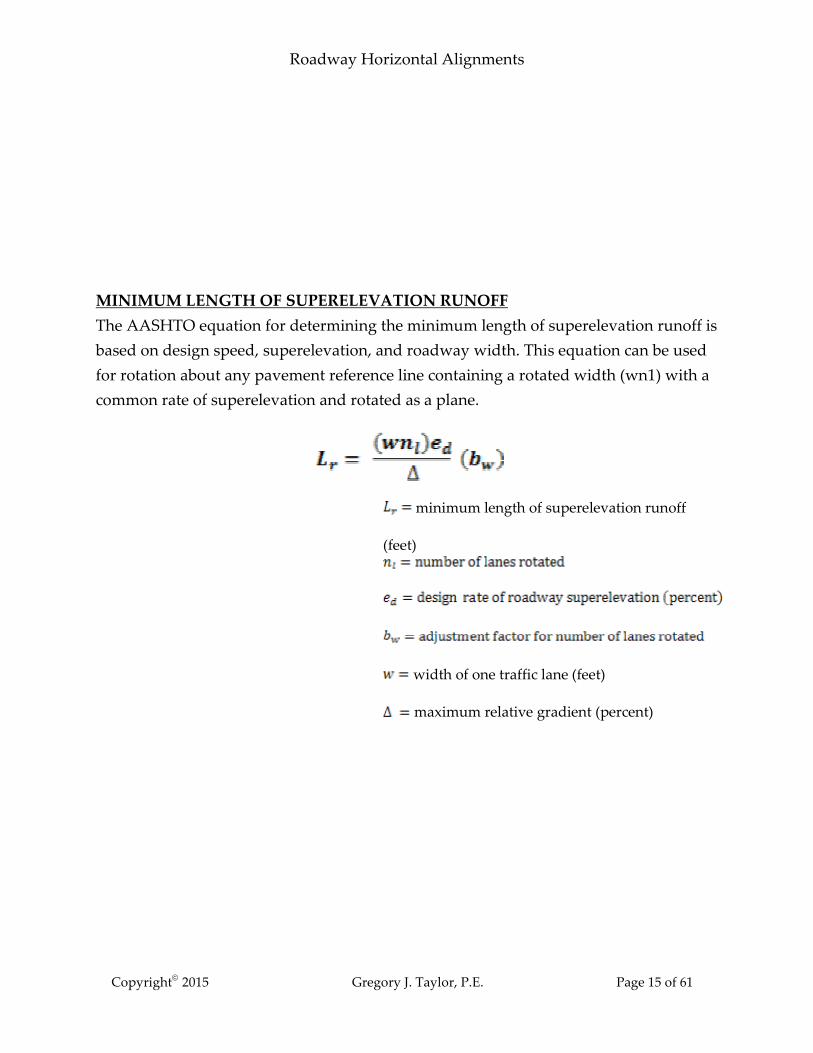
MINIMUM LENGTH OF SUPERELEVATION RUNOFF
The AASHTO equation for determining the minimum length of superelevation runoff is
based on design speed, superelevation, and roadway width. This equation can be used
for rotation about any pavement reference line containing a rotated width (wn1) with a
common rate of superelevation and rotated as a plane.
minimum length of superelevation runoff
(feet)
width of one traffic lane (feet)
maximum relative gradient (percent)

Roadway Horizontal Alignments
Copyright 2015 Gregory J. Taylor, P.E. Page 16 of 61
Adjustment Factor - No. of Lanes Rotated
Number of Adjustment Length Increase RelativeLanes Rotated Factor to One-Lane Rotated
1 1.00 1.001.5 0.83 1.252 0.75 1.50
2.5 0.70 1.753 0.67 2.00
3.5 0.64 2.25 Source: AASHTO �Green Book� Table 3-16
Tangent Runout Length Factors
Amount of adverse cross slope to be removed
Rate of removal
The removal rate needs to equal the relative gradient that defined the superelevation
runoff length in order to produce a smooth edge of pavement profile.

Roadway Horizontal Alignments
Copyright 2015 Gregory J. Taylor, P.E. Page 17 of 61
LOCATION WITH RESPECT TO END OF CURVE
Locating a curve�s superelevation runoff with respect to its Point of Curvature (PC) is
an important ingredient for tangent-to-curve design. The preferable method uses a
portion on the tangent since it minimizes peak lateral acceleration and side friction
demand, plus it is consistent with the natural spiral path during curve entry. A typical
superelevation runoff length is divided between the tangent and curve sections
(avoiding placement of the entire length in either section). The tangent proportion
normally varies from 60 to 80 percent � with most entities using 67 percent. Theoretical
factors indicate that tangent runoff length values of 70 to 90 percent produce the best
operating conditions with the specific value depending on design speed and rotated
width.
Runoff Locations that Minimize Lateral Motion
Design Runoff Located Prior to Curve
Speed No. of Lanes Rotated
(mph) 1.0 1.5 2.0 to 2.5 3.0 to 3.5
minimum length of tangent runoff (feet)
minimum length of superelevation runoff (feet)

Roadway Horizontal Alignments
Copyright 2015 Gregory J. Taylor, P.E. Page 18 of 61
15 to 45 0.80 0.85 0.90 0.90
50 to 80 0.70 0.75 0.80 0.85
Source: AASHTO �Green Book� Table 3-18
SPIRAL CURVES The average driver can follow a suitable transition path when entering or exiting a
circular horizontal curve and stay within normal lane limits. At locations with high
speeds and sharp curvature, the use of transition curves between the tangents and the
curves may make it easier for the vehicle to stay within its own lane.
Spiral curves are typically incorporated into horizontal alignments to transition from
normal tangent sections to full superelevation. Spiral radii decrease uniformly from
infinity (at the tangent) to that of the adjoining curve. By being more complex, spirals
provide excellent operational capabilities � especially for high speed alignments.
Uses of Spiral Transition Curves
Tangent with a circular curve
Tangent with a tangent (double spiral)
Circular curve with a circular curve

Roadway Horizontal Alignments
Copyright 2015 Gregory J. Taylor, P.E. Page 19 of 61
and compound or reverse curves
Advantages of Transition Curves
Natural easy-to-follow driving
Lateral force increases and decreases gradually
Minimizes adjoining lane encroachment
Promotes uniform speeds
Suitable location for superelevation runoff
Fits speed-radius relationship for vehicles
Facilitates traveled way width transition
Provides flexibility for width transitions on sharp circular curves
Enhances roadway appearance
Avoids perceived breaks in the horizontal alignment

Roadway Horizontal Alignments
Copyright 2015 Gregory J. Taylor, P.E. Page 20 of 61
LENGTH OF SPIRAL
In 1909, W.H. Short developed an equation using lateral acceleration on railroad curves.
This basic equation is used by some agencies for calculating the minimum length of a
spiral curve. The minimum length of a spiral curve may be determined from the
following AASHTO formula.
rate of increase of lateral acceleration (ft/sec³)
vehicle speed (mph)
radius of curve (feet)

Roadway Horizontal Alignments
Copyright 2015 Gregory J. Taylor, P.E. Page 21 of 61
The C-factor represents comfort and safety levels and normally ranges from 1 to 3 ft/sec³
for highways. Equations modified for superelevation produce shorter spiral curve lengths.
AASHTO states that a more realistic method is to set the spiral length equal to the
superelevation runoff.
MAXIMUM SPIRAL RADIUS
Present guidance regarding spiral curves indicates that an upper radius limit can be
used � with radii below this value having safety and operational benefits from using
spirals. Minimum lateral acceleration rates of 1.3 to 4.25 ft/s² have been used to establish
limiting radii. The higher rates correspond to the maximum radius with a reduction in
crash potential. AASHTO recommends that the maximum spiral radius should be based
on a minimum lateral acceleration rate of 4.25 ft/s². This produces a range of values
(Table 3-20) such as:
Design Speed Maximum Radius
15 mph 114 feet
to to
80 mph 3238 feet
MINIMUM SPIRAL LENGTH
Spiral curve length is a crucial design control for horizontal alignments. Driver comfort
and lateral vehicle shift are the major considerations used to define the minimum length
of spiral curve. Criteria that address driver comfort help produce an easy increase in
lateral acceleration upon spiral curve entry. Considerations for lateral shifting are
meant to create a spiral that can handle a shift in vehicle lateral position within the
travel lane that is consistent with its natural spiral path. AASHTO Equations 3-26 and 3-
27 illustrate these relationships.

Roadway Horizontal Alignments
Copyright 2015 Gregory J. Taylor, P.E. Page 22 of 61
or
The standard value for is typical for natural steering behavior. Using lower values
for and will create longer, easier spiral lengths that will not exhibit the minimum
lengths associated with driver comfort.
MAXIMUM LENGTH OF SPIRAL
A conservative maximum length of spiral transition curve needs to be determined in
order to prevent violating driver expectations about the sharpness of upcoming curves.
AASHTO Equation 3-28 produces appropriate values for maximum spiral lengths with
the following formula:
maximum rate of change in lateral acceleration (4 ft/sec²)
vehicle speed (mph)
radius of curve (feet)

Roadway Horizontal Alignments
Copyright 2015 Gregory J. Taylor, P.E. Page 23 of 61
The recommended value of 3.3 feet is consistent with the maximum lateral shift
plus it balances spiral length and curve radius values. DESIRABLE LENGTH OF SPIRAL
Research has proven that optimal conditions occur when spiral curve lengths are equal
to the natural spiral path lengths of vehicles. Length differences produced operational
problems involving large lateral velocities or shifts at the end of the transition.
AASHTO Table 3-21 provides a table of desirable lengths of spiral that correspond to
2.0 seconds of travel time (for natural spiral paths). If the desirable spiral value is less
than the calculated minimum spiral curve length � use the minimum length for design.
Design Speed Spiral Length
15 mph 44 feet
to to
80 mph 235 feet
LENGTH OF SUPERELEVATION RUNOFF
While it is recommended that superelevation runoffs occur over the spiral length,
calculated runoff lengths and lengths of spiral are not significantly different. Lengths of
superelevation runoff apply to superelevated curves and are recommended when
determining minimum spiral lengths � the spiral length should be set equal to the
runoff length. By transitioning the superelevation over the spiral length, full
superelevation is contained within the whole circular curve. However, a result of
equating the runoff and spiral lengths is a resulting relative gradient that exceeds
AASHTO�s maximum relative gradients.
radius of circular curve (feet)

Roadway Horizontal Alignments
Copyright 2015 Gregory J. Taylor, P.E. Page 24 of 61
LENGTH OF TANGENT RUNOFF
Tangent runout lengths for spirals are akin to the designs for tangent-to-curve
transitions. The preferred design contains a smooth pavement edge profile with a
common edge slope gradient throughout the superelevation runout and runoff sections.
AASHTO Equation 3-29 presents a computation method for tangent runout lengths.
The �Green Book� also provides a table (Table 3-23) for tangent runout lengths.
LOCATION WITH RESPECT TO END OF CURVE
The superelevation runoff is accomplished over the whole spiral transition and should
be equal for both the tangent-to-spiral (TS) and spiral-to-curve (SC) transitions. The
spiral curve and superelevation runoff are equivalent with the roadway rotated to full
superelevation at the SC, and reversed when leaving the curve. The whole circular
curve contains the full superelevation.
METHODS OF ATTAINING SUPERELEVATION
Revolving traveled way with normal cross slopes about centerline profile
Most widely used method due to its reduced distortion involving a change in
elevation of the edge of the traveled way. One-half of the elevation change is
made at each edge.
length of tangent runoff (feet)
length of spiral curve (feet)

Roadway Horizontal Alignments
Copyright 2015 Gregory J. Taylor, P.E. Page 25 of 61
Revolving traveled way with normal cross slopes about inside-edge profile
The inside-edge profile is parallel to the profile reference line. The actual
centerline profile is raised with respect to the inside-edge profile to create one-
half of the elevation change. The other half is made by raising the outside edge
profile an equal amount (with respect to actual centerline).
Revolving traveled way with normal cross slopes about outside-edge profile
Similar to inside-edge method except the elevation change occurs below the
outside-edge profile.
Revolving traveled way with straight cross slopes about outside-edge profile
Often used for two-lane one-way roads where the axis of rotation coincides with
the edge of traveled way adjacent to the median.
The centerline profile�s shape and direction can influence the method for attaining
superelevation. Each transition section should be evaluated individually to produce the
most pleasing and functional results. The following figures illustrate these different
superelevation methods for a curve veering to the right.

Roadway Horizontal Alignments
Copyright 2015 Gregory J. Taylor, P.E. Page 26 of 61
Roadway Horizontal Alignments
Copyright 2015 Gregory J. Taylor, P.E. Page 27 of 61
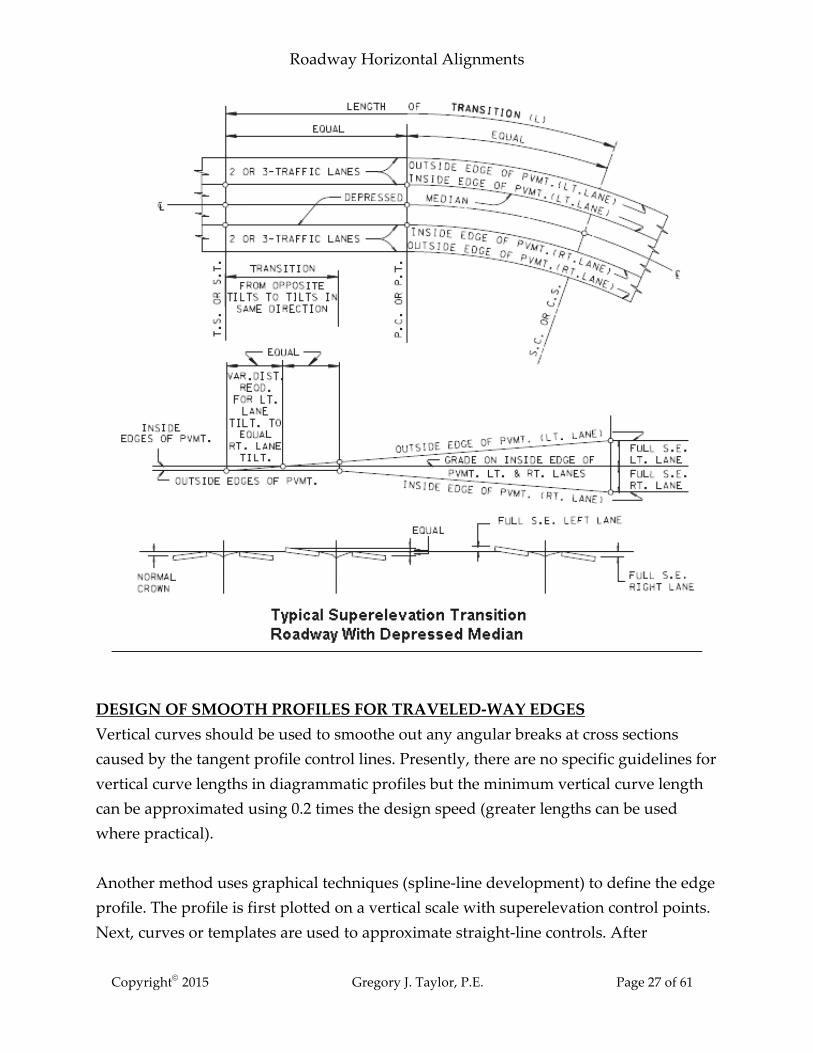
DESIGN OF SMOOTH PROFILES FOR TRAVELED-WAY EDGES
Vertical curves should be used to smoothe out any angular breaks at cross sections
caused by the tangent profile control lines. Presently, there are no specific guidelines for
vertical curve lengths in diagrammatic profiles but the minimum vertical curve length
can be approximated using 0.2 times the design speed (greater lengths can be used
where practical).
Another method uses graphical techniques (spline-line development) to define the edge
profile. The profile is first plotted on a vertical scale with superelevation control points.
Next, curves or templates are used to approximate straight-line controls. After

Roadway Horizontal Alignments
Copyright 2015 Gregory J. Taylor, P.E. Page 28 of 61
smoothing is completed, elevations can then be read properly. This method offers
infinite alternatives with minimal labor.
Divided roadways need greater emphasis in their design and appearance due to their
heavier traffic volumes. Therefore, the use of smooth profiles for divided highway
traveled-way edges is warranted more than those for two-lane roads.
AXIS OF ROTATION WITH A MEDIAN
The addition of a roadway median impacts superelevation transition designs due to the
location for the axis of rotation. These locations are dependent on median width and
cross-section which are described in the following common combinations:
Case I - Traveled way (with median) superelevated as a plane section
Limited to narrow medians and moderate superelevation to avoid
major elevation differences (edges of traveled way)
Median width: 15 feet or less
Length of runoff is based on total rotated width (including median)
Median widths 10 feet or less may be deleted from runoff length
since narrow medians have little effect
Case II - Median as a horizontal plane with the two traveled ways rotated separately
about median edges
Suitable median widths: 15 to 60 feet
Usually used for roadways rotated about median-edge of
pavement
Medians widths 10 feet or less may have runoff lengths the same as
single undivided roads
Case III - Two traveled ways treated separate for runoff
Produces variable difference in median edge elevations
Wide median widths: 60 feet or more
Profiles and superelevation transition designed separately for two
roadways

Roadway Horizontal Alignments
Copyright 2015 Gregory J. Taylor, P.E. Page 29 of 61
MINIMUM TRANSITION GRADES
There are two types of drainage problems for pavement surfaces in superelevation
transition sections.
1) Potential lack of adequate longitudinal grade
Grade axis of rotation is equal (but opposite sign) to effective relative
gradient
Results in pavement edge with negligible longitudinal grade and poor
surface drainage
2) Inadequate lateral drainage
Due to negligible cross slope during pavement rotation
Length of transition includes tangent runout and equal runoff sections
that may not drain pavement laterally
Potential drainage problems may be alleviated using the following techniques:
o Maintaining a minimum vertical grade of 0.5% through the transition
o Maintaining minimum edge-of-pavement grades of 0.2% (0.5% curbed streets)
through the transition
TURNING ROADWAY CURVES
Drivers naturally follow transitional travel paths when turning at interchange ramps
and intersections (or on open roadways). Facilities not following natural transition
paths may result in drivers deviating from the intended path and encroaching on other
traffic lanes. The best ways to accommodate natural travel paths is by using transition
curves - either between two circular arcs, or between a tangent and circular curve.

Roadway Horizontal Alignments
Copyright 2015 Gregory J. Taylor, P.E. Page 30 of 61
Spiral lengths for intersection curves are determined using the same method as for open
roadways. Intersection curve lengths may be less than highway curves since motorists
accept quicker changes in travel direction at intersections.
The minimum spiral lengths for minimum-radius curves are determined by design
speed. AASHTO Table 3-24 shows values ranging from:
Design Speed Design Minimum Speed Length
20 mph 70 feet
to to
45 mph 200 feet
COMPOUND CIRCULAR CURVES
Compound circular curves can be used to produce effective turning roadway
geometries for intersection and interchanges. For locations where circular arcs with
different radii are connected, the following ratios are generally acceptable:
Compound Curve Location Flatter Radius to Sharper Radius Ratio
Open highways 1.5:1
Intersections/Turning roadways 2:1 (satisfactory operation & appearance)
Smaller curve radii differential is preferred where practical � with a desirable maximum
value of 1.75:1. If the ratio is greater than 2:1, a suitable intermediate spiral/arc should
be used between the two curves. Do not use this ratio control for very sharp curves
designed for minimum vehicle turning paths. Higher ratios may be needed for
compound curves that closely fit the design vehicle path. Each curve length should be
adequate for reasonable driver deceleration.
AASHTO Table 3-25 provides circular arc lengths for compound intersection curves.
These values assumed a deceleration rate of 3 mph/s with a desirable minimum
deceleration of 2 mph/s (very light braking).

Roadway Horizontal Alignments
Copyright 2015 Gregory J. Taylor, P.E. Page 31 of 61
OFFTRACKING Offtracking occurs when a vehicle�s rear wheels do not follow the exact path as its front
wheels when negotiating a horizontal curve or turn. This is dependent on curve/turning
radii, articulation points, and vehicle wheelbase lengths.
Situation Result
Curve without superelevation (low speed) Rear wheels track inside front wheels
Superelevated curve Rear wheels may track inside front
wheels (more or less)
High speeds Rear wheels may track outside front
wheels
Offtracking is more pronounced for larger design vehicles and emphasizes the amount
of widening needed on horizontal curves. This widening increases with the size of the
design vehicle and decreases with increasing curve radii.
The amount of widening on horizontal curves for offtracking depends on curve radius
design vehicle characteristics:
Width of inner lane vehicle front overhang

Roadway Horizontal Alignments
Copyright 2015 Gregory J. Taylor, P.E. Page 32 of 61
Rear overhang width
Track width for passing
Lateral vehicle clearance
Curve difficulty allowance width
TRAVELED-WAY WIDENING ON
HORIZONTAL CURVES Often, traveled ways on horizontal curves may need to be widened to produce
operational characteristics that are similar to tangent sections. While the need for
widening on modern highways is less than that for past roadways, there are some cases
where speed, curvature, or width may require appropriate traveled way widening.
Primary Reasons for Widening on Curves
Design vehicle off tracks when negotiating curve
Driver difficulty in remaining in center of the lane
AASHTO Equation 3-34 calculates the amount of traveled way widening for horizontal
curves by using the difference between the width needed on the curve and the tangent
width. The needed curve width has several variables: track width for passing/meeting

Roadway Horizontal Alignments
Copyright 2015 Gregory J. Taylor, P.E. Page 33 of 61
vehicles; lateral vehicle clearance; width of inner lane vehicle front overhang; curve
difficulty allowance width.
In most cases, the design vehicle is a truck (typically WB-62) since off tracking is much
greater for heavy vehicles versus passenger cars.
Since sight distance can be restricted when meeting opposing vehicles on curved two-
way roads, widening procedures for two-lane, one-way traveled way (divided
highway) should be similar to those for two-lane, two-way roadways.
Any widening for horizontal curves should transition gradually on the approaches to
align traveled way edges and vehicle paths. AASHTO Equation 3-35 provides values
for the width of traveled way on curves.
Curve Widening Design Concerns
o Widen only the inside edge of traveled way for simple curves
o Widen on the inside edge or equally divided from the centerline for spirals
o Transition gradually over the length (typically 100 to 200 ft) to make all traveled
way fully usable
o Avoid tangent transition edges � no angular breaks at pavement edges
o One-half to two-thirds transition length should be along tangent sections for
roads without spirals
o Width increases should be distributed along the spiral length for highways with
spirals
o Fully detail widening areas on construction plans
Factors for determining turning roadway widths at intersections include:
� Expected speed
� Curve radius: combined with design vehicle track width determine turning
roadway width
� Types of vehicles: size and frequency of users or expected users
Turning roadways are classified operationally as:

Roadway Horizontal Alignments
Copyright 2015 Gregory J. Taylor, P.E. Page 34 of 61
One-lane (with or without passing opportunities)
Or two-lane (one-way or two-way)
Design Methods for Turning Roadways
Case I One-lane, one-way operation
No passing stalled vehicles provision
For minor turning movements, moderate turning volumes, short
connecting roadway
Remote chance of vehicle breakdown
Preferable sloping curb or flush edge of traveled way
Case II One-lane, one-way operation
Contains passing provision for stalled vehicles
Low speeds with adequate passing clearance
Sufficient widths for all turning movements of moderate to heavy
traffic volumes within capacity of single-lane connection
For breakdowns, low traffic can be maintained Case III Two-lane operation, either one or two-way
Two lanes necessary for traffic volume
Since precise data regarding traffic volumes for each vehicle type is not readily
available, traffic conditions used to define turning roadway widths are described in
broad terms.
Traffic Conditions for Turning Roadway Widths
Traffic Condition A Predominantly Passenger Car (P) vehicles
Some Single-Unit Trucks (SU-30)
Small volume of trucks with occasional large truck
Traffic Condition B Majority of Single-Unit Trucks (SU-30)

Roadway Horizontal Alignments
Copyright 2015 Gregory J. Taylor, P.E. Page 35 of 61
Some tractor- semitrailer combination trucks (WB-40)
Moderate volume of trucks - 5 to 10%
Traffic Condition C Predominantly tractor-semitrailer combo (WB-40)
More and larger trucks
Widths for turning roadways include shoulders or lateral clearance outside the traveled
way. Shoulder widths may vary from none (curbed urban streets) to open-highway
cross-section.
Usable Shoulder Widths or Lateral Clearances Outside of Turning Roadways
Shoulder Width or
Turning Roadway Condition Lateral Clearance
Left Right
Short length and/or channelized intersection 2 to 4 ft 2 to 4 ft
Intermediate to long length or in cut/fill section 4 to 10 ft 6 to 12 ft Source: AASHTO �Green
Book� Table 3-30
For roadways without curbs or with sloping curbs, adjacent shoulders should match the
type and cross section of the approaches.
If roadside barriers are present, shoulder widths should be measured to the face of
barrier with a graded width of 2.0 feet.
For other than low-volume roadways, right shoulders should be stabilized a minimum
of 4.0 feet.
SIGHT DISTANCE
Roadway Horizontal Alignments
Copyright 2015 Gregory J. Taylor, P.E. Page 36 of 61
Sight distance is the length or distance of roadway visible to the driver. This is a major
design control for vertical alignments and is essential for the safe and efficient operation
of vehicles. This distance is dependent on the driver�s eye height, the specified object
height, and the height/position of sight obstructions. The three-dimensional features of
the roadway should provide a minimum sight line for safe operations.
Sight Distance Criteria
Height of Driver�s Eye: 3.50 feet above road surface (passenger vehicles)
7.60 feet above road surface (trucks)
Height of Object: 2.00 feet above road surface (stopping & decision)
3.50 feet above road surface (passing & intersection)
Due to differences in driver needs, various types of sight distance apply to geometric
design Stopping,
Decision,
Passing,
and Intersection.
STOPPING SIGHT DISTANCE (SSD)
Stopping sight distance is considered to be the most basic form of sight distance. This
distance is the length of roadway needed for a vehicle traveling at design speed to stop
before reaching a stationary object in the road. Ideally, all of the roadway should
provide stopping sight distance consistent with its design speed. However, this distance
can be affected by both horizontal and vertical geometric features.
Stopping sight distance is composed of two distances:
(1) Brake Reaction Time starts upon driver recognition of a roadway obstacle until
application of the vehicle�s brakes. Typically, the driver not only needs to see the
Roadway Horizontal Alignments
Copyright 2015 Gregory J. Taylor, P.E. Page 37 of 61
object but also recognize it as a potential hazard. The time required to make this
determination can widely vary based on the object�s distance, visibility, roadway
conditions, vehicle speed, type of obstacle, etc.
Perception → Braking
From various studies, it was shown that the required brake reaction time needed to
be long enough to encompass the majority of driver reaction times under most
roadway conditions. A brake reaction time of 2.5 seconds met the capabilities of
most drivers � including older drivers.
The recommended brake reaction time of 2.5 seconds exceeds the 90th percentile of
driver reaction time and is considered adequate for typical roadway conditions � but
not for most complex driving conditions that may be encountered.
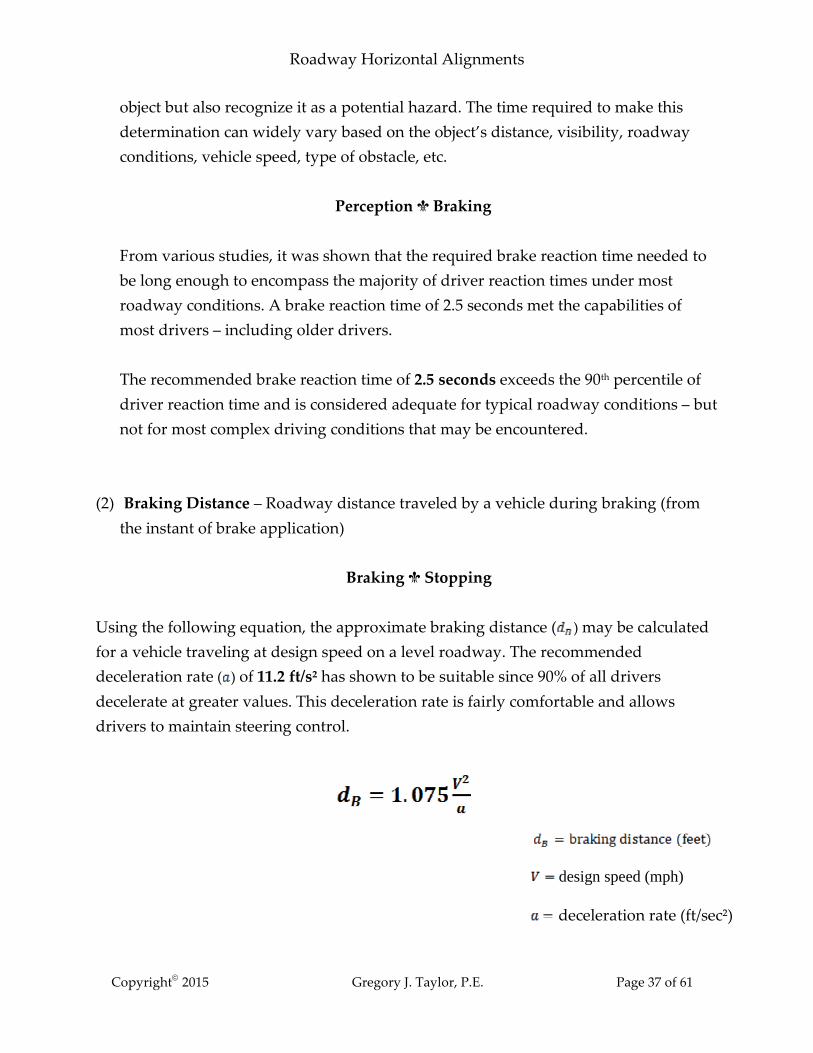
(2) Braking Distance � Roadway distance traveled by a vehicle during braking (from
the instant of brake application)
Braking → Stopping
Using the following equation, the approximate braking distance ( ) may be calculated
for a vehicle traveling at design speed on a level roadway. The recommended
deceleration rate ( ) of 11.2 ft/s² has shown to be suitable since 90% of all drivers
decelerate at greater values. This deceleration rate is fairly comfortable and allows
drivers to maintain steering control.
design speed (mph)
deceleration rate (ft/sec²)
Roadway Horizontal Alignments
Copyright 2015 Gregory J. Taylor, P.E. Page 38 of 61
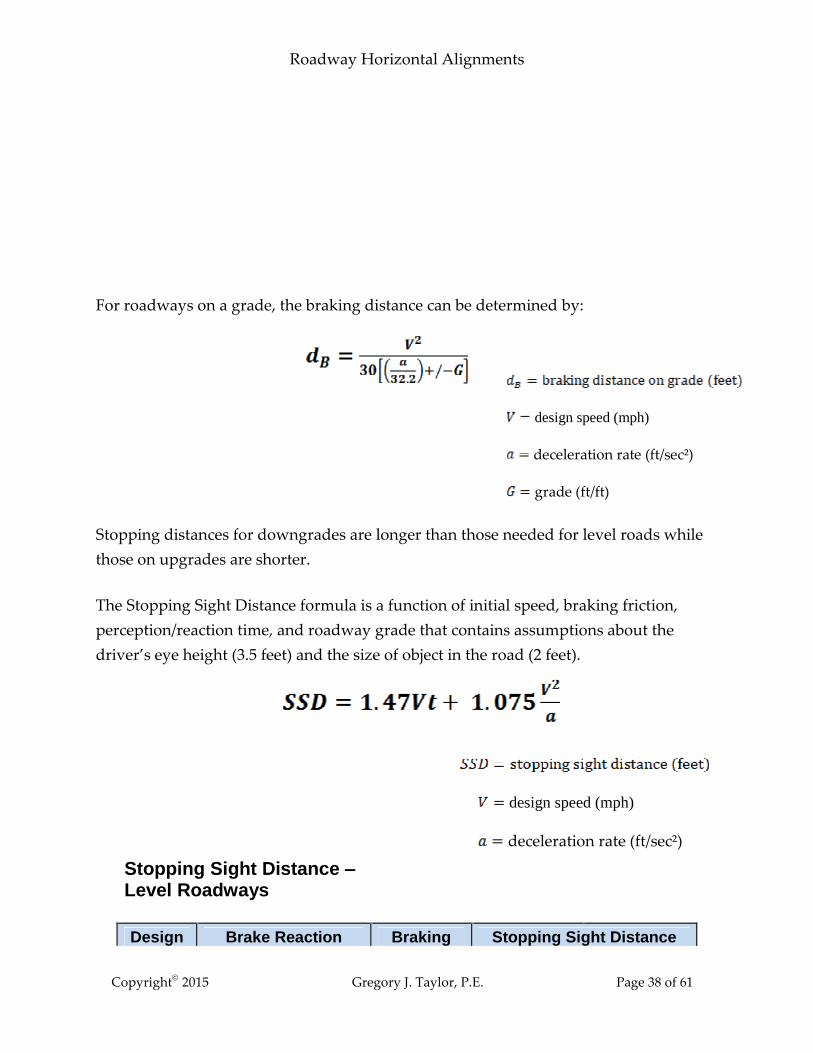
For roadways on a grade, the braking distance can be determined by:
Stopping distances for downgrades are longer than those needed for level roads while
those on upgrades are shorter.
The Stopping Sight Distance formula is a function of initial speed, braking friction,
perception/reaction time, and roadway grade that contains assumptions about the
driver�s eye height (3.5 feet) and the size of object in the road (2 feet).
Stopping Sight Distance � Level Roadways
Design Brake Reaction Braking Stopping Sight Distance
design speed (mph)
deceleration rate (ft/sec²)
grade (ft/ft)
design speed (mph)
deceleration rate (ft/sec²)

Roadway Horizontal Alignments
Copyright 2015 Gregory J. Taylor, P.E. Page 39 of 61
Speed Distance Distance Calculated Design (mph) (ft) (ft) (ft) (ft)
20 73.5 38.4 111.9 115 30 110.3 86.4 196.7 200 40 147.0 153.6 300.6 305 50 183.8 240.0 423.8 425 60 220.5 345.5 566.0 570 70 257.3 470.3 727.6 730
80 294.0 614.3 908.3 910
Source: AASHTO �Green Book� Table
3-1
Limitations of the AASHTO Model
Does not fully account for heavy vehicles (longer stopping times)
Does not differentiate between various highway types
Does not recognize differing roadway conditions
Proper roadway design should address these variables by providing more than
minimum stopping sight distance at locations with vehicle conflicts or hazardous
conditions (sharp curves, cross-section changes, intersections, etc.).
DECISION SIGHT DISTANCE (DSD)
Certain situations requiring complex decisions or maneuvers (unexpected conflicts,
navigational needs, roadway changes, etc.) can place extra demands on drivers. These
circumstances usually require longer sight distances than those for stopping.
Decision sight distance recognizes these needs and is composed of the following
required actions:
Detect unexpected/unusual conflict
Recognize potential risk
Select appropriate speed /path
Initiate and complete safe maneuver

Roadway Horizontal Alignments
Copyright 2015 Gregory J. Taylor, P.E. Page 40 of 61
Decision sight distance values are substantially greater than those for Stopping Sight
Distance since DSD provides an additional margin of error and sufficient maneuver
length at vehicle speeds � rather than just stopping.
Decision sight distance is needed for a variety of roadway environments � such as
bridges, alignment changes, interchanges, intersections, lane drops, congested
intersections, median crossovers, roadway cross-section changes, toll facilities, and
unusual geometric configurations.
DSD values depend on whether the roadway�s location is rural or urban, and the type
of avoidance maneuver required.
Avoidance Maneuver Condition Time (sec)
A Stop on rural road 3.0
B Stop on urban road 9.1
C Change on rural road 10.2 to 11.2
D Change on suburban road 12.1 to 12.9
E Change on urban road 14.0 to 14.5
The �Green Book� provides tabular decision sight distances to provide appropriate
values for critical locations, and to furnish suitable evaluation criteria of available sight
distances. Critical decision points need to have sufficient DSD.
Decision Sight Distance
Design Decision Sight Distance (ft)
Speed Avoidance Maneuver
(mph) A B C D E

Roadway Horizontal Alignments
Copyright 2015 Gregory J. Taylor, P.E. Page 41 of 61
30 220 490 450 535 620
40 330 690 600 715 825
50 465 910 750 890 1030
60 610 1150 990 1125 1280
70 780 1410 1105 1275 1445
80 970 1685 1260 1455 1650
Source: AASHTO �Green Book� Table 3-3
The pre-maneuver time for avoidance maneuvers is greater than the brake reaction time
for Stopping Sight Distance. This gives drivers extra time to recognize the situation,
identify alternatives, and initiate a response. DSD pre-maneuver components typically
range from 3.0 to 9.1 seconds.
For Avoidance Maneuvers A and B, the braking distance (for design speed) was added
to the pre-maneuver component. Decision sight distances for Avoidance Maneuvers A
and B can be calculated using the following formula:
For Avoidance Maneuvers C thru E, the braking component is replaced with maneuver
distance based on times (3.5 to 4.5 seconds) that decrease with increasing speed.
Decision sight distances for Avoidance Maneuvers C, D, and E can be calculated from
the following equation:
design speed (mph)
driver deceleration rate (ft/sec²)
pre-maneuver time (seconds)
design speed (mph)
total pre-maneuver and maneuver time (seconds)

Roadway Horizontal Alignments
Copyright 2015 Gregory J. Taylor, P.E. Page 42 of 61
PASSING SIGHT DISTANCE
Passing sight distance is the length of roadway needed for drivers on two-lane two-way
highways to pass slower vehicles without meeting opposing traffic.
Passing Sight Distance Definitions
Vertical Curve Distance where an object (3.5 ft above roadway surface) can be seen
from a point 3.5 ft above the roadway
Horizontal Curve Distance measured (along center line or right-hand lane line for
3-lane roadway) between two points 3.5 ft above the roadway on a
tangent line

Roadway Horizontal Alignments
Copyright 2015 Gregory J. Taylor, P.E. Page 43 of 61

Roadway Horizontal Alignments
Copyright 2015 Gregory J. Taylor, P.E. Page 44 of 61
The following table shows design values for passing sight distance on two-lane
highways. It has been shown that more sight distance is needed for passing maneuvers
than for stopping sight distance which is continuously provided for along roadways.
Passing Sight Distance - Two-Lane Roadways
Design Assumed Speed (mph) Passing Sight Speed Passed Passing Distance (mph) Vehicle Vehicle (ft)
20 8 20 400
30 18 30 500
40 28 40 600
50 38 50 800
60 48 60 1000
70 58 70 1200
80 68 80 1400
Source: AASHTO �Green Book� Table 3-4
Potential passing conflicts are ultimately determined by driver responses to:
View of roadway ahead
Passing and no-passing zone markings
Horizontal alignment is also crucial to determine the location, extent, and percentage of
passing distances. More sight distance is required for passing maneuvers than for
stopping sight distance which is continuously provided along roadways.
Minimum values for passing sight distances are based on Manual on Uniform Traffic
Control Devices (MUTCD) warrants for no-passing zones on two-lane highways. These
values are suitable for single or isolated passes only.
Driver Behavior Assumptions
Passing and opposing vehicle speeds are equal to the roadway design speed
Speed differential between passing and passed vehicle is 12 mph

Roadway Horizontal Alignments
Copyright 2015 Gregory J. Taylor, P.E. Page 45 of 61
Passing vehicle has adequate acceleration capability to reach speed differential
(40% of way through passing maneuver)
Vehicle lengths are 19 feet
Passing driver�s perception-reaction time to abort passing maneuver is 1 second
Deceleration rate of 11.2 ft/s² for passing vehicle when passing maneuver is
aborted
Space headway between passing and passed vehicles is 1 second
Minimum clearance between passing and opposed vehicles upon return to
normal lane is 1 second
Design passing sight values should also be based on a single passenger vehicle passing
another single passenger vehicle.
Passing sight distances should be should be as long and frequent as possible, and equal
or greater than the minimum values, depending on:
topography
design speed
cost
intersection spacing
While passing sections are used on most highways and selected streets, others can
usually be provided at little or no additional cost.
Comparison of Sight Distance Design Values
Design Passing Sight Stopping Sight Speed Distance Distance
(mph) (ft) (ft)
20 400 115 30 500 200 40 600 305
50 800 425 60 1000 570 70 1200 730

Roadway Horizontal Alignments
Copyright 2015 Gregory J. Taylor, P.E. Page 46 of 61
80 1400 910 Source: AASHTO �Green Book� Figure 3-1
INTERSECTION SIGHT DISTANCE
The potential for vehicular conflicts at intersections can be greatly reduced with proper
sight distances and traffic control. Intersection efficiency depends on driver behavior �
judgment, capability, and response. Approaching drivers need an unobstructed view of
the intersection and approaching roadways to safely maneuver through the facility.
Intersection sight distance is the length of roadway along the intersecting road that the
approaching vehicle should have to perceive and react to potential conflicts. Both
roadway horizontal and vertical geometry can have a great effect on ISD.
Sight distance is needed to allow stopped vehicles a sufficient view of the intersecting
roadway in order to enter or cross it. Intersection sight distances that exceed stopping
sight distances along major roads are considered sufficient to anticipate and avoid
conflicts. Intersection sight distance determination is based on many of the same
principles as stopping sight distance.

Roadway Horizontal Alignments
Copyright 2015 Gregory J. Taylor, P.E. Page 47 of 61
Source: CTRE � Iowa State University
Clear sight triangles are areas along intersection approach legs that should be without
any obstructions that could obscure any potential conflicts from the driver�s view. For
sight obstruction determination, the driver�s eye is assumed to be 3.50 feet above the
road surface, and the visible object is 3.50 feet above the intersecting road�s surface. The
dimensions are based on driver behavior, roadway design speeds, and type of traffic
control. Object height is based on vehicle height of 4.35 feet (15th percentile of current
passenger vehicle height minus an allowance of 10 inches).

Roadway Horizontal Alignments
Copyright 2015 Gregory J. Taylor, P.E. Page 48 of 61
Source: CTRE � Iowa State University
Approach sight triangles are triangular areas free of obstructions that could block
approaching a motorist�s view of potential conflicts. Lengths of the area legs should
permit drivers to observe any potential conflicts and slow, stop, or avoid other vehicles
within the intersection. These types of sight triangles are not needed for intersections
controlled by stop signs or traffic signals.
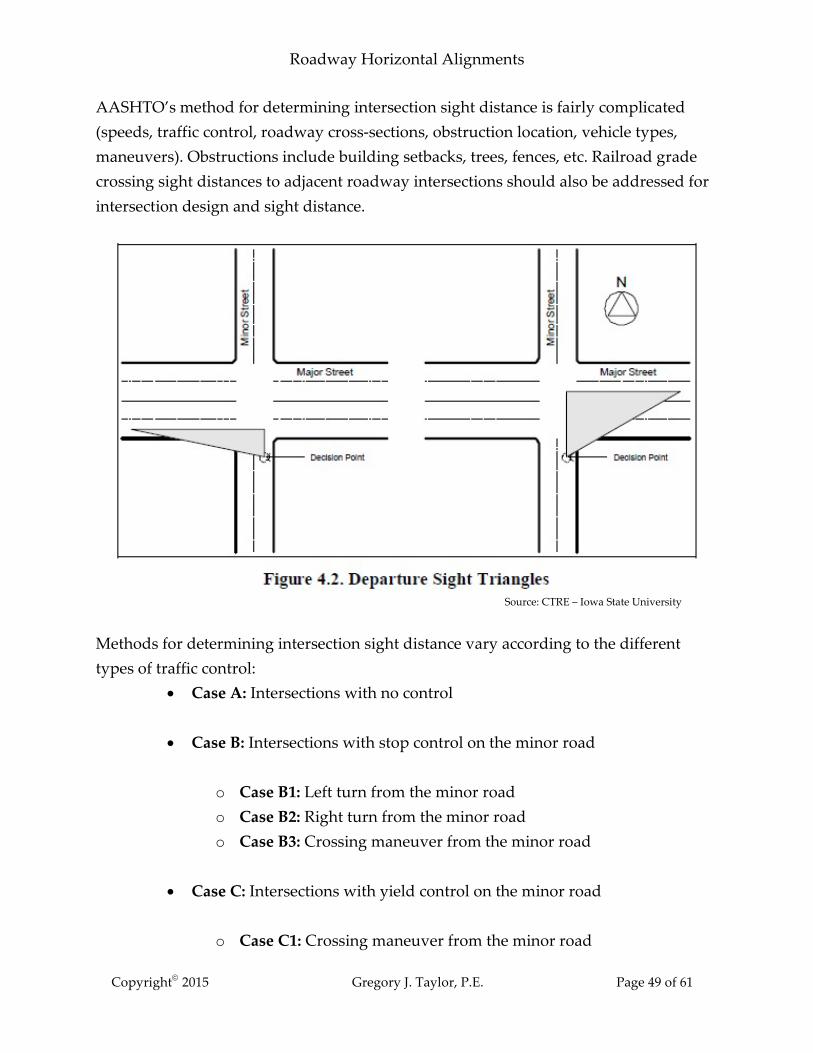
Departure sight triangles provide adequate distance for stopped drivers on minor
roads to depart the intersection and enter/cross the major road. These sight triangles are
needed for quadrants of each intersection approach controlled by stop or yield
conditions.
design speed of major road (mph)
time gap for minor road vehicle to enter major road
(seconds)
Roadway Horizontal Alignments
Copyright 2015 Gregory J. Taylor, P.E. Page 49 of 61
AASHTO�s method for determining intersection sight distance is fairly complicated
(speeds, traffic control, roadway cross-sections, obstruction location, vehicle types,
maneuvers). Obstructions include building setbacks, trees, fences, etc. Railroad grade
crossing sight distances to adjacent roadway intersections should also be addressed for
intersection design and sight distance.
Source: CTRE � Iowa State University
Methods for determining intersection sight distance vary according to the different
types of traffic control:
Case A: Intersections with no control
Case B: Intersections with stop control on the minor road
o Case B1: Left turn from the minor road
o Case B2: Right turn from the minor road
o Case B3: Crossing maneuver from the minor road
Case C: Intersections with yield control on the minor road
o Case C1: Crossing maneuver from the minor road
Roadway Horizontal Alignments
Copyright 2015 Gregory J. Taylor, P.E. Page 50 of 61
o Case C2: Left or right turn from the minor road
Case D: Intersections with traffic signal control
Case E: Intersections with all-way stop control
Case F: Left turns from the major road
Sight distance across the inside of curves is a crucial design control for horizontal
alignments. Due to various concerns (alignments, cross-sections, obstructions, etc.),
specific study is needed for each curve and adjustments made to provide sufficient sight
distance.
For horizontal alignments, the sight line is a chord of the curve as shown below. The
stopping sight distance is along the centerline of the curve�s inside lane.

Roadway Horizontal Alignments
Copyright 2015 Gregory J. Taylor, P.E. Page 51 of 61
AASHTO Equation 3-36 is suitable for circular curve lengths greater than the sight
distance for the design speed.
Eye Height: 3.50 feet
Object Height: 2.00 feet Stopping sight distance
2.75 feet Midpoint of sight line where cut slope obstructs sight
radius of curve (feet)

Roadway Horizontal Alignments
Copyright 2015 Gregory J. Taylor, P.E. Page 52 of 61
The following alternatives may be considered where adequate stopping sight distance is
not available:
Increase offset to sight obstructions
Increase curve radii
Reduce design speed
Minimum passing sight distance values (two-lane road) are approximately twice those
for the minimum stopping sight distance. Due to differences in sight line and stopping
sight distance, design for passing sight distance should be limited to flat curves and
tangents.
GENERAL CONTROLS
Any roadway alignment should be directional as possible.
The horizontal alignment should be consistent with the topography and minimize
any adverse impacts. Alignments consisting of short curves should be avoided since
this may lead to erratic driving. Flowing centerlines that conform to the site�s
natural contours is generally preferable.

Roadway Horizontal Alignments
Copyright 2015 Gregory J. Taylor, P.E. Page 53 of 61
Avoid minimum radius values whenever possible.
The central angle of all curves should be as small as practical to maximize roadway
directionality. Typically, flat curves should be used with minimum radii for critical
conditions.
Roadway alignment consistency is desirable.
Sudden changes in the alignment should be avoided. For example, a series of
successively sharp curves should be used to introduce a sharper curve.
Horizontal curves should be long enough for aesthetic purposes.
These should avoid the appearance of a kink for small deflection angles. For a
central angle of 5 degrees, curves should be a minimum of 500 feet long (with a
minimum increase of 100 ft for each degree decrease in the central angle).
Avoid sharp curves on lengthy high embankments.
The absence of other features (vegetation, cut slopes, etc.) makes it difficult for the
driver to perceive and react to the extent of curvature.
Avoid changing median widths on tangent alignments.
This will prevent distorted appearances.
Exercise caution when using compound circular curves.
Compound curvature flexibility may tempt designers to use them without restraint.
These curves should be avoided where curves are sharp.
Avoid sudden reversals in alignment.
These changes make it difficult for safe operation (lane changes, etc.). Distances
between reverse curves should be equal to the sum of the superelevation and
tangent runout lengths, or an equivalent length for spiral curves.
Avoid �broken-back� or �flat-back� curve arrangements, where possible.
These alignments containing a short tangent between two curves in the same
direction usually violate operator expectations. Motorists generally do not expect

Roadway Horizontal Alignments
Copyright 2015 Gregory J. Taylor, P.E. Page 54 of 61
successive curves in the same direction. Spiral transitions or compound curves are
preferable for such situations.
Coordinate the horizontal alignment with the roadway profile.

Roadway Horizontal Alignments
Copyright 2015 Gregory J. Taylor, P.E. Page 55 of 61
COORDINATION OF
HORIZONTAL AND VERTICAL
ALIGNMENTS
Geometric roadway design influences safety performance. Historical crash data has
shown that roadway factors are the second most contributing factor to roadway
accidents. Crashes are more likely to occur at locations with sudden changes in road
character (i.e. sharp curves at the end of long tangent sections).
Design consistency compares adjacent road segments and identifies locations with
changes that might violate driver expectations. This type of analysis can be used to
show operating speed decreases at curves.
Horizontal and vertical geometrics are the most critical roadway design elements. These
alignments should be designed concurrently to enhance
vehicle operation,
uniform speed,
and aesthetics without additional costs.
Examples include: checking for additional sight distance prior to major vertical
alignment changes; or revising design elements to eliminate potential drainage
problems.
Horizontal and vertical alignment geometric designs complement each other while poor
designs can reduce the quality of both. It can be extremely difficult and costly to fix any
vertical and/or horizontal deficiencies once a roadway is built. Any initial savings can
be offset by economic losses due to crashes and delays.
Physical factors that help define roadway alignments include:

Roadway Horizontal Alignments
Copyright 2015 Gregory J. Taylor, P.E. Page 56 of 61
- Roadway traffic
- Topography
- Subsurface conditions
- Cultural development
- Roadway termini
Although design speed helps to determine the roadway�s location, it assumes a greater
role as the design of the horizontal and vertical alignments progress. Design speed aids
in balancing all of the design elements by limiting many design values (curves, sight
distance) and influencing others (width, clearance, maximum gradient).
GENERAL PROCEDURE
Coordinating horizontal and vertical alignments should begin with any roadway
preliminary design. Any adjustments or corrections can be readily made at this phase.
Working drawings can be used for studying long, continuous plan and profile views to
visualize the proposed three-dimensional roadway. Computer-aided drafting and
design (CADD) systems are typically used to create optimal 3-D designs.
After development of a preliminary design, adjustments can be made for better
coordination between the alignments. Using the design speed, the following factors
should be checked:
Controlling curvature
Gradients
Sight distance
Superelevation runoff lengths
Also, the design controls for vertical and horizontal alignments should be considered,
as well as all aspects of terrain, traffic, and appearance. All adjustments should be made
before the costly and time-consuming preparation of construction plans.

Roadway Horizontal Alignments
Copyright 2015 Gregory J. Taylor, P.E. Page 57 of 61
For local roads, the alignment is impacted by existing or future development � with
intersections and driveways being dominant controls. Designs should contain long,
flowing alignments instead of a connected series of block-by-block sections.
AASHTO Design Guidelines for Horizontal and Vertical Alignments
Vertical and horizontal elements should be balanced to optimize safety, capacity,
operation, and aesthetics within the location�s topography.
Both horizontal and vertical alignment elements should be integrated to provide
a pleasing facility for roadway traffic.
Sharp horizontal curves near the top of a crest vertical curve or near the low
point of a sag vertical curve should be avoided. Using higher design values (well
above the minimum) for design speed can produce suitable designs and meet
driver�s expectations.
Horizontal and vertical curves need to be as flat as possible for intersections with
sight distance concerns.
For divided roadways, it may be suitable to vary median widths for divided
roadways. Independent horizontal/vertical alignments should be used for
individual one-way roads.

Roadway Horizontal Alignments
Copyright 2015 Gregory J. Taylor, P.E. Page 58 of 61
Horizontal and vertical alignments should be designed to minimize impact in
residential areas. Typical applications include:
depressed facilities (decreases facility visibility and noise)
horizontal adjustments (increases buffer zones between traffic and
neighborhoods).
Geometric design elements should be used to enhance environmental features
(parks, rivers, terrain, etc.). Roadways should enhance outstanding views or
features instead of avoiding them where possible.
Exception: Long tangent sections for sufficient passing sight distance may be
appropriate for two-lane roads needing passing sections at frequent
intervals.
SUMMARY
Along with the roadway cross section (lanes and shoulders, curbs, medians, roadside
slopes and ditches, sidewalks) and vertical alignment (grades and vertical curves), the
horizontal alignment (tangents and curves) helps provide a three-dimensional
roadway model. Its ultimate goal is to provide a safe, smooth-flowing facility that is
crash-free. Roadway horizontal alignments are directly related to their operational
quality and safety.
In today�s environment, designers must do more than apply design standards and
criteria to �solve� a problem. They must understand how various roadway elements
contribute to safety and facility operation, including the horizontal alignment.

Roadway Horizontal Alignments
Copyright 2015 Gregory J. Taylor, P.E. Page 59 of 61
This course summarizes the geometric design of horizontal alignments for modern
roads and highways. This document is intended to serve as guidance and not as an
absolute standard or rule. For further information, please refer to AASHTO�s A Policy
on Geometric Design of Highways and Streets (Green Book). It is considered to be the
primary guidance for U.S. roadway design. Section 3.3 � Horizontal Alignment was
used exclusively to present fundamental horizontal roadway geometric design
principles.
By completing this course, you should be familiar with the general design of horizontal
roadway alignments. The objective of this course was to give engineers and designers
an in-depth look at the principles to be considered when selecting and designing roads.
This course focused on the following:
Sight Distance
Stopping
Decision
Passing
Intersection
Design Considerations
Cross slopes
Superelevation
Radii
Grades
Horizontal Curves
Compound
Spiral
Coordination of Horizontal & Vertical Curves

Roadway Horizontal Alignments
Copyright 2015 Gregory J. Taylor, P.E. Page 60 of 61
The fundamental objective of good geometric design will remain as it has always been �
to produce a roadway that is safe, efficient, reasonably economic and sensitive to
conflicting concerns.
REFERENCES
A Policy on Geometric Design of Highways and Streets, 6th Edition
AASHTO. Washington, D.C. 2011.

Roadway Horizontal Alignments
Copyright 2015 Gregory J. Taylor, P.E. Page 61 of 61
Note: This text is the source for all equations and tables contained within this course,
unless noted otherwise.
Elementary Surveying, 6th Edition
Russell C. Brinker & Paul R. Wolf.
Harper & Row. New York. 1977.
Handbook of Simplified Practice for Traffic Studies
Center for Transportation Research & Education � Iowa State University.
Ames, Iowa. 2002.
Low-Cost Treatments for Horizontal Curve Safety
Federal Highway Administration Office of Safety. Washington, D.C. 2006.
Manual on Uniform Traffic Control Devices (MUTCD)
Federal Highway Administration. Washington, D.C. 2009.
Standard Roadway Drawings
Tennessee Department of Transportation.
Traffic Engineering Handbook, 5th Edition
Institute of Transportation Engineers. Washington, D.C. 1999.

QUIZ Roadway Horizontal Alignments
Gregory J. Taylor, P.E.
1. What is a recommended rate for deceleration?
a. 11.2 ft/s²
b. 9.5 ft/s²
c. 10 ft/s²
d. 8.8 ft/s²
2. What is the Side Friction Factor for a speed of 50 mph?
a. 0.25
b. 0.07
c. 0.14
d. 0.29
3. For diagrammatic profiles, the minimum vertical curve length can be approximated
as ________ times the design speed.
a. 2.0
b. 3.15
c. 0.2
d. 0.5
4. The highest superelevation rate for highways is typically 12%.
a. True
b. False
5. What is the Maximum Relative Gradient for a Design Speed of 40 mph?
a. 0.70%
b. 0.47%
c. 0.66%
d. 0.58%
6. What is the Passing Sight Distance for 60 mph?
a. 700 ft
b. 800 ft
c. 900 ft

QUIZ Roadway Horizontal Alignments
Gregory J. Taylor, P.E.
Copyright 2015 Gregory J. Taylor, P.E. Page 2 of 5
d. 1000 ft
7. Depressed facilities are a measure to minimize nuisance in residential areas.
a. True
b. False
8. Which of the following is a criterium for minimum spiral curve length?
a. Sight distance
b. Design speed
c. Lateral vehicle shifts
d. Design vehicle
9. The type of traffic control containing a left or right turn from a minor road is
___________________ .
a. Case A
b. Case B2
c. Case E
d. Case C2
10. If the AASHTO table value for a desirable spiral curve length is less than the
minimum spiral values derived from the equations, which one do you use?
a. AASHTO table value
b. minimum spiral values
c. default distance
d. zero
11. The driver�s eye height for trucks is 3.50 feet.
a. True
b. False
QUIZ Roadway Horizontal Alignments
Gregory J. Taylor, P.E.
Copyright 2015 Gregory J. Taylor, P.E. Page 3 of 5
12. Which of the following is not one of the fundamental three-dimensional features of a
roadway?
a. Roadway transitions
b. Vertical Alignment
c. Cross section
d. Horizontal Alignment
13. Which common Axis of Rotation combinations contains a median width of 15 feet
or less?
a. Case I
b. Case II
c. Case III
d. Case IV
14. Curves should be a minimum of 500 feet in length for a central angle of 5 degrees.
a. True
b. False
15. What is the Flatter Radius to Sharper Radius Ratio for a compound curve on an
open highway?
a. 1:1
b. 1.5:1
c. 2:1
d. 2.5:1
16. _____________ is the result of a vehicle�s rear wheels not precisely following the
same wheel path as its front wheels when traveling through a horizontal curve.
a. Skidding
QUIZ Roadway Horizontal Alignments
Gregory J. Taylor, P.E.
Copyright 2015 Gregory J. Taylor, P.E. Page 4 of 5
b. Overturning
c. Offtracking
d. Speeding
17. Control runoff lengths are typically __________________ range.
a. 100 to 650 ft
b. 700 to 950 ft
c. 1000 to 1400 ft
d. 1200 to 1550 ft
18. For widening the traveled-way on horizontal curves, the design vehicle should be a
passenger car.
a. True
b. False
19. Which Avoidance Maneuver takes between 10.2 to 11.2 seconds?
a. A
b. B
c. C
d. D
20. Passing Sight Distance is dependent on intersection spacing.
a. True
b. False
21. ______________________ is the overall design control for horizontal alignments.
a. Sight distance
b. Design speed
c. Superelevation
d. Roadway traffic

QUIZ Roadway Horizontal Alignments
Gregory J. Taylor, P.E.
Copyright 2015 Gregory J. Taylor, P.E. Page 5 of 5
22. Which alternative may be used where stopping sight distance is unavailable?
a. Increased design speed
b. Increased curve radii
c. Decreased offset to sight obstructions
d. Traffic control
23. Assumptions for passing sight distances include a vehicle length of
___________________ feet.
a. 18
b. 19
c. 20
d. 21
24. Spiral curves transition from normal tangent sections to full superelevation.
a. True
b. False
25. What is the vehicle makeup for Traffic Condition C?
a. Predominantly passenger car, some single-unit trucks
b. Majority of single-unit trucks, some tractor-semitrailer combination trucks
c. Predominantly tractor-semitrailer combinations
d. Majority of passenger vehicles