Embed Size (px)
Citation preview
GREG KOLODZIEJZYK’S 13-YEAR ASSOCIATIVE REMOTE VIEWING
EXPERIMENT RESULTS
By GreG KolodziejzyK
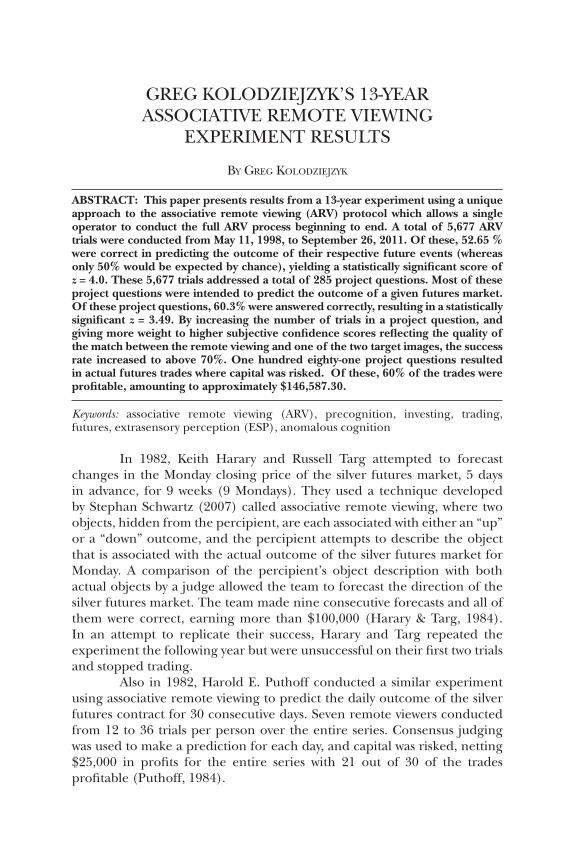
ABSTRACT: This paper presents results from a 13-year experiment using a unique approach to the associative remote viewing (ARV) protocol which allows a single operator to conduct the full ARV process beginning to end. A total of 5,677 ARV trials were conducted from May 11, 1998, to September 26, 2011. Of these, 52.65 % were correct in predicting the outcome of their respective future events (whereas only 50% would be expected by chance), yielding a statistically significant score of z = 4.0. These 5,677 trials addressed a total of 285 project questions. Most of these project questions were intended to predict the outcome of a given futures market. Of these project questions, 60.3% were answered correctly, resulting in a statistically significant z = 3.49. By increasing the number of trials in a project question, and giving more weight to higher subjective confidence scores reflecting the quality of the match between the remote viewing and one of the two target images, the success rate increased to above 70%. One hundred eighty-one project questions resulted in actual futures trades where capital was risked. Of these, 60% of the trades were profitable, amounting to approximately $146,587.30.
Keywords: associative remote viewing (ARV), precognition, investing, trading, futures, extrasensory perception (ESP), anomalous cognition
In 1982, Keith Harary and Russell Targ attempted to forecast changes in the Monday closing price of the silver futures market, 5 days in advance, for 9 weeks (9 Mondays). They used a technique developed by Stephan Schwartz (2007) called associative remote viewing, where two objects, hidden from the percipient, are each associated with either an “up” or a “down” outcome, and the percipient attempts to describe the object that is associated with the actual outcome of the silver futures market for Monday. A comparison of the percipient’s object description with both actual objects by a judge allowed the team to forecast the direction of the silver futures market. The team made nine consecutive forecasts and all of them were correct, earning more than $100,000 (Harary & Targ, 1984). In an attempt to replicate their success, Harary and Targ repeated the experiment the following year but were unsuccessful on their first two trials and stopped trading.
Also in 1982, Harold E. Puthoff conducted a similar experiment using associative remote viewing to predict the daily outcome of the silver futures contract for 30 consecutive days. Seven remote viewers conducted from 12 to 36 trials per person over the entire series. Consensus judging was used to make a prediction for each day, and capital was risked, netting $25,000 in profits for the entire series with 21 out of 30 of the trades profitable (Puthoff, 1984).
350 The Journal of Parapsychology
In 1994, Russell Targ, Jane Katra, Dean Brown and Wenden Wiegand conducted an associative remote viewing experiment in which objects were once again associated to the two possible outcomes, “up” or “down,” of the weekly May silver futures contract for a 9-week series. An error-detecting protocol was used whereby a judge compared the remote viewers’ descriptions to the object targets and rated the accuracy of the description on a scale of 0 to 7. If the trial scored a 4 or higher, then it was considered a “pass” and was used to make a prediction. Of the nine trials conducted, two were passed, and seven were “traded.” In this case, no purchases were actually made, and capital was not risked on the predictions. Six of the seven trade predictions were correct (Targ, Katra, Brown, & Wiegand, 1995).
Standard ARV Trial
The protocol used is a modified form of the standard associative remote viewing protocol used by Targ and Puthoff. Modifications to the protocol are intended to reduce aberrations due to human intentionality while increasing experimental “blinding” and randomization requirements. To help readers to understand how the modified version differs from the standard protocol, I will first illustrate the standard ARV protocol below.
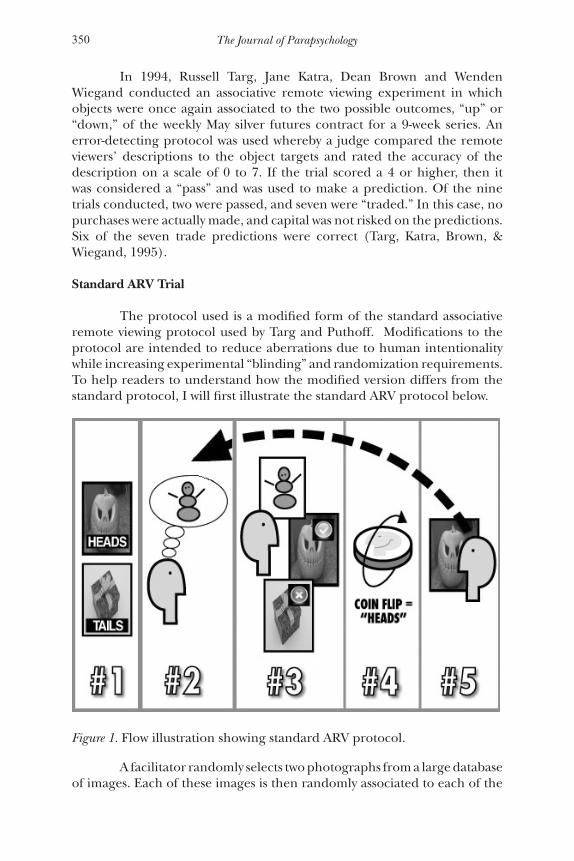
Figure 1. Flow illustration showing standard ARV protocol.
A facilitator randomly selects two photographs from a large database of images. Each of these images is then randomly associated to each of the
351Greg Kolodziejzyk’s 13-Year Associative Remote Viewing Experiment
two possible outcomes of the future event. In the example flow illustration in Figure 1, the future event is the toss of a coin, and the two possible future outcomes are “heads” and “tails” (see Figure 1, step #1).
While still blind to the images, the perceiver attempts to remote view the image that he/she will be shown on some future date, and produces a sketch. This can be thought of as the perceiver’s “imagining” of what he or she will see when shown the photo at the designated future time. In this example, let’s assume that the percipient draws an orange snowman (see Figure 1, step #2).
The facilitator is presented with the two previously selected images, compares the percipient’s sketch to both of them, and selects the image that is most similar to the sketch. After the selection has been made, the percipient is made aware of the associated outcome and a prediction on the outcome of the future event is made. In this case, the percipient selects the orange pumpkin image which is associated to “heads” outcome (see Figure 1, step #3).
The future event transpires. In this example, the coin is flipped, resulting in a “heads” outcome (see Figure 1, step #4).
The percipient is shown the image that was associated to the outcome of the actual event, which in this case was the image of the orange pumpkin (see Figure 1, step #5).
Modified ARV Protocol Using Multiple Trials to Form a Consensus
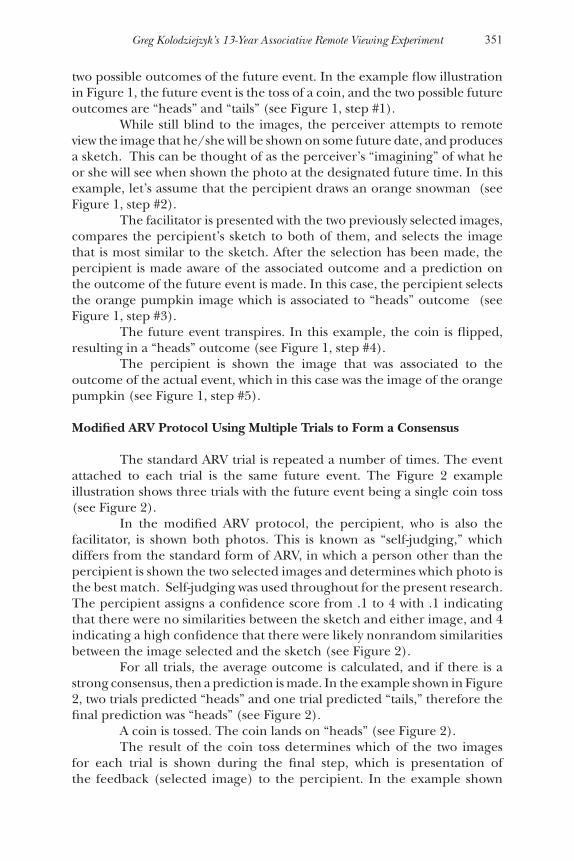
The standard ARV trial is repeated a number of times. The event attached to each trial is the same future event. The Figure 2 example illustration shows three trials with the future event being a single coin toss (see Figure 2).
In the modified ARV protocol, the percipient, who is also the facilitator, is shown both photos. This is known as “self-judging,” which differs from the standard form of ARV, in which a person other than the percipient is shown the two selected images and determines which photo is the best match. Self-judging was used throughout for the present research. The percipient assigns a confidence score from .1 to 4 with .1 indicating that there were no similarities between the sketch and either image, and 4 indicating a high confidence that there were likely nonrandom similarities between the image selected and the sketch (see Figure 2).
For all trials, the average outcome is calculated, and if there is a strong consensus, then a prediction is made. In the example shown in Figure 2, two trials predicted “heads” and one trial predicted “tails,” therefore the final prediction was “heads” (see Figure 2).
A coin is tossed. The coin lands on “heads” (see Figure 2).The result of the coin toss determines which of the two images
for each trial is shown during the final step, which is presentation of the feedback (selected image) to the percipient. In the example shown
352 The Journal of Parapsychology
in Figure 2, the “heads” result means that the percipient will view three images: the green dots, the flowers, and the rounded bars (see Figure 2).
Figure 2. Flow illustration showing modified ARV protocol with multiple trial consensus.
The new approach presented in my research adapts the classic feedback schema by incorporating an error-correcting consensus method. This method “nests” many sequential, brief-duration individual free response remote viewing trials to form a single consensus-vote about the event to be predicted. Majority vote method of analysis has been successfully used by Carpenter (1991), who conducted three forced-choice ESP experiments resulting in 12/12 correct, 10/11 correct, and 9/12 correct. In the first
353Greg Kolodziejzyk’s 13-Year Associative Remote Viewing Experiment
study, the percipients were able to capture the letters of the coded word “PEACE” with complete accuracy from 12 correct majority votes, and none incorrect. According to Carpenter: “The results of the repeated-guessing analysis in the three studies reported here all tend to support the usefulness of this way of enhancing the reliability of an effort to acquire some piece of information using ESP” (p. 274). Another attempt was reported by Ryzl (1966) using repetition and majority vote analysis of 19,350 forced-choice trials averaging a 62% hit rate, which resulted in the successful decoding of five three-digit numbers without a single error.
Method
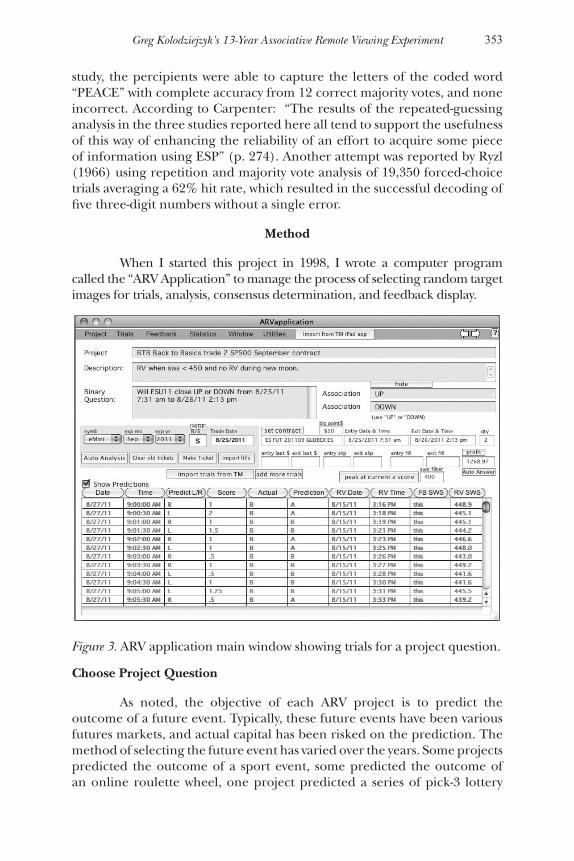
When I started this project in 1998, I wrote a computer program called the “ARV Application” to manage the process of selecting random target images for trials, analysis, consensus determination, and feedback display.
Figure 3. ARV application main window showing trials for a project question.
Choose Project Question
As noted, the objective of each ARV project is to predict the outcome of a future event. Typically, these future events have been various futures markets, and actual capital has been risked on the prediction. The method of selecting the future event has varied over the years. Some projects predicted the outcome of a sport event, some predicted the outcome of an online roulette wheel, one project predicted a series of pick-3 lottery
354 The Journal of Parapsychology
numbers, but the vast majority of the projects predicted the outcome of a futures market, and most of these projects involved risking capital on the prediction (see Table 3 in Results section).
I used various methods of selecting the futures market to trade. Most often, the ARV application would randomly pick a futures market from a basket of eight markets consisting of S&P 500 index, U.S. T notes, wheat, oil, gold, Swiss franc, British pound, and Canadian dollar. Sometimes the identity of this futures market would be kept hidden from me until after the trade was closed (after I implemented automated electronic trading). Sometimes I used a highly liquid market such as the S&P 500 for shorter term trades. At various times due to technology limits, and other trading logistics, I would just manually select a futures market.
Choose Question Date
A date in the future was selected by me to enter and exit a trade. Typically, this date was a single day where a trade would be entered when the market opened in the morning and exited when the market closed in the afternoon. Periodically, I entered trades that had been held for longer than one day—some for one week, and a couple that were held for a month. Depending on how many trials I wanted to conduct, the starting date could be anywhere from one day to two weeks into the future.
Generate Trials
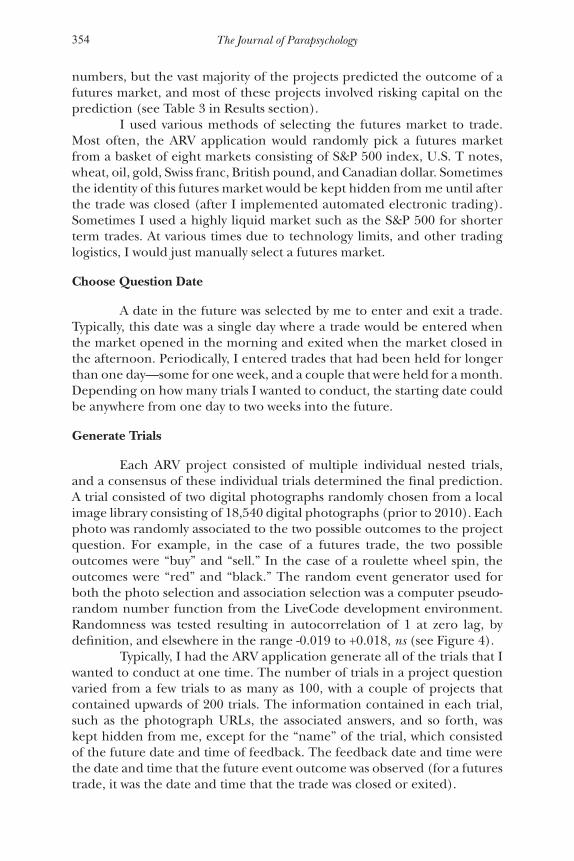
Each ARV project consisted of multiple individual nested trials, and a consensus of these individual trials determined the final prediction. A trial consisted of two digital photographs randomly chosen from a local image library consisting of 18,540 digital photographs (prior to 2010). Each photo was randomly associated to the two possible outcomes to the project question. For example, in the case of a futures trade, the two possible outcomes were “buy” and “sell.” In the case of a roulette wheel spin, the outcomes were “red” and “black.” The random event generator used for both the photo selection and association selection was a computer pseudo- random number function from the LiveCode development environment. Randomness was tested resulting in autocorrelation of 1 at zero lag, by definition, and elsewhere in the range -0.019 to +0.018, ns (see Figure 4).
Typically, I had the ARV application generate all of the trials that I wanted to conduct at one time. The number of trials in a project question varied from a few trials to as many as 100, with a couple of projects that contained upwards of 200 trials. The information contained in each trial, such as the photograph URLs, the associated answers, and so forth, was kept hidden from me, except for the “name” of the trial, which consisted of the future date and time of feedback. The feedback date and time were the date and time that the future event outcome was observed (for a futures trade, it was the date and time that the trade was closed or exited).
355Greg Kolodziejzyk’s 13-Year Associative Remote Viewing Experiment
Figure 4. Autocorrelation analysis of computer pseudorandom number generator function.
Each trial was named with this date and time with the time advancing by 2 min per trial. For example:
Trial # 1 name: 2/14/2009 2:00 p.m. Trial # 2 name: 2/14/2009 2:02 p.m. Trial # 3 name: 2/14/2009 2:04 p.m. Trial # 4 name: 2/14/2009 2:06 p.m.
etc.
From 1998 to 2009, the target images consisted of a local library of 18,540 digital photographic images:
• 500 x 420 pixel stock photography images from Digital Stock• 450 x 380 pixel stock photography images from Digital Vision• 640 x 480 pixel stock photography images from Adobe Systems• 930 x 620 pixel pages from the National Geographic CD-ROM collection From 2010 to present day, the target images have consisted of
random image urls from Google.com image search and Flickr.com search. A function in the ARV application generates a Google.com or Flickr.com image search using from 1 to 3 random words selected from a word list, then chooses a random page from the search return url, then chooses a random image from the page.
356 The Journal of Parapsychology
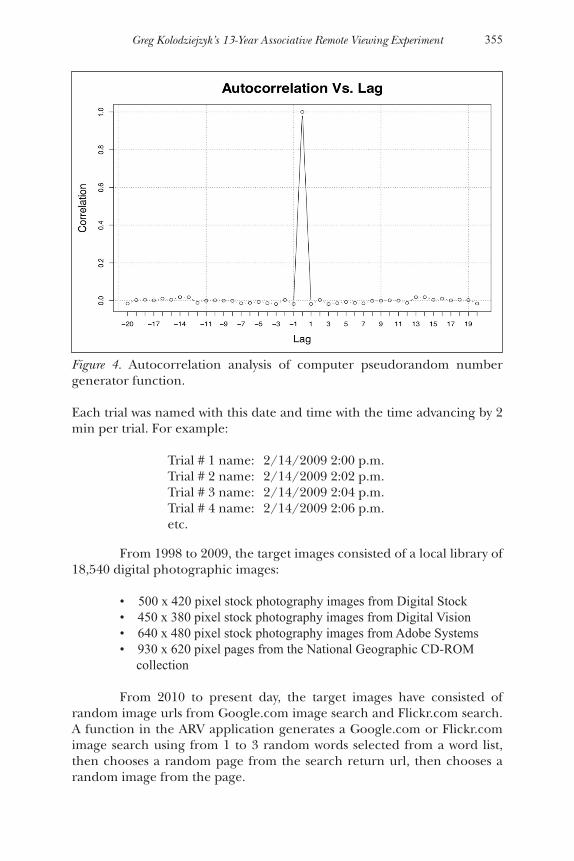
Periodically from 1998 to 2010, I would use target image pairs that were preselected by a helper to be dissimilar. I wrote an application that would display 12 thumbnail images that were chosen either from my local library, or using the Google.com or Flickr.com search (see Figure 5). My helper would browse the page of images and select two images that appeared to be sufficiently dissimilar (e.g., a landscape plus a mechanical object, or a round blue object plus a square red object). The application would add the target pair url to a list. When setting up the trial, the ARV application would randomly select a target pair from this list that usually consisted of a few thousand pairs, which were never reused.
Figure 5. ARV application target-set-maker utility.
Remote Viewing
After a number of trials had been created, I remote-viewed each trial, according to the following procedure.
I sat in a reclining chair with a notepad and pencil in hand and closed my eyes (sometimes placing a blindfold over my eyes to block the light). Industrial ear protectors were worn to block out any ambient noise. Periodically, I “warmed-down” by listening to 5 to 10 min of a binaural beat sound to simulate a frequency of approximately 6.5 Hz—the frequency of theta brain waves, and the earth’s Schumann resonance. At times I would
357Greg Kolodziejzyk’s 13-Year Associative Remote Viewing Experiment
listen to a Hemisync CD that was made by the Monroe Institute for military remote viewer Joe McMoneagle’s remote viewing sessions.
When I was relaxed and ready to start remote viewing the trials, I tried to imagine myself in the future looking at the feedback image for the first trial. The feedback image for each trial was the image from the pair for that trial that was associated to the actual outcome of the event. For example, in the case of a S&P 500 futures trade where the outcome of the market was “up” for the trade time period, the feedback image for trial # 1 would be the image from the pair of images for trial #1 that was associated with “buy.” Since the trials are named with the exact feedback date and time, I would imagine looking at this date and time displayed on my computer monitor and then try to imagine looking at the photograph that was displayed below it.
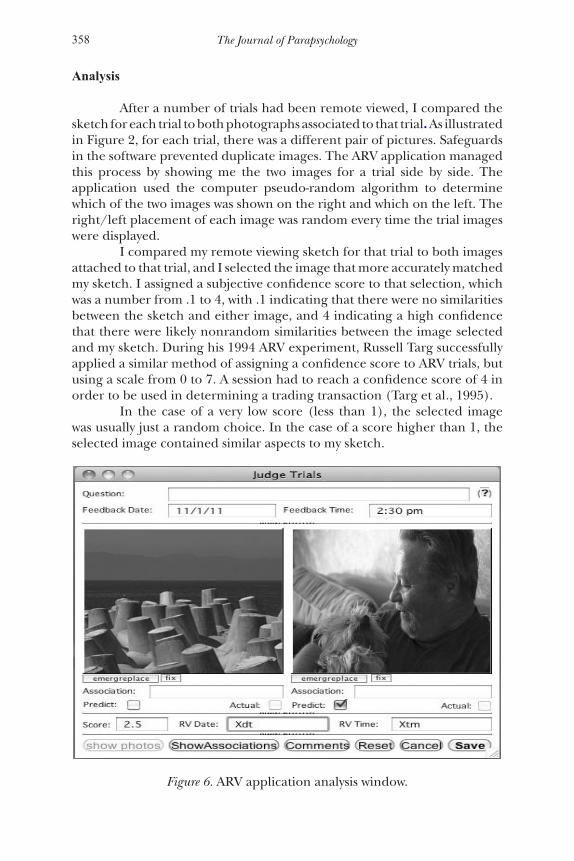
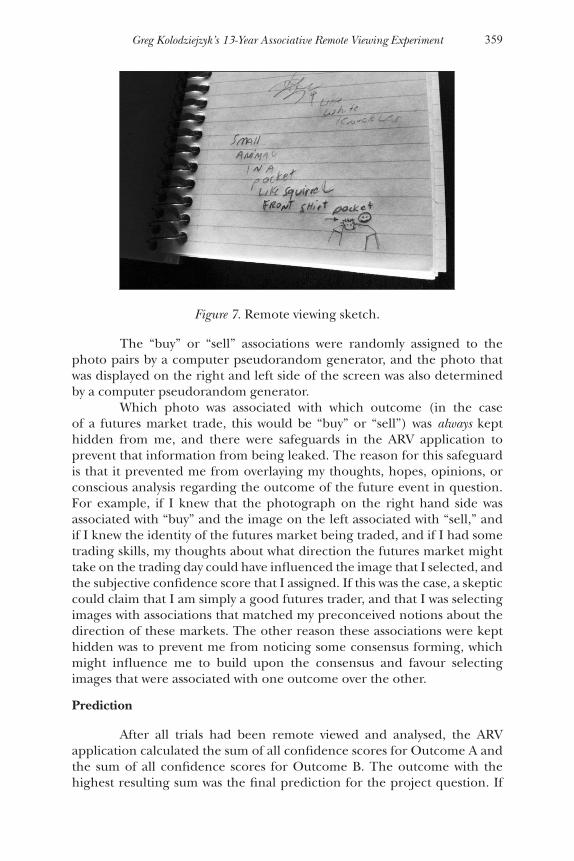
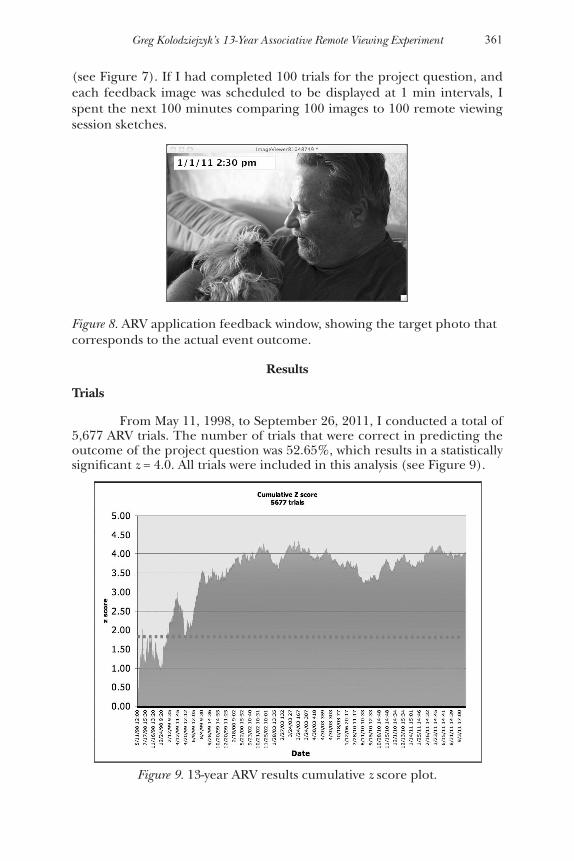
My objective during this process was to generate random thoughts about the feedback image. I tried to clear my mind and think of nothing while imagining myself on the future feedback date and time, looking at an image on my computer screen. I sketched or printed any random thought that entered my mind. It has been my experience that my first impressions about a target are usually more accurate that subsequent impressions, so I usually stopped at one or two quick ideas. As a result, my sketches were not very elaborate. I ignored thoughts that seemed like they were generated by my conscious mind and didn’t seem random. I emphasized thoughts that surprised me by how random they seemed—especially if the thoughts were very detailed. For example, recently during a remote viewing session, I thought of a small furry pet in my shirt pocket. This was a detailed perception, and seemed very random, so strong emphasis was placed on this perception in my resulting sketch. As it turned out, the feedback photo was a man holding a small dog over his shirt pocket. The image and remote viewing sketch are shown in Figures 6 and 7.
I might spend 2 to 4 min imagining looking at the feedback image for trial #1, jot down a few thoughts, then move on to thinking about trial #2. I repeated this process until 5 to 10 trials had been remote viewed. On average, I would estimate that it took me 20 to 30 min to complete 10 trials.
Depending on how many days I had remaining until the trade entry date, I repeated this remote viewing process each day, two to three times per day until all of the trials had been completed. If there was remaining time, I added more trials and continued to remote view. There were periods of time over the last 13 years when I would enter and exit a trade every day, and conduct the remote viewing sessions for that trade the day before. In that case, I might conduct 6 to 10 trials total. There were times when I held a trade for 1 hour and conducted the remote viewing sessions an hour before the trade entry time. In that case, I may have conducted a total of 4 to 10 trials. At times, I planned a trade date for 2 weeks into the future, and I conducted an average of 10 to 20 trials per day for the 2 weeks leading up to the trade. The total number of trials was over 200.
358 The Journal of Parapsychology
Analysis
After a number of trials had been remote viewed, I compared the sketch for each trial to both photographs associated to that trial. As illustrated in Figure 2, for each trial, there was a different pair of pictures. Safeguards in the software prevented duplicate images. The ARV application managed this process by showing me the two images for a trial side by side. The application used the computer pseudo-random algorithm to determine which of the two images was shown on the right and which on the left. The right/left placement of each image was random every time the trial images were displayed.
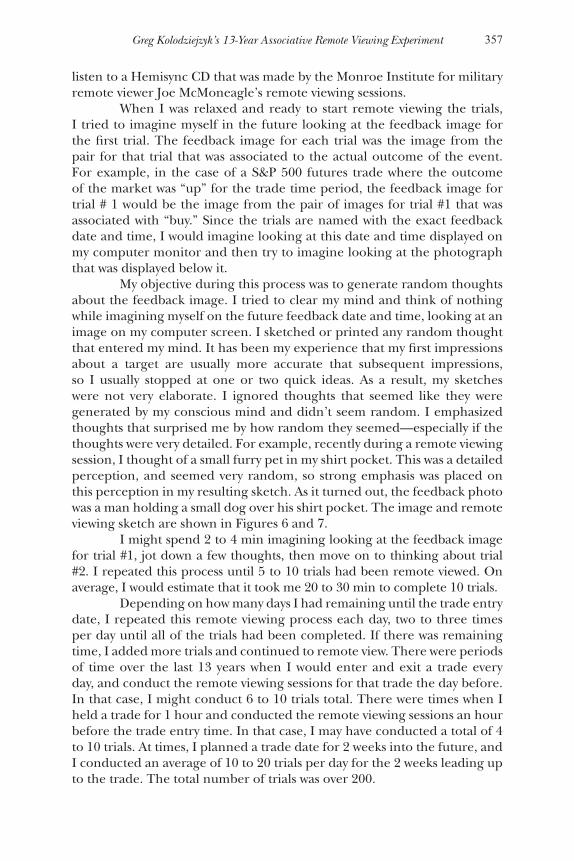
I compared my remote viewing sketch for that trial to both images attached to that trial, and I selected the image that more accurately matched my sketch. I assigned a subjective confidence score to that selection, which was a number from .1 to 4, with .1 indicating that there were no similarities between the sketch and either image, and 4 indicating a high confidence that there were likely nonrandom similarities between the image selected and my sketch. During his 1994 ARV experiment, Russell Targ successfully applied a similar method of assigning a confidence score to ARV trials, but using a scale from 0 to 7. A session had to reach a confidence score of 4 in order to be used in determining a trading transaction (Targ et al., 1995).
In the case of a very low score (less than 1), the selected image was usually just a random choice. In the case of a score higher than 1, the selected image contained similar aspects to my sketch.
Figure 6. ARV application analysis window.
359Greg Kolodziejzyk’s 13-Year Associative Remote Viewing Experiment
Figure 7. Remote viewing sketch.
The “buy” or “sell” associations were randomly assigned to the photo pairs by a computer pseudorandom generator, and the photo that was displayed on the right and left side of the screen was also determined by a computer pseudorandom generator.
Which photo was associated with which outcome (in the case of a futures market trade, this would be “buy” or “sell”) was always kept hidden from me, and there were safeguards in the ARV application to prevent that information from being leaked. The reason for this safeguard is that it prevented me from overlaying my thoughts, hopes, opinions, or conscious analysis regarding the outcome of the future event in question. For example, if I knew that the photograph on the right hand side was associated with “buy” and the image on the left associated with “sell,” and if I knew the identity of the futures market being traded, and if I had some trading skills, my thoughts about what direction the futures market might take on the trading day could have influenced the image that I selected, and the subjective confidence score that I assigned. If this was the case, a skeptic could claim that I am simply a good futures trader, and that I was selecting images with associations that matched my preconceived notions about the direction of these markets. The other reason these associations were kept hidden was to prevent me from noticing some consensus forming, which might influence me to build upon the consensus and favour selecting images that were associated with one outcome over the other.
Prediction
After all trials had been remote viewed and analysed, the ARV application calculated the sum of all confidence scores for Outcome A and the sum of all confidence scores for Outcome B. The outcome with the highest resulting sum was the final prediction for the project question. If
360 The Journal of Parapsychology
actual capital was to be risked on a trade, then the difference between these two sums was a consideration, with a larger differential resulting in larger effect size (see Results).
Trade
In the case where a project question was a trade where actual capital was risked, a trade was entered at the previously chosen trade entry date and time and then exited on the trade close date and time. Note that when trading futures contracts, capital could be just as easily risked on the market decreasing in value (selling short) as the market increasing in value (buying long). It is also important to note here that even in the case where the futures market identity was known, it was against my protocol rules to observe market activity while the trade was being held. Also, I avoided gaining any knowledge about any financial markets as much as possible. I did not watch CNBC and didn’t read the financial papers. To assist with this effort to stay emotionally neutral toward any market, I have automated the market selection, trade entry and exit functions.
Since about mid-2010, the ARV application has been modified with an API that connects into my futures broker’s order entry system and automates the submitting of the trades, calculates the optimal number of contracts to trade based on recent volatility to equalize risk across every trade and every market, and uses recent volume data to determine current contract expiration months. Due to this advancement with the ARV application, I have been able to automate the following trade functions which were kept hidden from me until after the trade had been closed and a profit earned or lost:
• Select a random futures market from the basket• Determine the consensus outcome prediction• Transmit the trade entry and exit tickets• Calculate profit and/or loss• Generate the resulting feedback image for each trial
Feedback
After the trade closed (or the future event transpired), and I became aware of the outcome of the project question, this outcome was entered into the ARV application, which generated a resulting single feedback image for each trial for the project question (see Figure 8).
Note that in the rare case of a trade where the price at time of entry and exit was the same, the program chose the target photo according to the price move that happened immediately after, whether up or down. (Trades were usually closed 1 min before the market closed to allow for this additional price if required.)
On the exact feedback date and time for each trial in the project, I looked at the feedback image and compared it to my remote viewing sketch
361Greg Kolodziejzyk’s 13-Year Associative Remote Viewing Experiment
(see Figure 7). If I had completed 100 trials for the project question, and each feedback image was scheduled to be displayed at 1 min intervals, I spent the next 100 minutes comparing 100 images to 100 remote viewing session sketches.
Figure 8. ARV application feedback window, showing the target photo that corresponds to the actual event outcome.
Results
Trials
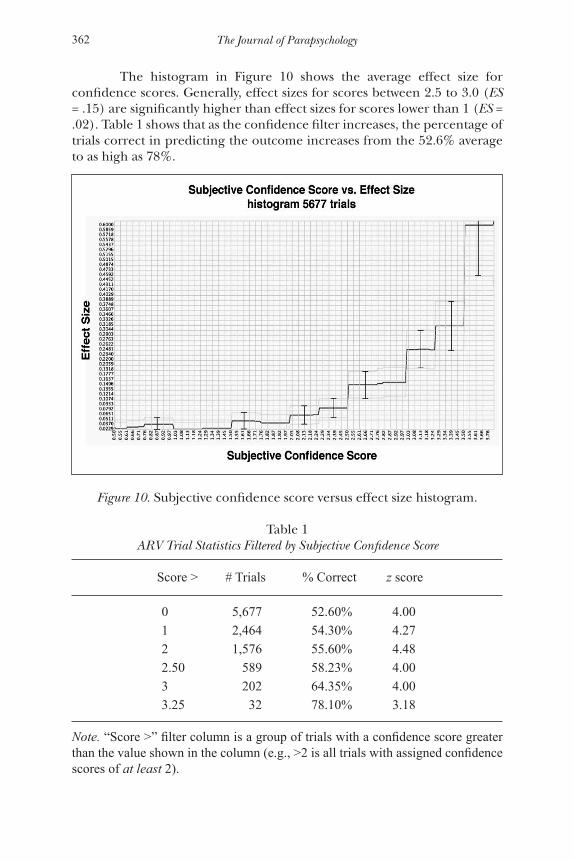
From May 11, 1998, to September 26, 2011, I conducted a total of 5,677 ARV trials. The number of trials that were correct in predicting the outcome of the project question was 52.65%, which results in a statistically significant z = 4.0. All trials were included in this analysis (see Figure 9).
Figure 9. 13-year ARV results cumulative z score plot.
362 The Journal of Parapsychology
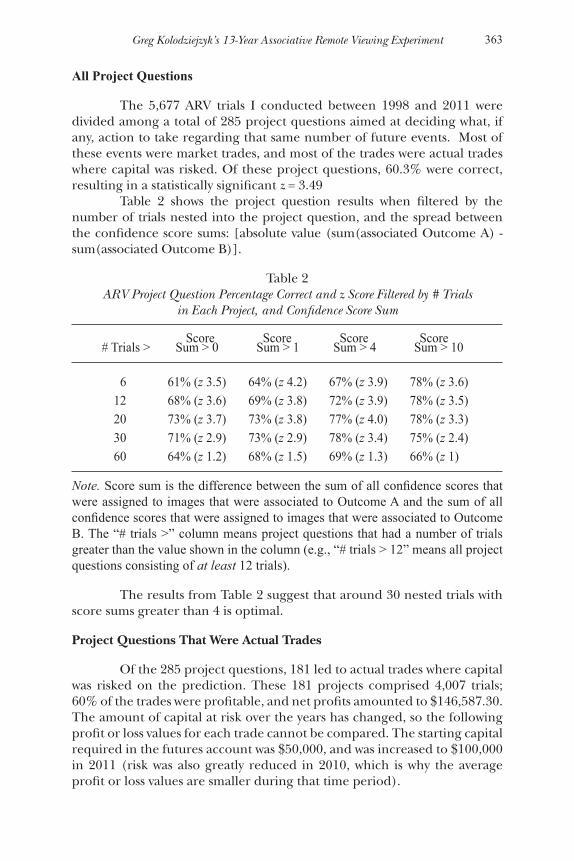
The histogram in Figure 10 shows the average effect size for confidence scores. Generally, effect sizes for scores between 2.5 to 3.0 (ES = .15) are significantly higher than effect sizes for scores lower than 1 (ES = .02). Table 1 shows that as the confidence filter increases, the percentage of trials correct in predicting the outcome increases from the 52.6% average to as high as 78%.
Figure 10. Subjective confidence score versus effect size histogram.
Table 1ARV Trial Statistics Filtered by Subjective Confidence Score
Score > # Trials % Correct z score
0 5,677 52.60% 4.001 2,464 54.30% 4.272 1,576 55.60% 4.482.50 589 58.23% 4.003 202 64.35% 4.003.25 32 78.10% 3.18
Note. “Score >” filter column is a group of trials with a confidence score greater than the value shown in the column (e.g., >2 is all trials with assigned confidence scores of at least 2).
363Greg Kolodziejzyk’s 13-Year Associative Remote Viewing Experiment
All Project Questions
The 5,677 ARV trials I conducted between 1998 and 2011 were divided among a total of 285 project questions aimed at deciding what, if any, action to take regarding that same number of future events. Most of these events were market trades, and most of the trades were actual trades where capital was risked. Of these project questions, 60.3% were correct, resulting in a statistically significant z = 3.49
Table 2 shows the project question results when filtered by the number of trials nested into the project question, and the spread between the confidence score sums: [absolute value (sum(associated Outcome A) - sum(associated Outcome B)].
Table 2ARV Project Question Percentage Correct and z Score Filtered by # Trials
in Each Project, and Confidence Score Sum
Score Score Score Score# Trials > Sum > 0 Sum > 1 Sum > 4 Sum > 10
6 61% (z 3.5) 64% (z 4.2) 67% (z 3.9) 78% (z 3.6)12 68% (z 3.6) 69% (z 3.8) 72% (z 3.9) 78% (z 3.5)20 73% (z 3.7) 73% (z 3.8) 77% (z 4.0) 78% (z 3.3)30 71% (z 2.9) 73% (z 2.9) 78% (z 3.4) 75% (z 2.4)60 64% (z 1.2) 68% (z 1.5) 69% (z 1.3) 66% (z 1)
Note. Score sum is the difference between the sum of all confidence scores that were assigned to images that were associated to Outcome A and the sum of all confidence scores that were assigned to images that were associated to Outcome B. The “# trials >” column means project questions that had a number of trials greater than the value shown in the column (e.g., “# trials > 12” means all project questions consisting of at least 12 trials).
The results from Table 2 suggest that around 30 nested trials with score sums greater than 4 is optimal.
Project Questions That Were Actual Trades
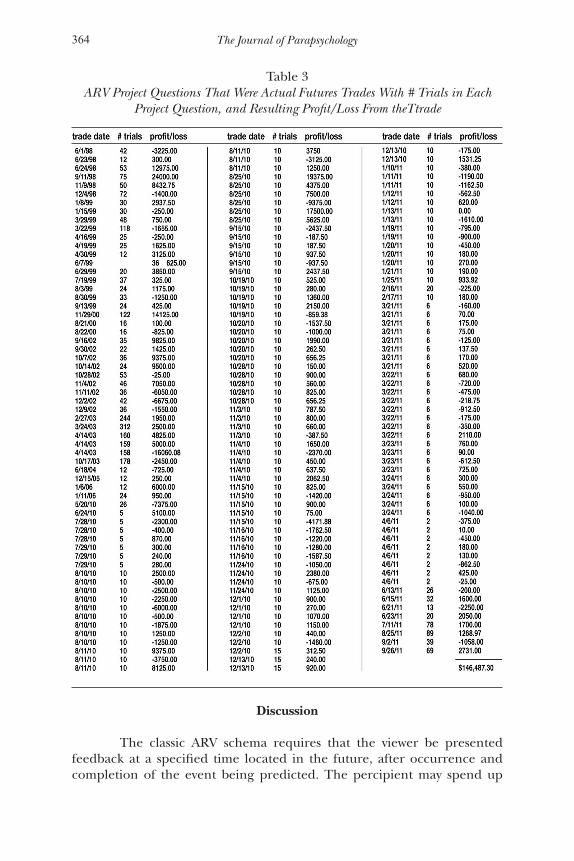
Of the 285 project questions, 181 led to actual trades where capital was risked on the prediction. These 181 projects comprised 4,007 trials; 60% of the trades were profitable, and net profits amounted to $146,587.30. The amount of capital at risk over the years has changed, so the following profit or loss values for each trade cannot be compared. The starting capital required in the futures account was $50,000, and was increased to $100,000 in 2011 (risk was also greatly reduced in 2010, which is why the average profit or loss values are smaller during that time period).
364 The Journal of Parapsychology
Table 3ARV Project Questions That Were Actual Futures Trades With # Trials in Each
Project Question, and Resulting Profit/Loss From theTtrade
Discussion
The classic ARV schema requires that the viewer be presented feedback at a specified time located in the future, after occurrence and completion of the event being predicted. The percipient may spend up
365Greg Kolodziejzyk’s 13-Year Associative Remote Viewing Experiment
to an hour performing the remote viewing, working under the specific intention of perceiving many different elements of a single feedback target to be presented in the future at the prearranged time.
My method of conducting many “rapid-fire” free-response trials naturally entails that an equally “rapid fire” series of multiple feedback images be presented in the future to the viewer in the same order they were viewed, with a short rest period (a minute or more in duration) interleaved between the presentation of each feedback image
I believe this departure from the standard ARV protocol reasonably preserves the original ARV principle behind the remote viewing/feedback presentation relationship, while improving the ability to quantify individual perceptions as opposed to having to deal with a mass of perceptions presented all at once, as in the standard feedback protocol.
One way to look at it is this: In classic ARV the percipient spends as much as an hour or more collecting multiple impressions from one target photo that will be presented in the future during the designated feedback experience. I spend that same hour-long period with the intention of perceiving one or a few elements each from a series of individual feedback targets. In effect, the “single-feedback” target is now actually divided up into many small distinct feedback events, separated into a closely spaced sequence. The advantage is that the perceptions generated can be parsed among those specific feedback targets, and each perception can be judged individually as to its accuracy with respect to its feedback target.
From the book Opening to the Infinite by Stephan A. Schwartz (2007), and conversations that I have had with Paul H. Smith, it is hypothesized that intentionality is fundamental in guiding the underlying (largely subconscious) remote viewing process. Thus, specific, unambiguous inten-tion is very important to the protocol at work in this research project. My assumption here was that intention is not subject to physical problems of focus or clarity. For example, if my intention is to perceive elements of a photo that I will view tomorrow at 10:00 a.m., my perceptions of that feedback event will not be intruded upon by elements of a different photo from, say, the one to be presented at 10:05 a.m. If it is possible that a percipient can intend to perceive the shape or color of the upper left hand corner of a feedback target in a more complex classical feedback target, then it seems logical to assume that the percipient can also instead intend to perceive the shape or color of an entire feedback target shown at exactly 10:05, followed by a different one to be shown at exactly 10:06 a.m., and so on. As my results indicate, intention doesn’t seem to be limited temporally, and is susceptible to being parsed in this way.
It is possible that my multitarget/multifeedback method creates displacement problems, though I have not observed any in my remote viewing results. As the research outcome indicates, after 5,600 trials over 13 years, this adapted version of ARV viewing and feedback protocols seems to have succeeded. It would be interesting to learn whether a different
366 The Journal of Parapsychology
method of managing the remote viewing and feedback might have better results, and this could offer a fruitful direction for future research.
Conclusions and Future Research
My method of considering the sum of subjective confidence scores of multiple nested ARV trials to generate a confident prediction of a future event has been reliably successful over a 13-year period. The target event of the vast majority of the trials conducted was the outcome of a financial market where capital was risked, and profits consistent with the general success rate resulted. I believe that my results constitute strong evidence of not only a significant psi effect in a long-term free-response experiment, but that psi can be applied in an objective, process-oriented manner to accomplish something useful.
Aside from my talent for persistence, I am not convinced that I possess any special skills required to achieve success using my ARV protocol. In an effort to learn if others can duplicate my success, I have offered a free training course at my web site (http://www.remote-viewing.com). Unfortunately few, if any, have followed through and applied my approach in a consistent and disciplined manner. As with most challenges in life, I believe the true difficulty in achieving success is not as much about acquiring the necessary skills or knowledge as it is about having the tenacity required to continue the pursuit—even when faced with a string of unsuccessful results.
In the ARV database, there is a statistically significant negative correlation between effect size and solar wind speed (sws). By filtering out all trials where the remote viewing was conducted during active solar conditions with solar wind speeds greater than 450 km/s, the trial success rate jumps from 52.6% to 54.2%, resulting in a significant z = 5.0. Using this sws filter with a minimum 20-trial project question and a minimum of 4-point score sum spread results in 94% correct project questions and a significant z = 5.3. A solar wind speed study will be the subject of a future paper.
I am becoming concerned about what appears to be an effect size fall-off with project questions that consist of 30 trials or more. This could be due to an increase in the average time between remote viewing and feedback (delta T). A quick look at the database does not seem to show obvious evidence of an ES fall-off with increasing delta T values. This is something that will also be the subject of further study.
References
Carpenter, J. C. (1991). Prediction of forced-choice ESP performance. Part III. Three attempts to retrieve coded information using mood reports and repeated-guessing technique. Journal of Parapsychology, 55, 227 –280.
367Greg Kolodziejzyk’s 13-Year Associative Remote Viewing Experiment
Harary, K., & Targ, R. (1985). A new approach to forecasting commodity futures. PSI Research, 4, 79–85.
Puthoff, H. E. (1984). ARV (Associational Remote Viewing) applications [Abstract]. In R. A. White & J. Solfvin (Eds.), Research in Parapsychology 1984 (pp. 121–122). Metuchen, NJ: Scarecrow Press.
Ryzl, M. (1966), A model of parapsychological communication. Journal of Parapsychology, 30, 18 –30.
Schwartz, S. A. (2007). Opening to the infinite: The art and science of nonlocal awareness. Langley, WA: Nemoseen Media.
Targ, R. & Harary, K. (1984). Mind race: Understanding and using psychic abilities. New York: Villard Books.
Targ, R., Katra, J., Brown, D., & Wiegand, W. (1995). Viewing the future: A pilot study with an error-detecting protocol. Journal of Scientific Exploration, 9, 367–380.
#43 Westbluff PlaceCalgary, Alberta, [email protected]
Acknowledgments
I would like to thank Paul H. Smith for his encouragement and editing assistance. I would also like to thank James Spottiswoode for his help over the many years with statistics.
Abstracts in Other Languages
German
GREG KOLODZIEJZYKS ERGEBNISSE EINES 13JÄHRIGEN EXPERIMENTE ZUR ASSOZIATIVEN FERNWAHRNEHMUNG
ZUSAMMENFASSUNG: Dieser Artikel stellt die Ergebnisse eines 13jährigen Experiments vor, dem ein einzigartiger Zugang zum Protokoll zur assoziativen Fernwahrnehmung (AFW) zugrunde liegt, durch das ein einziger Operator in die Lage versetzt wurde, den vollständigen AFW-Prozess von Anfang bis Ende zu absolvieren. Insgesamt wurden 5,677 AFW-Einzelversuche vom 11. Mai 1998 bis zum 26. September 2011 durchgeführt. Von diesen sagten 52.65% das Ergebnis ihres jeweiligen zukünftigen Ereignisses richtig voraus (bei 50%iger Zufallserwartung), was einem statistisch signifikanten Trefferwert von z = 4.0 entsprach. Diese 5,677 Einzelversuche umfassten 285 Projektfragen. Die meisten dieser Projektfragen verfolgten die Absicht, den Ausgang eines bestimmten Terminwarengeschäfts vorherzusagen. 60.3% von diesen Projektfragen wurden richtig beantwortet, was zu einem statistisch signifikanten z = 3.49 führte. Nachdem die Anzahl der Einzelversuche bei den Projektfragen erhöht und ein größeres Gewicht den höheren subjektiven Vertrauenseinschätzungen eingeräumt wurde, die die Qualität der Übereinstimmung zwischen der Fernwahrnehmung und einem der beiden Zielbilder widerspiegelte, stieg
368 The Journal of Parapsychology
die Erfolgsquote bis über 70%. Einhunderteinundachtzig Projektfragen resultierten in tatsächlichen Terminwarengeschäften, bei denen Kapital eingesetzt wurde. Von diesen waren 60% der Termingeschäfte profitabel und ergaben zusammen $146,587.30.
Spanish
EL EXPERIMENTO DE 13 AÑOS DE GREG KOLODZIEJZYK CON VISIÓN A DISTANCIA ASOCIATIVA
RESUMEN: Este artículo presenta los resultados de un experimento de 13 años utilizando un enfoque único en la visión remota asociativa (ARV), un protocolo que permite a un solo operador llevar a cabo el proceso completo de ARV de principio a fin. Un total de 5,677 pruebas de ARV se llevaron a cabo del 11 de mayo de 1998 al 26 de septiembre de 2011. De éstas, 52.65% fueron correctas en la predicción de los respectivos eventos futuros (donde sólo un 50% se esperarían por casualidad), dando una puntuación estadísticamente significativa de z = 4.0. Las 5,677 pruebas se refirieron a un total de 285 preguntas. La mayoría de estas preguntas estaban concebidas para predecir el resultado de un determinado mercado de futuros. De estas preguntas, el 60.3% fueron contestadas correctamente, dando un resultado estadísticamente significativo de z = 3.49. Al aumentar el número de pruebas en una pregunta, y dar más peso a las puntuaciones más altas de confianza subjetiva, reflejando la calidad de la coincidencia entre la visión remota y una de las dos imágenes de blanco, el índice de éxito aumentó por encima del 70%. 181 preguntas dieron lugar a transacciones reales sobre futuros en los que se invirtió capital. De estas transacciones, el 60% dieron ganancias, que ascendieron aproximadamente a $146,587.30 USCy.
French
LES RESULTATS DE TREIZE ANNEES D’EXPERIMENTATION D’ASSOCIATIVE REMOTE VIEWING PAR GREG KOLODZIEJZYK
RESUME: Cet article présente les résultats de treize années d’expérimentation utilisant une approche unique du protocole d’associative remote viewing (ARV) qui permet qu’un seul opérateur puisse mener tout le processus d’ARV du début à la fin. Un total de 5 677 essais d’ARV furent conduits entre le 11 mai 1998 et le 26 septembre 2011. Parmi ces essais, 52,65 % prédirent correctement le résultat d’événements futurs associés (alors que, par le hasard seul, il peut être attendu un taux de succès de 50 %), d’où découle un score statistiquement significatif de z = 4.0. Ces 5 677 essais furent appliqués pour un total de 285 questions projectives. La plupart des ces questions projectives furent formulées pour prédire les résultats de marchés financiers. En tout, 60,3 % des questions projectives reçurent une réponse correcte, soit un résultat statistiquement significatif z = 3,49. En augmentant le nombre d’essais pour une question projective, et en donnant plus de poids aux scores de confiance subjective élevés reflétant la qualité de l’adéquation entre la vision à distance et l’une des deux images cibles, le taux de succès grimpe au-dessus des 70 %. Pour 181 questions projectives, des capitaux furent risqués sur des transactions financières réelles. En tout, 60 % de ces transactions furent profitables, permettant de gagner approximativement 113 282.67 €.