Embed Size (px)
Citation preview

Index
54 GreenLine User’s Guide
O Offload. See Readout Original plot scale, 33
P Panels: details, 27–28; plot, 23–27,
28, 49; points, 28–29, 32, 49 Plot: adjusting, 29–34; copying, 43;
customizing, 34–41; printing, 43; saving, 41
Plot menu, 30, 32, 33, 35, 37, 39, 40 Plot panel, 23–27, 28, 49 Points, 32, 33, 37, 38, 42, 48;
connecting, 33, 37; marking, 33, 38
Points panel, 28–29, 32, 49 Preferences, 3, 4, 10, 11, 13, 14, 19,
20, 22, 43, 45, 47, 50 Printing, 41, 43, 44; previewing, 43,
44
Q Quick tour, 5–8
R Reading out, 19–20 Requirements, 1 Restore plot scale, 33
S Series, 23, 24, 25, 26, 27, 28, 29, 30,
31, 32, 33, 35, 36, 37–39, 40, 41, 42, 47, 51
Smart scaling, 33 Statistics, 27, 28, 42, 43 Status, 14–19 Status bar, 4, 51 System requirements, 1
T Threshold. See Alarm lines Tick marks, 30, 31, 33, 34, 36, 37 Tiling windows, 27, 51, 52 Time, 10, 14, 17, 50 Time axis, 23, 35, 36, 39 Time format, 42, 43, 49, 50 Time zone, 19, 22 Title, 12, 16, 23, 35, 39–40, 51 Tools menu, 29, 30, 31 Tutorial. See Quick tour
U US units, 22, 25, 37
V Value axis, 23, 26, 32, 35, 36, 39 View menu, 23, 25
W Window menu, 27, 44, 45, 51, 52
Z Zoom tool, 30
Part #: MAN-BGL Doc #: 7965-A
onset computer corporation
Software for HOBO® U-Family Data Loggers & Devices
User’s Guide
TM
GreenLine

ii GreenLine User’s Guide
Thank you for purchasing Onset products. Our loggers and software are designed to be easy to use. For a quick start, please refer to the Quick tour of GreenLine on page 5. Consult the other sections of this manual or the online help for a more detailed description of software capabilities. Contact Information For support, please contact the company that you bought the products from: Onset Computer Corporation or an Onset Authorized Dealer.
Onset Computer Corporation 470 MacArthur Blvd. Bourne, MA 02532
Mailing Address: P.O. Box 3450 Pocasset, MA 02559-3450 Phone: 1-800-LOGGERS (1-800-564-4377) or 508-759-9500 Fax: 508-759-9100
Hours of Operation: 8AM to 5PM ET E-mail: [email protected] Main Onset Web site: www.onsetcomp.com FTP site: ftp.onsetcomp.com
If you purchased the products through an Onset Authorized Dealer, you can also refer to www.hobohelp.com for support information.
© 2003 Onset Computer Corporation. All rights reserved. Part #: MAN-BGL Doc #: 7965-A
Onset, HOBO, BoxCar, and GreenLine are registered trademarks or trademarks of Onset Computer Corporation. Microsoft and Windows are registered trademarks of Microsoft Corporation. All other trademarks are the property of their respective companies.
GreenLine User’s Guide 53
Index
A Alarm lines, 38, 39 Arcade zoom. See Zoom Arrow tool, 29–30 Axis, 23, 26, 27, 29, 30, 31, 33, 34,
35–37, 39
B Battery, 11, 12, 13, 15, 16, 25, 46 Blink device light, 4
C Cascading windows, 51 Checking status, 14–19 Clock, 17, see also Time Connect points, 33, 37 Connecting a logger, 3–4 Copying, 43 Crosshair tool, 31–32
D Date format, 42, 43, 49 Deployment number, 11, 15, 27, 48 Details, 42, 43, 48 Details panel, 27–28 Disconnecting a logger, 3, 47 Download. See Readout
E Edit menu, 43 English units. See US units Export, 42, 48–50
F File menu, 4, 11, 13, 14, 21, 22, 41,
42, 43, 44, 45, 51
G Graph. See Plot
H Hand tool, 31 Help menu, 2, 45, 50, 52
I Installation, 1–3
L Launching, 9–14 Legend, 23, 25, 29, 30, 32, 35, 37,
40–41 Light, 4, 14, 16 Lock axis scaling, 30, 31, 37 Logger: battery, 11, 12, 13, 15, 16,
25, 46; connecting, 3–4; disconnecting, 3, 47; launching, 9–14; multiple, 3–4; reading out, 19–20; status, 14–19; stopping, 20
Logger menu, 4, 9, 14, 19, 20
M Mark points, 33, 38 Metric units, 22, 25, 37 Microsoft Excel, 42–43 Minimum requirements, 1 Multiple loggers, 3–4

Chapter 4: Customizing GreenLine
52 GreenLine User’s Guide
Tip: You can open multiple copies of the same datafile to create different views of the plot, then use the Tile commands on the Window menu (or resize and move the windows manually) to see all of them at once. This is helpful if you want to zoom in on several different areas and view them side-by-side, or see the detail of a small area while the full plot is still in view.
• Windows. Lists the datafiles that are currently open. Switch between open datafiles by selecting from this list.
Help menu Use the Help menu to read documentation on software features and access the latest GreenLine news and software releases. The following selections are available from this menu:
• Help. Opens the help documentation with the Contents tab in view.
• Index. Opens the help documentation with the Index tab in view.
• Open Read Me File. Opens the Read Me file, which contains the most up-to-date information about installing and using GreenLine and the U-Family loggers.
• Visit www.onsetcomp.com. Provides a link to the main Onset
website.
• GreenLine on the web. Provides a link to the GreenLine webpage on the Onset website.
• Check for updates. Provides a link to the webpage on the Onset website that contains the latest GreenLine software downloads.
• About GreenLine. Opens a window with the GreenLine logo and version number of the software.
GreenLine User’s Guide iii
Software license agreement IMPORTANT, PLEASE READ CAREFULLY: THIS IS A LEGAL AGREEMENT BETWEEN YOU AND ONSET COMPUTER CORPORATION. BY INSTALLING, COPYING, OR OTHERWISE USING THE SOFTWARE PRODUCT, YOU ARE AGREEING UNCONDITIONALLY TO BE BOUND BY THE TERMS OF THIS LICENSE AGREEMENT, EVEN IF THIS LICENSE AGREEMENT IS DEEMED A MODIFICATION OF ANY PREVIOUS ARRANGEMENT OR CONTRACT. IF YOU DO NOT AGREE TO THE TERMS OF THIS LICENSE AGREEMENT, DO NOT INSTALL OR USE THE SOFTWARE PRODUCT AND PROMPTLY RETURN THE SOFTWARE PRODUCT TO THE PLACE YOU PURCHASED IT FOR A FULL REFUND.
1. For the purposes of this License Agreement, “Software” or “Software Product” refers to the computer software and associated media, printed materials, and “online” or electronic documentation, including any and all executable files, tutorials, help files, utilities, and other files that accompany this product.
The Software Product is owned by Onset Computer Corporation and is protected by United States copyright laws, international copyright treaties, and all other applicable national laws. Title, ownership rights, and intellectual property rights in and to the software shall remain with Onset Computer Corporation. The Software Product is licensed, not sold. There is no transfer to you of any title to or ownership of the Software, and this license shall not be construed as a sale of any right in the Software. You may not make additional copies of the software, except as provided for in paragraph number 2 below.
2. Grant of License. This Onset license agreement grants you the right to install and use one copy of the enclosed version Software Product on a single computer. The primary user of the computer on which the Software Product is installed may make a second copy for his or her exclusive use on a portable computer and/or home computer.
3. Other Restrictions. You may not reverse engineer, decompile, or disassemble the Software Product or make any attempt to discover the source code to the Software Product. Except as expressly permitted in this License Agreement or with written permission from Onset Computer Corporation, the Software may not be used, copied, redistributed, retransmitted, published, sold, rented, leased, marketed, sublicensed, assigned, transferred, altered, or modified.
The Software Product is licensed as a single product and its component parts may not be separated for use on more than one computer.
4. Support. Support for the Software Product is provided by the company from which you purchased it.
5. Liability. Other than as permitted by applicable law, in no event shall Onset Computer Corp. or its suppliers be liable for any direct or indirect damages whatsoever, arising out of the use, or inability to use this Software Product. In any case, Onset Computer Corporation and its supplier’s entire liability is limited to the amount actually paid by you for the Software Product.

iv GreenLine User’s Guide
Table of Contents
Chapter 1: Getting started ................................................... 1 Installing GreenLine ......................................................... 1
System requirements ......................................................... 1 Installation steps ................................................................ 1
Connecting a logger......................................................... 3 Connecting multiple loggers............................................... 3
Quick tour of GreenLine................................................... 5 Chapter 2: Working with a logger ....................................... 9
Launching......................................................................... 9 Launch window ................................................................ 10
Checking status.............................................................. 14 Reading out.................................................................... 19 Stopping ......................................................................... 20
Chapter 3: Working with a datafile ................................... 21 Opening datafiles ........................................................... 21 Viewing datafiles ............................................................ 23
Plot panel ................................................................... 23 Details panel .............................................................. 27 Points panel ............................................................... 28
Adjusting the plot ........................................................... 29 Arrow tool .................................................................. 29 Zoom tool .................................................................. 30
Hand tool ................................................................... 31 Crosshair tool ............................................................ 31 Connect points and mark points .......................... 33 Restore original plot scale .......................................... 33 Smart scaling ................................................................... 33
Chapter 4: Customizing GreenLine
GreenLine User’s Guide 51
• Smooth Plot Lines. When this setting is selected, series are drawn with smooth or anti-aliased lines in the Plot panel. This means that jagged edges in the series are replaced with smoother curves. This is recommended for use on higher speed computers only because it takes slightly longer to draw smooth plot lines.
• Enable all measurements by default in “Datafile Display Setup” window. When this setting is selected, all channels will be automatically selected in the Datafile Display Setup window. This means that all sensor and event series will be checked off by default every time you open a datafile or view a datafile after reading out a logger. When this setting is not selected, Dew Point (for loggers with both temperature and RH channels) and the End of File event are not checked off in the Datafile Display Setup window.
• Clear Recent Files. Click this button to remove all entries in the Recent Files list on the File menu.
• Map File Types. If double-clicking a .hobo file on the desktop does not automatically open GreenLine, click this button to associate the .hobo file extension with GreenLine.
Window menu Use the Windows menu to show or hide the toolbar and status bar, or organize several datafile windows. The following selections are available from this menu:
• ToolBar. Toggles whether the toolbar with the shortcut icons is displayed or hidden.
• Status Bar. Toggles whether the status bar at the bottom of the screen is displayed or hidden.
• Close All. Closes all open datafiles.
• Cascade. Layers the datafile windows so that you can see the title of each open .hobo file.
• Tile Horizontally. Arranges the open datafile windows horizontally.
• Tile Vertically. Arranges the open datafile windows vertically.

Chapter 4: Customizing GreenLine
50 GreenLine User’s Guide
• Time Format. Controls whether the time is displayed in a 12-hour or 24-hour format. The default is 12-hour.
• Time Separator. Controls whether a colon or period is used between the hours, minutes, and seconds in the time. The default is a colon.
• Use Asterisk (*) For Unit Degrees (°) Symbol. Controls whether an asterisk is exported in place of a degree symbol. The default is a degree symbol. If the degree symbol does not display correctly when you open the export file, use an asterisk instead.
Tip: The degree symbol will not appear properly when you open the export file in another program if the default text decoding is not UTF-8.
Miscellaneous tab The following preferences are available on the Miscellaneous tab:
• Show “GreenLine” Splash Screen on startup. When this setting is selected, an introductory screen with the GreenLine logo is displayed every time you open the software. This is the same screen that is displayed when you select About GreenLine from the Help menu.
GreenLine User’s Guide v
Customizing the plot ...................................................... 34 View properties ................................................................ 34 Axis properties ................................................................. 35 Series properties.............................................................. 37 Title properties ................................................................. 39 Legend properties ............................................................ 40
Saving ............................................................................ 41 Saving the .hobo datafile ................................................. 41 Saving the plot as an image............................................. 41
Exporting ........................................................................ 42 Exporting details text........................................................ 42 Exporting points ............................................................... 42
Copying .......................................................................... 43 Printing ........................................................................... 43 Closing datafiles............................................................. 44
Chapter 4: Customizing GreenLine .................................. 45 Preferences.................................................................... 45
Device Interaction tab ...................................................... 45 Exporting & Display tab.................................................... 47 Miscellaneous tab ............................................................ 50
Window menu ................................................................ 51 Help menu...................................................................... 52
Index .................................................................................... 53

vi GreenLine User’s Guide
Chapter 4: Customizing GreenLine
GreenLine User’s Guide 49
• Column Separator. This setting controls how the columns of text in the Points panel are separated in the export file. This setting also affects the default file type used when exporting points. When “comma” is selected as the column separator, the default file type is .csv, which can be imported automatically into Excel. When tab, space, or semicolon is selected for the column separator, the default file type changes to .txt instead of .csv, which requires additional adjustment within Excel. If you attempt to export to a .csv file using a tab, space, or semicolon column separator, the data will need clean-up in Excel.
• Separate Date and Time Columns. When this setting is selected, the Time column in the Points panel is divided into two columns: one containing the date and the other the time. If this setting is turned off, the date and time will be in one column, and the seconds may not automatically display in Excel (although you can format the time to display the seconds with Excel as described in Exporting points on page 42).
Date Time Display and Export Format The following settings affect the Points and Plot panels and exporting points. Other date and time displays in the software, such as in the Launch and Status windows, are controlled by your computer’s settings and are not affected by changes made to these options.
• Date Format. Controls how the date is displayed. The default format is Month Day Year. Alternatives are Day Month Year and Year Month Day.
• Show Full 4 Digit Year. When this setting is selected, all four digits in the year are displayed instead of the last two.
• Date Separator. Controls the punctuation used between month, day, and year in the date. The default separator is a slash /. Alternatives are a dash or a period.

Chapter 4: Customizing GreenLine
48 GreenLine User’s Guide
Export Settings The following settings are for exporting data points only. Changes to these settings have no effect on exporting details text.
• Export Serial #, Deployment #, and Description. When this option is selected, the logger serial number, the launch deployment number, and the description entered for the launch are exported along with the data. This is helpful if you are working with several exported files and want to keep track of which logger you used and the specific launch.
• Export Point Numbers. When this option is selected, the numbers associated with each data sample time (see the # column in the following example) are exported along with the rest of the data in the Points panel.
GreenLine User’s Guide 1
Chapter 1: Getting started
GreenLine™ is software for launching, reading out, and plotting data from HOBO® U-Family loggers. This chapter explains:
How to install and open the software
How to connect loggers to the computer
How to launch, log, and read out
Installing GreenLine
System requirements GreenLine requires:
• Microsoft® Windows® XP Professional or Home Edition, Windows 2000 Professional Edition, Windows ME, or Windows 98 Second Edition
• Microsoft Internet Explorer 5.01 or later
• Microsoft .NET Framework 1.1 (included on the GreenLine installation disk)
• USB port
• 800 x 600 display with 256 colors
• 128 MB RAM
• 2.9 MB free disk space after installing .NET
Tip: Refer to the Read Me file (under the Help Menu) for the most up-to-date information on installing and using the software.
Installation steps Important: If you are installing GreenLine on a computer with Windows 2000 or Windows XP Professional Edition, you must be logged on as the administrator for that computer. You may need to ask your system administrator for assistance.
Chapter 1: Getting started
2 GreenLine User’s Guide
To install the software from CD:
1. Insert the CD in your computer’s CD-ROM drive. The installation program should start automatically. If it does not, navigate to the CD drive in My Computer or Windows Explorer and double-click setup.exe to launch the GreenLine installer.
Tip: If Microsoft .NET Framework 1.1 is not already installed on your computer, the GreenLine installation program will ask if you want to install it now. Click Yes and follow the prompts to install .NET. After .NET is installed, navigate to the CD drive in My Computer or Windows Explorer and double-click setup.exe to re-launch the GreenLine installer.
2. Read the Welcome screen and click Next.
3. Read the License Agreement screen, select I Agree (if applicable), and click Next.
4. Select the location where you want to install GreenLine, or accept the default directory (C:\Program Files\Onset Computer Corporation\GreenLine). If you are using the Windows 2000 or Windows XP operating system, select whether you want to install GreenLine for Everyone (all users who can log onto the computer) or Just Me (your login account will be the only one that shows a shortcut to GreenLine on the desktop). Click Next.
5. Read the Confirm Installation screen and click Next. This installs GreenLine, release notes, and sample .hobo datafiles.
6. Read the Read Me file displayed on the GreenLine Information screen. (You will also be able to access this file from the Help menu in GreenLine.) Click Next.
7. When you reach the Installation Complete screen, click Close.
8. Open GreenLine using one of the following methods:
• Double-click the GreenLine icon on the desktop
• From the Start menu, select Programs, Onset GreenLine, GreenLine
Chapter 4: Customizing GreenLine
GreenLine User’s Guide 47
Readout • Ask to “Stop” logging before reading out a running logger.
When this option is selected, a prompt appears every time you read out a logger, asking whether you want to stop the logger or let it continue logging data during readout.
• Automatically ask to “Save” datafile after a successful “Readout.” When this option is selected, you will be prompted to save the .hobo datafile after the data is read out from the logger and before you select the series to view in the plot.
• Compatible “Readout” Mode. This preference should only be selected if you are having communication problems with the logger. Communication between the computer and the logger is slower when this option is selected.
Status • Show the “Status” window after “Launch” and “Stop”
commands. When this option is selected, the logger status is displayed after you launch or stop the logger.
• Close the “Status” window on logger disconnect or communication error. When this option is selected, the status window closes automatically if it is open when you remove the USB interface cable from the logger, or if communication is interrupted for another reason.
Exporting & Display tab The following preferences are available on the Exporting & Display tab:

Chapter 4: Customizing GreenLine
46 GreenLine User’s Guide
Contact • Show devices window on any device operation (“Launch”,
etc…) if two or more devices are found, even if one is already selected. When this option is selected and two or more loggers are connected to the computer, a window listing all connected loggers will appear any time you choose a command, such as launch, readout, status, and stop. This allows you to choose the device you want to work with before continuing with the command.
Launch • Show notice if deployment duration exceeds estimated logger
battery life. When this option is selected, a warning appears when you launch the logger if the estimated duration (based on logging interval) will exceed the battery life.
• Default to “Start At Interval” instead of “Start Now” in Launch window. The default launch mode is Start Now. Selecting this option changes the default launch mode to Start At Interval. However, if the most recent launch was a delayed start or a button start, then that will be the default launch mode until you choose either Start At Interval or Start Now again.
Chapter 1: Getting started
GreenLine User’s Guide 3
9. Connect your loggers as described in the Connecting a logger discussion.
Connecting a logger After you have installed GreenLine, you can connect your loggers at any time. However, it may take a few moments for your system to recognize a logger when you connect it for the first time. To avoid delays, you may wish to connect all of your loggers as soon as the installation is completed.
Tip: Refer to the Read Me file (under the Help Menu) for the most up-to-date information on connecting loggers to your operating system.
GreenLine supports the HOBO U-Family data loggers, which communicate with the computer by connecting to a USB port. Use the USB interface cable included with the GreenLine starter kit to connect the logger to the USB port.
1. Open the GreenLine software application.
2. Plug the large end of the USB interface cable into a USB port on the computer.
3. Plug the small end of the USB interface cable into the bottom of the logger.
4. If the logger has never been connected to this computer before, it may take some time for the computer to detect the new hardware and report that it has connected successfully. One or more messages will appear, indicating that new hardware has been found. Depending on your operating system, you may also hear a chime. At this point, you can begin using the logger.
5. Wait a few moments before connecting the next logger.
6. To disconnect a logger, simply remove it from the USB cable. Wait a few moments before connecting another device.
Connecting multiple loggers If the computer has more than one USB port, you can connect multiple U-Family loggers at the same time. When multiple loggers are connected, the following window opens every time you select the Launch, Readout, Stop, or Status command (unless you’ve changed the default Preference setting as explained in the tip in this section):

Chapter 1: Getting started
4 GreenLine User’s Guide
The selected logger is indicated by a checkmark. Click a logger from the list to select it, then click OK. The launch, readout, stop, or status process will continue with the selected logger.
If there is a light on the side of your logger, click the Blink Device Light button to verify that you’ve selected the appropriate logger. This briefly illuminates the light on the logger that you’ve selected.
If your logger doesn’t have a light, simply check the serial number (SN) on your logger to make sure that it matches the logger that’s marked in this window.
You can also check the status bar at the bottom of the screen to quickly determine which logger is selected. The left side of the status bar indicates the type and serial number of the logger; the right side indicates the total number of loggers connected.
To access the Currently Connected Devices window at any time, click the Select Device icon on the toolbar. Or, click the Logger menu, then click Select Device.
Tip: If you’d rather not see the Currently Connected Devices window each time you launch, read out, stop, or check the status when multiple loggers are connected, use the Preferences to turn off the feature. From the File menu, select Preferences and then clear the checkmark next to “Show devices window on any device operation” on the Device Interaction tab. The selection window will then display automatically only when more than one device is connected and no device is selected. You can still access the window manually by clicking the Select Device icon .
GreenLine User’s Guide 45
Chapter 4: Customizing GreenLine
This chapter explains how to:
Use the Preferences to customize the software
Adjust the display with the Window menu
Use the Help menu to access online help and the latest information available on the GreenLine website
Preferences Preferences are settings that you can adjust to customize the software. To change preferences:
1. From the File menu, select Preferences.
2. Make the changes and click OK.
To return the Preferences to the original settings:
1. From the File menu, select Preferences.
2. Click the Set Preferences to Default button.
3. A warning appears indicating that this change cannot be undone. Click Continue.
The following sections explain the settings on each of the tabs in Preferences.
Device Interaction tab The following preferences are available on the Device Interaction tab:

Chapter 3: Working with a datafile
44 GreenLine User’s Guide
1. From the File menu, select Page Setup.
2. Change the paper type, orientation, and margins as necessary and click OK.
To preview how the plot will look on the page:
1. From the File menu, select Print Preview.
2. Zoom in as necessary, then click the Printer icon to print directly from Print Preview. Or, click Close to exit the preview window without printing.
Closing datafiles To close a .hobo datafile, click the File menu and select Close, or click the X button in the upper right corner associated with the entire file (not the X for a single panel). When the datafile is maximized, this is the X on the menu bar.
To quickly close all open datafiles, click the Window menu and select Close All.
If you attempt to close a datafile that has not been saved, a message appears asking if you wish to save the file. Unless you are sure you do not need the data, it is strongly recommended that you save the file.
Keep in mind that if you’ve read out the same logger multiple times, there will be several different datafiles, each of which must be saved individually.
Click here to close the Plot panel
Click here to exit GreenLine
Click here to close the datafile
Chapter 1: Getting started
GreenLine User’s Guide 5
Quick tour of GreenLine After you’ve installed and opened the GreenLine software and connected a logger as described earlier in this chapter, follow these steps for a quick demonstration of launching and collecting data with a logger:
1. Click the Launch icon on the toolbar. This displays the logger’s Launch window. Launch windows vary slightly for each type of logger, but most look something like this:
2. Review the default Launch settings and change them if you wish.
Enter a new name in the Description field, and select or deselect various Channels to Log (if available) in addition to temperature. Set a short (five seconds or less) Logging Interval, and choose the Start Now option.
Tip: Launch settings are discussed in depth in Chapter 2: Working with a logger.
3. Click Start to begin logging.

Chapter 1: Getting started
6 GreenLine User’s Guide
4. Wait a minute or two. While you’re waiting, watch the Status window as it updates the numbers in real time.
5. If there is a button on your logger, press and hold it down for
several seconds. Watch the Current States in the Status window change to Button Down. Release the button.
6. Warm the logger by holding it your hands for approximately one minute. Watch the Logged Readings in the Status window change as the logger warms up.
7. Close the Status window by clicking the X icon in the upper-right corner.
8. Click the Stop icon on the toolbar to stop the logger.
Chapter 3: Working with a datafile
GreenLine User’s Guide 43
1. Adjust the time column so you can see the whole date/time.
2. Select the time column from row 2 down.
3. From the Format menu, click Cells.
4. "m/d/yyyy h:mm" should appear in the Type field on the Number tab. If it does not, select the Custom category and then select m/d/yyyy h:mm as the type.
5. Add ":ss" to the end of the string in the Type field:
m/d/yyyy h:mm:ss 6. Click OK. The seconds should be listed automatically.
Tip: From the File menu, select Preferences and choose the Exporting & Display tab to change the default export settings, such as date and time format and separators.
Copying You can copy the information in the Details panel as text for pasting into documents, programs, or email. From the Edit menu, select Copy Details as Text.
You can also copy the plot as a bitmap or metafile for pasting into other programs and documents. The plot must be visible. From the Edit menu, select either Copy Plot as Bitmap or Copy Plot as Metafile:
• Metafiles are resolution independent and look good on laser printouts. They can be pasted into other applications, like Microsoft Word or PowerPoint, that support metafiles.
• Bitmaps retain the resolution of the screen and look better on screen for websites and other display-only presentations.
Printing You can simply print the plot that’s displayed in the Plot panel, or you can set up the page and preview it before printing.
To print the plot:
1. From the File menu, select Print Plot, or choose the Printer icon on the toolbar.
2. Select the appropriate printer, if applicable, and click OK.
To set up the paper for printing:

Chapter 3: Working with a datafile
42 GreenLine User’s Guide
4. Under Save File as Type, select one of the supported image types (.bmp, .jpg, .tif, .gif, .png) and click Save.
5. Insert the image into a document, or open it in a graphics editor.
Exporting You can export the details associated with the datafile and the points being viewed in the Points panel as text files for importing into other programs.
Exporting details text Export the launch information that’s visible in the Details panel to a text file. To export details:
1. Open a datafile.
2. From the File menu, select Export Details Text.
3. Accept the default file name, or type a new name and click Save.
Details are exported to a .txt file, which can be opened in any text editor, such as Microsoft Notepad or Microsoft Word, or imported into a spreadsheet program, such as Microsoft Excel.
Exporting points Export the points from the datafile to a text file (.csv or .txt) for importing into Microsoft Excel and other spreadsheet applications. Only the series that are currently displayed in the Points panel are exported. To export points:
1. Open a datafile. In the Datafile Display Setup window, choose the sensor channels and events you wish to export.
2. From the File menu, select Export Points as Excel Text or click the Export icon on the toolbar.
3. Accept the default file name or type a new name.
4. Under Save as File Type, choose either .csv or .txt. A .csv file is a text file that is already formatted to open properly in an Excel spreadsheet. A .txt file will require that you specify import settings to view it in Excel. Click Save.
5. Open the file in Microsoft Excel.
Dates and times for each data point may initially appear as #######. Times also may not have seconds listed. To display the full date and time with seconds:
Chapter 1: Getting started
GreenLine User’s Guide 7
9. Click the Readout icon on the toolbar. GreenLine prompts you to save the datafile. Click Save.
10. Review the settings on the Datafile Display Setup window. At a
minimum, the Temperature channel and the button events (if applicable) should be selected. Click OK.

Chapter 1: Getting started
8 GreenLine User’s Guide
11. View the results of your deployment. Your screen will not match this example exactly, but you should see Button Up and Button Down events (if applicable) and the graph should show that the temperature increased when you warmed the logger with your hands.
12. Use the items on the toolbar to experiment with the many viewing
and customization tools available within GreenLine.
Tip: Viewing and customization options are discussed in depth in Chapter 3: Working with a datafile.
Points panel: Lists the data recorded by the logger in a table.
Status bar: Shows which logger you are currently working with and how many loggers are connected.
Plot panel: Displays a graph of the data recorded by the logger.
Menu bar: Use the menus to access all of GreenLine’s features.
Toolbar: Click the icons to quickly access the most frequently used functions in GreenLine.
Details panel: Lists information about the launch.
Chapter 3: Working with a datafile
GreenLine User’s Guide 41
Tip: To change the color of the series, modify the Series Properties (double-click the series with the arrow tool). By default, Show Series Colors is selected.
• Color: Select a color for the border (if Show Border is selected) and the legend title (if any). The default border color is black.
Saving There are two types of saving you can do in GreenLine:
• Saving the datafile with a new name
• Saving the plot as an image
Important: Changes made to the plot are not retained when you save the datafile with a new name. However, you can save an image of the plot for viewing later in other programs.
Saving the .hobo datafile To save a .hobo datafile with a new name:
1. Open a datafile.
2. From the File menu, select Save HOBO Datafile As.
3. Type the new name for the file and select a new location if necessary.
4. Click Save.
Tip: The Save command saves only the datafile. Use Save plot image to save changes made to the plot.
When you save the datafile with a new name, the version with the old name closes automatically, leaving open the file with the new name.
Saving the plot as an image You can save the plot as an image for viewing in other programs or printing. This is helpful when you customize the plot and want to save a copy of the revised graph.
1. Open a datafile and change the plot as desired.
2. From the File menu, select Save Plot Image.
3. Accept the default name or type a new name.

Chapter 3: Working with a datafile
40 GreenLine User’s Guide
• Font: Select a default Font type, size, and appearance. The default font is Arial 12 pt Bold.
Tip: To show or hide the title on the plot, click the Plot menu and select Show Title.
Legend properties The legend is the area on the plot that lists the keys for each series (line colors and marker types). If the crosshair is in use, it also lists the date, time and point values currently selected by the crosshair.
Tip: To quickly hide or display the legend, click the Plot menu and select Show Legend.
To change the legend properties, double-click the legend on the plot. Or, from the Plot menu, select Plot Properties, then select Legend Properties.
The following options are available in Legend properties:
• Name: Enter up to a 40-character title for the legend. There is no default name.
• Location: Move the legend to either the left or right side of the plot. By default, the legend appears on the right.
• Show Border: Toggles whether a box is drawn around the legend. By default, a border is shown.
• Show Series Colors: Toggles whether the legend displays the different colors associated with each of the series and events. This does not change the appearance of the series themselves, only the legend key.
GreenLine User’s Guide 9
Chapter 2: Working with a logger
Use GreenLine to set up a U-Family logger for deployment and then offload the data. This chapter explains how to:
Launch the logger
Check the logger status
Read out (offload) data from the logger
Stop the logger
Launching To set up a logger to record data, you must specify several parameters and start, or launch, the logger. To launch a logger:
1. Connect the logger to the PC with the USB interface cable.
2. From the Logger menu, select Launch, or click the Launch icon on the toolbar.
3. Different messages may appear depending on the state of the logger. Answer each of the prompts accordingly.
• A warning appears if the logger has already been launched. Click Yes to end the deployment already in progress and set up a new launch, or click No to proceed to the launch screen without stopping the existing deployment. If you choose No, the logger will continue with the existing deployment, and current readings in the launch screen may not be accurate.
• A warning appears if the logger has not been read out. Click Continue to proceed to the launch screen, or click Cancel to read out the data first.
Tip: Because loggers are tested before shipping, there may be a datafile on your logger when you first launch it. It is not necessary to read out this datafile. Click Continue to proceed.

Chapter 2: Working with a logger
10 GreenLine User’s Guide
• If a file is attached to a logger from a previous launch, a message prompts you to retain the file for the next launch or remove it.
4. Once in the Launch window, configure the launch:
• Enter a launch description
• Attach a file with additional launch notes if desired
• Select the data channels you want the logger to record
• Set the logging interval
• Choose the start mode for the launch — immediate, interval, delayed, or button (if available)
For details on each of these parameters, refer to the following Launch window section.
5. Check the time displayed in the Launch window and ensure that it is correct. If it is not, update it manually or synchronize it with an online time server (if available).
6. Start the launch. Once the logger is successfully launched, the status window appears by default.
Tip: If you don’t want the status window to display after each launch, clear the checkmark next to “Show the Status window after Launch and Stop commands” in the Preferences window.
Once the logger is launched, it will continue logging until you stop it, the memory fills, or the battery fails.
Launch window This is an example of a Launch window for a HOBO U12 Temp/RH/2 Ext data logger. The Launch window for other loggers may be slightly different. The top half of the window displays details about the logger, including logger type, remaining battery capacity, and real-time readings for all enabled channels. The bottom half is for entering launch parameters.
Chapter 3: Working with a datafile
GreenLine User’s Guide 39
For Min Line, enter a value relative to the series where you want the minimum (blue) alarm line to appear.
If the points never go above the maximum value or below the minimum value, the alarm lines won’t be displayed on the plot even though Show Alarm Lines is selected.
• Value Axis: Changes the type of axis being used for the series. Choose one of the axes already in view, or select New Axis to create your own.
• Time Axis: Allows you to create an additional time axis for another series.
• Color: Changes the color used for the series. The default color varies depending on how many series are displayed on the plot.
Title properties The title is the name for the plot. To change the title properties, double-click the title on the plot, or from the Plot menu, select Plot Properties, then select Title Properties.
The following options are available in Title properties:
• Name: Enter up to an 80-character title for the plot. By default, the name is the description entered when launching the logger.
• Location: Move the title to either the top or bottom of the plot. The default location is the top of the plot.
• Color: Select a color for the title. The default color is black.

Chapter 3: Working with a datafile
38 GreenLine User’s Guide
at once). Connect Points is selected by default for a series with sensor data; it is not selected for a series with event data.
• Style: Changes the appearance of the line used to connect the points in a series. The default varies depending on how many series measuring the same property are being viewed.
• Width: Changes the size or weight of the line used to connect the points in a series. The default is 1.0 point.
• Connect as Steps: Toggles whether the lines between the points in a series are connected as a curve or a step. When Connect as Steps is selected, the line drawn between points keeps the value of the previous point until the next point in the series. This is useful for state or event sum plots. Connect as Steps is not selected by default.
• Mark Points: Toggles whether a marker appears at each data point in this series only (the Mark Points icon on the toolbar affects all series at once). By default, Mark Points is selected for any series with event data, and for any series with only a few points of sensor data. To avoid cluttering the plot, Mark Points is not selected by default for a series with many points of sensor data. Series that consist of only one point are always marked.
• Marker: Changes the shape of the marker used. The default marker varies depending on how many series are being viewed.
• Point size: Changes the point size for the marker. The default point size is 3.
• Spacing: Changes the distance between markers. Use spacing when point markers are too close together to distinguish. Instead of displaying a marker for each data point, spacing determines the width (in pixels) between visible markers. This is useful for black and white printers. Spacing is turned off by default (the value is 0). Spacing only works when Connect Points is enabled.
• Show Alarm Lines: Toggles whether red and blue alarm lines are shown on the plot for this series. Use an alarm line when you want to indicate a visual threshold over or under which data may be falling (for example, if you want to quickly see how many points fall below 32 degrees). Alarm lines are turned off by default. To show alarm lines, click the Show Alarm Lines box and fill in the Max Line and/or Min Line fields.
For Max Line, enter a value relative to the series where you want the maximum (red) alarm line to appear.
Chapter 2: Working with a logger
GreenLine User’s Guide 11
The following table explains the elements in the Launch window.
Launch window item Description Serial Number
Serial number of the logger. Note that external probes also have serial numbers, which are not listed in the Launch window.
Deployment # Number of times (including this time) the logger has been launched. Each time you start a new launch, the deployment number increases by one.
Battery Status Gauge or indicator (depending on the logger type) that warns when battery power becomes low. Consult the logger documentation for specifics on battery capacity. Tip: You can configure GreenLine to display a warning when the launch duration is estimated to exceed the remaining battery life (calculated for the logging interval you select). This is a helpful reminder for you to change batteries before long deployments. To enable this feature, click the File menu, then select Preferences. Click the
Use the top half of the Launch window to check current information about the logger
Use the bottom half of the Launch window to configure the launch

Chapter 2: Working with a logger
12 GreenLine User’s Guide
Launch window item Description
checkbox next to “Show notice if deployment duration exceeds estimated logger battery life.”
Current Readings
Real-time sensor readings for the channels you have selected. To change the channels listed here, select different Channels to Log in the lower half of the Launch window. These readings may not be accurate if the logger is recording data; use the Status window instead for more accurate real-time readings while logging is in progress.
Current States
Current state of the logger in terms of events. If your logger has a button, most often the current state will be Button Up, meaning the button is not being pressed.
Last Events Most recent event(s) detected by the logger. The most frequent events you will see in the Launch screen are Host Connected, Button Up, Button Down, and <none>. For more details on events, see Sensor and event samples on page 24.
Description Enter up to a 40-character description of the launch in this field. This description is used as the default file name when you read out and save the data recorded by the logger. It is also the default title of the plot.
Attach File Allows you to store a file of up to 10% of the logger’s memory size. For a 64K logger, this is about 6553 bytes (approximately two pages of text). Although any file type can be attached, this is mostly recommended for .txt files so that you can enter information about the launch. Because an attached file takes up a portion of the memory normally used to store data, the maximum estimated logging duration is decreased.
Once a file is attached, a paperclip button appears on the Launch window. Any time you read out the logger, the attachment is saved with the datafile. The attachment will continue to be stored with the logger on subsequent launches unless you remove it when prompted or by clicking the Remove File button.
Channels to Log
Select the data channels you want the logger to record. Some general information is given below, but you should always refer to the documentation that came with your logger for detailed information about the channels that are available to you. Some loggers with RH sensors require that you also
select the internal temperature channel in order to log
Chapter 3: Working with a datafile
GreenLine User’s Guide 37
• Lock Axis Scaling and Tick Marks: Toggles whether the axis and associated tick marks remain in the original position when zooming or navigating with the hand tool. Locking the axis and tick marks helps to avoid inadvertently zooming or navigating to an area on the plot without data.
Series properties The series is the group of data points for the channel you selected to display in the plot. To change series properties, double-click the series you wish to modify. Or, from the Plot menu, select Plot Properties, then select a series.
Tip: Asterisks next to the field names indicate that a tool tip with more information is available; place the mouse cursor over the field name to read the tip.
The following options are available in Series properties.
• Name: Enter up to a 40-character name for the series. The series name is displayed in the legend. The default name for a series with sensor data is the property that was measured, the units used to display the measurements, and the channel number assigned to the property. The default name for a series with event data is the type of event.
• Connect Points: Toggles whether the points in this series only are connected (the Connect Points icon on the toolbar affects all series

Chapter 3: Working with a datafile
36 GreenLine User’s Guide
• Name: Enter up to an 80-character name for the axis. The default name for a value axis is the unit type (for example, “°F” is the name for a temperature axis and “%” is the name for an RH axis). The time axis does not have a default name.
• Max: Enter the maximum value you want displayed for the axis. For the time axis, you can select a date and time.
• Min: Enter the minimum value you want displayed for the axis. For the time axis, you can select a date and time.
• Location: Change the location of the axis. The time axis can be located at the top or bottom. The value axes can be located on the left or right.
• Show Gridlines: Toggles whether gridlines are displayed in the background on the plot. By default, gridlines are shown for the time axis only.
• Hide Axis: Toggles whether the axis is displayed on the plot or temporarily hidden. All axes are visible by default.
• Color: Changes the color of the axis. Black is the default color for the time axis. The color of the value axis matches the series color by default.
• Auto-calculate tick marks or custom tick marks: Tick marks are the lines that represent values on the axis. Numbers or values are listed next to major tick marks; minor tick marks are not numbered. By default, tick marks are automatically calculated for both the time and value axes. Choose the Custom Tick Marks option to specify different major and minor tick marks for the axis.
Chapter 2: Working with a logger
GreenLine User’s Guide 13
Launch window item Description
humidity. When both the internal temperature and RH channels
are selected, dew point is automatically calculated. For loggers with external channels, you must select
the appropriate description of the probe that is inserted to ensure data is accurate during logging. The probe part number is listed on the shrink tube on the probe cable; make sure it matches the description you select.
If you select an external channel, but do not plug the probe in, false data will be recorded for that channel.
In addition to the internal sensors and external probes, you can select the Logger’s Internal Battery channel. This records the logger’s battery voltage at each sample time. Tip: This feature can be useful when you need to verify that the logger had sufficient power to gather accurate data, especially in harsh conditions (i.e., long exposure in a cold environment) that can affect battery performance. However, like the other data channels, the internal battery channel consumes some of the logger’s memory. Unless you suspect abnormal battery performance, the Battery Status and Max Duration indicators may provide all the information you need.
If you do not select any channels to log, the logger will record events only. For more details on events, see Sensor and event samples on page 24.
Logging Interval
Choose the rate at which you want the logger to record data. The minimum logging interval is one second and the maximum is 18 hours, 12 minutes, and 15 seconds. Choose one of the predefined logging intervals from the list, or select Custom and enter your own logging interval. The faster the logging interval, the more quickly the memory will fill and the battery will be depleted.
Max Duration Approximately how long it would take to fill the logger memory based on the logging interval you select. This is a theoretical estimate only; battery life and frequent event logging will limit your deployment. Tip: You can configure GreenLine to display a message when it is estimated that the battery may not last for the maximum duration. From the File menu, select Preferences. On the Device Interaction tab, click the

Chapter 2: Working with a logger
14 GreenLine User’s Guide
Launch window item Description
checkbox next to “Show notice if deployment duration exceeds estimated battery life.”
Start Mode There are several ways to start the logger: Start Now. Logging begins as soon as you click the
Start button. Start At Interval. Logging will begin at an exact
interval (for example 9:00:00 rather than 8:59:35 when you choose a one-minute logging interval). The exact start time depends on the logging interval you choose.
Delayed Start. Logging will begin at a date and time you specify (within approximately six months).
Button Start. (Available only on loggers that have buttons.) Logging will not start until you press the button on the logger and hold it down for at least three seconds. The light on the logger will flash quickly when logging begins.
Tip: Unless Delayed Start or Button Start was selected in the previous launch, the start mode defaults to Start Now. Use the Preferences to change the default start mode to Start at Interval. From the File menu, select Preferences. On the Device Interaction tab, click the checkbox next to “Default to ‘Start At Interval’ instead of ‘Start Now’ in Launch Window.”
Checking status Use the real-time status display to check the state of the logger, when logging will begin, how much time remains before the next sample, how full the logger memory is, etc.
To check the status of the logger:
1. Connect the logger to the PC with the USB interface cable.
2. Check the time displayed on your PC’s screen and ensure that it is correct. If it is not, update it manually or synchronize it with an online time server (if available).
3. From the Logger menu, select Status. Or, click the Status icon on the toolbar.
By default, the logger status is also displayed after launching or stopping a logger. To change this, click the File menu and select Preferences. Clear the
Chapter 3: Working with a datafile
GreenLine User’s Guide 35
arrow tool. Or, from the Plot menu, select Plot Properties, then select View Properties.
The following options are available in View properties:
• Show Legend Box: Toggles whether the legend is displayed on the plot. The legend is shown by default.
• Show Title: Toggles whether the title is displayed for the plot. The title is shown by default.
• Show Border: Toggles whether a border is displayed around the entire plot. By default, a border is not shown.
• Show Filled: Toggles whether the plot is filled in with a color in the background behind the series. By default, the plot is not filled in.
• Border/Fill Color: If the Show Border or Show Filled options are selected, select the color you want to use (both options use the same color). The default color is black.
Axis properties There are two types of axes: time axes and value axes. The time axis is the x axis, which lists the dates and times for the datafile. The value axis is the y axis, which lists the range of values for the sensor channel (for example, the temperature axis displays degrees in Fahrenheit or Celsius). The plot can contain several value axes depending on the number of series displayed. To change the axis properties, double-click the axis you wish to modify with the arrow tool, or from the Plot menu, select Plot Properties, then select an axis.
The following options are available in Axis properties:

Chapter 3: Working with a datafile
34 GreenLine User’s Guide
Applying SmartScale to the plot shifts the scale so that the temperature axis ends on major tick marks.
Customizing the plot You can change many different aspects of the plot as you analyze the data. This section describes modifying the properties for all the elements of the plot.
Important: Changes to the plot are not saved with the datafile. However, you can save an image of the plot for viewing later with other programs. For details, see Saving the plot as an image on page 41.
View properties The view controls the general aspects of the plot. To change the view properties, unselect all plot elements, then double-click the plot with the
After zooming in on this plot, the temperature axis ends on minor tick marks (major tick marks have numbers)
The temperature axis ends on major tick marks after selecting SmartScale.
Chapter 2: Working with a logger
GreenLine User’s Guide 15
checkmark next to “Show the Status window after Launch and Stop Commands.”
The status window displays real-time information about the attached logger. You can check the status for a logger whether it is waiting for logging to begin, actively logging, or stopped. In the following example, a HOBO U12 Temp/RH/Light/External logger has just started logging and is in between samples. The logger’s battery still has most of its charge.
Important: Battery power is drained more rapidly while checking the real-time status. Keep this in mind when frequently checking status during a deployment.
The following table explains the items in the Status window.
Status window item Description Serial Number Serial number for the logger. Deployment # Number of times the logger has been launched. The
number listed is for the most recent launch. Battery Status Gauge or indicator (depending on the logger type) that
warns when battery power becomes low. Consult the logger documentation for specifics on battery capacity.

Chapter 2: Working with a logger
16 GreenLine User’s Guide
Status window item Description Description Description entered when the logger was last launched.
This description will be used as the default file name and the title in the plot.
If a file is attached to the logger, a paperclip button appears next to the Description. Click this button to save the attachment to the computer. Logging continues while the attachment is saved.
Status Messages that describe the state of the logger: Counting down delay to start logging. The logger
will begin recording data at a specific time because either Delayed Start or Start at Interval was chosen at launch.
Full. The logger has reached its memory capacity and is no logger recording data.
Logging. The logger is actively recording data. The status also indicates whether the logger is between samples or storing samples.
Not read out. New data has been recorded and not yet read out. The logger may already have been read out during this deployment, but newer data has since been logged.
Power reset. The logger experienced a significant drop in power since it was last launched. The battery may have been changed, or the logger may have been dropped or damaged. If you didn’t change the battery recently, you should inspect the logger for signs of damage or corrosion. If a reset takes place during a deployment, the logger stops. The datafile is not affected, so you can still read out the data that was collected before the reset.
Stopped. The logger is no longer recording data. Waiting for 3 second button push to start
logging. The logger has been launched with a button start (if available). Press and hold down the button on the logger for three seconds to begin logging. The light on the logger will flash quickly when logging begins.
Chapter 3: Working with a datafile
GreenLine User’s Guide 33
Connect points and mark points When Connect Points is selected, a line connects each data point in a series. When Mark Points is selected, a shape is drawn around each point on the graph. This option is useful for series that have few individual points.
By default, series with sensor data are connected and events are marked. From the Plot menu, select Connect Points or Mark Points, or click the icons on the toolbar to toggle whether the points are connected, marked, or both. If both options are turned off, series can be temporarily hidden. You cannot unmark or connect points on a series with only one point.
Tip: You can change the type of line used to connect the points or the shape used to mark the points. From the Plot menu, select Plot Properties and choose the series you wish to change. For more details, see Series properties on page 37.
Restore original plot scale You can easily revert to the original scale used when the plot was first opened. This is very helpful when you’ve zoomed in several times and want to quickly go back to the original scale. From the Plot menu, select Original Plot Scale or click the Restore Plot icon on the toolbar. Any customizations to properties and crosshair location are retained when you return to the original plot, but this removes any adjustments to the view that you made by zooming or dragging with the hand tool.
Smart scaling In some plots, the numerical bounds of the axes may not be on “round” numbers. Use smart scaling to adjust the axes to end on major tick marks. From the Plot menu, select SmartScale Plot.
For example, notice how the Temperature axis does not end on major tick marks after zooming in on this plot.

Chapter 3: Working with a datafile
32 GreenLine User’s Guide
The plot changes in several ways when the crosshair is in use. If the crosshair intersects a data point, a square surrounds the data point. The intersection points are also marked by small arrows on the left and right value axes.
The Points panel shifts to the row (marked by an arrow in the left column) that contains the data points. If the legend is displayed next to the plot, the point values for each series are updated to reflect the crosshair location. Values are listed in the legend differently depending on whether the data is a logged sample or an event:
• Values that are not in parentheses are actual data points logged at the time selected by the crosshair.
• Values in parentheses are estimated because there were no exact values for the series at the time selected by the crosshair. Zoom in or move the crosshair to see actual values.
• A value of “…” indicates that there is no series data during the time selected. This is seen most frequently for events. If the time selection falls within an event series, but does not contain an event, parentheses surround the “…” value.
• A value of “true” indicates the event happened at the selected time.
To remove the crosshair, click the Plot menu and select Remove Crosshair.
Crosshair
Values for the time and date selected by the crosshair are listed in the legend and highlighted in the Points panel.
Squares on the crosshair and arrows on the left and right axes indicate where the crosshair intersects the data series
Chapter 2: Working with a logger
GreenLine User’s Guide 17
Status window item Description Logger Launched
Date, time, time zone, and offset to Universal Coordinated Time (UTC), also known as Greenwich Mean Time (GMT), when the logger was last launched. This is not necessarily the time when the first sample was recorded; it is the time all of the launch parameters were loaded in the logger.
Display Time As
Allows you to switch between the time according to the logger’s internal clock and the time according to the computer when the logger is launched. When the logger is stopped, you can only display the time according to the computer. The time this selection refers to is listed in the Interval section of the Status screen. Note: Asterisks next to the field names indicate that a tool tip with more information is available. Place the mouse cursor over the field name to read the tip.
Time Difference
When the logger’s internal clock is running, this shows you the difference (if any) between the logger clock and the computer clock.

Chapter 2: Working with a logger
18 GreenLine User’s Guide
Status window item Description Interval This section of the Status window displays the following:
Deployment Date and time the first sample was recorded, and the estimated date and time for the last sample based on the logging interval in use. It also displays the memory capacity two ways: how many bytes have been used out of the total bytes of memory available, and the percentage of the logger's memory that is full. In this example, only 1034.5 out of 65536 bytes of memory have been used in this deployment, which means the logger is only 1.58% full.
If no channels are selected at launch, “Event dependent” is listed for the first and last samples instead of dates and times.
The current time according to either the logger or the host computer as selected in “Display Time As”
The time when data will be recorded next
The time when data was last recorded
If the logger is recording data, this is the time until the next sample, followed by the logging interval. In the example above, 22 seconds remain until the next sample, and samples are logged every 30 seconds. If the logger is waiting to start at an interval or at a specific time, this is the countdown to the first sample. In the example below, there are 13 minutes and 39 seconds until the first sample at 4:00.
Chapter 3: Working with a datafile
GreenLine User’s Guide 31
Hand tool Use the hand tool to move different areas of the plot into view. This is particularly useful when you are zoomed into the plot and want to see another section of the plot without zooming out and then zooming back in on the new location. There are several ways to select the hand tool:
• From the Tools menu, select Hand Tool; or
• Click the Hand tool icon on the toolbar; or
• Press the spacebar on your keyboard
Then:
• Click within the plot and hold down the left mouse button to drag a different section of the plot into view. The plot follows the movement of the mouse, and the axes are continuously updated in response to the movement. To stop dragging, release the left mouse button.
• Hold down the X key while dragging to restrict motion horizontally. Hold down the Y or Z key while dragging to restrict motion vertically.
• To drag one series at a time, click the axis associated with the series and hold down the left mouse button. Only the series connected with the axis will move.
Dragging will not work on an axis that is locked. To unlock an axis, double-click the axis and clear the checkmark next to “Lock Axis Scaling and Tick Marks.”
Crosshair tool Use the crosshair tool to zero in on a specific date and time in the plot and any data points associated with that date and time. There are several ways to select the crosshair tool:
• From the Tools menu, select Crosshair Tool; or
• Click the Crosshair icon on the toolbar; or
• Press the C key on your keyboard
Then, click anywhere on the plot to place the crosshair, which is a vertical red line. Click another location to move the crosshair, or drag the crosshair to a different location.

Chapter 3: Working with a datafile
30 GreenLine User’s Guide
You can also use the arrow tool to double-click an item on the plot to open the corresponding property window. For example, double-click the legend with the arrow tool to open the Legend Properties window.
To deselect, click an area within the axes that does not have series data; click the Plot menu and choose Select None; or press the D key on your keyboard.
Zoom tool Use the zoom tool to focus on one area of the plot, allowing you to see more detail. There are several ways to zoom:
• From the Tools menu, select Zoom Tool; or
• Click the Zoom icon on the toolbar; or
• If you are using the arrow or crosshair tool, press the Z key on your keyboard; or
• If you are using the hand tool, press the spacebar on your keyboard
Then:
• Right-click the mouse to toggle between zoom in and zoom out. Check the symbol inside the zoom tool to determine the direction you are zooming. A plus sign (+) or arrows pointing outward will zoom in, while a minus sign (-) or arrows pointing in will zoom out.
• Click an area on the plot inside the axes to zoom one level. Continue clicking to zoom multiple levels.
• Hold down the left mouse button in one location to zoom continuously. Release the left mouse button to stop zooming.
• Hold down the left mouse button while drawing a rectangle around the area you wish to zoom in on, then click inside the rectangle. The area inside the rectangle expands to fill the whole plot.
• Hold down the X key while zooming to restrict motion horizontally. Hold down the Y or Z key while zooming to restrict motion vertically.
• Click an axis to expand the series corresponding only to that axis. Hold the Ctrl key down while you click the axis to zoom out.
Zooming will not work on an axis that is locked. To unlock an axis, double-click the axis and clear the checkmark next to “Lock Axis Scaling and Tick Marks.”
Chapter 2: Working with a logger
GreenLine User’s Guide 19
Status window item Description Current/Logged Readings
If the logger is recording data, these are the last readings recorded. Otherwise, they are the current sensor readings. Note: If the logger is no longer recording data, readings are displayed for all channels, including the channels you elected not to log during the last launch. In addition, if the logger has channels for external probes, a description and reading will be given for the external channels even if no probes are plugged in.
Current States Current state of the logger in terms of events. If your logger has a button, most often the current state will be Button Up, meaning the button is not being pressed.
Current/Logged Events
Most recent event(s) detected by the logger. Events may include Host Connected, Stopped, Button Up, Button Down, and Bad Battery. For more details on events, see Sensor and event samples on page 24.
Reading out To retrieve data recorded by the logger, you need to offload, or read out, the logger. Reading out the logger copies data from the logger to your computer, allowing you to save the data in a .hobo file and view it in graph or data point format.
To read out a logger:
1. Connect the logger to the PC with the USB interface cable.
2. From the Logger menu, select Readout or click the Readout icon on the toolbar. If you have set the Preferences to prompt
you to stop the logger before reading out, a message asks whether you want to stop the logger.
3. The data is read out from the logger and then you are prompted to save the file. Either accept the default location and name, or choose your own and click Save. Data is saved as a .hobo file.
4. Select the channels you wish to view in the graph. You also have the option of changing the times on the graph to a different time zone. For more details on selecting channels and time zone offsets, see Opening datafiles on page 21.
5. If a file is attached, you are prompted to save it. You’ll still have an opportunity to save the file later if you choose to cancel now.

Chapter 2: Working with a logger
20 GreenLine User’s Guide
The logger will continue to record data during readout unless you stop the logger first or the logger is full. For details on stopping the logger, see the following section.
Stopping A logger will automatically stop recording data when the battery fails or the memory is full. You can also stop the logger manually at any time with the stop command.
To stop a logger:
1. Connect the logger to the PC with the USB interface cable.
2. From the Logger menu, select Stop Logging or click the Stop icon on the toolbar.
3. If the logger has been launched, a message appears indicating that the logger has already been launched and asking if you are sure you want to stop the deployment. Click Yes to stop the logger, or No to continue logging.
4. If the preferences are set to display a status message upon the launch or stop command, a status message displays indicating that the logger has been stopped and whether the logger has been read out.
Once the logger has been stopped, the data remains in the logger until the next launch.
Chapter 3: Working with a datafile
GreenLine User’s Guide 29
A paperclip button in the upper-right corner of the Points panel means that there is a file attached to the datafile. Click the paperclip button to save the attachment.
Tip: You can export the data points to a text file for use in Microsoft Excel or other programs. For details, see Exporting points on page 42.
Adjusting the plot The following tools are available to adjust the plot view and navigate the plot:
• Arrow tool
• Zoom tool
• Hand tool
• Crosshair tool
• Connect and mark points
• Restore plot
• Smart scaling
Each of these tools is described below.
Arrow tool Use the arrow tool to select different components in the plot, such as a specific series, axis, or the legend. There are several ways to select the arrow tool:
• From the Tools menu, select Arrow Tool; or
• Click the Arrow icon on the toolbar; or
• Press the A key on your keyboard
Then, click an item on the plot to select it, or press the S key to select each item in sequence. The selected item is shaded.

Chapter 3: Working with a datafile
28 GreenLine User’s Guide
A paperclip button in the upper-right corner of the Details panel means that there is a file attached to the datafile. Click the paperclip button to save the attachment.
Tip: You can export the information in the Details panel as a text file. For details, see Exporting details text on page 42.
Points panel The Points panel lists logger data in a tabular format. The Points panel is linked to the Plot panel: only the data for the group of series shown in the Plot panel is listed in the Points panel. Therefore, not all data recorded by the logger may be displayed in the Points panel. To view all data, reopen the datafile and select all channels.
The data points are listed chronologically. Each row consists of all the samples or events in the Plot panel recorded by the logger at that date and time. Each series is displayed in a column. Use arrow keys or the scroll bars to move up and down, and left and right in the Points panel. In addition, as you click the crosshair tool in the Plot panel, the corresponding row in the Points panel is selected (as shown by the arrow in the first column on the left). For more details on using the crosshair, see the Crosshair tool section on page 31.
GreenLine User’s Guide 21
Chapter 3: Working with a datafile
This chapter explains how to work with the .hobo datafiles generated from loggers, including how to:
Open datafiles
View the details, data points, and plot associated with a datafile
Adjust the plot display
Customize the plot
Save datafiles and plot images
Export data to text files
Copy plots and file details
Print plots
Close datafiles
Opening datafiles Only files with a .hobo or .hob extension can be opened in GreenLine. You can open datafiles immediately upon readout of a logger as described in the previous chapter. To open files already saved to a computer or network:
1. From the desktop: Double-click a .hobo datafile. GreenLine automatically launches and opens the datafile.
In GreenLine: From the File menu, click Open or click the Open
icon on the toolbar. Or, click the File menu and select a recently opened file from the Recent Files list.
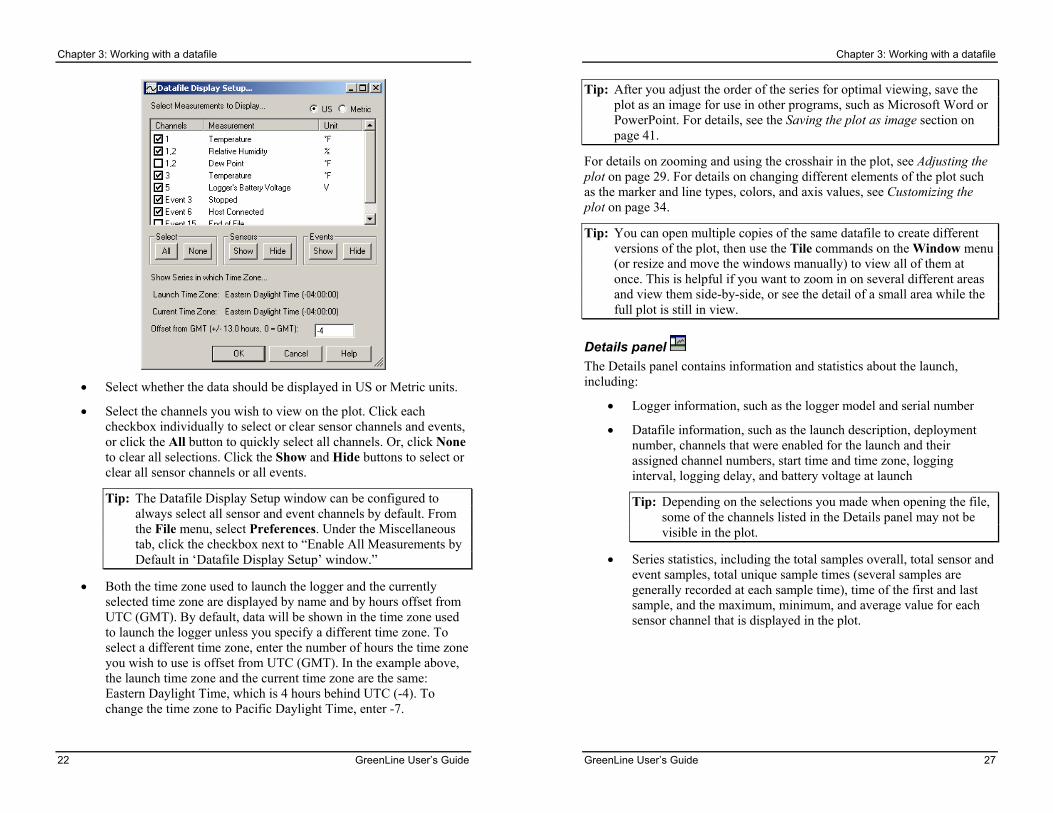
2. A Datafile Display Setup window similar to the following appears.
Chapter 3: Working with a datafile
22 GreenLine User’s Guide
• Select whether the data should be displayed in US or Metric units.
• Select the channels you wish to view on the plot. Click each checkbox individually to select or clear sensor channels and events, or click the All button to quickly select all channels. Or, click None to clear all selections. Click the Show and Hide buttons to select or clear all sensor channels or all events.
Tip: The Datafile Display Setup window can be configured to always select all sensor and event channels by default. From the File menu, select Preferences. Under the Miscellaneous tab, click the checkbox next to “Enable All Measurements by Default in ‘Datafile Display Setup’ window.”
• Both the time zone used to launch the logger and the currently selected time zone are displayed by name and by hours offset from UTC (GMT). By default, data will be shown in the time zone used to launch the logger unless you specify a different time zone. To select a different time zone, enter the number of hours the time zone you wish to use is offset from UTC (GMT). In the example above, the launch time zone and the current time zone are the same: Eastern Daylight Time, which is 4 hours behind UTC (-4). To change the time zone to Pacific Daylight Time, enter -7.
Chapter 3: Working with a datafile
GreenLine User’s Guide 27
Tip: After you adjust the order of the series for optimal viewing, save the plot as an image for use in other programs, such as Microsoft Word or PowerPoint. For details, see the Saving the plot as image section on page 41.
For details on zooming and using the crosshair in the plot, see Adjusting the plot on page 29. For details on changing different elements of the plot such as the marker and line types, colors, and axis values, see Customizing the plot on page 34.
Tip: You can open multiple copies of the same datafile to create different versions of the plot, then use the Tile commands on the Window menu (or resize and move the windows manually) to view all of them at once. This is helpful if you want to zoom in on several different areas and view them side-by-side, or see the detail of a small area while the full plot is still in view.
Details panel The Details panel contains information and statistics about the launch, including:
• Logger information, such as the logger model and serial number
• Datafile information, such as the launch description, deployment number, channels that were enabled for the launch and their assigned channel numbers, start time and time zone, logging interval, logging delay, and battery voltage at launch
Tip: Depending on the selections you made when opening the file, some of the channels listed in the Details panel may not be visible in the plot.
• Series statistics, including the total samples overall, total sensor and event samples, total unique sample times (several samples are generally recorded at each sample time), time of the first and last sample, and the maximum, minimum, and average value for each sensor channel that is displayed in the plot.

Chapter 3: Working with a datafile
26 GreenLine User’s Guide
3. A warning appears indicating that the only way to add the series
back to the plot is to reopen the datafile. Click Continue. The series is removed from the plot.
Compare this sample plot to the one in the previous step. The battery series and its value axis have been removed from the plot.
Changing the order of series on the plot You can shuffle the order of series by moving a series to the front or back. This is helpful if one series is hidden behind another. To change the order of the series:
1. Select the arrow tool from the toolbar.
2. Click the series you wish to move, right-click, and select either Bring Series to Front or Send Series to Back from the menu that appears.
Chapter 3: Working with a datafile
GreenLine User’s Guide 23
3. When you have made your selections, click OK. The datafile opens. For details on viewing the three main components of the datafile (the plot, points, and details), see the next section Viewing datafiles.
Viewing datafiles Once a datafile is open, there are three panels to view:
• Plot
• Details
• Points
Each panel is explained below.
Use the icons on the toolbar, or click the View menu to show or hide the Plot, Details, and Points panels.
Plot panel The Plot panel contains a graphical representation of the series and events you selected to view when you opened the datafile. The plot also includes:
• X axis, called the time axis; displays the date and times for the data
• One or more Y axes, called the value axes; display the values for each sensor channel, such as temperature in degrees Fahrenheit or Celsius or battery power in Volts.
• Title, which defaults to the description entered at launch
• Legend, which displays the keys for each channel (line colors or marker types)

Chapter 3: Working with a datafile
24 GreenLine User’s Guide
This an example of a plot with all series available for viewing selected.
A paperclip button in the upper-right corner of the Plot panel means that there is a file attached to the datafile. Click the paperclip button to save the attachment.
Sensor and event samples Two kinds of data series can be displayed on a plot:
• Sensor samples
• Event samples
Sensor samples are the channels you selected to log at an interval during the launch, such as temperature, RH, or battery voltage. This type of data series consists of all the logged data points for that channel. In addition, if the logger recorded both temperature and RH, a dew point series is also available for view.
Event samples are individually logged occurrences that can be recorded at any time during deployment, regardless of the logging interval. Examples include:
Legend
Time axis
Value axes Value axis Title
Data series (eight series are displayed in this example: five sensor channels and three events)
Sensor channels
Events
Chapter 3: Working with a datafile
GreenLine User’s Guide 25
• Button Down/Button Up: For loggers that have buttons, each button push of at least one second is logged as a Button Down event and a Button Up event.
• Host Connected: Time the logger was connected to the computer.
• Stopped: Time the logger was stopped within GreenLine.
• Bad battery: Time the remaining battery capacity fell to an extremely low level (if applicable).
Tip: When the battery capacity is very low, the logger’s ability to record accurate data may become erratic. If you see a bad battery event, be sure to replace the battery before deploying the logger again.
• End of File: Marks the final record in the .hobo file.
Changing the units displayed in the plot You can switch between US and Metric measurements while the plot is open.
1. From the View menu, select either US Units or Metric Units. Or, click the Units icon on the toolbar.
2. A warning appears indicating that any changes you made to the plot and any series you removed will be restored. Click Continue.
This changes the units displayed on the plot, in the legend, and in the Points panel.
Removing a series from the plot You can remove sensor and event data series from the plot. This is helpful if the datafile contains multiple series and you can’t easily view them all together.
To remove a series from a plot:
1. Select the arrow tool from the toolbar.
2. Click the series you wish to remove, right-click, and select Remove Series from the menu that appears. In our example plot, we are removing the battery series because it clutters the plot.