Embed Size (px)
Citation preview
Somaratne. 2000. Sri Lankan Journal of Agricultural Economics. Volume 3, Number1.Pp 93 - 122.
Greening the Sri Lankan Trade: TariffPolicy Liberalisation in Non-Plantation
Agriculture and the Environment
W.G. Somaratne∗
ABSTRACT
Sri Lanka has implemented major trade policy reform measures tocreate an internationally competitive environment for the Sri Lankanagricultural and manufacturing products, during the last two decades. However,the policy analysts have not paid due attention to the likely economic andenvironmental impacts of trade policy liberalisation, including reforms to beundertaken within the framework of the GATT/Uruguay Round Agreement onAgriculture (GURAA), the South Asian Preferential Trading Arrangement(SAPTA), and the South Asian Free Trade Area (SAFTA).
This paper analyses the likely macro and meso economic effects andagro-environmental effects of tariff policy liberalisation as a ‘green’ policydevice within the policy framework of GURAA, SAPTA and SAFTA, using anappropriately modified computable general equilibrium (CGE) model of theSri Lankan economy. The general equilibrium approach is chosen becausemany of the policy changes have economywide ramifications.
The focus of the paper is mainly on the tariff liberalisation, non-plantation agriculture and land degradation-induced environmentalmanagement in the hilly regions of Sri Lanka. Proper management of land inthe non-plantation agriculture sector is particularly of importance as policy-induced changes in land use patterns in the hilly region impact directly ondownstream-irrigated agriculture, and hydropower generation. This modelextends previous CGE models of the Sri Lankan economy by furtherdesegregating the agricultural sector by regional land types and crops, and
∗ Senior Research and Training Officer, Hector Kobbekaduwa
Agrarian Research and Training Institute.

94
explicit incorporation of on-site and off-site impacts of land degradation. Theanalyses show that trade policy liberalisation, within the policy framework ofGURAA, SAPTA and SAFTA have benign macro, meso economic and

95
environmental impacts. Hence, tariff policy liberalisation can be categorisedas a ‘green’ policy device. However, inspection of their quantitative effects onenvironmental variables indicates that there is a potential for additional andcomplementary economic and environmental policy options to combat microlevel agro-economic issues and land degradation.
Introduction
Trade liberalisation has becomea prime component of economicpolicy reforms in both developingand developed countries in recentyears. In the case of the world’sdeveloping countries, they pursuedan Import SubstitutionIndustrialisation (ISI) strategy fromthe 1950s, but failed to achieve rapideconomic growth to eradicate ruralpoverty and to minimiseenvironmental degradation. The fewdeveloping countries, particularly inEast Asia, which undertook tradepolicy reforms, and adopted anexport-led growth strategy,particularly in line with the strategyof regional integration, succeeded inregistering fast economic growth andindustrial development. In the case ofdeveloped countries, this representsthe culmination of an ongoingprocess of both domestic andexternal policy liberalisation sincethe end of the Second World War. Itis also a central plank of the policiesthat are being adopted by thepreviously centrally planned‘transitional’ economies as they
move to establish market-orientedeconomies.
In developing countries, the issueof trade policy reforms must beconsidered in the concrete context ofexisting distortions in the traderegime as well as in a whole range ofother economic activities. If the onlydistortion were in trade policy, tradereforms are likely to beunambiguously welfare increasing.But in assessing the impact of tradepolicy reforms, particularly indeveloping countries, it should berecognised that both market and non-market failures are pervasive. This isparticularly so in the case ofagriculture.
First, agricultural production isreplete with examples of marketfailure, so that prices of inputs andoutputs in agricultural markets do notfully reflect the social costs(including poverty) of a range ofagricultural activities, producingeffects such as soil and waterdepletion, various forms of pollution,deforestation, and over grazing.These externalities and "public bads"have economywide effects that are

96
not limited to agriculture alone, butinfluence negatively other sectors inthe economy. Second, agriculturefaces a problem of government or"non-market failure", which canmisdirect resource allocation throughpolicy distortions and imperfections(Stiglitz, 1987; Panayotou, 1990; andJohnson, 1991). Further, it should benoted that sector specific policiesmay have unintended impacts onother sectors in the economy. Acomprehensive study of the likelyimpacts of trade policy reforms since1977 and changes of futureinternational policy environment inline with GURAA, SAPTA, andSAFTA on the non-plantationagricultural sector and the effects ofon-site and off-site cost of soil erosionhas not been undertaken. Further, it isimperative to determine whether thetrade policy liberalisation in non-plantation agriculture is a ‘greenpolicy device’ for reducing agro-environmental damages.
The purpose of this paper is toexamine the likely effects of tariffpolicy liberalisation in line with theGATT/Uruguay Round Agreement onAgriculture (GURAA), the SouthAsian Preferential TradingArrangement (SAPTA) and the SouthAsian Free Trade Area (SAFTA) onthe performance of the non-plantationagricultural sector and the cost of landdegradation-induced on-site and off-site effects in Sri Lanka. To this end,
we intend to scrutinise the literatureavailable on the subject and examinethe possible impact of such aliberalising international policyenvironment on non-plantationagriculture in Sri Lanka. In theanalysis, we focus on highland,midland and lowland non-plantationagricultural sectors.
The rest of the paper is organisedas follows: future agricultural policyliberalisation in line with GURAA,SAPTA and SAFTA and presentcontext of agricultural tariff policyliberalisation and import tariffstructure on the non-plantationagricultural sectors in Sri Lanka isreviewed in section 2. Section 3explains the basic features of thecomputable general equilibrium(CGE) model developed for the SriLankan economy. The likely macro,meso and micro effects (includingagro-environmental effects) of tariffpolicy liberalisation as a green policydevice in line with the GURAA,SAPTA and SAFTA are explained insection 4. Conclusions and policyimplications are included in the finalsection.
Trade Policy Liberalisation UnderGURAA, SAPTA and SAFTA
The major policy thrust of theinternational policy environment inline with GURAA, SAPTA andSAFTA is integration with the world
97
economy in order to createinternational competitiveness forboth manufacturing and agriculturalproducts. The following sectionsreview the changes in the nationaland international trade policyenvironment and their effects.
Agricultural Trade PolicyLiberalisation UnderGATT/Uruguay Round –WTO
The GATT/Uruguay Roundnegotiations were the turning pointfor developing countries in theirintegration into the global economy.However, in the GATT/UruguayRound, most countries were infavour of formulating new rules forthe world trading system, includingmarket access offers in reducingtariff protection in manufacturingand agricultural products and trade inservices (Martin and Winters, 1996)The GURAA was important formaking a base for future
liberalisation, particularly tostrengthen the world economy andlead to more trade, investment,employment and income growththroughout the world.
The trade reform provisions ofthe GURAA - WTO include threemajor categories: market accesses,domestic support and exportsubsidies. Under the main categoryof market access, Sri Lanka has toconvert virtually all non-tariffmeasures (NTMs) on agriculturalimports into ad valorem or specifictariffs1. The effective tariffs are to be“bound” and should be reduced overa period of six years2. Tariffication isbased on the actual differencebetween internal and external pricesduring the years 1986 to 1988.Further, under the GURAA, tariffiedproducts are subject to ‘minimumaccess’3 requirements, which are tobe guaranteed where necessarythrough tariff rates.
____________________________________1. The conversion of NTMs in the economy into tariffs is referred as “tariffication”.
2. A binding tariff rate is the legally set ceiling (maximum) rate of tariff for the country. The actualtariff can be lower than the bound maximum rate, but it cannot go beyond the ceiling, unless thetariff rate is renegotiated with trading partners. The period for reduction of tariff rate has beenextended for ten years for developing and less developed countries (Athukorala and Kelegama,1996).
3. In line with the ‘minimum access’ condition, when imports of a product subject to tarifficationare less than six per cent of domestic consumption requirement in the base period (1986-1988),the minimum access opportunities are to be provided. The minimum access condition isequivalent to three per cent of base period consumption in the first year, increasing to five percent in six years. In the case where imports of tariffied products exceeded five per cent ofconsumption in the base period, countries have to maintain the access opportunity that prevailedin the base period.
98
Some categories of imports canget ‘special treatment”4 and gainexemptions from tarifficationrequirements. The present structureof subsidies in Sri Lankan agricultureare consistent with WTO domesticsupport provisions and further policyadjustments are not necessary(Athukorala and Kelegama, 1996).
A major challenge for the WorldTrade Organisation (WTO), atpresent, is to ensure that tradeliberalisation does not lead toundesirable social and environmentalconsequences. There are provisionsunder the “Green Box” to providedirect assistance as ‘safety nets’ toavoid undue social consequences.Subsidies on targeted purposes arehowever not included as trade-distorting elements and are thusexempted from reduction of subsidyrequirement specified under the
GURAA-WTO (Athukorala andKelegama, 1996).
Sri Lanka has fixed the ‘bound’rate of tariff on agricultural imports5
at a uniform rate of 50 per cent, incompliance with the GURAA’scommitments (WTO, 1996). Thebound level of tariff selected for theSri Lankan economy is the lowestamong the four South Asian WTOmember countries6 and one of thelowest among all developing-countryWTO members (Martin and Winters,1996). The gazetted tariff rates7 onall agricultural products in Sri Lankaare much lower than the bound rateannounced. Hence the GURAAcommitments are unlikely tosignificantly accelerate agriculturaltrade reforms in Sri Lanka. However,recent experience suggests thatdomestic consumer pressures may beeffective in achieving faster reformsin this area.
__________________________4. There are three eligibility criteria for the ‘special treatment’, namely: (i) imports of the product
concerned should have accounted for less than three per cent of corresponding domesticconsumption in the base period (1986-1988); (ii) the designated product should not havebenefited from any export subsidies since the beginning of the base period; and (iii) measureslimiting domestic production should be applied to the pertinent primary agricultural product
5. The imported items include about 700 agricultural products, which contain meat, fish, milk,milk powder, fruits, vegetables, nuts, spices, coffee, seeds, sugar, maize, starches, oils and fats,cocoa, pastries, fruit juices and fruit preparations.
6. Bangladesh declared an uniform tariff rate of 200 per cent, whereas Pakistan maintained boundrates in the range of 100-150 per cent. India has announced high binding rates of 100, 150 and300 per cent for most products coupled with zero or low (between 10-40 per cent) rates for afew products (Athukorala and Kelegama, 1996).
7. The gazetted 3 band tariff rates were further reduced between 10-25 per cent in the budgetspeech for the year 2000.

99
Agricultural Trade LiberalisationUnder the SAPTA and SAFTA
The regional integration throughtrading blocs is established mainly togain advantages in tradeliberalisation in line with the processof harmonisation of intra-regionaltrade. However, in December 1995SAARC member countries were ableto formulate the SAPTA and SAFTAagreements8 in order to promoteregional trade integration9. The tradeexpansion leads to further stimulateinvestment in improved technologyand trade related other activities andthereby generates more employmentopportunities.
In particular, the SAPTAagreement is based on the principlesof reciprocity, equity, and mutualadvantage with the liberalisation ofthe following four components,namely: tariff; para-tariff; non-tariff;and direct trade measures (SAARC,1995). In the two rounds ofnegotiations of SAPTA in 1995 andin 1996, SAARC member countriesannounced their tariff concessions inrelation to non-plantation agricultural
sectors (see Appendix Tables 1 and2). Considering these changes in theSAARC regional policyenvironment, Sri Lanka needs tofurther liberalise the tariff structurein relation to the non-plantationagricultural sectors. The Indo-SriLanka trade agreement (FTA)10,
which signed by Sri Lanka and India,is one step forward in regional tradeliberalisation, before implementationof SAPTA and SAFTA within theSAARC. This is basicallycomplementary to the proposedpolicy reforms explained above inline with GURAA.
Agricultural Trade PolicyLiberalisation in Sri Lanka
Sri Lanka was one of the firstamong developing countries, toimplement a far-reaching program ofeconomic policy reforms unilaterallyas early as 1977, mainly under thestructural adjustment policy (SAP)packages. Economic policy reformsimplemented in Sri Lanka included:reductions of protection provided toimport-competing sectors; provision
___________________________8. In principle, SAPTA and SAFTA agreements will be effective by the year 2001. The main
objective of SAPTA is to promote and sustain mutual trade and economic co-operation amongthe contracting states through the exchange of concessions.
9. The value of intra-SAARC trade constitutes 3 per cent of world trade and still there is anenormous trade potential through integration for trade expansion and trade diversion(Samaratunga and Jayasuriya, 1996).
10. In the budget speech for the year 2000, the President categorically emphasised the necessity ofimplementation of the Indo-Sri Lanka trade agreement immediately (Budget Speech, 2000).

100
of incentives to export orientedsectors; changing exchange rateregimes; fiscal and monetary reforms;liberalisation of domestic factor andproduct markets from governmentintervention thus allowing free play ofmarket forces; and privatisation ofsome government business enterprises(Gunawardana and Somaratne, 1999).The reform process has beencontinued with the changes ingovernment in 1989, and 1994 atvarying degrees. The main declaredobjective of trade policy reforms wasto achieve internationalcompetitiveness for the Sri Lankanagricultural and manufacturingproducts. There has been a growingbody of literature11, which focuses onthe historical process of economicpolicy reforms in Sri Lanka and theireffects.
The non-plantation (domestic)12
agricultural sector in Sri Lanka isconcerned with the production andmarketing of food crops andlivestock products, mainly fordomestic consumption (ie. non-tradeables). In 1999, both plantation(including forestry) and non-
plantation agriculture togethercontributed 16.4 per cent of GDP;and 20.6 per cent of the value ofexports; (Central Bank of Sri Lanka,1999) and 38.7 per cent of theemployed labour force (Central Bankof Sri Lanka, 1996). The non-plantation agricultural sectors alonecontributed about 13.2 per cent ofGDP in 1999 (Central Bank of SriLanka, 1999). This sector alsoaccounts for a sizeable proportion ofarea under cultivation in the country.For instance, in 1990, paddy andother food crops accounted for about58 per cent of total cultivable land,while the plantation sector accountedfor about 38 per cent and other crops4 per cent (World Bank, 1990).
During the 1978 to 1983 period,the non-plantation agriculture washeavily protected (eg. high tariffs andextensive non-tariff measures -licensing, quotas, and otherregulations), particularly in relationto crops such as potatoes, onions andchillies. However, a policy of importliberalisation was followed, underwhich the non-plantation agriculturewas exposed to import competition.
___________________________11. Particularly in relation to the macroeconomic effects (Rajapathirana, 1988; Cuthbertson and
Athukorala, 1991; Athukorala and Jayasuriya, 1994; Laksman, 1994;), fiscal Impacts (Bandara,1994), Plantation Agriculture (Gooneratne and Wesumperuma, 1984; Edwards, 1993);manufacturing industries (Athukorala, 1986; and 1994; Jayanthakumaran, 1991, Edwards, 1993),policy regimes and the non-plantation agriculture (Gunawardana and Somaratne, 1996 and 1999)and economywide effects (including agro-environmental effects) of policy liberalisation (Somaratne,1998) .
12. In this paper, the term `non-plantation agriculture' and `domestic agriculture' is usedinterchangeably.
101
On the other hand, the domestic foodcrop sector, in particular the ricesector, received both trade protectionand a range of input subsidies [ie.irrigated water, fertiliser, researchand development (R&D) andextension services]. In the 1994regime, diversification of the cropmix towards commercial, agro-industrial and exportable crops(mainly vegetables, fruits and cutflowers) fisheries (ie. lobsters,shellfish, shrimps, prawns and otherornamental fish) was also on thepolicy agenda.
The previous analytical studiesconcentrate on specific sectors andissues. For instance Bhalla (1991)deals with the political economy anddetermination of agricultural prices,Edwards (1993) examines the extentof protectionism in relation to foodcrops and livestock products during1985 to 1991, Gunawardana andQuilkey (1987) analyse the welfareeffects of rice pricing policies andmarketing policies during 1952 to1984, Edirisinghe et al., (1992) andSomaratne and Wickramasinghe(1993) examine the efficiency andincentive structure in rice productionin Sri Lanka, and Gunawardana andSomaratne (1999) investigate theimpacts of different economic regimeson the performance of the non-
plantation agricultural sector in SriLanka, during 1970 to 1997.
Structure of Import Tariff andIncentives and Non-PlantationAgricultural Sectors
Since 1977, import tariffprotection provided to Sri Lankanagriculture has been graduallyreduced in line with the liberalisedtrade and other agricultural reformpolicies, with the objective ofincreasing the internationalcompetitiveness of Sri Lankanagricultural products. Once the tradebarriers relating to agriculturebecame an internationally prominentissue with GURAA, Sri Lanka’stariff and related protectionistpolicies were the subject of criticalanalysis. In this context, quantitativerestrictions (QRs), import tariffs,export taxes, export subsidies andexchange controls were dismantledand other institutional and reformstructures were undertaken whichwere conducive to economic growthin Sri Lanka. The Sri Lankan tariffstructure13 has been periodicallyreviewed since 1980, and successivechanges toward a lowered tariffstructure have been implemented(Ratnayake, 1993; Report ofPresidential Tariff Commission onTariff and Trade, 1994).
__________________________13. In 1977, most QRs were replaced by a six-band duty system for imports ranging from 0 per cent
for essential consumer goods to 500 per cent tariff rates on luxury items. These rates wereimposed even on agricultural sectors, considering various commodity specific tariff rates.
102
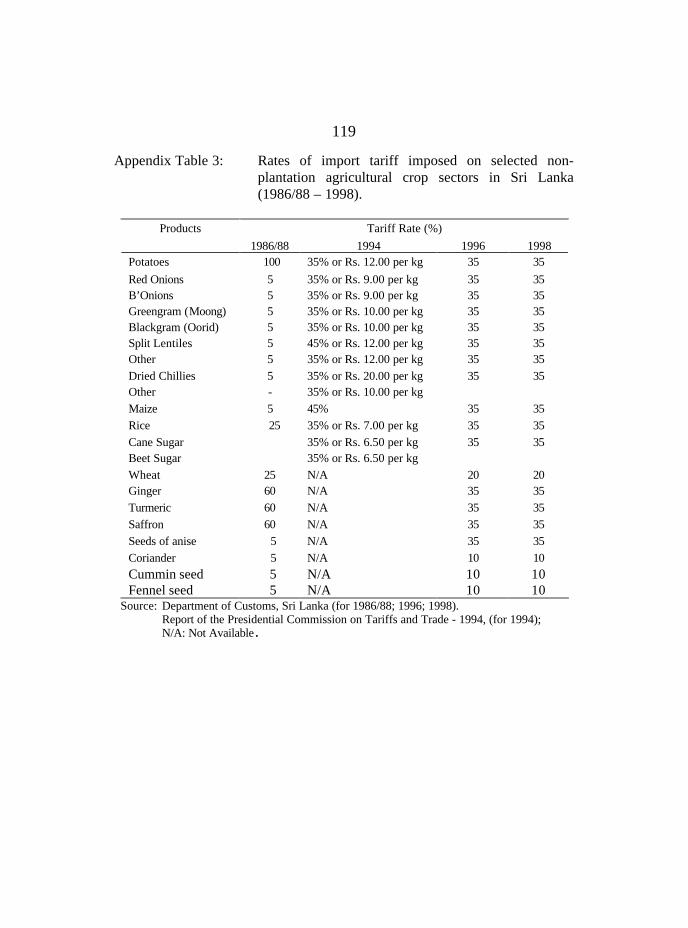
The present rates of import tariffimposed on non-plantationagricultural crop sectors (Rice,Sugar, Potatoes, Red onions,B'onions, Greengram, Blackgram,Dried Chillies, Maize and Splitlentils) range from 10 to 35 per cent(see Appendix Table 3). The 20 percent tariff rate is applied for wheatand the 10 per cent tariff rate isclaimed for condiments likecoriander, cummin seed, and fennelseed. The tariff structures havedistorted resource allocation bothbetween plantation and non-plantation agricultural sectors andbetween agriculture and othersectors. Furthermore, tariffprotection appears to have increasedthe cost of land degradation-inducedon-site and off-site environmentaldamages. For example, a high rate ofimport tariff protection was given topotatoes, onions and chillies sub-sectors despite these crops being themost soil erosive crops (Somaratne,1998).
The average effective protectioncoefficient (EPC) for the agriculturalsector was 1.6, while that of themanufacturing sector was 1.8, duringthe period 1988 to 1991 (AppendixTable 4). However, in 1992/93,
whilst the EPC remained unchangedin agriculture, the EPC declined from1.8 to 1.7 in the manufacturingsector. But in 1992/93, the EPC inthe manufacturing sector continuedto be higher than in the agriculturalsector. In this context, the mosthighly protected sector in Sri Lankanagriculture is the non-plantationagricultural sector.
A CGE Model for the Sri LankanEconomy
A recent phenomenon in theeconomic modelling arena, is thedevelopment of a class of economy-wide computable general equilibrium(CGE) models, which are mainlyemployed to evaluate the likelyeconomy-wide impacts of a widerange of policy issues. Basicallythese models provide an internallyconsistent economy-wide frameworkfor policy analysis, in consideringinternal and/or external shocks to aneconomy on macro and microeconomic variables.
There were four pioneering CGEmodels14 developed for the SriLankan economy. In Somaratnemodel (1998), the relationshipbetween trade policy (ie. tariff)
__________________________14. The CGE models were developed by Bandara (1989), Center for International Economics (CIE)
(1992), Herat (1994), Bandara et al., (1995), and Somaratne (1998) to evaluate the economy-wide likely impacts of various policy issues including external shocks, ‘Dutch disease’ typepolicies, technological change, and trade policy issues. All of these models are neo-classical,comparative static models, the structure of which is based on the ORANI model of theAustralian economy (Dixon, et.al. 1982).
103
reforms and the issues onexternalities, (ie. land degradation-induced off-site effects) wasconsidered. The CIE (1992) andSomaratne15 (1998) models used arecent input-output database intaking into account economicliberalisation-induced structuralchanges in the Sri Lankan economy.
The production structure of theCGE model for Sri Lanka ispresented schematically in Figure 1.In this analysis, the comparative-static CGE16 model17developed bySomaratne (1998), which belongs toJohansen18 class, witch was linearvariables, is adopted as the base foranalysis, with further disaggregationof the model. Although modelling ofall land degradation-induced effectsis an extremely difficult task, effortshave been made to evaluate thepolicy-induced economywide effects
of land degradation, including on-sitecost of land degradation and off-siteimpacts of irrigated agriculture,hydro-power generation, flushingcost of Kothmale reservoir, operationand maintenance cost of highlandand midland road network, and othercost of environmental damages (e.g.cost of health hazards andpurification of water).
In this model, land mobility isallowed between crop industrieswithin upland, midland and lowlandregions. The relative price changes ofproducts resulting from changes ineconomic policy frameworkinfluence the land use patterns in theeconomy, which in turn affects thesectoral rates of soil erosion.Changes in levels of soil erosionlinked to changes in land use patternsin the upland and midland regions
__________________________15. The equation system of the CGE model was not included due to space limitations of the paper.
16. The CGE model for the Sri Lankan economy included 40 industries. In agriculture, tea sectorwas disaggreated into highland, midland and lowland tea sectors while the other agriculturesector was disaggregated into highland, midland and lowland other agriculture and uplandpotatoes. The model includes 14 agricultural industries in the upland, midland and lowlandregions. Each industry produces a single commodity by using three primary factors: land, labourand capital.
17. The main data source used for the model is the input-output table developed by the Departmentof Census and Statistics in 1989, which was further updated and improved in 1991 by the CIE,incorporating the structural changes taking place in the economy, after the second wave ofeconomic reforms in 1989. This input-output data base captures the production accounts in theeconomy, the share coefficients in sales, costs and revenues in current production, investment,household consumption, foreign trade, and margin industries (marketing value-addeddistribution etc.) are computed to implement the relevant CGE model
18. The advantage of the Johansen class models is the flexibility to address a range of comparative-static problems involving changes in policies, prices, factor endowment and technologies.

103
Figure 1: Schemaic presentation of the Sri Lankan CGE model.
u p t o … … … … … … … …
C E T
A c t i v i t y L e v e l
L e o n t i e f
G o o d 1 G o o d
C P r i m a r y F a c t o r s
G o o d 1 G o o d C G o o d 2
u p t o … … … … ' O t h e r
C o s t '
C E S C E S C E S
D o m e s t i c G o o d
1 I m p o r t e d
G o o d 1
D o m e s t i c G o o d
C I m p o r t e d G o o d
C L a n d L a b o u r C a p i t a l
C E S
R u r a l L a b o u r
S k i l l e d L a b o u r
U n s k i l l e d L a b o u r
K E Y
F u n c t i o n a l F o r m
I n p u t s o r O u t p u t s

104
have both on-site and off-siteconsequences. The main off-siteimpact of land degradation is thereduction of the productivity ofphysical structures for the storageand delivery of water for irrigationand hydropower generation. Anincrease in sediment delivery rate tothese water storage tanks in thelowland areas directly increases thecosts in irrigated agriculture andhydropower generation. The on-siteproductivity impacts from soilerosion and the off-site impacts ofreduction in irrigation capacity forcrops and hydropower generation aremodelled to estimate the value ofdepletion of natural capital in the SriLankan economy. For givenquantities of sector-specific capitalendowments, an increase in erosionlevels in the upland and midlandsectors reduces lowland sectors’output by reducing their effectivespecific factor endowment. Theparameter measuring the relationshipbetween changing land use andinduced soil erosion in the uplandand the loss of irrigation capacity inthe lowland cannot be directlyestimated due to a lack of secondarydata. The off-site impact parameter19
used in the Bandara et al., (1995)model is adopted for the presentanalysis.
In all simulation experiments oftariff liberalisation, a model closureis employed in which real wages andbalance of trade are fixed.Accordingly, shifts in labour demandare absorbed by quantity adjustments(endogenous labour supply), andaggregate net income changes appearas changes in real householdconsumption. In addition, thenominal rate of foreign exchangeremains fixed, as a numereire of themodel. Any movements in domesticprice levels change the real exchangerate, which is defined as the ratio ofan index of the border prices oftradable to an index of domesticprices. The small country assumptionis employed and world prices ofimports are treated as exogenous. Inthis analysis, it is assumed that realwages are fixed and allowed todetermine endogenously the level ofaggregate employment in theeconomy. The rate of soil erosion atboth sectoral and for the economy asa whole is an endogenous variable inthe model.
Macro and Meso Economic Effectsof Tariff Policy Liberalisation
In this section, we present theempirical analysis of the effects oftrade policy liberalisation in SriLanka in line with the above
_____________________________19. The off-site impact parameter based on the Philippine experience, for measuring off-site damage
in lowland agriculture and hydro-power generation was 0.1, indicating that a 1 per cent increasein acreage of upland crop sectors reduces the lowland irrigated area and hydro-power generationby 0.1 per cent.

105
mentioned broad policy liberalisationframework of GURAA, SAPTA, andSAFTA, based on recent studiesconducted in relation to the non-plantation agricultural sectors in SriLanka. Particularly, as explained bySomaratne (1998), tariffliberalisation in regional non-plantation agricultural sectors (ie.upland midland and low land) wasanalysed, considering three policyscenarios, namely partial tariffreduction (ie. 50 per cent tariffreduction in non-plantationagricultural sectors), total removal oftariff in non-plantation agriculturalsectors and across-the-board tariffreduction (ie. 50 per cent across-the-board tariff reduction in all importcompeting sectors). A comparativestatic Computable GeneralEquilibrium (CGE) model20 wasdeveloped to evaluate the likelyeconomywide effects of tariffliberalisation in the non-plantationagricultural sectors in Sri Lanka.
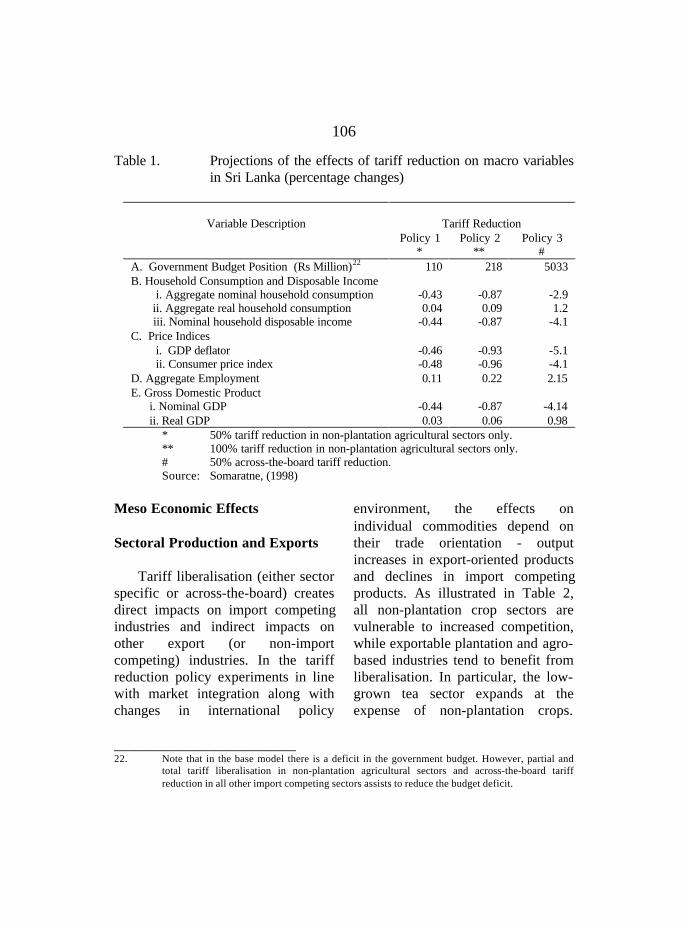
Macroeconomic Effects
The projections of themacroeconomic effects of tariffliberalisation in line with GURAA,SAPTA, and SAFTA are presentedin Table 1 based on Somaratne
(1998). The results show that tariffliberalisation is likely to lead to ahigher real GDP. When the rate oftariff reduction in the non-plantationagricultural sectors increases, itincreases the growth rate of realGDP, by stimulating output in theexportable agricultural and industrialmanufacturing sectors. However,greater growth benefits can besecured with across-the-board tariffliberalisation in all import competingsectors, rather than sector specifictariff liberalisation.
Further, both partial and across-the-board tariff liberalisationincrease the level of aggregateemployment in the economy, reducethe aggregate price level, and therebyimprove the aggregate real householdconsumption. Moreover, tariffliberalisation stimulates trade,leading to higher imports and exportsand improves the balance of trade. Atthe same time, it also leads to animprovement in the governmentbudget21 along with partial and totaltariff liberalisation in non-plantationagricultural sectors and across-the-board tariff reduction in all importcompeting sectors, through fiscalexpansion particularly in the export-oriented product sectors (Table 1).
__________________________20. See Somaratne, (1998) for comprehensive details on the CGE model theory and its applications
in relation to analysis conducted in non-plantation agricultural sectors in Sri Lanka.
21. Note that in the base model, there is a deficit in the government budget.
106
Table 1. Projections of the effects of tariff reduction on macro variablesin Sri Lanka (percentage changes)
Variable Description Tariff ReductionPolicy 1
*Policy 2
**Policy 3
#A. Government Budget Position (Rs Million)22 110 218 5033B. Household Consumption and Disposable Income i. Aggregate nominal household consumption ii. Aggregate real household consumption iii. Nominal household disposable income
-0.43 0.04-0.44
-0.87 0.09-0.87
-2.9 1.2-4.1
C. Price Indices i. GDP deflator ii. Consumer price index
-0.46-0.48
-0.93-0.96
-5.1-4.1
D. Aggregate Employment 0.11 0.22 2.15E. Gross Domestic Product i. Nominal GDP ii. Real GDP
-0.440.03
-0.870.06
-4.140.98
* 50% tariff reduction in non-plantation agricultural sectors only.** 100% tariff reduction in non-plantation agricultural sectors only.# 50% across-the-board tariff reduction.Source: Somaratne, (1998)
Meso Economic Effects
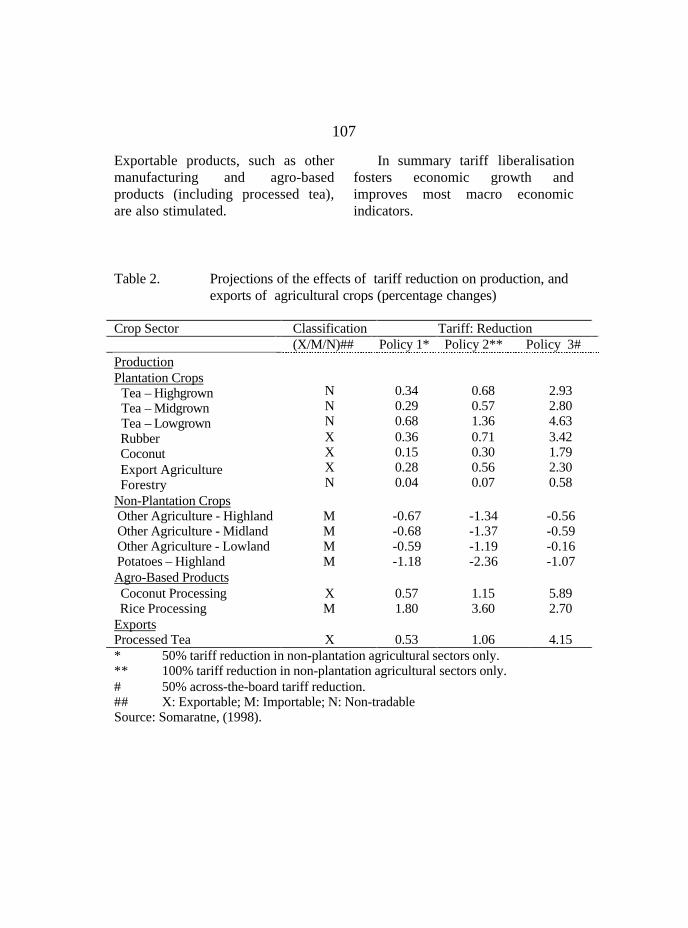
Sectoral Production and Exports
Tariff liberalisation (either sectorspecific or across-the-board) createsdirect impacts on import competingindustries and indirect impacts onother export (or non-importcompeting) industries. In the tariffreduction policy experiments in linewith market integration along withchanges in international policy
environment, the effects onindividual commodities depend ontheir trade orientation - outputincreases in export-oriented productsand declines in import competingproducts. As illustrated in Table 2,all non-plantation crop sectors arevulnerable to increased competition,while exportable plantation and agro-based industries tend to benefit fromliberalisation. In particular, the low-grown tea sector expands at theexpense of non-plantation crops.
_________________________22. Note that in the base model there is a deficit in the government budget. However, partial and
total tariff liberalisation in non-plantation agricultural sectors and across-the-board tariffreduction in all other import competing sectors assists to reduce the budget deficit.
107
Exportable products, such as othermanufacturing and agro-basedproducts (including processed tea),are also stimulated.
In summary tariff liberalisationfosters economic growth andimproves most macro economicindicators.
Table 2. Projections of the effects of tariff reduction on production, andexports of agricultural crops (percentage changes)
Crop Sector Classification Tariff: Reduction(X/M/N)## Policy 1* Policy 2** Policy 3#
ProductionPlantation Crops Tea – Highgrown Tea – Midgrown Tea – Lowgrown Rubber Coconut Export Agriculture Forestry
NNNXXXN
0.340.290.680.360.150.280.04
0.680.571.360.710.300.560.07
2.932.804.633.421.792.300.58
Non-Plantation Crops Other Agriculture - Highland Other Agriculture - Midland Other Agriculture - Lowland Potatoes – Highland
MMMM
-0.67-0.68-0.59-1.18
-1.34-1.37-1.19-2.36
-0.56-0.59-0.16-1.07
Agro-Based Products Coconut Processing Rice Processing
XM
0.571.80
1.153.60
5.892.70
ExportsProcessed Tea X 0.53 1.06 4.15* 50% tariff reduction in non-plantation agricultural sectors only.** 100% tariff reduction in non-plantation agricultural sectors only.# 50% across-the-board tariff reduction.## X: Exportable; M: Importable; N: Non-tradableSource: Somaratne, (1998).

108
Changes in Factor Demand andRate of Land Degradation
Tariff liberalisation encourages ashift of lands in an environmentallyfriendly direction in Sri Lanka. Itincreases land devoted to low soilerosive plantation crops like tea inhigh and mid elevations, and reduces
erosive non-plantation crops (eg.potatoes in highland regions) (Table3). Consequently, it substantiallyreduces the sectoral level of soilerosion in non-plantation sectors aswell as the level of aggregatecultivation of highly erosive crops inthe economy (see Table 4).
Table 3. Projections of the effects of tariff reduction on factordemand (percentage changes)
Crop Sector Rate of Tariff ReductionPolicy 1* Policy 2** Policy 3 #
A. Labour Demand Plantation Crops Tea – Highgrown Tea – Midgrown Tea – Lowgrown Rubber Coconut Export Agriculture Non-Plantation Crops Other Agriculture - Highland Other Agriculture - Midland Other Agriculture - Lowland Potatoes – Highland
0.340.280.680.500.220.88
-1.51-1.43-2.01-2.14
0.670.571.351.010.451.75
-3.01-2.86-4.01-4.29
3.553.425.254.852.687.15
7.527.705.046.88
B. Land UsePlantation Crops Tea – Highgrown Tea – Midgrown Tea – LowgrownNon-Plantation Crops Other Agriculture - Highland Other Agriculture - Midland Other Agriculture - Lowland Potatoes – Highland
0.460.390.92
-0.65-0.69-0.38-1.29
0.920.781.83
-1.30-1.39-0.75-2.58
1.981.814.25
-3.11-3.22-1.74-3.75
* 50% tariff reduction in non-plantation agricultural sectors only.** 100% tariff reduction in non-plantation agricultural sectors only.# 50% across-the-board tariff reduction.Source: Somaratne, (1998)

109
Table 4. Projections of tariff reduction-induced effects on rate of soilerosion (percentage changes)
Crop Sector Tariff ReductionPolicy 1* Policy 2** Policy 3 #
Plantation Crops Tea-Highgrown Tea-midgrown
0.460.39
0.920.78
1.981.81
Non-Plantation Crops Other Agriculture – Highland Other Agriculture – Midland Potatoes - Highland
-0.65-0.69-1.29
-1.30-1.39-2.58
-3.11-3.22-3.75
Aggregate Soil Erosion -0.25 -0.50 -1.13
* 50% tariff reduction in non-plantation agricultural sectors only.** 100% tariff reduction in non-plantation agricultural sectors only.# 50% across-the-board tariff reduction.Source: Somaratne, (1998).
The Cost of Land Degradation
A rigorous estimate of theoverall cost of land degradation24inSri Lanka is not available. This is notsurprising; the valuation of all landdegradation-induced on-site and off-site effects is not an easy task.Environmental damages implicitlyimpose costs on economies that areoften not reflected in market prices.The continued soil loss (ie. depletionof natural capital) might underminefuture generation of income, andrepresents an important barrier to
economic development. Valuation ofthe environment through comparisonof environmental benefits with costsof environmental protection assistspolicy makers to make rationaldecisions. In making choices aboutenvironmental priorities, policies,and standards, government explicitlyor implicitly places values ondamages. Even thoughenvironmental benefits and costs areoften difficult to estimate, it isadvisable to make an effort tomeasure them and assess the trade-offs and risks.
__________________________24. Data used to estimate the land degradation-induced on-site and off-site costs are not included in
this paper due to space limitations. The data are available on request from the author.
110
The estimation of all the on-siteand off-site impacts25 of landdegradation are extremely complex,along with the prevailing technicaland other information problems.However, it is imperative to make aneffort to estimate the cost of possibleand quantifiable impacts to aid in anenvironmentally friendly – ‘green’policy making process. An essentialstep in determining what should bedone about environmental damage, isto value it and compare it with thecost of preventing such damages.Measurements are necessary, sincetrade-offs are unavoidable. In thecase of setting priorities for policyformulation, valuing theenvironmental damage is imperative.
In this context, based onSomaratne26 (1998) estimates, therange of land degradation-inducedon-site cost per hectare per year isestimated to be Rs. 3529 to Rs. 5068.The cost per ton of soil loss per yearis Rs. 141 to Rs. 203. The netaggregate on-site and off-site landdegradation cost per year rangedbetween Rs.Million 2776 to Rs. 3889per year (see Appendix Table 5),
which as a percentage of total GDPranged between 0.72 to 1.0 and as apercentage of total agriculture’sshare of GDP ranged between 2.78 to3.89 (Appendix Table 5). The totalon-site and off-site cost of landdegradation for non-plantation cropsis higher than for plantation cropsunder both methods of evaluation(see Appendix Table 5). The landdegradation-induced on-site cost as apercentage of GDP in Sri Lanka is onpar with the other selected tropicaldeveloping countries. Particularly,on-site cost of land degradation inCosta Rica, Malawi, Mali, andMexico is ranging between 0.5 to 1.5per cent of GDP (World Bank,1992).
The tariff reduction-induced on-site and off-site net environmentalbenefits ranged between Rs. Million9.89 to Rs. Million 43.33 per year,depending on the policy shocks(Appendix Table 6). As a singlepolicy device, tariff liberalisation inthe non-plantation agricultural sector,and the across-the-board tariffreduction creates positive
____________________________________25. See Tobey and Smets, (1996), and Somaratne (1998, and 1999) for a detailed discussion on the
main categories of agricultural environmental costs including land degradation and itsassociated on-site cost (ie. value of loss of on-site production) and off-site agro- environmentalcosts (ie. value of loss of hydropower generation, and production of irrigated agriculture;flushing cost of Kothmale reservoir; O&M cost of upland road network and other off-site costs).
26. Due to space limitations, comprehensive details on methods of measuring the land degradation-induced on-site and off-site environmental costs in Sri Lanka are not included here. SeeSomaratne (1999) for data and details on methods of environmental valuation.
111
environmental benefits throughsaving of natural capital for futureuse to maintain sustainability. In thiscontext tariff liberalisation in thenon-plantation agricultural sector canbe categorised as one of the ‘greentrade policy’ devices, which assiststo gain ‘win-win solutions’.
Concluding Remarks and PolicyImplications
This paper has examined theissue of tariff policy liberalisation inline with proposed GURAA,SAPTA, and SAFTA in a generalequilibrium framework, focusing onlikely macro and meso-economiceffects and policy-induced on-siteand off-site effects of landdegradation in Sri Lanka. Sri Lankahas been implementing major policyreform programmes, including tradepolicy liberalisation in the non-plantation agricultural sectors in SriLanka, anticipating expected futurechanges in the international policyenvironment, such as SAPTA andSAFTA within the SAARCframework and the Indo-Sri Lankatrade agreement (FTA).
Three policy experimentsincluding partial (ie. sectoral) andacross-the-board tariff reductionwere carried out using a CGE modelto examine the likely impacts ofproposed policy changes within theSAPTA and FTA policy framework.
The model outcomes generatedinformation on a range ofconventional macroeconomicperformance indicators. In thiscontext, our results provide a reliablebasis for drawing some robustconclusions about the likely impactof future tariff liberalisation as a‘green policy’ device, and itsmacroeconomic effects, meso-economic (or sectoral) consequencesand land degradation-induced on-siteand of-site effects, particularly in thenon-plantation agriculture.
Based on policy experiments, itshowed conclusively that tariffpolicy liberalisation as a ‘greenpolicy device’ in the specific contextof Sri Lanka would create positiveeconomic and environmental benefitsfor the economy. Trade reformsreduce policy distortions which taxless soil erosive crops like tea, rubberand coconut and managementpractices in the upland and midlandregions and turn incentives awayfrom more erosive crops (ie. non-plantation crops) and croppingsystems. There is a clear need forcomplementary microeconomic andenvironmental policies, which wouldenhance incentives for productivityand marketing improvements tominimise the policy-induceddiseconomies at the farm level.
In this context, furtherliberalisation of tariff policy and the

112
structure in the non-plantationagriculture in Sri Lanka iseconomically viable as a policy of‘greening’ the Sri Lankan trade.There is a possibility of gaining a‘win-win’ solution by enhancing therate of economic growth andreducing the cost of landdegradation-induced externalities.Considering these factors, if policydistortions (ie. tariff protection) innon-plantation agricultural sectorscontinue further, producer benefits inthe short-run will be maintained atthe enormous expense of long-runon-site production losses and off-sitecost of externalities as well as otherdiseconomies in the economy.
The Government sector also hasa role to play in facilitating theformulation of micro,complementary incentive policies toshift the land use pattern from highsoil erosive non-plantation crops tointernationally tradable, low soil-erosive perennial crops like tea,rubber, and spices. Moreover, therole of the private sector has to beredefined in line with the changes inthe national and international policyenvironment (ie. ‘globalisation’).Incentive packages should beformulated for targeted non-plantation agricultural crop sectors toencourage investment, consideringsimilar incentive packagesimplemented in the manufacturingsector (ie. BOI incentive packages).
In this respect, it is advisable toidentify the advantageous exportablecrops and products (ie. spices,horticultural products – ‘bell pepper’,ornamental fish, cut flowers, andother products – arecanut) withinnon-plantation agriculture andimplement the strategy of regionalspecialisation. The provision oftechnological know-how, andplanting materials and adoption ofimproved farm managementpractices should be encouraged eventhrough the private sector.
Sri Lanka has the ability toformulate complementary incentivepackages either through ‘safty nets’or under the declared provisions ofthe ‘Green Box’ of GURAA to safeguard the interests of both farmersand consumers.
The possible complementarymicro level policy options to enhancethe growth of non-plantationagricultural sector would be through:(a) Vertical and horizontal
integration: encouragement ofprivate sector investors for valueadding activities and cropdiversification for exportable andtargeted non-plantation cropsthrough regional specialisationand attractive incentivepackages;
(b) Rural land market: shifting landsfrom high soil erosive annualnon-plantation (ie. food) crops to

113
low soil erosive perennial cropsthrough creation of a rural landmarket by allowing free mobilityof lands; and
(c) Rural capital market: creation ofa rural capital market byremoving existing imperfections;
These micro levelcomplementary policy options wouldenhance the growth of the non-plantation sector and move in theright direction through minimisingthe agro-environmental damages (ie.land degradation) in the long run.
Further, Sri Lanka as a smallopen economy, has the ability to gainbenefits from expected policyliberalisation under GURAA,SAPTA, SAFTA, and globalisation.The potential benefits throughintegrating Sri Lanka into the worldeconomy through marketopportunities for agricultural andmanufacturing products would be:improved and conduciveenvironment for investment intechnological development andadvancement, and gains fromexpansion of exports of tradableagricultural and manufacturingproducts.
Acknowledgement
The author wishes to thank Dr.Sisira Jayasuriya, and Prof. A.H.Chisholm, School of Business, La
Trobe University, Bundoora,Melbourne, Australia for theirsuggestions and comments for theearlier version of this paper.
References
Athukorala, P. (1986). The Impact of1977 Policy Reforms onDomestic Industry. Upanathi:Journal of Sri LankaAssociation of Economists, 1:69-106.
Athukorala, P. (1994). EconomicLiberalization and IndustrialRestructuring in Sri Lanka.Paper Presented at theInternational Conference onEconomic Liberalisation ofSouth Asia, Australian NationalUniversity, Canberra.
Athukorala, P. and S. Jayasuriya(1994). MacroeconomicPolicies, Crises and Growth inSri Lanka. 1969-90. WorldBank, Washington, D.C.
Athukorala, P. and S. Kelegama(1996). Agricultural TradeLiberalisation in the UruguayRound: Implications for SriLankan Agriculture. PaperPresented at the WorldBank/FAO, South Asia, WTOSeminar, Kathmandu, Nepal.
114
Bandara, J.S., I. Coxhead, A.H.Chisholm, A. Ekanayake andS. Jayasuriya (1995).Economic Reforms and theEnvironment in Sri Lanka.Discussion Paper, 27/95,School of Agriculture, LaTrobe University, Australia.
Bandara, J.S. (1989). A MultiSectoral General EquilibriumModel of the Sri LankanEconomy with an Applicationto the Analysis of the Effectsof External Shocks.Unpublished PhD Thesis,School of Economics, LaTrobe University, Melbourne.
Bandara, J.S. (1994). The FiscalImpact of Trade Liberalizationin Sri Lanka. Paper Presentedto the International Conferenceon Economic Liberalisation ofSouth Asia, AustralianNational University, Canberra.
Bhalla, S. (1991). Sri Lanka. In A.Krueger, M. Schiff and A.Valdes (eds.), The PoliticalEconomy of AgriculturalPricing Policy. 2, Asia,Baltimore: Johns HopkinsUniversity Press (for the WorldBank).
Central Bank of Sri Lanka (1996).Annual Report. Central Bank ofSri Lanka, Colombo, Sri Lanka.
Central Bank of Sri Lanka (1999).Annual Report. Central Bank ofSri Lanka, Colombo, Sri Lanka.
Center for International Economics –CIE (1992). The Compositionand Level of Effective Taxesfor Exporting and ImportCompeting Production in SriLanka. Centre for InternationalEconomics, Canberra.
Cuthbertson, S. and P. Athukorala(1991). Sri Lanka. In, A.M.Choksi and D. Papageorgiou.(eds.), EconomicLiberalisation in DevelopingCountries. Oxford: Blackwell.
Dixon, P.B., B.R. Parmenter, J.Sutton and D.P. Vincent(1982). ORANI: A MultiSectoral Model of theAustralian Economy.Amsterdam, North-Holland.
Edirisinghe, N., F. Aberatne, W.G.Somaratne, I. Tudawe and P.Wickramarachchi (1991).Efficiency and PolicyIncentives in Rice Productionin Sri Lanka. ARTI, inCollaboration with IFPRIWashington DC, USA andColombo, Sri Lanka.
Edwards, C. (1993). A Report onProtectionism and TradePolicy in Manufacturing and

115
Agriculture in Sri Lanka.Institute of Policy Studies,Colombo, Sri Lanka.
GATT (1994). The Results of theUruguay Round of MultilateralTrade Negotiations. The LegalText, GATT Secretariat,Centre William Rappard, Ruede Lausanne 154, CH - 1211,Geneva, Switzerland.
Gooneratne, W. and D.Wesumperuma (1984).Plantation Agriculture. In, W.Gooneratne and D.Wesumperuma (eds.), SriLanka: Issues in Employmentand Development, ILO,ARTEP, Bangkok.
Gunawardana P.J. and W.G.Somaratne (1996). EconomicReforms Since 1977 and TheirImpact on DomesticAgriculture in Sri Lanka.Paper Presented to the 25thConference of Economists,Australian National University,Canberra.
Gunawardana P.J. and W.G.Somaratne (1999). EconomicPolicy Regimes and Non-Plantation Agriculture in SriLanka Since 1970. In, W.D.Lakshman and C.A. Tisdell(eds.), Facets of Developmentof Sri Lanka SinceIndependence: Socio-Political,
Economic, Scientific andCultural. EconomicsConference Monograph No: 6,Department of Economics,University of Queensland,Brisbane, Australia.
Gunawardana, P.J. and J.J. Quilkey(1987). Pricing and MarketingPolicies in the Rice Sector of SriLanka: History and Impact,Upanathi: Journal of Sri LankaAssociation of Economists, 1:227-279.
Herat, P.W.R.B.A.U. (1994). AnInvestigation of the Impact ofSome Recent External andInternal Shocks on theEconomy of Sri Lanka.Central Bank of Sri Lanka,Colombo, Sri Lanka.
Jayanthakumaran, K. (1991). TradeReforms and IndustrialPerformance of Sri Lanka(1977-1990): A Survey.Upanathi: Journal of Sri LankaAssociation of Economists, 6:133-147.
Johnson, D.G. (1991). WorldAgriculture in Disarray. 2nd
Edition, London: Macmillan.
Lakshman, W.D. (1994). StructuralAdjustment Policies in SriLanka: Imbalances, StructuralDisarticulation and
116
Sustainability. Paper Presentedto the International Conferenceon Economic Liberalisation ofSouth Asia, Australian NationalUniversity, Canberra.
Martin Will and L.A. Winters(1996). The Uruguay Round:A Milestone for theDeveloping Countries. In, W.Martin and L.A. Winters(eds.), Cambridge: CambridgeUniversity Press.
Panayotou, T. (1990). TheEconomics of EnvironmentalDegradation: Problems Causesand Responses. DevelopmentDiscussion Paper No. 335, ACARE Project Report, HarvardUniversity, Harvard Institutefor International Development,USA.
Presidential Commission on Tariffsand Trade (PCTT) (1994).Report of the PresidentialCommission on Tariffs andTrade, Colombo, Sri Lanka.
Rajapathirana, S. (1988). ForeignTrade and EconomicDevelopment: The Case of SriLanka. World Development, 16:1143-1157.
Ratnayake, R. (1993). PoliticalEconomy of Tariff Reforms inDeveloping Countries: Sri
Lankan Experience. WorkingPapers in Economics, No 113,University of Aucland,Wellingon.
SAARC (1995). Agreement onSAARC Preferential TradingArrangement - SAPTA,SAARC Secretariat,Kathmandu.
Samaratunga, R.H.S. and S.Jayasuriya (1996). RegionalEconomic Integration, Tradeand Investment: South Asiaand APEC. Paper Presented atthe Conference of Economists,Australian National University,Canberra.
Somaratne, W.G. (1998). PolicyReforms and the Environment:General Equilibrium Analysisof Land Degradation in SriLanka. Unpublished PhDThesis, School of Business, LaTrobe University, Bundoora,Australia.
Somaratne, W.G. (1999). The Costsof Land Degradation in SriLanka. Paper Presented to theFifth Annual Symposium onForestry and Environment –Challenges in NaturalResource Conservation in the21st Century, Organised by theDepartment of Forestry andEnvironmental Science,
117
University of SriJayawardenapura inCollaboration with theMinistry of Forestry andEnvironment, Corral GardenHotel, Hikkaduwa, Sri Lanka.
Somaratne, W.G. and W.Wickramasinghe (1993).Efficiency in Rice Productionin Sri Lanka. Paper Presentedat the Symposium on PolicyIssues in Agriculture,Agrarian Research andTraining Institute, Colombo,Sri Lanka.
Stiglitz, J.E. (1987). SomeTheoretical Aspects ofAgricultural Policies, WorldBank Research Observer, 2(1): 43-60.
Tobey, J.A. and H. Smets (1996).The Polluter-Pays Principle inthe Context of Agriculture andthe Environment, The WorldEconomy, 19(1): 63-87.
World Bank (1990). Sri Lanka SectorStudy and ProgrammingMission. Final Report,Washington, D.C.
World Bank (1992). Developmentand the Environment, WorldDevelopment Report-1992,New York: Oxford UniversityPress, Inc.
World Bank (1995). Sri Lanka: Non-Plantation Crop Sector PolicyAlternatives. Working Papers 1-7, Agriculture and NaturalResource Division, South AsiaRegion, The World Bank,Washington D.C..
World Trade Organization (WTO)(1996). Trade Policy ReviewBody - Sri Lanka; Report by theSecretariat - Summary andObservations, World TradeOrganisation, Geneva.

118
Appendix Table 1: Tariff concessions granted by Sri Lanka under the 1st
round of negotiations in the SAPTA agreement
H.S.Code Description TariffRate (%)
Extent of TariffConcession (%)
Remarks
For non-LDCs
For LDCs
0805.10 Orange(SAARC) 20%
35 15% ofSAARC rate
0808.10 Apples SAARC20%
35 15% ofSAARC rate
0909.20 Seeds ofCoriander
10 10% oftariff rate
0910.10 Dried Ginger 35 10% of tariffrate
200620072008
Processed Fruits 3515% of tariffrate
Appendix Table 2: Tariff concessions granted by Sri Lanka under the 2nd
round of negotiations in the SAPTA agreement
H.S.Code Description TariffRate(%)
Extent of TariffConcession (%)
Any SpecialNTBs withParticular
Fornon-
LDCs
For LDCs reference toQBs
0713.40 Lentils 35 - 20 Nil0805.20 Mandarins (including
tangerines & statusumas)clementines, wilkingsand similar citrus hybrids
35 - 60 Nil
0808.10 Apples 35 - 60 Nil
119
Appendix Table 3: Rates of import tariff imposed on selected non-plantation agricultural crop sectors in Sri Lanka(1986/88 – 1998).
Products Tariff Rate (%)1986/88 1994 1996 1998
Potatoes 100 35% or Rs. 12.00 per kg 35 35Red OnionsB’Onions
55
35% or Rs. 9.00 per kg35% or Rs. 9.00 per kg
3535
3535
Greengram (Moong)Blackgram (Oorid)Split LentilesOther
5555
35% or Rs. 10.00 per kg35% or Rs. 10.00 per kg45% or Rs. 12.00 per kg35% or Rs. 12.00 per kg
35353535
35353535
Dried ChilliesOther
5-
35% or Rs. 20.00 per kg35% or Rs. 10.00 per kg
35 35
Maize 5 45% 35 35Rice 25 35% or Rs. 7.00 per kg 35 35Cane SugarBeet Sugar
35% or Rs. 6.50 per kg35% or Rs. 6.50 per kg
35 35
Wheat 25 N/A 20 20Ginger 60 N/A 35 35Turmeric 60 N/A 35 35Saffron 60 N/A 35 35Seeds of anise 5 N/A 35 35Coriander 5 N/A 10 10Cummin seed 5 N/A 10 10Fennel seed 5 N/A 10 10
Source: Department of Customs, Sri Lanka (for 1986/88; 1996; 1998).Report of the Presidential Commission on Tariffs and Trade - 1994, (for 1994);N/A: Not Available .

120
Appendix Table 4: Structure of incentives for agricultural commoditiesin Sri Lanka
Sector 1988-1991 1992-1993
NPC EPC NPC EPCESC#(1993)
A. Import CompetingAgriculture
RiceOther Agriculture
Chillies Potatoes B’onion Lentils (1990-1993) Other Food Items Sugar
Milk White flour/bread
-1.22.0----
1.31.01.1
-1.52.8----
1.61.01.8
(1.33)1.32.0
(1.5)(1.6)(2.4)(1.2)
1.41.01.3
(1.53)*1.5(1.36)2.8 (1.7)----
1.71.01.9
1.681.561.79----
---
B. Export OrientedAgriculture
Plantation Agriculture Tea and Rubber Coconut
--0.81.4
--0.61.6
--1.01.2
(1.02)(1.0)1.01.4
1.061.031.041.02
C. Agriculture-Average 1.3 1.6 1.3 1.6 (1.24) 1.32D. Manufacturing Import Competing Manufacturing Export-Oriented
Manufacturing
1.4
-
-
1.8
-
-
1.3
-
-
1.7 (1.3)
(1.7)
(1.0)
-
-
-
NPC: Nominal Protection Coefficient - the ratio of domestic price overboarder equivalent (world) price;
EPC: Effective Protection Coefficient - the ratio of value added underexisting trade policy intervention to value added at border price;
ESC: Effective Subsidy Coefficient - EPC adjusted for net subsidies onnon-traded inputs;
* Figures in the parenthesis are based on the World Bank (1995)estimates;
# All figures of ESC are based on World Bank (1995) Estimates;Source: Report of the Presidential Commission on Tariff and Trade, 1994;
Edwards (1993); and World Bank (1995).

121
Appendix Table 5: Land degradation-induced on-site and off-siteenvironmental cost: aggregate results #
Cost Component Environmental Cost (per year)
Per Hectare(Rs.)
Per Tonof SoilLoss(Rs.)
Total(Rs.Milli
on)
1. On-Site Cost(a) Value of Loss of Productivity Method (VLPM)(b) Value of Loss of Nutrients Method (NRCP)
35295068
141203
25533667
2. Off-Site Cost(a) Value of Loss of Irrigated Agriculture(b) Value of Loss of Hydro-Power Generation(c) Flushing cost of Kothmale Reservoir(d) O&M cost of highways in the Upland(e) Cost of other off-site damages **Sub Total - Total Off-Site Cost
117.48 9.81
25.76103.2051.26
307.51
4.69 0.391.034.132.05
12.29
85.07.1
18.674.737.1
222.53. Total Environmental Cost (3=1+2)(a) Based on (VLPM)(b) Based on (NRCM)
38565375
153215
2775.63888.8
4. Aggregate Farm Income Foregone(Rs.Million/year)5. Aggregate Farm Income Foregone (Rs/hec/year)6. Aggregate Market Margin Foregone
(Rs.Million/year)7. Aggregate Market Margin Foregone (Rs/hec/year)
2081
1447
1506.06
1047.07
8. Total Environmental Cost(a) as a percentage of GDP(i) Based on VLPM(ii) Based on NRCM(b) As a percentage of Agriculture’s Share of GDP(i) Based on VLPM(ii) Based on NRCM(c) As a Percentage of Total Value of FarmgateProduction in the Upland(i) Based on VLPM(ii) Based on NRCM
0.721.00
2.783.89
0.240.33
** The other off-site damages include downstream flood, health hazards, and cost ofpurification of drinking water
# Data used to estimate the land degradation-induced on-site and off-site costs are notincluded in this paper for space limitations. The data are available on request fromthe author.
Source: Somaratne, (1999).

122
Appendix Table 6: Projections of the effects of tariff reduction on on-site and off-site environmental cost (Rs. Million/year)
Components Tariff ReductionPolicy 1* Policy 2** Policy 3***
VLPM#
NRCM##
VLPM NRCM VLPM NRCM
1. Base Case On-Site Cost 2553.13 3666.32 2553.13 3666.32 2553.13 3666.32 Off-Site Cost 224.89 224.89 224.89 224.89 224.89 224.89Total EnvironmentalCost
2778.02 3891.21 2778.02 3891.21 2778.02 3891.21
2. With Policy On-Site Cost Off-Site Cost
2543.75224.38
3657.37224.38
2534.3223.87
3648.07223.87
2512.17222.61
3625.27222.61
Total EnvironmentalCost
2768.14 3881.76 2758.17 3871.94 2734.78 3847.88
3. Net Policy Gains Total On-site Gains Total Off-site Gains
9.380.5
8.950.5
18.831.02
18.251.02
40.962.28
41.052.28
Aggregate Net PolicyGains
9.89 9.45 19.85 19.27 43.24 43.33
4. Value of Policy-induced Net Gains as aPercentage of(a) Agriculture’s share
of GDP0.01 0.01 0.02 0.02 0.04 0.04
(b) Total GDP 0.003 0.003 0.005 0.005 0.011 0.012(c) Total Environmental
Cost0.36 0.24 0.72 0.50 1.58 1.13
* Policy 1: 50% tariff reduction in non-plantation agricultural sectors only.** Policy 2: 100% tariff reduction in non-plantation agricultural sectors only.*** Policy 3: 50% across-the-board tariff re2duction.
# VLPM: Value of Loss of Productivity Method## NRCM: Nutrient Replacement Cost Method