Embed Size (px)
Citation preview
Greening Supply Chains TPM 2015
Nate Springer, BSR
Blair Chikasuye, HP
Sarah Flagg, DAMCO
Lee Kindberg, Maersk

BSR (Business for Social Responsibility) A global nonprofit organization that works with its network of more
than 250 member companies to build a just and sustainable world.
BSR develops sustainable business strategies and solutions
through consulting, research and cross-sector
collaboration.
Clean Cargo Working Group A leading global carrier-shipper initiative dedicated to
environmental performance improvement in marine container transport
through measurement, evaluation and reporting

Create practical tools for measuring, evaluating and
reporting the environmental impacts of global goods
transportation
Help ocean freight carriers track and benchmark
their performance and easily report to customers in a
standard format
Allow shipping customers to review and compare
carriers’ environmental performance when
reporting and making informed buying decisions
CCWG | Our Mission
© Copyright 2012 Hewlett-Packard Development Company, L.P. The information contained herein is subject to change without notice. 5
HP Global Logistics Environment Program
Blair Chikasuye
HP Global Logistics Environment Program

© Copyright 2014 Hewlett-Packard Development Company, L.P. The information contained herein is subject to change without notice. 6
HP’s Greenhouse Gas Reduction Goals…
105 PCs
7 Servers
880 Ink/Toner Cartridges
Every 60 Seconds HP
ships… 88
Printers
20% 20% 40%

© Copyright 2012 Hewlett-Packard Development Company, L.P. The information contained herein is subject to change without notice. 7
HP Logistics Environmental Opportunities…
Logistics CO2 Reduction
Programs
Increase the efficiency of our product
transportation network
• Minimize size/weight of shipments
• Decrease distance products travel -
consolidate shipments
• Shift toward environmentally friendly
transport modes
- Air to Ocean, Truck to Rail, etc.
• Influence our logistics services providers
(LSPs) to decrease emissions
• Redesign product packaging to optimize
product transportation
Environmental Criteria
Utilize environmental factors in the LSP
selection process
Total
Cost of
Business
Cost Savings CO2
Reductions
Network Enhancement and Optimization
Programs Drive CO2 Reductions
Weight/Distance/Mode of Transport CO2 Factor

© Copyright 2012 Hewlett-Packard Development Company, L.P. The information contained herein is subject to change without notice. 8
Industry Leadership - Logistics Environment
Associations
Trucking Air
Freight
Ocean
Freight
US EPA
SmartWay
Global Logistics
Emissions Council Climate and Clean
Air Coalition (UN)
Clean Cargo
Working Group
Green Freight
Europe
Green Freight
Asia
International Air
Transport Assoc.
Green Freight
Latin America **
China Green
Freight Initiative
Industry Leadership
Green Freight
India **
** In development
GreenHouse Gas Protocol
(World Resource Institute)
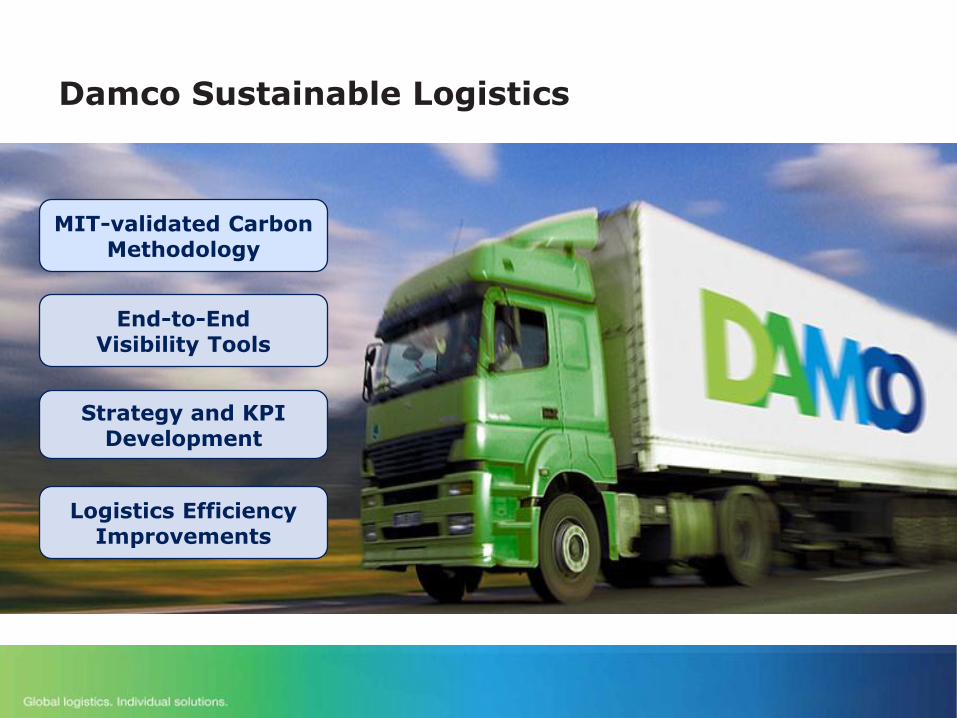
Damco Sustainable Logistics
9 February 27, 2015
End-to-End Visibility Tools
Strategy and KPI Development
Logistics Efficiency Improvements
MIT-validated Carbon Methodology
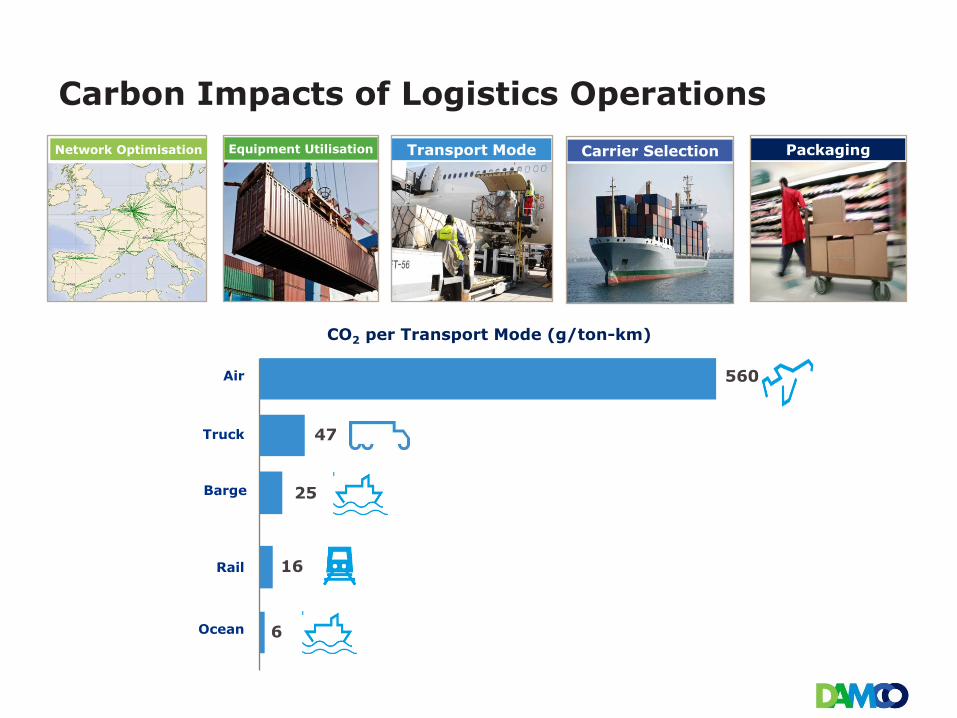
Carbon Impacts of Logistics Operations
Network Optimisation Equipment Utilisation Carrier Selection Packaging Transport Mode
Air
Truck
Ocean 6
16
47
560
Rail
25 Barge
CO2 per Transport Mode (g/ton-km)

Logistics Sustainability = Efficiency
Improved Container Utilization Modal Shift: Air to Sea-Air
Air Ocean
Operational Impact: modal shift from 100% air to 50% air, 50% ocean
Cost Impact: 50% savings potential identified
Carbon impact: 69% reduction in CO2
10%
25%
30%
35%
To-Be
12%
23%
28%
37%
20 Dry
40 Dry
40 High
45 High
As-Is
Operational Impact: 15% reduction in container volume
Cost Impact: 14% savings potential identified
Carbon impact: 16% reduction in CO2
Insert department name via
‘View/Header and Footer…’
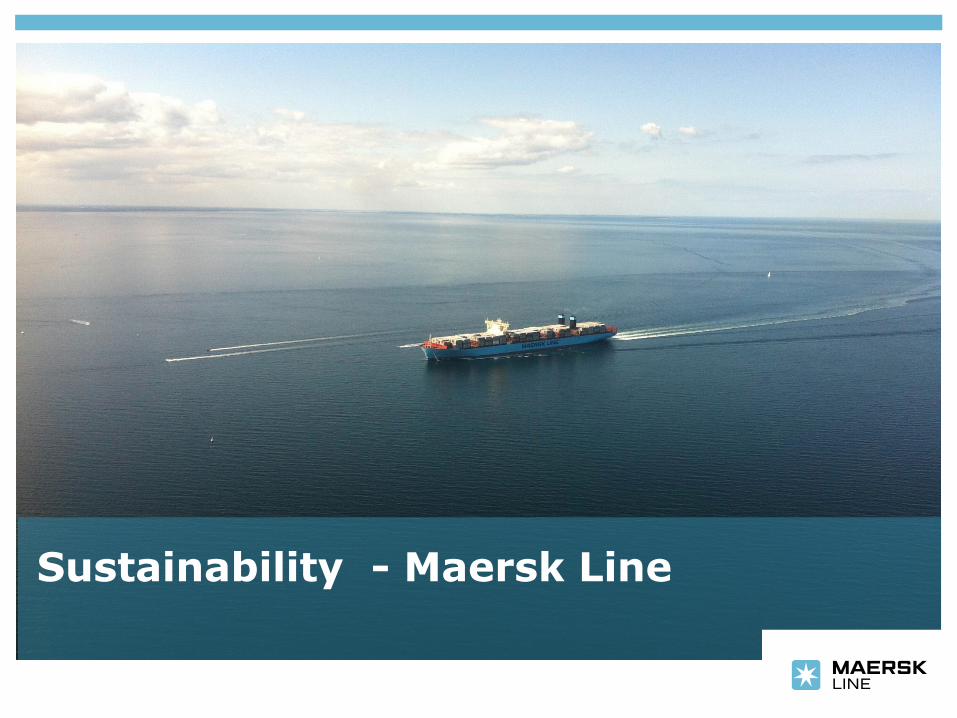
Sustainability - Maersk Line

Insert department name via
‘View/Header and Footer…’
• Maersk Line is an enabler of global trade, connecting goods and services to people and economies around the globe
• Shipping affects the lives of billions of people, with 90% of the world’s international trade travelling by sea
• With our global presence, we create local employment and stimulate business activity in more than 125 countries

Insert department name via
‘View/Header and Footer…’
Container shipping is the most energy-efficient means to move high volumes of goods across long distances. However, in absolute terms, the environmental impacts of the industry are significant :
Our environmental impacts, end 2013:
1. CO2 emissions: 27.7 million tonnes
2. 488,000 tonnes SOx emissions
702,000 tonnes NOx emissions
3. 272,000 tonnes of waste
4. Ballast water, risk of discharges or spills
5. Use of paint and chemicals
It Starts With Transparency
Insert department name via
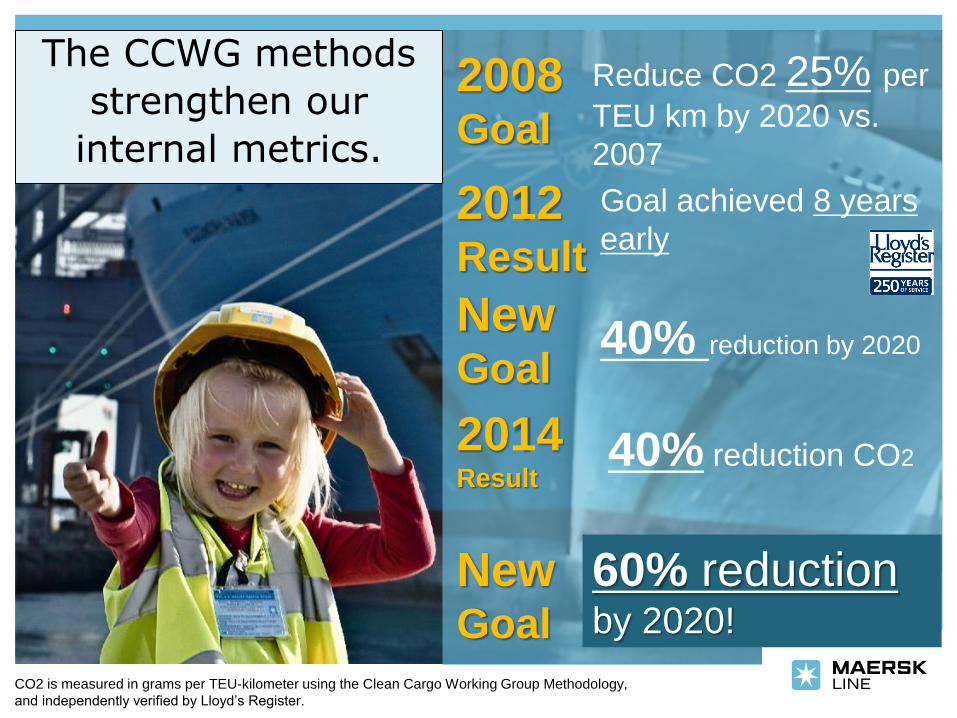
‘View/Header and Footer…’ CO2 is measured in grams per TEU-kilometer using the Clean Cargo Working Group Methodology,
and independently verified by Lloyd’s Register.
2008 Goal
2012 Result
New Goal
Reduce CO2 25% per
TEU km by 2020 vs.
2007 Goal achieved 8 years
early
40% reduction by 2020
40% reduction CO2 2014 Result
The CCWG methods
strengthen our
internal metrics.
New Goal
60% reduction
by 2020!

Insert department name via
‘View/Header and Footer…’
Since 2007, Maersk Line has managed to grow our business and at the same time reduce the impacts on the environment
• Maersk Line reduced CO2 emissions by 8% per container during 2014 alone
• Since 2007, we have reduced CO2 emissions by 40% per container transported (g CO2/TEU km)
• Maersk Line’s new goal is to reduce our CO2 emissions by 60% per container transported by 2020.
Big impact, big responsibility, big progress
Decoupling growth from resource consumption

Insert department name via
‘View/Header and Footer…’
Comparing Routes for CO2 Emissions Example: Central America to Atlanta
Routing via… Total
Distance CO2 per
FFE
Miami 2574 km 1.47 kg
Savannah 2601 km 0.82 kg
Difference 1% -44%

Nate Springer – BSR Advisory Services
Blair Chikasuye – HP Global Logistics Environment
Program
Sarah Flagg – DAMCO Sustainable Logistics
Lee Kindberg – Maersk Line Environment and
Sustainability
18
CCWG | Thank You!

Annex
19

*Changes in carrier representation or global trade conditions likely explain a portion of these results
CCWG | Our Resources
CCWG Tools, Blogs, Reports
Guide: How to Calculate and
Manage CO2 Emissions from
Ocean Transport
Report: Global Maritime Trade
Lane Emissions Factors 2014
Report: CCWG Progress
Report 2013
Guide: How CCWG Shippers
Use, Integrate, and Benefit
from Ocean Transport
Emissions Data
Blog: How BSR’s CCWG
Helps Shippers Improve
Environmental Performance

Continue delivering best practice sharing, tool
development and cross-modal harmonization efforts that
enhances shipper capacity for performance
improvement leadership.
Continue to drive market clarity and enhanced capacity
for impact on our goals via the creation of one
global maritime initiative with CSI.
CCWG | 2015 Activities

CCWG | Our Members
Cargo Carriers Cargo Owners (Shippers) and LSP’s
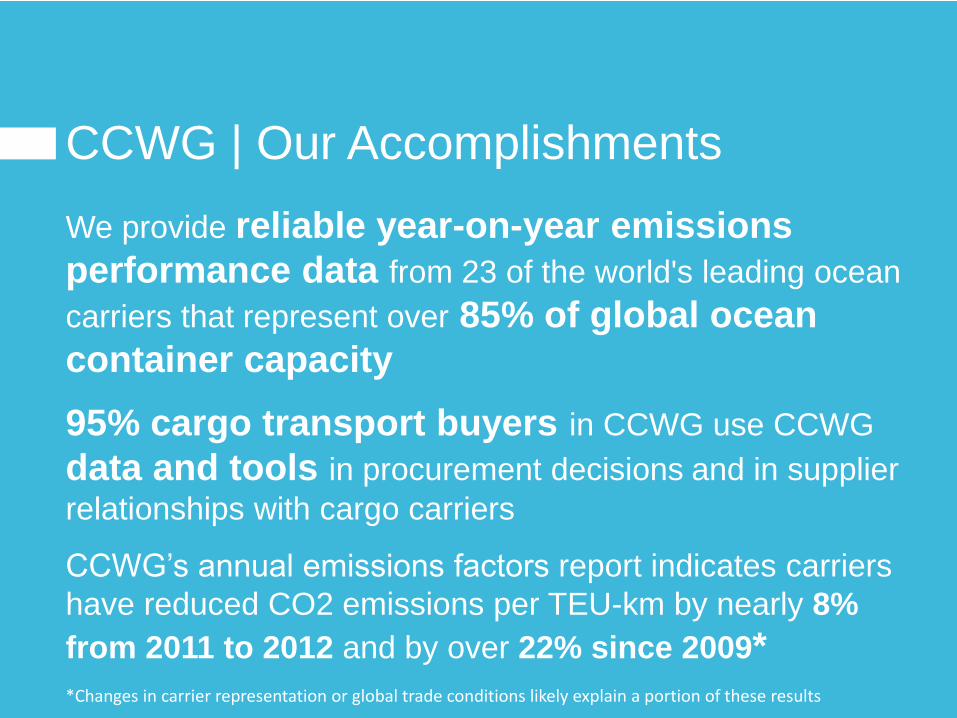
We provide reliable year-on-year emissions
performance data from 23 of the world's leading ocean
carriers that represent over 85% of global ocean
container capacity
95% cargo transport buyers in CCWG use CCWG
data and tools in procurement decisions and in supplier
relationships with cargo carriers
CCWG’s annual emissions factors report indicates carriers
have reduced CO2 emissions per TEU-km by nearly 8%
from 2011 to 2012 and by over 22% since 2009*
CCWG | Our Accomplishments
*Changes in carrier representation or global trade conditions likely explain a portion of these results

© Copyright 2012 Hewlett-Packard Development Company, L.P. The information contained herein is subject to change without notice. 24
GHG Reductions
Alternative fuels
CO2 Footprint
Living Progress
Industry Leadership
Awards / Communications
External Awards and Accolades
Drive CO2 standards and methodologies by
modes of transport on a global basis
Annual report highlighting HP’s commitment
to global citizenship, including Product
Transport programs and initiatives
Partner with our Logistics Service Providers to
calculate the CO2 emissions for the shipments they
transport on behalf of HP.
Convert shipments to more
environmental friendly vehicles / fuel
types (CNG / LNG, hybrid, dual fuel,
etc.)
Decrease CO2 emissions by reducing the size/weight
of our shipments, minimizing the distance travelled
and converting to more environmental friendly modes
of transport
#1
SmartWay Excellence Award winner 2014,
2012, and 2008
Green Freight Asia “Green Supply Chain”
Award for 2014
1st High Tech company to announce Product
Transportation GHG reduction goal
1st High Tech Company to maintain GHG
Reduction Goals for all phases of our Value
Chain
6/2/15 Living Progress Release
Date Global Movements converted
since Jan 2014 (CNG/LNG,
Dual Fuel, etc.)
20% Goal: Reduction in transport-related GHG
emissions by 2020 using 2010 as a
baseline
(Tracking our product transportation GHG
reductions on an annual basis)
HP Global Logistics Environment Program
Leadership Innovation
Communication
1.6M FY13 Product Transport CO2
Footprint (in metric tones) 9
Worldwide number of Logistics enviornmental
associations / initiatives HP is engaged
(EPA SmartWay, Green Freight Asia, Green
Freight Europe, Green Freight Latin America,
Clean Cargo, International Air Transportation
Association, Global Logistics Emissions Council,
UN Climate & Clean Air Coalition, China Green
Freight Initiative)
>1.5K

© Copyright 2012 Hewlett-Packard Development Company, L.P. The information contained herein is subject to change without notice. 25
“Green Label” Programs – Asia Pacific/EMEA
• Leverage US EPA SmartWay methodologies
• Different criteria for Shippers / Carriers
Shippers:
- Commitment, Data, Use in RFQs, Transparency in CO2 emissions / goals
Carriers:
- Commitment, Data, Vehicle technologies, Transparency in CO2 emissions /
goals
• Leaf 1 for both Green Freight Asia* / Green
Freight Europe
Commitment Improvement Validation/Enforcement Visibility
* HP on Board of Directors

© Copyright 2014 Hewlett-Packard Development Company, L.P. The information contained herein is subject to change without notice. 26
HP’s New Logistics Gateways…
Trans-Eurasian Rail -Chongqing, China to Western Europe
Port of Piraeus (Greece) -Asia to Europe, Middle East and Africa
Panama Canal -Expansion program completed by end
of 2015
Benefits:
• Simplify Global Network
• Improve End to End Transit Times
• Reduce Inventory Costs
• Decrease CO2 emissions
Mode Conversion Decrease Distance

Insert department name via
‘View/Header and Footer…’
Better energy efficiency cuts CO2 and makes great business sense.
We optimise our network and vessels operation
Our new vessels – such as Triple-E – set new standards on energy efficiency
Our existing fleet is being retrofitted with new technologies
We partner with charter owners to improve energy efficiency – including vessel retrofits
We are involved in the development of potential alternative energy for shipping

Insert department name via
‘View/Header and Footer…’
Opportunities for supply chain impact reduction:
Source: World Economic Forum – Supply Chain Decarbonization – the Role of Logistics and Transport in Reducing Supply Chain Carbon Emissions
ABATEMENT POTENTIAL
FEA
SIB
ILITY
IN
DEX
De-speeding
the Supply
Chain
(18%)
Clean Vehicle
Technologies
(18%)
Optimized
Networks
(13%) Low Carbon
Sourcing &
Manufacturing
(16%) Near
Shoring
(?%)
Packaging
Reduction
(14%)
Modal
Switches
(12%)
Reverse
Logistics
(9%)
Energy
Efficient
Buildings
(<5%)
28

Insert department name via
‘View/Header and Footer…’
Transportation Emissions can be reduced.
Part of supply chain Driver of emissions Ways to reduce emissions (examples)
Ocean transportation
Air transportation
Port moves
Domestic
distribution
Warehousing
• Volume moved
• km covered
• kg moved
• km covered
• Number of containers
• Transportation mode
(truck vs. rail)
• km covered
• Volume moved
• Number of days in
warehouse
• Number of CBM
• Higher container utilisation
• Use of more eco-friendly
carriers
• Air to Sea-Air conversion
• Higher container utilisation
• 20’ to 40’ conversion
• CFS-CY conversion
• Higher utilisation of delivery trucks/vans
• Double-decker trailers
• Increased use of rail
• Use of bio-fuel
• Reduce safety stock
• DC bypassing
Insert department name via
‘View/Header and Footer…’
1. Consistent calculator
2. Celebrate successes
3. See the big picture
4. Focus on improvements
5. Opportunity: work together
What we’ve learned about supply chain calculations: