Embed Size (px)
Citation preview
Please cite this paper as:
Drakenberg, O. et al. (2009), "Greening DevelopmentPlanning: A Review of Country Case Studies for Makingthe Economic Case for Improved Management ofEnvironment and Natural Resources", OECD EnvironmentWorking Papers, No. 5, OECD publishing, © OECD.doi:10.1787/227348018366
OECD Environment Working PapersNo. 5
Greening DevelopmentPlanning
A REVIEW OF COUNTRY CASE STUDIES FORMAKING THE ECONOMIC CASE FOR IMPROVEDMANAGEMENT OF ENVIRONMENT ANDNATURAL RESOURCES
Olof Drakenberg*, Sandra Paulsen,Jessica Andersson, Emelie Dahlberg,Kristoffer Darin Mattsson,Elisabeth Wikstrom
JEL Classification: O13, O19, O29, Q1, Q56, Q58
*SIDA Helpdesk for Environmental Economics, University ofGothenburg, Sweden
Unclassified ENV/WKP(2008)4 Organisation de Coopération et de Développement Économiques Organisation for Economic Co-operation and Development 26-Jan-2009 ___________________________________________________________________________________________
English - Or. English ENVIRONMENT DIRECTORATE
ENVIRONMENT WORKING PAPER No. 5 GREENING DEVELOPMENT PLANNING: A REVIEW OF COUNTRY CASE STUDIES FOR MAKING THE ECONOMIC CASE FOR IMPROVED MANAGEMENT OF ENVIRONMENT AND NATURAL RESOURCES
By Olof Drakenberg (1), Sandra Paulsen (2), Jessica Andersson (3), Emelie Dahlberg (1), Kristoffer Darin Mattsson (2), Elisabeth Wikstrom (2).
(1) SIDA Helpdesk for Environmental Economics, University of Gothenburg, Goteborg, Sweden (2) Swedish Environmental Protection Agency, Stockholm, Sweden (3) Swedish International Development Cooperation Agency, Stockholm, Sweden JEL classification: O13, O29, O19, Q01, Q56, Q58 Keywords: Sustainable Development; Government Policy; Development co-operation; Natural resources management; Environmental Economics
All Environment Working Papers are available at www.oecd.org/env/workingpapers.
JT03258655
Document complet disponible sur OLIS dans son format d'origine Complete document available on OLIS in its original format
EN
V/W
KP(2008)4
Unclassified
English - O
r. English
ENV/WKP(2008)4
2
OECD ENVIRONMENT WORKING PAPERS
This series is designed to make available to a wider readership selected studies on environmental issues prepared for use within the OECD. Authorship is usually collective, but principal authors are named. The papers are generally available only in their original language English or French with a summary in the other if available. The opinions expressed in these papers are the sole responsibility of the author(s) and do not necessarily reflect those of the OECD or the governments of its member countries. Comment on the series is welcome, and should be sent to either [email protected] or the Environment Directorate, 2, rue André Pascal, 75775 PARIS CEDEX 16, France.
--------------------------------------------------------------------------- OECD Environment Working Papers are published on
www.oecd.org/env/workingpapers ---------------------------------------------------------------------------
Applications for permission to reproduce or translate all or part of this material should be made to:
OECD Publishing, [email protected] or by fax 33 1 45 24 99 30.
Copyright OECD 2008
ENV/WKP(2008)4
3
ABSTRACT
Different approaches to making the economic case for improved management of natural capital in national planning are reviewed in this report. In many low-income countries natural resources sectors (agriculture, mining, forestry, fishery, nature-based tourism) are identified as the engines of economic growth. However, a majority of the ecosystems on which human well-being depends are being degraded. The difficulties in providing economic and policy-relevant information about sustainable economic management of natural capital are often seen as an important reason for inadequate integration of the environment in macroeconomic and sector polices. The report concludes that the analysed country studies (Lao People's Democratic Republic, Mozambique, Peru, Tajikistan and Uganda) mainly relied on existing domestic or international analytical work, used relatively basic calculations/data (such as the market value of fisheries, the value of timber sold etc.) and often formed part of a broader analytical effort. Examples of findings in the country reports include prospects for increasing fiscal revenues from natural resources with more than 150 % (Mozambique) and estimates of costs associated with poor environmental management to be equivalent to 3.9 % of GDP (Peru). By involving policy makers in the process of making the country reports, and focusing on environmental and natural resources issues in function of their links with prioritised objectives like economic growth, poverty reduction and public health, the chances to influence policy making have been enhanced. Drawing from the review of these country case studies as well as literature on public policy, this report provides recommendations for governments wishing to undertake an economic analysis of the environment and natural resources management for planning purposes, and for OECD members interested in supporting the process. JEL classification: O13, O29, O19, Q01, Q56, Q58 Keywords: Sustainable Development; Government Policy; Development co-operation; Natural resources management; Environmental Economics
ENV/WKP(2008)4
4
RÉSUMÉ
Ce rapport examine différentes approches pour défendre du point de vue économique l’amélioration de la gestion du capital naturel dans le cadre de la planification du développement national. Dans beaucoup de pays à faible revenu, les secteurs fondés sur les ressources naturelles (agriculture, activités extractives, foresterie, pêche, tourisme de nature) sont les moteurs de la croissance économique. Pourtant, la majorité des écosystèmes dont dépend le bien-être humain subissent des dégradations. On considère souvent que si l’environnement n’est pas convenablement pris en compte dans les politiques macro-économiques et sectorielles, c’est en grande partie parce qu’il est difficile de produire des informations économiques utiles à l’action des pouvoirs publics sur la gestion économique durable du capital naturel. Les études de cas par pays analysées pour ce rapport (qui concernent le Mozambique, l’Ouganda, le Pérou, la République démocratique populaire lao et le Tadjikistan) reposent principalement sur des travaux analytiques menés précédemment au niveau national ou international, font appel à des calculs et des données relativement simples (comme la valeur marchande des pêcheries, la valeur des ventes de bois, etc.) et s’inscrivent souvent dans une démarche analytique plus vaste. Il ressort par exemple des études de cas que le Mozambique pourrait accroître de plus de 150 % les recettes fiscales provenant des ressources naturelles, et que les carences de la gestion de l’environnement coûtent d’après les estimations l’équivalent de 3.9 % de son PIB au Pérou. En associant des responsables de l’action gouvernementale à l’élaboration des rapports par pays et en mettant l’accent sur les liens entre les questions touchant à l’environnement et aux ressources naturelles et les objectifs déclarés prioritaires tels que la croissance économique, la lutte contre la pauvreté et la santé publique, on a augmenté les chances de peser sur l’élaboration des politiques. Faisant fond sur ces études de cas par pays ainsi que sur les études consacrées à l’action des pouvoirs publics, le présent rapport propose des recommandations à l’intention des gouvernements désireux d’analyser sous l’angle économique la gestion de l’environnement et des ressources naturelles pour les besoins de la planification, de même qu’à l’intention des membres de l’OCDE qui souhaitent soutenir ce processus. Classification JEL : O13, O29, O19, Q01, Q56, Q58 Mots clé : Développement durable ; Politiques gouvernementales ; Coopération pour le développement ; gestion des ressources naturelles ; Economie de l'environnement
ENV/WKP(2008)4
5
FOREWORD
This report is one in a series prepared for the Task Team on Governance and Capacity Development for Natural Resources and Environmental Management under the OECD Environment Policy and Development Assistance Committees. The project aims to update OECD guidelines for capacity development for environment and provide guidance on selected topics. This is the final report on making the economic case for the environment. The report was discussed and approved by Members of the Joint Task Team under the Development Assistance Committee’s ENVIRONET and Environment Policy Committee’s Working Party on Global and Structural Policies at its meeting on 25 September 2008.
For information about this study please contact:
• Olof Drakenberg, Sida Helpdesk for Environmental Economics at the University of Gothenburg, lead author of this study at [email protected]
More information about the task team and related OECD papers and publications in this area can be found at the OECD website www.oecd.org/dac/environment, or contact:
• Roberto Martín-Hurtado, email: [email protected], and
• Anna Brüderle, email: [email protected]. Acknowledgements The authors would first like to thank the practitioners involved in the respective country analysis for sharing their experiences: Lao PDR Lucy Emerton (IUCN), Mozambique Sergio Margoulis (World Bank), Peru Yewande Awe (World Bank), Tajikistan lhom Akobirshoev (SIDA), Uganda Gil Yaron (GY Associates). Second, we would like to thank the members of the OECD Task Team on Governance and Capacity Development for Natural Resources and Environmental Management and in particular Jos Lubbers, Merete Willums Pedersen, Steve Bass, Tamara Levine, John Horberry, Axel Olearius, Angela Bularga and Mats Olsson for providing guidance and useful comments on earlier versions of this report. Finally, thanks also to Wilfred Nyangena and to Paul Steele and his colleagues from the Poverty Environment Initiative for being valuable discussants during the process.
ENV/WKP(2008)4
6
TABLE OF CONTENTS
ABSTRACT ................................................................................................................................................... 3
RÉSUMÉ ........................................................................................................................................................ 4
FOREWORD .................................................................................................................................................. 5
EXECUTIVE SUMMARY ......................................................................................................................... 8
1. INTRODUCTION .................................................................................................................................... 10
1.1 Why make the economic case for improved management of environment and natural resources in national planning? ..................................................................................................................................... 10 1.2 About the report .............................................................................................................................. 12
2. THE COUNTRY REPORTS .................................................................................................................... 15
2.1. Getting the numbers ....................................................................................................................... 17 2.2 Dealing with poor data ................................................................................................................... 18 2.3 Time and budget for country reports .............................................................................................. 19
3. ANALYSIS OF THE COUNTRY REPORTS ......................................................................................... 20
3.2 Relate key messages to policy priorities......................................................................................... 22 3.3 Let needs direct the focus ............................................................................................................... 23 3.4 Strive for credibility ....................................................................................................................... 24 3.5 Increase communication and outreach ........................................................................................... 25
4. CONCLUSIONS AND RECOMMENDATIONS ................................................................................... 26
4.1 Conclusions .................................................................................................................................... 26 4.2 Recommendations .......................................................................................................................... 27
5. LOOKING AHEAD ................................................................................................................................. 29
REFERENCES ............................................................................................................................................. 30
ANNEX A. COUNTRY STUDIES .............................................................................................................. 34
LAO PDR ..................................................................................................................................................... 34
MOZAMBIQUE ........................................................................................................................................... 38
PERU ............................................................................................................................................................ 42
TAJIKISTAN ............................................................................................................................................... 46
UGANDA ..................................................................................................................................................... 49
SOURCES OF INFORMATION FOR CASE STUDIES ............................................................................ 52
ANNEX B. GUIDE TO FURTHER READING .......................................................................................... 53
ANNEX C. COUNTRIES INCLUDED IN THE PRSP REVIEW .............................................................. 55
ANNEX D. VALUATION METHODS ....................................................................................................... 56
ENV/WKP(2008)4
7
Tables
Table 1. Country facts ......................................................................................................................... 15 Figures
Figure 1. Linking environmental investment to human wellbeing and pro-poor economic growth .... 10 Figure 2. Whose interests should set the boundaries for the economic analysis? ................................ 21 Figure 3. Disaggregating health costs with respect to air and water pollution ..................................... 23 Figure 4. Cost of environmental degradation in Peru by category (billion Soles per year) ................. 23
Boxes
Box 1. The Stern Review: Some lessons about an influential economic case .......................................... 12 Box 2. National Development Plans and Poverty Reduction Strategies: Important but insufficient entry point for environmental integration? ......................................................................................................... 13 Box 3. Can analytical work influence policy making? ............................................................................. 14 Box 4. Brief description of selected country reports ................................................................................. 16 Box 5. Economic values ............................................................................................................................ 17 Box 6. Benefit transfer should be applied with care ................................................................................. 57
ENV/WKP(2008)4
8
EXECUTIVE SUMMARY
In many low-income countries natural capital constitutes a quarter of national wealth. Natural resources sectors (agriculture, mining, forestry, fishery, nature-based tourism) are highlighted as the engines of economic growth in national planning documents. However, a majority of the ecosystems on which human well-being depend are being degraded. Environmental degradation threatens prospects for economic growth and poverty reduction despite the general trend of improved environmental legislation that has emerged to a large extent in response to multilateral environmental agreements.
The difficulties of providing economic and policy-relevant information about sustainable economic management of natural capital are often seen as an important reason for inadequate integration of the environment in macroeconomic and sector polices.
This report reviews different approaches to making the economic case for improved management of natural capital and describes how this has informed national development planning in Lao People’s Democratic Republic (PDR), Mozambique, Peru, Tajikistan and Uganda. The report, which draws from a review of these country case studies as well as literature on public policy, discusses how analytical work has influenced policy making and how this influence can be improved. It is primarily targeted at officials at key ministries (finance/planning/environment and natural resources) in low-income countries and partners in development co-operation.
Country case study findings include:
• In Lao PDR, non-timber forest products (food, fodder, building material, medicine, etc.) are estimated to comprise nearly half of rural household subsistence and cash income.
• In Mozambique, public revenues stemming from natural resources could be increased by 165% (equivalent to 15% of fiscal revenues).
• In Peru, the cost of environmental degradation was estimated to be equivalent to 3.9 % of GDP, mainly due to increased mortality, morbidity and decreased productivity.
• In Tajikistan, environmental degradation was identified as a binding constraint to economic growth. National savings were estimated to be -6.6 % of GDP largely due to soil erosion, water damage and underinvestment in fixed capital.
• In Uganda, the economic value of fisheries, forestry, wetlands, tourism and wildlife were estimated to be equivalent to 19% of GDP, substantially higher than what is recorded in official statistics.
There are indications that the analytical work has contributed to learning and to more informed decisions and, in some cases, has influenced budget priorities. However, an evaluation of the impact of the country case studies is beyond the scope of this report as this would require extensive consultations over a longer period of time.
Typically, the country case studies used relatively basic calculations/data (such as the market value of fisheries, the value of timber sold or non-timber forest products used, etc.). Their estimations often relied on existing analytical work. Several studies form part of a broader analytical effort that also includes elements such as institutional assessment, assessment of distributional aspects and recommendations to policy makers.
ENV/WKP(2008)4
9
There are many components that influence policy making in low income countries (e.g. political stability and support, vested interests, institutional constraints, international partners etc). Economic analysis is but one of them; therefore economic rationale alone is not enough to bring about policy reform and its implementation.
Economic analysis is more likely to influence policy if it is credible, contributes to learning and interaction between respected researchers and policy makers, addresses problems high on the agenda and provides solutions that are politically acceptable. Steps have been taken to enhance the policy influence of the country studies. These include involving policy makers in the process and focusing on environmental and natural resources issues in function of their impact on, and links with, prioritised objectives like economic growth, poverty reduction, fiscal balance and public health. Moreover, the studies were designed to fuel important policy windows such as national planning documents.
Recommendations for governments wishing to undertake an economic analysis of the environment and natural resources include: i) place overall responsibility with the ministry of finance or planning; ii) relate to central policy makers’ priorities and language; iii) ensure a process that stimulates learning and interaction between policy makers and researchers; iv) draw on existing data and/or liaise with teams planning research; v) ensure that the analysis is evidence-based; vi) make findings broadly accessible. Last but not least, the importance of a credible researcher/spokesperson with strong communication skills should not be underestimated.
OECD members can support more evidence-based decision making in the following ways:
• Provide financial or technical support for analyses and consultations which feed into policy windows such as Poverty Reduction Strategy Paper (PRSP) review processes, long-term vision documents, the preparation of Medium-Term Expenditure Frameworks (MTEF), annual budget preparations and sector reforms.
• Support environmental monitoring, academic research, national statistics offices and NGOs’ analytical capacity.
• Strengthen local and regional knowledge networks and links between researchers and policy makers.
• Create a demand for analytical work and capacity development in relation to provision of general budget support (GBS), joint assistance strategies (JAS) and development partners’ own Country Assistance Strategies (CAS).
• Support capacity development for environmental economics, strategic environmental assessments (SEA), etc. within key ministries such as finance and planning and environment.
ENV/WKP(2008)4
10
1. INTRODUCTION
1.1 Why make the economic case for improved management of environment and natural resources in national planning?
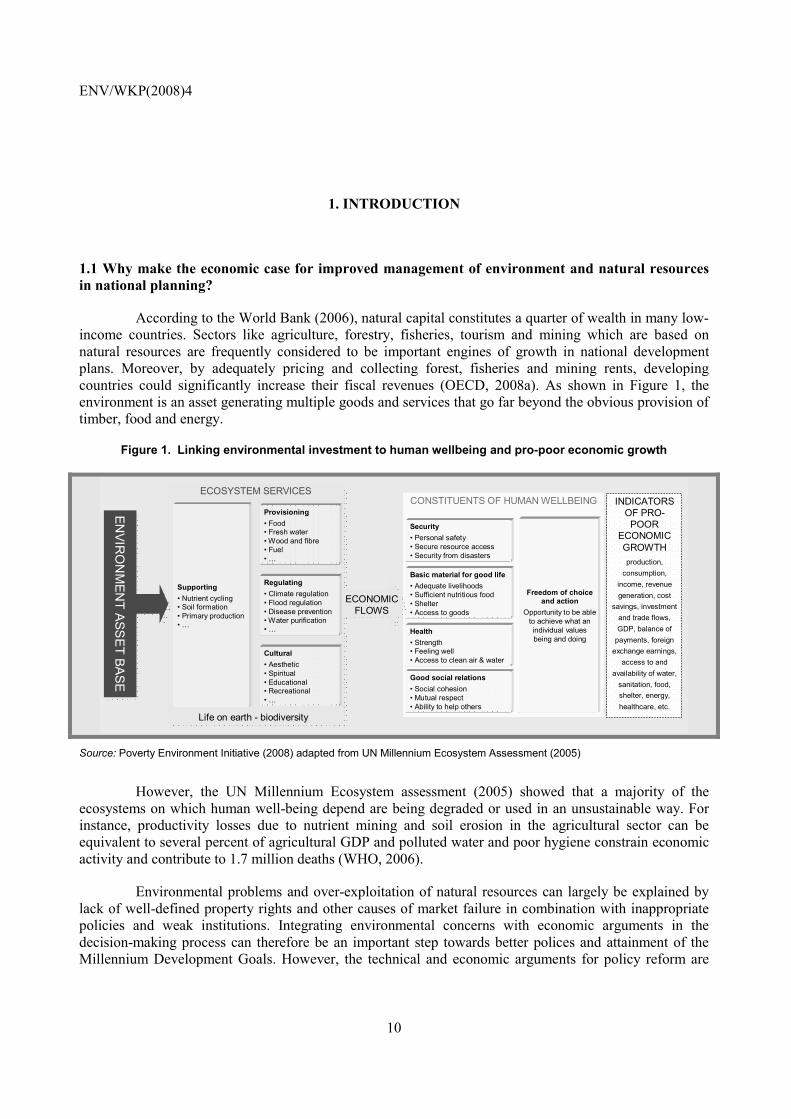
According to the World Bank (2006), natural capital constitutes a quarter of wealth in many low-income countries. Sectors like agriculture, forestry, fisheries, tourism and mining which are based on natural resources are frequently considered to be important engines of growth in national development plans. Moreover, by adequately pricing and collecting forest, fisheries and mining rents, developing countries could significantly increase their fiscal revenues (OECD, 2008a). As shown in Figure 1, the environment is an asset generating multiple goods and services that go far beyond the obvious provision of timber, food and energy.
Figure 1. Linking environmental investment to human wellbeing and pro-poor economic growth
INDICATORS OF PRO-
POOR ECONOMIC GROWTHproduction,
consumption, income, revenue generation, cost
savings, investment and trade flows, GDP, balance of
payments, foreign exchange earnings,
access to and availability of water,
sanitation, food, shelter, energy, healthcare, etc.
CONSTITUENTS OF HUMAN WELLBEING
Security• Personal safety• Secure resource access• Security from disasters
Basic material for good life• Adequate livelihoods• Sufficient nutritious food• Shelter• Access to goods
Health• Strength• Feeling well• Access to clean air & water
Good social relations• Social cohesion• Mutual respect• Ability to help others
Freedom of choice and action
Opportunity to be able to achieve what an individual values being and doing
ECOSYSTEM SERVICESECOSYSTEM SERVICES
Supporting• Nutrient cycling• Soil formation• Primary production• …
Provisioning• Food• Fresh water• Wood and fibre• Fuel• …
Regulating• Climate regulation• Flood regulation• Disease prevention• Water purification• …
Cultural• Aesthetic• Spiritual• Educational• Recreational• …
Life on earth - biodiversity
ENVIR
ON
MEN
T ASSET BASE
ENVIR
ON
MEN
T ASSET BASE
ECONOMICFLOWS
Source: Poverty Environment Initiative (2008) adapted from UN Millennium Ecosystem Assessment (2005)
However, the UN Millennium Ecosystem assessment (2005) showed that a majority of the ecosystems on which human well-being depend are being degraded or used in an unsustainable way. For instance, productivity losses due to nutrient mining and soil erosion in the agricultural sector can be equivalent to several percent of agricultural GDP and polluted water and poor hygiene constrain economic activity and contribute to 1.7 million deaths (WHO, 2006).
Environmental problems and over-exploitation of natural resources can largely be explained by lack of well-defined property rights and other causes of market failure in combination with inappropriate policies and weak institutions. Integrating environmental concerns with economic arguments in the decision-making process can therefore be an important step towards better polices and attainment of the Millennium Development Goals. However, the technical and economic arguments for policy reform are
ENV/WKP(2008)4
11
not enough; institutional constraints, vested interests and considerations of political stability and support are other important components that influence policy outcomes.
There appears to be growing interest in using economic analysis for better environmental management (Morgenstern, 2008; OECD, 2008b; Sukhudev et al, 2008) and there are already indicators of success in terms of increased budgets for environmental investments and institutional strengthening (Poverty Environment Initiative, 2008). The Stern Review is a well-known example of an economic analysis which influenced the debate on climate change (Box 1).
The purpose of this report is to analyse different approaches for making the economic case for improved management of environment and natural resources in the context of national planning processes (PRSs or national development plans). The underlying assumption throughout is that economic analysis of the environment contributes to a better understanding of the links between environment, poverty reduction and economic growth and, hence, to more informed decisions.
This report’s key target groups include officials at strategic ministries in developing countries and partners in development co-operation. The rationale for seeking to inform the PRSP process in particular is that this constitutes a starting block for development co-operation and that the revision process constitutes an important policy window.
This report describes the environmental economic analytical work that has been used to inform national development processes and strategies for policy impact. It complements previous OECD work such as Natural Resources and Pro-Poor Growth: The Economics and Politics of Natural Resources Use in Developing Countries (OECD, 2008a), Costs of Inaction on Environmental Policy Challenges (OECD, 2008b) and Handbook of Biodiversity Valuation: A Guide for Policy Makers (OECD, 2002). Moreover, this report has benefited from the co-operation with, and input from, the UNDP-UNEP Poverty-Environment Initiative programme and its complementary report “Making the economic case – a primer for mainstreaming environment in national development planning” 1.
In short, there are four main reasons for making the economic case. First, sustainable use of natural resources is critical to sustainable growth in most low-income countries. Second, there are clear indications of environmental degradation with direct impacts on health and productivity. Third, policy makers lack sufficient economic information on the links between the environment, economic growth and poverty reduction. Fourth, integration of the environment in key policy processes (macroeconomic policies and sector policies) and budgets remains low, despite advances in environmental legislation.
This report analyses five country case studies – Lao PDR, Mozambique, Peru, Tajikistan and Uganda- where economic assessments of the environment have been prepared to feed into national planning processes. Commonalities and differences are discussed. We look at the kind of economic arguments used (impacts on productivity, revenue generation etc.), the context in which the analyses were made and how practitioners have dealt with scarce data. Greening development planning draws on literature on public policy and discusses how policy impact of analytical work can be increased. It also provides recommendations for governments in low-income countries and OECD members. Lastly, the report includes suggestions for further reading, in the hope that this material will trigger greater use of economic assessments for the environment and natural resources in policy processes (World Bank, 2008a).
1 The report by the Poverty Environment Initiative (PEI) is targeted at PEI country staff and provides a
framework and practical guidance for generating economic arguments for increasing environmental investments and integration in development planning. The document can be accessed at www.unpei.org.
ENV/WKP(2008)4
12
Box 1. The Stern Review: Some lessons about an influential economic case
In 2006 the UK Treasury released the Stern Review: The Economics of Climate Change. In simple terms, one could say that the report made the economic case for strong action against global warming –“…it pays to act now”. The Stern Review has been credited with shifting the debate about climate change from an environmental focus to economic impacts (the Guardian, 2008).
What explains the impact of the Stern Review? Is it because the report had the backing of the Treasury and the prime minister? And what about timing? Awareness among the British public of the importance to take action had grown over a long period. Many had experienced abnormal weather conditions and were affected by flooding in Yorkshire and the Midlands. Furthermore, the IPCC fourth assessment report was to be released shortly afterwards and much of the contents had already leaked to the press. Last but not least, how important was it that the author was a leading, well reputed economist who also provided a price tag on the benefits of action?
We are not aware of any published academic work which explains the reasons behind the impact of the Stern Review, but we assume that the aspects listed above were important factors. This also suggests at least two things: first, that making the economic case involves much more than applying economic methods and valuation techniques, and second, that under the right circumstances, analytical work of this kind can have significant policy influence even if some of the scientific underpinnings are debated.
1.2 About the report
This section presents the process used for selecting the case studies analyzed in this report and how the issue of policy impact was dealt with.
Selection of country cases
The project team followed two paths in order to generate a list of potential country case studies that could be described in the report. First, the team scrutinised recent PRSPs for references to analytical work of this kind. Second, it approached groups of experts in the field. Examples of such groups include members of the OECD Joint Development-Environment Task Team on Governance and Capacity Development for Natural Resources and Environmental Management, the Poverty Environment Partnership, the World Conservation Union (IUCN), The International Development Research Centre, the Ring Alliance and Environment for Development centres.
Poverty reduction strategy papers
As of October 2007, the six most recent PRSPs published on the World Bank’s website were: Congo, Gambia, Senegal, Viet Nam, Zambia and Mozambique. For general information on national planning documents, see Box 2. These PRSPs generated surprisingly few indications of economic analysis of the environment and natural resources and their impact on growth, health, fiscal revenues, etc. Therefore, the project team decided to look at the PRSPs that had received a high score for environmental integration in World Bank reviews (Bojö et al, 2004). The top five countries were Bangladesh, Ghana, Burkina Faso, Cambodia and Nicaragua. The findings of this desk review of these two groups of PRSPs suggest that environmental economic assessments rarely form part of the typical PRSP review process. Only in one case (Mozambique) were there clear references to quantified economic arguments for improved environmental management.2 It should be noted that such assessments might have been undertaken and used for the preparation of PRSPs but they were either not referenced or they were not easily identifiable.
2 Annex C includes a list of reviewed PRSPs and tentative country cases judged to be of interest.
ENV/WKP(2008)4
13
Box 2. National Development Plans and Poverty Reduction Strategies: Important but insufficient entry point for environmental integration?
National priorities are, in general, expressed in 3-5 year plans referred to as National Development Plans or Poverty Reduction Strategies. A Poverty Reduction Strategy Paper describes a country's macroeconomic, structural, and social policies and programs to promote growth. It summarizes the country's objectives, policies, and measures for poverty reduction. A Poverty Reduction Strategy Paper should be country-driven, comprehensive in scope, partnership-oriented, and participatory. These planning documents ideally guide the medium term expenditure framework and annual budgeting (World Bank, 2008b).The preparatory process for a PRSP/NDP with sector reviews, public participation and dialogues provide an important window of opportunity to influence policies (Wangwe, 2005). Although important, recent studies suggest that environmental integration in PRSPs is not sufficient to ensure that the issues are given priority and sufficient budget allocation (Bird and Petkova, 2008; Lawson and Bird, 2008). Proposed improvements include increased attention on annual budgeting, institutional strengthening, cross sectoral integration of environmental considerations and improved capacity of environmental institutions to use economic assessments in budget negotiations.
In the interest of comparability the authors chose to expand the list of potential country case studies. They identified examples that were of different geographical origin and that were complementary in character and fed them into the review process.3
Describing the studies
This report describes how the respective country case studies emerged, how the analysis was conducted and the steps taken to enhance the impact of the studies. This desk review included carefully reading certain documents and telephone contacts with the technical experts that undertook each study. In order not to burden the administrative capacity of the countries involved, it was decided not to contact government staff. Arguably, this would have added insight and provided more of a user perspective in terms of which strategies worked or which did not, as well as lessons learned.
Dealing with policy impact
Under the right circumstances analytical studies can influence policy making. They can raise public attention to pressing problems and improve awareness of alternative solutions. In some instances they may have a more direct impact on decision making. It is also possible to alter the perception and language of policy makers which, over time, affects decision making (Box 3). It is beyond the scope of this study to assess the impact of the country studies on policy making. In most cases it would be impossible to attribute a change in policy to an identified document. Long time frames and extensive consultations with the many actors involved in the process of policy development would be necessary. Instead we draw on the rich literature on public policy in general, and research and policy making in particular.
3 Consequently only one example of the Cost of Environmental Degradation studies involving the World
Bank is featured in the report, despite the fact that similar studies have been undertaken in a range of countries including Colombia, Egypt, Ethiopia, Ghana, Lebanon and Tunisia.
ENV/WKP(2008)4
14
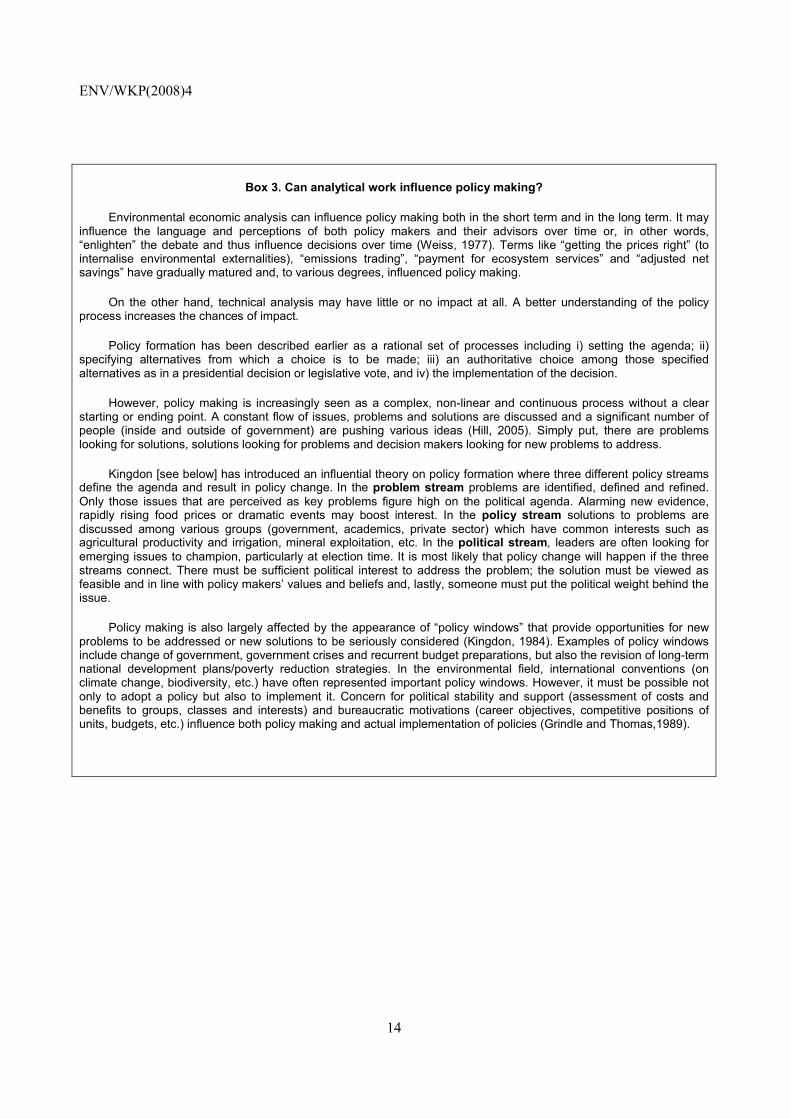
Box 3. Can analytical work influence policy making?
Environmental economic analysis can influence policy making both in the short term and in the long term. It may influence the language and perceptions of both policy makers and their advisors over time or, in other words, “enlighten” the debate and thus influence decisions over time (Weiss, 1977). Terms like “getting the prices right” (to internalise environmental externalities), “emissions trading”, “payment for ecosystem services” and “adjusted net savings” have gradually matured and, to various degrees, influenced policy making.
On the other hand, technical analysis may have little or no impact at all. A better understanding of the policy process increases the chances of impact.
Policy formation has been described earlier as a rational set of processes including i) setting the agenda; ii) specifying alternatives from which a choice is to be made; iii) an authoritative choice among those specified alternatives as in a presidential decision or legislative vote, and iv) the implementation of the decision.
However, policy making is increasingly seen as a complex, non-linear and continuous process without a clear starting or ending point. A constant flow of issues, problems and solutions are discussed and a significant number of people (inside and outside of government) are pushing various ideas (Hill, 2005). Simply put, there are problems looking for solutions, solutions looking for problems and decision makers looking for new problems to address.
Kingdon [see below] has introduced an influential theory on policy formation where three different policy streams define the agenda and result in policy change. In the problem stream problems are identified, defined and refined. Only those issues that are perceived as key problems figure high on the political agenda. Alarming new evidence, rapidly rising food prices or dramatic events may boost interest. In the policy stream solutions to problems are discussed among various groups (government, academics, private sector) which have common interests such as agricultural productivity and irrigation, mineral exploitation, etc. In the political stream, leaders are often looking for emerging issues to champion, particularly at election time. It is most likely that policy change will happen if the three streams connect. There must be sufficient political interest to address the problem; the solution must be viewed as feasible and in line with policy makers’ values and beliefs and, lastly, someone must put the political weight behind the issue.
Policy making is also largely affected by the appearance of “policy windows” that provide opportunities for new problems to be addressed or new solutions to be seriously considered (Kingdon, 1984). Examples of policy windows include change of government, government crises and recurrent budget preparations, but also the revision of long-term national development plans/poverty reduction strategies. In the environmental field, international conventions (on climate change, biodiversity, etc.) have often represented important policy windows. However, it must be possible not only to adopt a policy but also to implement it. Concern for political stability and support (assessment of costs and benefits to groups, classes and interests) and bureaucratic motivations (career objectives, competitive positions of units, budgets, etc.) influence both policy making and actual implementation of policies (Grindle and Thomas,1989).
ENV/WKP(2008)4
15
2. THE COUNTRY REPORTS
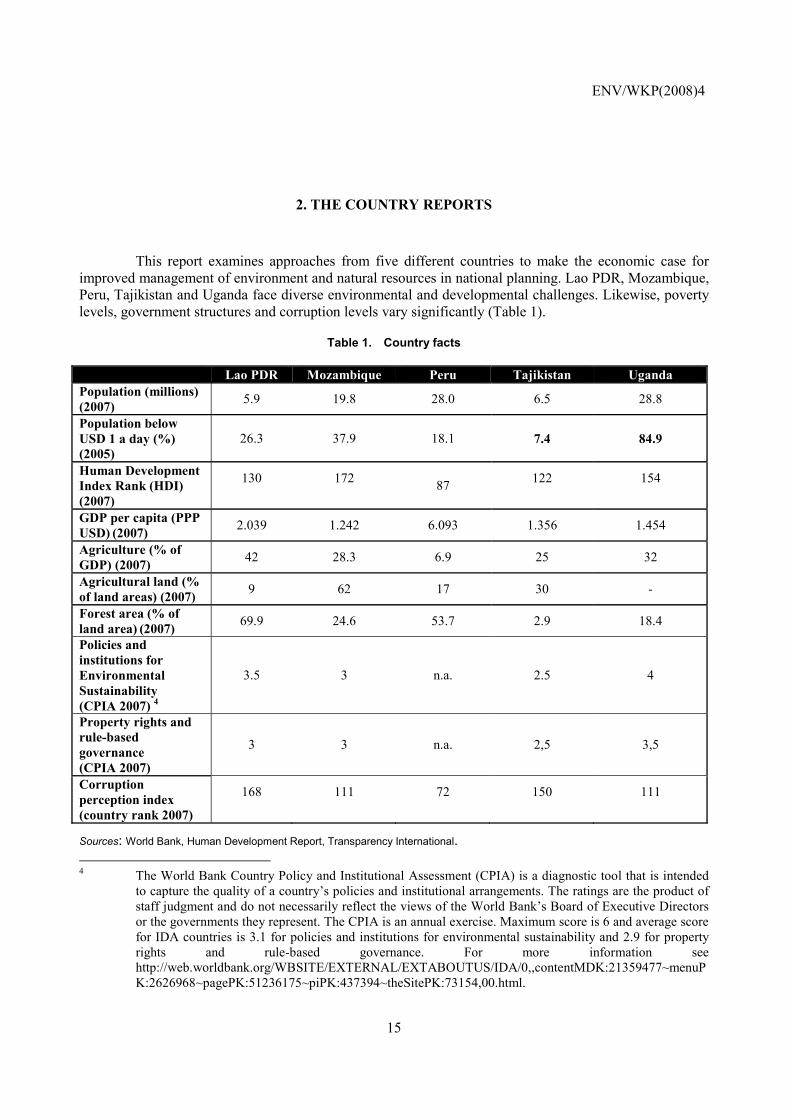
This report examines approaches from five different countries to make the economic case for improved management of environment and natural resources in national planning. Lao PDR, Mozambique, Peru, Tajikistan and Uganda face diverse environmental and developmental challenges. Likewise, poverty levels, government structures and corruption levels vary significantly (Table 1).
Table 1. Country facts
Lao PDR Mozambique Peru Tajikistan Uganda Population (millions) (2007) 5.9 19.8 28.0 6.5 28.8
Population below USD 1 a day (%) (2005)
26.3 37.9 18.1 7.4 84.9
Human Development Index Rank (HDI) (2007)
130
172 87 122
154
GDP per capita (PPP USD) (2007) 2.039 1.242 6.093 1.356 1.454
Agriculture (% of GDP) (2007) 42 28.3 6.9 25 32
Agricultural land (% of land areas) (2007) 9 62 17 30 -
Forest area (% of land area) (2007) 69.9 24.6 53.7 2.9 18.4
Policies and institutions for Environmental Sustainability (CPIA 2007) 4
3.5 3 n.a. 2.5 4
Property rights and rule-based governance (CPIA 2007)
3 3 n.a. 2,5 3,5
Corruption perception index (country rank 2007)
168
111
72
150
111
Sources: World Bank, Human Development Report, Transparency International. 4 The World Bank Country Policy and Institutional Assessment (CPIA) is a diagnostic tool that is intended
to capture the quality of a country’s policies and institutional arrangements. The ratings are the product of staff judgment and do not necessarily reflect the views of the World Bank’s Board of Executive Directors or the governments they represent. The CPIA is an annual exercise. Maximum score is 6 and average score for IDA countries is 3.1 for policies and institutions for environmental sustainability and 2.9 for property rights and rule-based governance. For more information see http://web.worldbank.org/WBSITE/EXTERNAL/EXTABOUTUS/IDA/0,,contentMDK:21359477~menuPK:2626968~pagePK:51236175~piPK:437394~theSitePK:73154,00.html.
ENV/WKP(2008)4
16
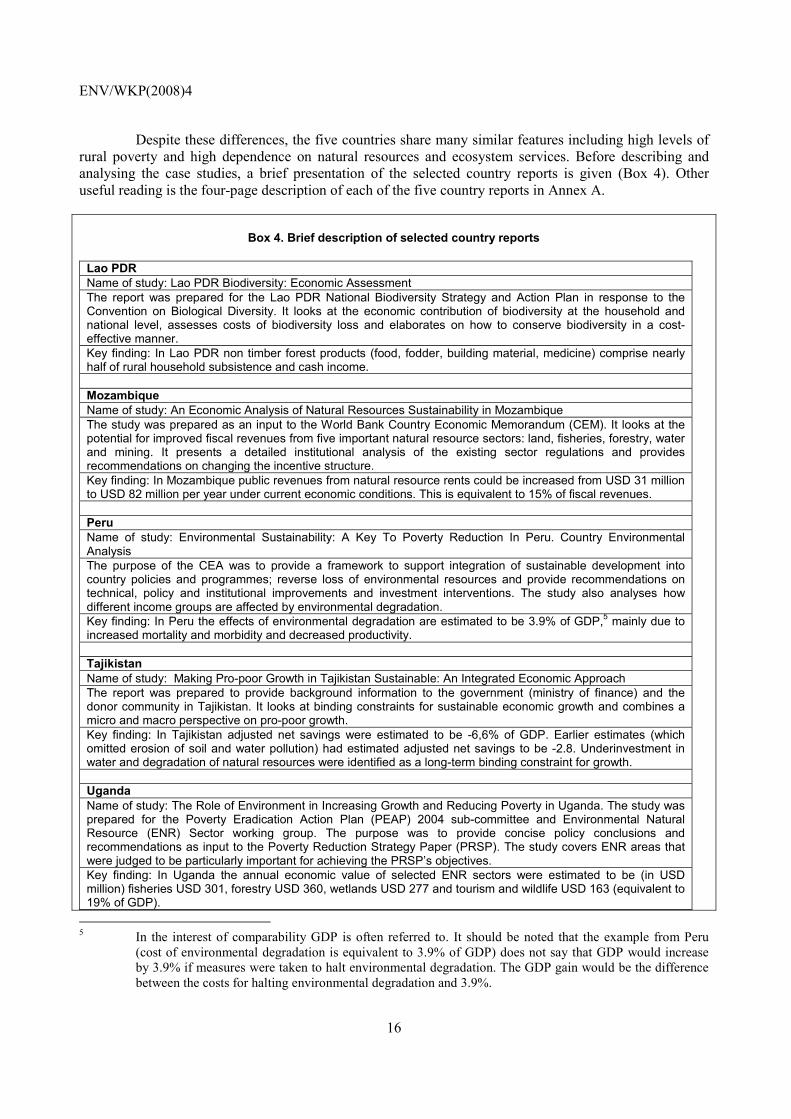
Despite these differences, the five countries share many similar features including high levels of rural poverty and high dependence on natural resources and ecosystem services. Before describing and analysing the case studies, a brief presentation of the selected country reports is given (Box 4). Other useful reading is the four-page description of each of the five country reports in Annex A.
Box 4. Brief description of selected country reports
Lao PDR Name of study: Lao PDR Biodiversity: Economic Assessment The report was prepared for the Lao PDR National Biodiversity Strategy and Action Plan in response to the Convention on Biological Diversity. It looks at the economic contribution of biodiversity at the household and national level, assesses costs of biodiversity loss and elaborates on how to conserve biodiversity in a cost-effective manner. Key finding: In Lao PDR non timber forest products (food, fodder, building material, medicine) comprise nearly half of rural household subsistence and cash income. Mozambique Name of study: An Economic Analysis of Natural Resources Sustainability in Mozambique The study was prepared as an input to the World Bank Country Economic Memorandum (CEM). It looks at the potential for improved fiscal revenues from five important natural resource sectors: land, fisheries, forestry, water and mining. It presents a detailed institutional analysis of the existing sector regulations and provides recommendations on changing the incentive structure. Key finding: In Mozambique public revenues from natural resource rents could be increased from USD 31 million to USD 82 million per year under current economic conditions. This is equivalent to 15% of fiscal revenues. Peru Name of study: Environmental Sustainability: A Key To Poverty Reduction In Peru. Country Environmental Analysis The purpose of the CEA was to provide a framework to support integration of sustainable development into country policies and programmes; reverse loss of environmental resources and provide recommendations on technical, policy and institutional improvements and investment interventions. The study also analyses how different income groups are affected by environmental degradation. Key finding: In Peru the effects of environmental degradation are estimated to be 3.9% of GDP,5 mainly due to increased mortality and morbidity and decreased productivity. Tajikistan Name of study: Making Pro-poor Growth in Tajikistan Sustainable: An Integrated Economic Approach The report was prepared to provide background information to the government (ministry of finance) and the donor community in Tajikistan. It looks at binding constraints for sustainable economic growth and combines a micro and macro perspective on pro-poor growth. Key finding: In Tajikistan adjusted net savings were estimated to be -6,6% of GDP. Earlier estimates (which omitted erosion of soil and water pollution) had estimated adjusted net savings to be -2.8. Underinvestment in water and degradation of natural resources were identified as a long-term binding constraint for growth. Uganda Name of study: The Role of Environment in Increasing Growth and Reducing Poverty in Uganda. The study was prepared for the Poverty Eradication Action Plan (PEAP) 2004 sub-committee and Environmental Natural Resource (ENR) Sector working group. The purpose was to provide concise policy conclusions and recommendations as input to the Poverty Reduction Strategy Paper (PRSP). The study covers ENR areas that were judged to be particularly important for achieving the PRSP’s objectives. Key finding: In Uganda the annual economic value of selected ENR sectors were estimated to be (in USD million) fisheries USD 301, forestry USD 360, wetlands USD 277 and tourism and wildlife USD 163 (equivalent to 19% of GDP).
5 In the interest of comparability GDP is often referred to. It should be noted that the example from Peru
(cost of environmental degradation is equivalent to 3.9% of GDP) does not say that GDP would increase by 3.9% if measures were taken to halt environmental degradation. The GDP gain would be the difference between the costs for halting environmental degradation and 3.9%.
ENV/WKP(2008)4
17
2.1. Getting the numbers
Economy-environment linkages
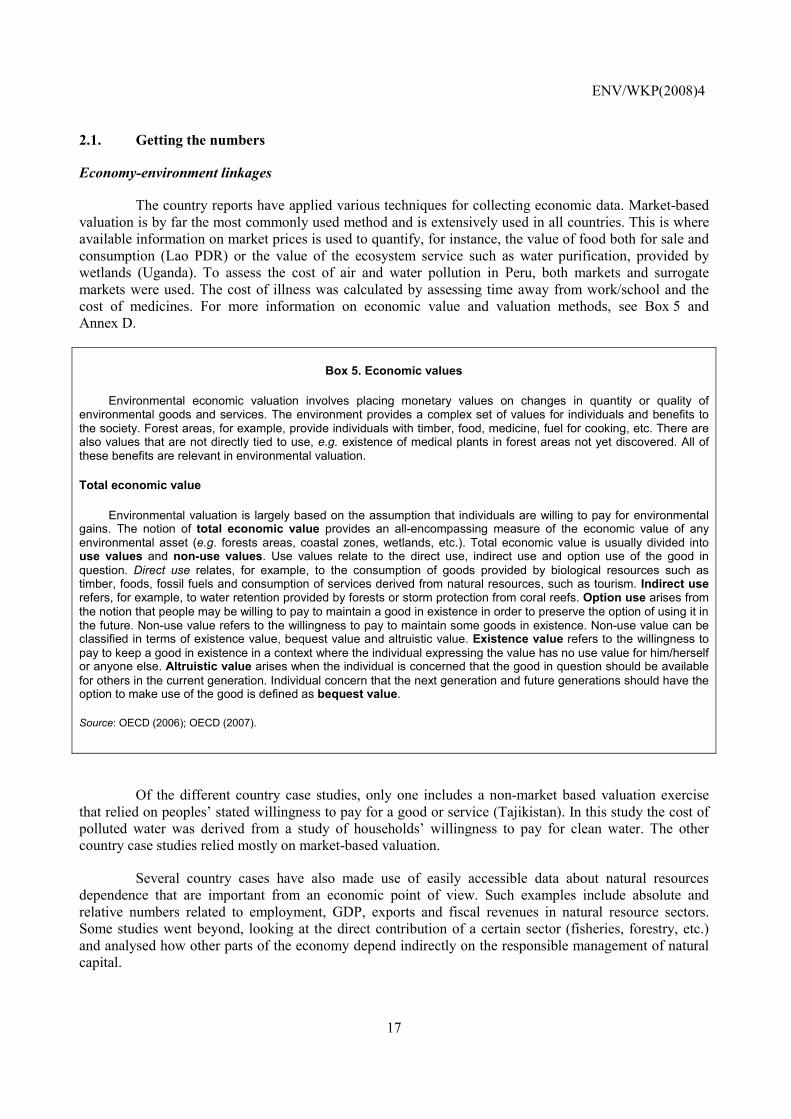
The country reports have applied various techniques for collecting economic data. Market-based valuation is by far the most commonly used method and is extensively used in all countries. This is where available information on market prices is used to quantify, for instance, the value of food both for sale and consumption (Lao PDR) or the value of the ecosystem service such as water purification, provided by wetlands (Uganda). To assess the cost of air and water pollution in Peru, both markets and surrogate markets were used. The cost of illness was calculated by assessing time away from work/school and the cost of medicines. For more information on economic value and valuation methods, see Box 5 and Annex D.
Box 5. Economic values
Environmental economic valuation involves placing monetary values on changes in quantity or quality of environmental goods and services. The environment provides a complex set of values for individuals and benefits to the society. Forest areas, for example, provide individuals with timber, food, medicine, fuel for cooking, etc. There are also values that are not directly tied to use, e.g. existence of medical plants in forest areas not yet discovered. All of these benefits are relevant in environmental valuation.
Total economic value
Environmental valuation is largely based on the assumption that individuals are willing to pay for environmental gains. The notion of total economic value provides an all-encompassing measure of the economic value of any environmental asset (e.g. forests areas, coastal zones, wetlands, etc.). Total economic value is usually divided into use values and non-use values. Use values relate to the direct use, indirect use and option use of the good in question. Direct use relates, for example, to the consumption of goods provided by biological resources such as timber, foods, fossil fuels and consumption of services derived from natural resources, such as tourism. Indirect use refers, for example, to water retention provided by forests or storm protection from coral reefs. Option use arises from the notion that people may be willing to pay to maintain a good in existence in order to preserve the option of using it in the future. Non-use value refers to the willingness to pay to maintain some goods in existence. Non-use value can be classified in terms of existence value, bequest value and altruistic value. Existence value refers to the willingness to pay to keep a good in existence in a context where the individual expressing the value has no use value for him/herself or anyone else. Altruistic value arises when the individual is concerned that the good in question should be available for others in the current generation. Individual concern that the next generation and future generations should have the option to make use of the good is defined as bequest value.
Source: OECD (2006); OECD (2007).
Of the different country case studies, only one includes a non-market based valuation exercise that relied on peoples’ stated willingness to pay for a good or service (Tajikistan). In this study the cost of polluted water was derived from a study of households’ willingness to pay for clean water. The other country case studies relied mostly on market-based valuation.
Several country cases have also made use of easily accessible data about natural resources dependence that are important from an economic point of view. Such examples include absolute and relative numbers related to employment, GDP, exports and fiscal revenues in natural resource sectors. Some studies went beyond, looking at the direct contribution of a certain sector (fisheries, forestry, etc.) and analysed how other parts of the economy depend indirectly on the responsible management of natural capital.
ENV/WKP(2008)4
18
Interestingly, all five country cases use values from other relevant studies, or extrapolate results from a smaller sample (benefit transfer). Examples include the value of carbon sequestration in tropical forests (Lao PDR), costs of land degradation (Tajikistan, Uganda) and the cost of natural disasters (Peru). Some of the examples make use of data from international studies, whereas others upscale local studies. The benefit transfer approach can save money and time but should be used with care, see Annex D.
The concept of adjusted net savings,6 constructed to give a more complete picture of national savings from a sustainability perspective, was used in both Tajikistan and Uganda.
Poverty-environment linkages
Increased awareness of distributional aspects of unsustainable management of natural resources can help create pro-poor management policies. Poor people’s perceptions of wellbeing are strongly related to the environment in terms of their livelihoods, health, vulnerability, and empowerment to control their own lives (DFID et al, 2002). The country reports make general statements about poverty-environment linkages such as health impacts and the role of common property resources both for income and as a safety net. The Peru report also includes quantitative analysis and compares, for example, the economic impacts of polluted water on poor and non-poor households. Similarly, the Lao PDR study compares richer and poorer households’ dependence on non timber forest products for both cash income and subsistence.
2.2 Dealing with poor data
Environmental monitoring, by generating reliable information on the state of the environment including air and water quality, can greatly improve analysis and understanding of trends and their impacts on ecosystems and society. Poor data quality and availability are two pressing problems faced by low-income countries in their policy-making processes. Peru is the only country where data availability was considered moderate rather than low.7 The country reports applied different strategies to generate input to the analysis when data was scarce; i) import data from similar settings (benefit transfer), ii) expert judgement, iii) describe the problem without quantifying it, and iv) commission new studies. Overall, the economic figures in the country reports are presented as “rough estimates” or “orders of magnitude”; they do not profess to be exact.
The Mozambique study included a striking example of the difficulty of getting access to data. Despite the fact that the study was requested by the ministry of finance, it was not possible to obtain all the necessary data on government revenues from fisheries, collected by the same ministry. This could also be an illustration of the political sensitivity of natural resources rents, their pricing and their collection. Instead, expert opinion was used to estimate collected rents. In Uganda the findings from a study covering five districts was extrapolated to the whole country when calculating the costs of soil erosion. Data availability and quality concerning deforestation in Tajikistan was so low that estimations of the costs were not possible. Instead the little data available was presented and discussed, making it possible to conclude that the cost is non-negligible even though no figures could be estimated.
6 Adjusted net savings (ANS) is an example of green accounting, where ANS adjusts a country’s official
savings (gross domestic savings) with respect to costs of depreciation of physical capital (buildings and infrastructure), investments in education, costs of natural resource depletion for a large set of minerals, oil, natural gas and forest timber, the global cost of a country’s CO2 emissions and cost of urban air pollution. ANS provides an indicator of the country’s development from a sustainability perspective (World Bank, 2007).
7 This was partly due to the fact that the report benefited from previous World Bank studies undertaken in Peru.
ENV/WKP(2008)4
19
2.3 Time and budget for country reports
For an economic assessment of this kind resources in terms of time and money must be considered and cost-efficient working methods should be adopted. Cost efficiency, however, depends on the objectives of the study. Is the objective to have a good technical report or a well anchored report? Is it to raise awareness in general or to inform a specific policy process? Is there plenty of data and previous analysis to draw from or not? Is the economic assessment an integrated part of a bigger analysis or an isolated study? The estimated cost of the study must be seen in relation to its expected benefit.
Consultants’ costs are easy to calculate but on the whole they only account for part of the budget. Consultations with staff from key ministries are both time consuming and costly but might be of the utmost importance to improve the quality of work and to enhance the learning and policy impact of the study. An evaluation should include costs related to government staff, consultancy/technical expertise8 and workshops and dissemination. It has not been possible to estimate the full cost of the five country studies.
8 Technical expertise include staff from international partners such as the World Bank, Sida and the World
Conservation Union.
ENV/WKP(2008)4
20
3. ANALYSIS OF THE COUNTRY REPORTS
The production of each of the five country reports entailed a series of steps that include drafting the terms of reference, screening for data, conducting the analysis, anchoring recommendations and communicating findings. The design of these steps can improve or reduce the chances of achieving the objective of informing the policy process.
A growing body of research shows that a number of factors influence how research findings influence policy-making processes (Box 2). For example, according to the Overseas Development Institute’s RAPID programme9 , research-based evidence is more likely to influence policy making if:
• It fits within the political and institutional limits and pressures of policy makers, and resonates with their assumptions, or sufficient pressure is exerted to challenge them.
• The evidence is credible and convincing, provides practical solutions to pressing policy problems, and is packaged to attract policy makers’ interest; researchers and policy makers share common networks, trust each other and communicate effectively.
The country reports have been analysed with the above-mentioned factors in mind and from the point of view of ownership and participation, focus, key messages, credibility and communication. All of which are important factors for achieving policy impact.
3.1 Ensure that policy makers participate and take ownership
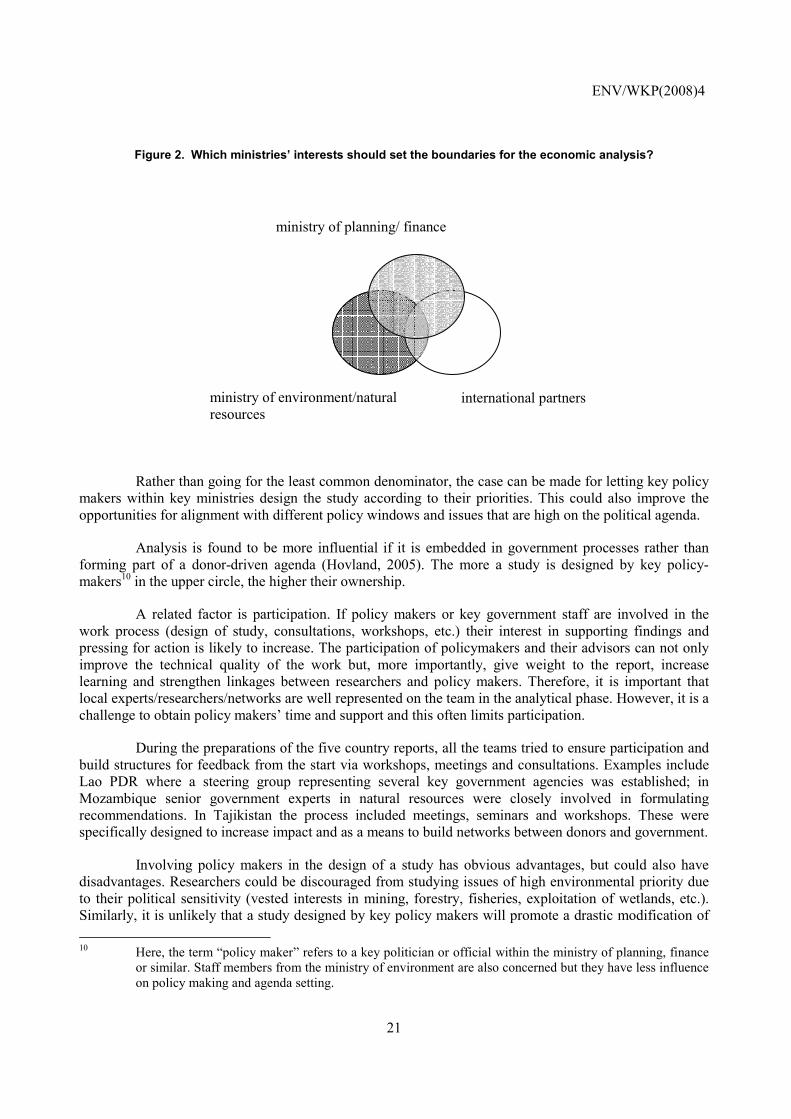
The five country reports show that ownership of the process is often shared by three different groups; ministries of finance/planning, ministry of environment and natural resources and international partners. They may have both overlapping and conflicting interests, as stylised in Figure 2. Prospects for future funding (by banks/donors) create incentives for governments to allow international partners to have a large say in the design of the study, pushing the balance towards the white area in the figure. This is likely to have been a problem in some of the case studies, given the strong role played by international partners.
9 (Court and Young, 2004), ODI's Research and Policy in Development (RAPID) programme aims to
improve the use of research and evidence in development policy and practice.
ENV/WKP(2008)4
21
Figure 2. Which ministries’ interests should set the boundaries for the economic analysis?
Rather than going for the least common denominator, the case can be made for letting key policy makers within key ministries design the study according to their priorities. This could also improve the opportunities for alignment with different policy windows and issues that are high on the political agenda.
Analysis is found to be more influential if it is embedded in government processes rather than forming part of a donor-driven agenda (Hovland, 2005). The more a study is designed by key policy-makers10 in the upper circle, the higher their ownership.
A related factor is participation. If policy makers or key government staff are involved in the work process (design of study, consultations, workshops, etc.) their interest in supporting findings and pressing for action is likely to increase. The participation of policymakers and their advisors can not only improve the technical quality of the work but, more importantly, give weight to the report, increase learning and strengthen linkages between researchers and policy makers. Therefore, it is important that local experts/researchers/networks are well represented on the team in the analytical phase. However, it is a challenge to obtain policy makers’ time and support and this often limits participation.
During the preparations of the five country reports, all the teams tried to ensure participation and build structures for feedback from the start via workshops, meetings and consultations. Examples include Lao PDR where a steering group representing several key government agencies was established; in Mozambique senior government experts in natural resources were closely involved in formulating recommendations. In Tajikistan the process included meetings, seminars and workshops. These were specifically designed to increase impact and as a means to build networks between donors and government.
Involving policy makers in the design of a study has obvious advantages, but could also have disadvantages. Researchers could be discouraged from studying issues of high environmental priority due to their political sensitivity (vested interests in mining, forestry, fisheries, exploitation of wetlands, etc.). Similarly, it is unlikely that a study designed by key policy makers will promote a drastic modification of 10 Here, the term “policy maker” refers to a key politician or official within the ministry of planning, finance
or similar. Staff members from the ministry of environment are also concerned but they have less influence on policy making and agenda setting.
ministry of planning/ finance
international partners ministry of environment/natural resources
ENV/WKP(2008)4
22
the current political discourse about environmental issues, despite support from the ministry for environment and natural resources or international partners (Waldman, 2005). Even in circumstances where data generation and findings are in line with the interests of key policy makers, civil society organisations and other interested parties may use the information for awareness raising and for stimulating the public debate. This can be facilitated by making data and final reports broadly accessible.11
3.2 Relate key messages to policy priorities
Clear, unambiguous messages are more likely to have impact on policy. It is equally important that the message be tune with positions which have been approved by the dominant policy community. It is likewise important to be aware of - and to counteract - positions that can be used to diminish the impact of a study.
The five country reports seek to provide evidence to counteract the view of environment being a luxury good of little importance for development and economic growth. In other words, the notion “first development then environment”, is rejected. On the contrary, the reports convey the message that “… sound environmental management and sustainable use of natural resources are indispensable for sustainable economic growth” (Peru) and some also affirm that “Natural resources provide the main livelihood source of the poor” (Lao PDR). The reports stimulate interest by presenting investments in environmental and natural resources management as a way of “combating poverty” (Uganda), reducing “binding constraints to growth” (Tajikistan) or “strengthening fiscal revenues” (Mozambique). The reports on Mozambique and Tajikistan appear to be most aligned with concepts and language widely used in key policy communities (economic growth and fiscal balance).
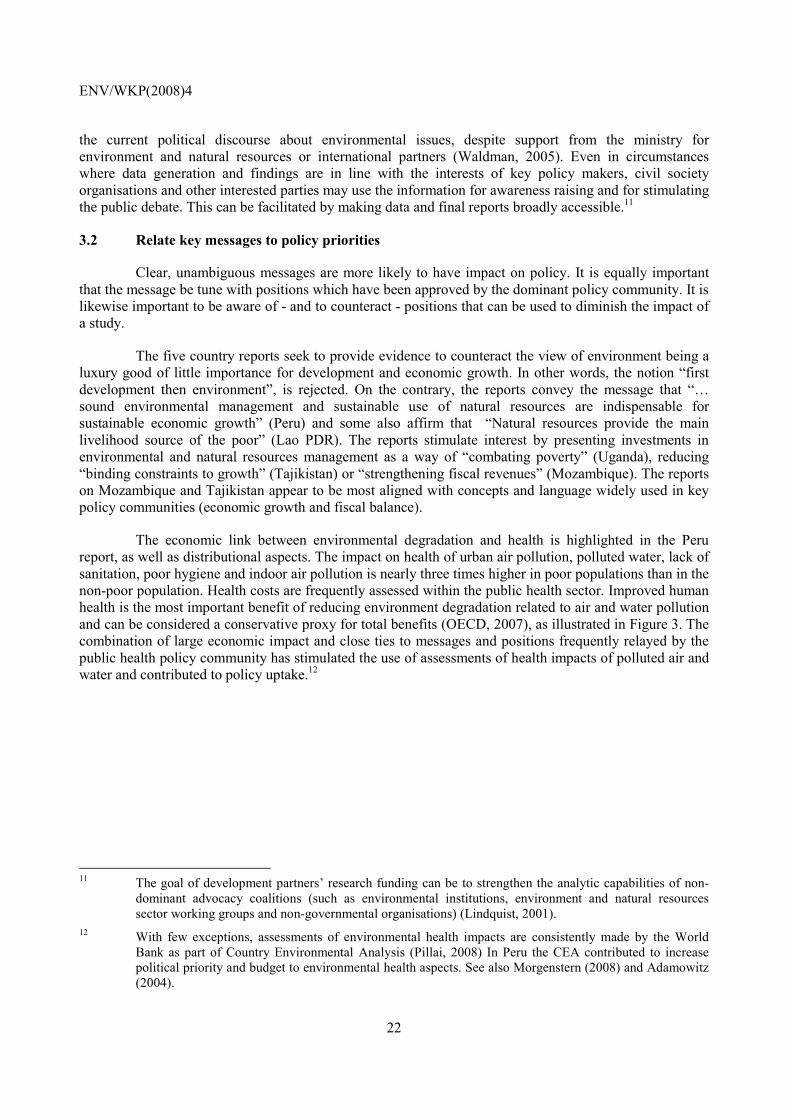
The economic link between environmental degradation and health is highlighted in the Peru report, as well as distributional aspects. The impact on health of urban air pollution, polluted water, lack of sanitation, poor hygiene and indoor air pollution is nearly three times higher in poor populations than in the non-poor population. Health costs are frequently assessed within the public health sector. Improved human health is the most important benefit of reducing environment degradation related to air and water pollution and can be considered a conservative proxy for total benefits (OECD, 2007), as illustrated in Figure 3. The combination of large economic impact and close ties to messages and positions frequently relayed by the public health policy community has stimulated the use of assessments of health impacts of polluted air and water and contributed to policy uptake.12
11 The goal of development partners’ research funding can be to strengthen the analytic capabilities of non-
dominant advocacy coalitions (such as environmental institutions, environment and natural resources sector working groups and non-governmental organisations) (Lindquist, 2001).
12 With few exceptions, assessments of environmental health impacts are consistently made by the World Bank as part of Country Environmental Analysis (Pillai, 2008) In Peru the CEA contributed to increase political priority and budget to environmental health aspects. See also Morgenstern (2008) and Adamowitz (2004).
ENV/WKP(2008)4
23
Total social costs (including use and non-use impacts on ecosystem)
Total human health costs (including pain and suffering)
Total financial health costs(including productivity loss)
Medical costs (medicine & treatment)
Figure 3. Disaggregating health costs with respect to air and water pollution
Source: OECD (2008b), Costs of Inaction on Environmental Policy Challenges.
3.3 Let needs direct the focus
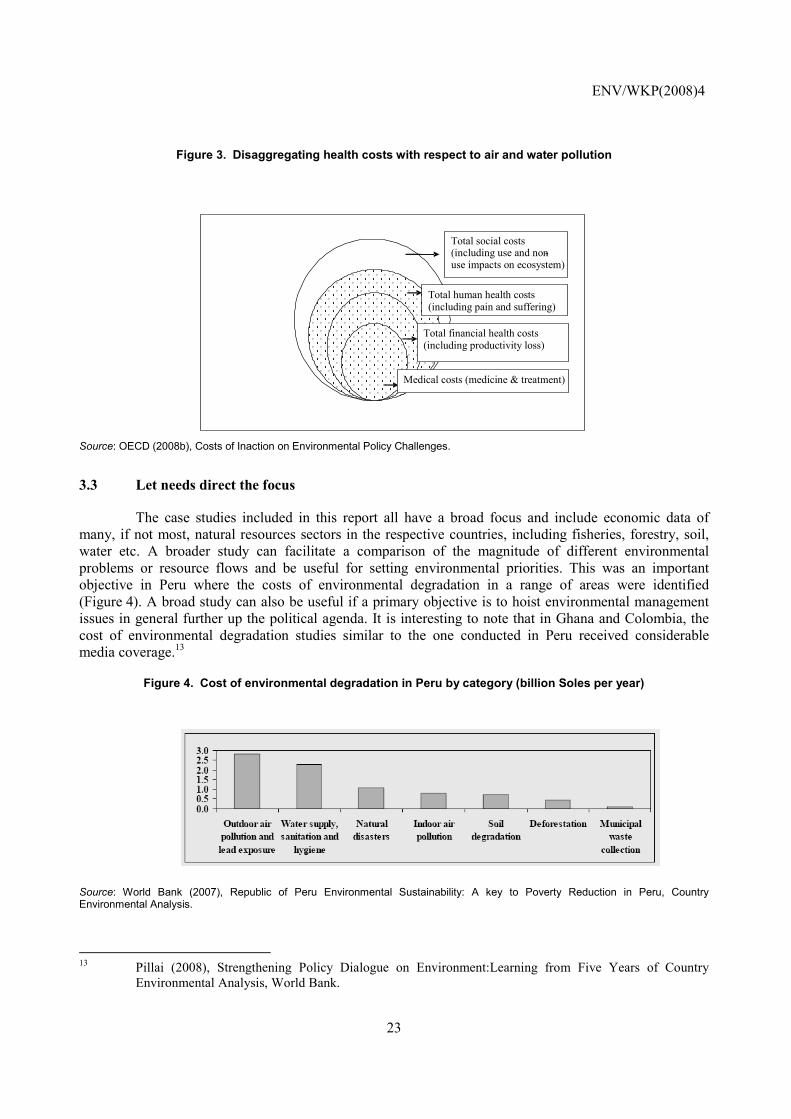
The case studies included in this report all have a broad focus and include economic data of many, if not most, natural resources sectors in the respective countries, including fisheries, forestry, soil, water etc. A broader study can facilitate a comparison of the magnitude of different environmental problems or resource flows and be useful for setting environmental priorities. This was an important objective in Peru where the costs of environmental degradation in a range of areas were identified (Figure 4). A broad study can also be useful if a primary objective is to hoist environmental management issues in general further up the political agenda. It is interesting to note that in Ghana and Colombia, the cost of environmental degradation studies similar to the one conducted in Peru received considerable media coverage.13
Figure 4. Cost of environmental degradation in Peru by category (billion Soles per year)
Source: World Bank (2007), Republic of Peru Environmental Sustainability: A key to Poverty Reduction in Peru, Country Environmental Analysis.
13 Pillai (2008), Strengthening Policy Dialogue on Environment:Learning from Five Years of Country
Environmental Analysis, World Bank.
ENV/WKP(2008)4
24
One advantage of conducting a more narrow study (focusing on a small number of sectors/resources) is that findings are likely to include fewer uncertainties and therefore be more robust. It should also be easier to provide policy-relevant recommendations and to identify “owners” of the problems. Furthermore, in a more focused study it is easier to analyse winners and losers of current and alternative policies, which can be crucial for improved management of natural resources. Such analysis should include both users of natural resources or ecosystem services and actors that are involved in their management, such as forest authorities (OECD, 2008a).
Total cost estimates (of soil erosion, water pollution, etc.) provide a notion of the magnitude of a problem. In a policy context however, it is generally more interesting to assess the costs and benefits of a specific policy change. One such example is a study on Mexico City that revealed that the benefits derived from an introduction of ultra-low sulphur fuels outweighed costs by a ratio of 10-19 (Blumberg, 2004). If the main objective is to identify solutions to a problem already acknowledged in policy circles, a more narrow study which looks at both costs and benefits of policy interventions may be the best option. In a growing number of countries there are legal provisions for using strategic environmental assessments (SEA) when developing sector strategies or spatial plans. SEA processes normally involve extensive interaction with policy makers and substantial analytical work in which cost benefit analysis or other types of economic analysis can play an important role (OECD, 2006). The link to SEA should be explored when assessing economic costs and benefits at sector level.
3.4 Strive for credibility
Findings will only influence agenda setting and policy making if they are robust and credible. A lack of credibility can be attributed to using unsuitable methods, the way findings are communicated, the quality of recommendations and the reputation of the messenger/expert.
Despite being a growing and relatively mature area in the academic world, environmental valuation techniques or the values of specific ecosystem services are issues policy makers have little experience with. Also, environmental institutions have often been reluctant to use economic valuation, for example to put a value to ecosystems or certain species (Adamowicz, 2004). This could explain why many country case studies include official statistics on natural resources related to their contribution to exports, employment, government revenue, etc. By and large they also use market-based values rather than non-market valuation methods such as a stated willingness to pay for clean water. If researchers form relationships with policy makers it can be expected that over time, the latter will become more familiar with, and open to, analyses of ecosystem services and valuation techniques.
The broad scope of the country case studies, added to the fact that there are data gaps, has led the authors to make generalisations that can make the reports susceptible to criticism. In the case of Uganda it was decided to present an upper limit value on the cost of land degradation, a spectacular figure equivalent to 11% of GDP. On the one hand such a choice can generate increased attention from policy makers (“…impacts on agricultural productivity are high”). On the other hand, the credibility of the study is jeopardized if findings are perceived as unrealistic. The Stern Review has generated a lively debate among economists.14. One lesson from the Stern review is that even though methods are contested, findings can have a policy influence and stimulate further research and debate.
14 The debate has mainly focused on the choice of discount rate where some critics argue that Stern has
overestimated the present value of the costs of climate change. Others have argued that Stern has underestimated costs of natural hazards etc.
ENV/WKP(2008)4
25
There are cases where World Bank work on assessing the cost of environmental degradation has come to halt as the methods created too much dissention and were not felt to be fruitful.15 However, this seems to be the exception rather than the rule as the World Bank continues to promote and undertake studies on the cost of environmental degradation. Evaluations suggest that they can help to set environmental priorities, stimulate public debate and raise government attention to environmental management.
On occasion, arguments in some of the country case studies which were reviewed are difficult to follow, illogical or counterintuitive. One example of the latter is when a significant distinction is made between indigenous breeds of cattle and imported breeds. The value of indigenous cattle is considered biodiversity based and imported cattle are considered to be biodiversity dependent. This could be seen as an example where definitions risk creating discussions that could undermine the overarching argument.
The country reports are not prepared for academic publication. They take a broad view, rely on simplifications and make the most of existing data. It is of utmost importance that policy makers are helped to interpret the findings, are informed about the methods used and made aware of key uncertainties related to findings. Achieving this - without diluting the overall message - can be tricky.
3.5 Increase communication and outreach
The importance of robust findings and a credible expert with good communication skills should not be underestimated. Moreover, sufficient resources for dissemination and outreach can help increase learning among the policy community and civil society and thus enhance the chances of policy influence.
In all countries the findings were presented at seminars and workshops, and some actively engaged with media, parliamentarians and NGOs to increase outreach. Parliamentarians represent a particularly important group to engage with given their influence on the public debate and public perception of the links between natural resources management, environmental degradation, growth and poverty reduction. Furthermore, parliamentarians, even in relatively weak democracies, can contribute to holding the government accountable for commitments made in the area of environment and natural resources. In Lao PDR, in addition to general seminars, focused seminars were held at specific sector ministries where the results were discussed in more technical terms. In Uganda two documents were prepared: a technical report and a summary report for policy makers.
Findings can be packaged differently to generate interest from different organisations and institutions and fit with planned activities and upcoming events. In Peru the team had discussions with all political parties during the presidential campaign and, after the elections, intensified its dialogue with the new administration at the highest political level. The preliminary results of the CEA were presented during a large conference, thereby helping to communicate findings to broader groups within academia, government and NGOs.
15 According to Pillai (2008) this has been the case in Ethiopia and Nigeria.
ENV/WKP(2008)4
26
4. CONCLUSIONS AND RECOMMENDATIONS
By and large, poor people and poor countries tend to be highly dependent on natural resources and ecosystem services for growth and poverty reduction. Yet many critical ecosystems are deteriorating and management of the environmental asset base remains inappropriate in many countries despite improved environmental policies and their inclusion in national plans. Economic environmental assessments can help inform policy making and contribute to better management of the natural capital. However, policy makers need also to consider the respective winners and losers and their political influence when new policies are elaborated. The five country reports represent different approaches for employing economic arguments for improved management of environment and natural resources in key national processes. The following section presents conclusions and recommendations based on the analysis of the five country reports and a literature review.
4.1 Conclusions
The key conclusions are the following:
• There is limited but growing recourse to environmental economic analysis: The use of economic arguments for improved environmental management in relation to national planning documents is a small but growing field. This finding also applies to sectors and other levels of interventions such as programmes, plans and projects where economic analyses (including environmental valuation) have been increasingly used during the last couple of decades.
• Decision making is improved: Analytic work has contributed to learning and better information about economic aspects of environmental degradation and natural resources management. In some cases this has influenced budget priorities.
• Several factors need to converge if a study is to have an impact: Economic analysis is more likely to influence policy if it is credible, contributes to learning and interaction between respected researchers and policy makers, addresses problems high on the agenda and provides solutions that are politically acceptable.
• Key messages should be aligned with policy makers’ priorities: Environmental degradation and poor natural resources management are largely discussed in relation to their impacts on, and links with, prioritised objectives like economic growth, poverty reduction, fiscal balance and public health. This increases the chances of influencing policy making.
• There is a pragmatic approach to approximate environmental values: One of the aims of the case studies was to identify orders of magnitude of environmental values rather than provide detailed numbers. By and large, the country case studies pragmatically use existing data, extrapolate and, if necessary, import data and make adjustments to national circumstances.
• Simple methods abound: The bulk of the country case studies are based on relatively simple calculations that use market prices for environmental valuation and direct use values such as the value of fisheries, the value of timber sold or non-timber forest products used.
• Economic assessments are not fed to policy makers in isolation: An analysis is often part of a package that includes other kinds of analyses, institutional assessments, recommendations for policy-makers and, to a varying degree, prioritisation of environmental issues.
ENV/WKP(2008)4
27
• Studies are highly dependent on data availability and accessibility: Increased environmental monitoring and stronger capacity within national bureaus of statistics, government agencies and academic community could enhance the quality of analytical work further. Availability is not sufficient; data also needs to be accessible.
• International partners are active promoters: International partners are active in the studies either as catalysers, financers, advisors and/or users of the findings. It is important that these partnerships help build national ownership and learning.
4.2 Recommendations
In line with this report’s focus on broad studies that inform national development plans, the recommendations mainly relate to similar studies. However, with some exceptions, recommendations should also be applicable to more narrow studies, for instance at sector level.16 The recommendations are grouped under three steps: planning, analysis and communication of findings.
Step 1 Planning
- Place responsibility for the study with the ministry of finance or planning (including the terms of reference).17
- Align the analytical work with key policy makers’ priorities and language. - Align the analytical work with policy windows (PRSP, sector reforms, high priority issues, etc.). - Be specific about, and continuously recall, the objectives of the economic analysis. - Choose researchers/consultants with care and on the strength of their knowledge, process skills and
reputation. - Design a process that stimulates and ensures learning and strong interaction between local
researchers/analysts, policy makers and their advisors. - Include recommendations for policy makers. - Build on international experience and networks.
Step 2 Analysis
- Assess existing data and information in relation to the identified purpose through extensive contacts with key resource institutions such as the national statistical bureau, universities and other research institutions, government agencies and NGOs.
- Don’t be discouraged by lack of data; make use of existing data (quantitative and qualitative data). If necessary, commission new targeted studies and liaise with planned research efforts if possible.
- Make sure there is agreement on the scope, focus and ownership of the analysis. - Involve policy makers and their advisors in discussions about draft findings and recommendations.
Step 3 Communication of findings
- Make data, methods and analytical findings broadly accessible - Adapt messages to different groups (parliamentarians, line ministries, civil society, networks, etc.)
16 Economic assessments on specific policy changes, sector programmes, investment programmes or similar. 17 There may be circumstances when central ministries might avoid including controversial natural resource
issues in a study. If this is a major concern, civil society organisations and/or academia could consider undertaking a complementary analysis.
ENV/WKP(2008)4
28
- Be prepared to adjust the analysis, findings and recommendations to new policy windows and policy processes. Often, the same study can have multiple uses and inform several policy processes, simultaneously or sequentially, often subject to only minor amendments or updates.
- Do not underestimate the importance of what in rhetoric is called "ethos", i.e. the credibility of the messenger who is communicating the findings.
OECD members can play a key role in supporting more evidence-based decision-making processes where impacts on environment and natural resources are integrated in the analysis. More specifically, donors and international agencies can promote informed national development planning in six ways:
i) Provide financial or technical support for analyses and consultations at given policy windows such as PRSP review processes, long-term vision documents, medium term expenditure framework preparations, annual budget preparations and sector reforms.
ii) Provide support for environmental monitoring and academic research, national statistics offices and NGOs’ analytical capacity.
iii) Strengthen local and regional knowledge networks and linkages between researchers and policy makers.
iv) Create a demand for analytical work and capacity development in relation to the provision of general budget support, joint assistance strategies and development partners’ own country assistance strategies.
v) Support capacity development for environmental economics, strategic environmental assessments (SEA), etc. within key ministries such as finance and planning and environment.
ENV/WKP(2008)4
29
5. LOOKING AHEAD
Historically, addressing problems caused by emissions and ecosystem degradation has not been high on policy makers’ agendas in most low-income countries. Today, attitudes are changing. The economic impacts of climate change and skyrocketing commodity prices for rice, corn, oil, etc. raise concerns about how the earth’s natural resources are managed and highlight the links between environment, poverty and economic growth. Both improved awareness of these links, coupled with the implementation of sound policies are needed in order to achieve the MDG.
It is likely that the increased attention on climate change, food production and ecosystem services will result in a higher demand for economic analysis, including environmental valuation studies. Future work in this area will also benefit from recent initiatives such as The Economics of Ecosystems and Biodiversity. This initiative is led by UNEP, EU and Germany and will inter alia. provide guidance on how to assess the value of various ecosystems and include a user-friendly toolkit for policy makers.
Furthermore, it can be expected that the primary use of economic analysis of environmental impacts will be to help assess the marginal impact of proposed policy changes (transport, trade, energy, tenure, etc.) or investments within a specific ecosystem (watershed, forest, etc.). The economic analysis could increasingly form part of a strategic environmental assessment.
Hopefully this report will contribute to increased and better use of economic arguments and analysis and lead to more informed national development planning. Given the increased political interest for climate change and natural resources management, the opportunities for good analytic work and inter-action with policy makers have perhaps never been better.
ENV/WKP(2008)4
30
REFERENCES
Adamowicz, W. L. (2004), What’s it worth ? An examination of historical trends and future directions in environmental valuation, Australian Journal of Agricultural and Resoure Economics, 48 :3, pp. 419-443
Agence française de Développement (2007), Governance of Renewable Natural Resources: Concept, Methods and Tools, Working Paper, Département de la Recherche, Agence française de Développement, Paris.
Azar, C. and Sterner, T. (1996), Discounting and distributional considerations in the context of global warming, Ecological Economics Vol. 19, pp. 169-184.
Bird, N. and Petkova, N. (2008), Public environmental expenditure within multi-year budgetary frameworks: Preliminary findings, OECD, Overseas Development Institute, London.
Bird, K. et al. (2004) Fracture Points in Social Policies for Chronic Poverty Reduction, ODI Working Paper 242, CPRC Working Paper 47, London, Overseas Development Institute
Blumberg, K. (2004), Benefit-cost Analysis of Ultralow Sulfur Fuels for Mexico, (Unpublished), Energy and Resources Group & Dept. of Civil and Environmental Engineering, University of California, Berkley
Bojö, J. et al. (2001), Environment, Poverty Reduction Strategy Paper: Sourcebook, Chapter 11, the World Bank, Washington DC.
Bojö, J. et al. (2004), Environment in Poverty Reduction Strategies and Poverty Reduction Support Credits, Paper No. 102, Environment Department, the World Bank, Washington DC.
Bolt, K., Ruta, G. and Sarraf, M. (2005), Estimating the Cost of Envrionmental Degradation: A training manual in English, French and Arabic, the World Bank, Washington DC.
Christiansen, K. and Hovland, I. (2003), The PRSP Initiative: Multilateral Policy Change and the Role of Research, Working Paper 216, Overseas Development Institute, London.
Convery, F.J. (1995), Applying Environmental Economics in Africa, Technical Paper No. 277, African Technical Series, the World Bank, Washington DC.
Court, J. and Young, J. (2003), Bridging Research and Policy: Insight from 50 Case Studies, Working Paper 213, Overseas Development Institute, London.
Court, J. And Young, J., (2004) Bridging Research and Policy in International DevelopmentAn Analytical and Practical Framework, Research and Policy in Development Programme Briefing Paper No 1, October 2004, Overseas Development Institute, London
ENV/WKP(2008)4
31
DFID, EC, UNDP, World Bank (2002), Linking Poverty Reduction and Environmental Management: Policy Challenges and Opportunities, the World Bank, Washington DC.
Das, T. and Virmani, A. (2005), Linkages between Research, Policy Analysis and Reform Outcomes in India, Global Development Network.
Emerton, L., Karanja, F. and Gichere, S. (2001), Environment, Poverty and Economic Growth in Kenya: What are the links and why do they matter?, Project No UNTS/RAF/008/GEF P.O. No. 93330, IUCN.
Grindle, M.S. and Thomas, J.W. (1989), Policy makers, policy choices, and policy outcomes: The political economy of reform in developing countries, Policy Science Vol. 22, pp. 213-248.
IUCN (2006), Investing in Environmental Wealth for Poverty Reduction: Annotated Bibliography, Prepared on behalf of the Poverty-Environment Partnership. IUCN: Gland.
Hansen, S. (2007), The Economic Case for Investing in Environment: A Review of Policies, Practice and Impacts of relevance to Norwegian Partner Countries, Norad Report 6a/2007 Discussion, Norad.
Hill, M. (2005), The Public Policy Process, fourth edition, Pearson, Essex.
Hovland, I. (2005), Successful Communication: A Toolkit for Researchers and Civil Society Organisations, Overseas Development Institute, London
Hovland, I. (2007) Making a difference: M&E of policy research, Working Paper 281, Overseas Development Institute, London.
Kingdon, JW. (1984) Agendas, Alternatives, and Public Policy, Harper Collins, New York
Kishore, S. (2007), Mainstreaming Environment in the Implementation of PRSPs in Sub-Saharan Africa, Environment Department Paper No. 112, Environment Department, the World Bank, Washington DC.
Lange, G.M. (2003), Policy Applications of Environmental Accounting, Environmental Economics Series, Paper No. 88, Environment Department, the World Bank, Washington DC.
Lawson, A. and Bird, N. (2008), Government institutions, public expenditure and the role of development partners: meeting the new challenges of the environmental sector, Overseas Development Institute, London.
Lindquist, E.A. (2001), Discerning Policy Influence: Framework for a Strategic Evaluation of IDRC-Supported Research, School of Public Administration, University of Victoria.
Livny, E., Mehendale, A. and Vanags, A. (2006), Bridging the research policy gaps in developing and transition countries: Analytical lessons and proposals for action, Global Development Network.
MacRae, D. Jr. (1998), Cross-National Perspectives for Aiding Policy Choice, Journal of Comparative Policy Analysis: Research and Practice Vol. 1, pp. 23–37.
Markandya, A., Hamilton, K. and Sanchez-Triana, E. (2006), Getting the Most of the Money – How Public Environmental Expenditure Reviews Can Help, Environmental Strategy Notes No. 16, Environment Department, The World Bank, Washington DC.
ENV/WKP(2008)4
32
Morgenstern, R.D. (2008) Toward Environmental Priority Setting in Development”, in Ahmed and Triana “Strategic Environmental Assessment for Policies – an Instrument for Good Governance, World Bank, Washington DC.
Millennium Ecosystem Assessment, (2005), Ecosystems and Human Well-being, Current State and Trends (Vol. 1), Island Press.
Morgenstern, R.D. (2008), Toward Environmental Priority Setting in Development, in Ahmed and Triana Strategic Environmental Assessment for Policies – an Instrument for Good Governance, World Bank, Washington DC.
Nilsson, M. and Eckerberg, K. (2007), Environmental Policy Integration in Practice: Shaping Institutions for Learning, Earthscan, London
OECD (2002), Handbook of Biodiversity Valuation: A Guide for Policy Makers, OECD, Paris.
OECD (2008a), Natural Resources and Pro-poor Growth: The economics and politics of natural resource use in developing countries, OECD, Paris
OECD (2008b), Costs of Inaction on Environmental Policy Challenges: Summary Report, OECD, ParisOECD (2007), Cost of Inaction: Annotated outline and selected draft chapters, Environment Policy Committee, OECD, Paris
OECD, (2006), Cost-Benefit Analysis and the Environment Recent Developments, OECD, Paris
O’Neil, M. (2005), What determines the influence that research has on policy-making, Journal of International Development Studies, Vol. 17, No. 6. Wiley, London.
Pagiola, S., von Ritter, K. and Bishop, J., in collaboration with The Nature Conservancy and IUCN-The World Conservation Union (2004), Assessing the Economic Value of Ecosystem Conservation, Environment Department Paper No. 101, Environment Department, the World Bank, Washington DC.
Poverty Environment Initiative (2008) “Making the economic case – a primer for mainstreaming environment in national development planning”.
Pillai, P.and Lunde, L. (2006), CEA and Institutional Assessment: A Review of International and World Bank Tools, Environment Strategy Papers No. 11, Environment Department, , the World Bank, Washington DC.
Pillai, P. (2008), Strengthening Policy Dialogue on Environment: Learning from Five Years of Country Environmental Analysis, Environment Department Papers No. 114, Institutions and Governance series, the World Bank, Washington DC.
Reed, D. (2005), Changing the Political Economy of Poverty and Ecological Disruption, WWF Macroeconomic Program Office.
Stern, N. (2006), Stern Review: The Economics of Climate Change–, HM Treasury, Cabinet Office.
Sukhdev, P. et al. (2008), The Economics of Ecosystems and Biodiversity (TEEB). Wesseling, Germany, European Communities.
ENV/WKP(2008)4
33
Tharakan, P. and MacDonald, M. (2004), Poverty Environment: Developing and Testing a PRSP Evaluation Methodology, WWF Macroeconomic Program Office.
The Guardian, (2008) Available from: http://www.guardian.co.uk/environment/2008/apr/18/climatechange.carbonemissions (2008-04-18)
Vermulen, S. (2005), Power Tools: Handbook to tools and resources for policy influence in natural resource management, International Institute for Environment and Development, London.
Waldman, L., with contributions from Barrance, A. et al.. (2005), Environment, Politics and Poverty: Lessons from a Review of PRSP Stakeholder Perspectives, Synthesis Review, study initiated under the Poverty Environment Partnership (PEP).
Wangwe, S. (2005), A Review of How External Agencies Can Influence Research Agendas and Influence Policy Links, Economic and Social Research Foundation.
Weiss, C. (1977), Research for Policy’s Sake: The Enlightenment Function of Social Science Research, Policy Analysis, 3 (4): 531-545.
World Bank Institute (2003), The Cost of Environmental Degradation in Lebanon and Syria, Training Program on the Cost of Environmental Degradation for Middle Eastern and North African Countries.
World Bank (2005a), Integrating Environmental Considerations in Policy Formulation: Lessons from Policy-Based SEA Experience, Report No 32783, Environment Department, the World Bank, Washington DC.
World Bank (2005b), Study on Growth and Environment links for Preparation of Country Economic Memorandum (CEM). Natural Resource-Based Growth: Summary Paper, the World Bank, Washington DC.
World Bank (2006), Where is the Wealth of Nations? Measuring Capital for the XXI Century, the World Bank, Washington DC.
World Bank (2007), World Development Indicators 2007, World Bank, Washington DC.
World Bank, (2008a), Global Monitoring Report MDGs and the Environment: Agenda for Inclusive and Sustainable Development, the World Bank, Washington DC
World Bank (2008b), Available from: http://web.worldbank.org/WBSITE/EXTERNAL/PUBLICATION/INFOSHOP1/0,,contentMDK:20121974~pagePK:162350~piPK:165575~theSitePK:225714,00.html (2008-11-13)
WHO (2006), Available from: http://www.who.int/quantifying_ehimpacts/publications/preventingdisease.pdf (2008-11-13)
WTO (2006), Exploring the links between subsidies, trade and the WTO, World Trade Report 2006, WTO.
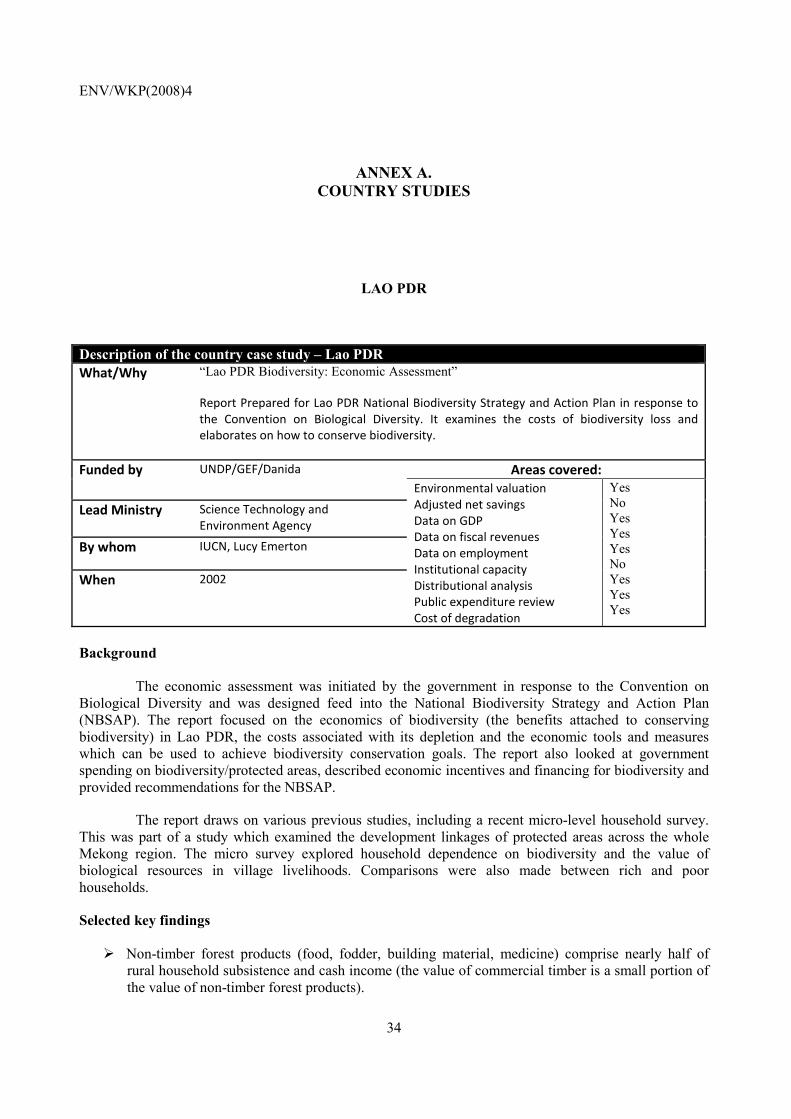
ENV/WKP(2008)4
34
ANNEX A. COUNTRY STUDIES
LAO PDR
Description of the country case study – Lao PDR What/Why
“Lao PDR Biodiversity: Economic Assessment” Report Prepared for Lao PDR National Biodiversity Strategy and Action Plan in response to the Convention on Biological Diversity. It examines the costs of biodiversity loss and elaborates on how to conserve biodiversity.
Funded by
UNDP/GEF/Danida Areas covered: Environmental valuation Adjusted net savings Data on GDP Data on fiscal revenues Data on employment Institutional capacity Distributional analysis Public expenditure review Cost of degradation
Yes No Yes Yes Yes No Yes Yes Yes
Lead Ministry
Science Technology and Environment Agency
By whom IUCN, Lucy Emerton
When 2002
Background The economic assessment was initiated by the government in response to the Convention on Biological Diversity and was designed feed into the National Biodiversity Strategy and Action Plan (NBSAP). The report focused on the economics of biodiversity (the benefits attached to conserving biodiversity) in Lao PDR, the costs associated with its depletion and the economic tools and measures which can be used to achieve biodiversity conservation goals. The report also looked at government spending on biodiversity/protected areas, described economic incentives and financing for biodiversity and provided recommendations for the NBSAP.
The report draws on various previous studies, including a recent micro-level household survey. This was part of a study which examined the development linkages of protected areas across the whole Mekong region. The micro survey explored household dependence on biodiversity and the value of biological resources in village livelihoods. Comparisons were also made between rich and poor households.
Selected key findings
Non-timber forest products (food, fodder, building material, medicine) comprise nearly half of rural household subsistence and cash income (the value of commercial timber is a small portion of the value of non-timber forest products).
ENV/WKP(2008)4
35
Poorer households derive a larger portion of their cash income from non-timber forest products than richer households.
75 % of GDP is derived from biodiversity-based or biodiversity-dependent sectors.18
92% of the national workforce is employed primarily in biodiversity-based or biodiversity-
dependent economic activities. Main steps Getting started Having ratified the Convention on Biological Diversity, the government of Lao PDR undertook to develop a National Biodiversity Strategy and Action Plan. Economic aspects were seen as a key element of this plan, both as part of the background country study on biodiversity (via the economic assessment of Lao PDR’s biodiversity) and also as part of the strategy and action plan itself (via a financing strategy). Few other countries have given this degree of prioritisation and coverage to economic aspects when developing their national biodiversity strategy and action plan. The economic aspects of biodiversity were also seen to be of central importance to many of the key elements in the country’s Vision 2020 and the Fifth Five-year Socio-Economic Development Plan. The project was headed by a working group with representatives from the Science, Technology and Environment Agency, National Tourism Authority and the Ministry of Agriculture and Forestry. Technical support was provided by The International Union for Conservation of Nature (IUCN). The working group agreed to follow a 10-step method developed by IUCN and focus on the first 7 steps. The first two steps relate to the identification of data needs and availability. The third and fourth steps include assessment of the national economic structure, laws and policies. Steps 5-7 deal with the cost of conservation, cost of inaction, and values the benefits of biodiversity. Economic benefits of biodiversity for key sectors, resources and ecosystems are described and, where possible, quantified. Training and awareness seminars on the use of economic tools took place during the preparation of the economic assessment.
Data collection and analysis The assessment report attempts to make an initial quantification of the economics of biodiversity in Lao PDR. Although data was scarce and incomplete, the assessment makes use of a broad range of existing sources including academic research, national and regional statistics and reports. In particular, micro-level data gathered earlier on the economic value of biological resources to household livelihoods constituted a critical input. For this study it had been possible to influence the design of district-level household income and expenditure studies being carried out by the government. Two protected forests in north-eastern Lao PDR were studied (Nam et and Phou Loei).The study drew comparisons between richer and poorer households and their dependence on different aspects of biodiversity.
18 Biodiversity-based sectors, according to the study, include activities which are based directly on the
utilisation or consumption of i) indigenous biological resources such as forestry, fisheries and aquatic plants and animals; and ii) agricultural production from indigenous crop and livestock varieties. Biodiversity-dependent sectors are defined as sectors which have a high reliance on the raw materials, services and functions that biodiversity provides, such as those that rely on watershed catchment protection services (irrigation, hydropower, domestic and urban water supplies); soil biodiversity (crop production from non-indigenous varieties); wild fodder and pasture (livestock production from non-indigenous varieties); ecological integrity and cultural diversity (tourism and associated services).
ENV/WKP(2008)4
36
The assessment report presents data notably on the direct use values of biodiversity, (value of goods that can be traded at market prices: rice, timber, wood fuel, fish, livestock, etc.) but also ecosystem services such as carbon sequestration and recreational values such as tourism. As the analysis excludes a number of indirect and optional economic values, the results of the assessment are described as a minimum estimate of the total economic value of Lao PDR’s biodiversity.
The following paragraphs present some examples of data.
Role of forest biodiversity in local livelihoods
The new study of households living near, or in, protected areas (Nam et and Phou Loei) showed the economic value of forest product utilisation to be USD 313 per household. Subsistence-level consumption represented three-quarter of the total and cash income represented one-quarter. The data were collected by asking residents to quantify their use and sales of wild plants, wild meat/fish and wood and using local market prices to assess the value. When comparing richer and poorer households it was found that poorer households derived a higher portion of their cash income from forest products (35%) than richer households (25%).
Contribution of non-timber forest products (NTFP)
Commercial timber is not representative of the value of forests. Existing studies of the value of non-timber forest products consistently show that NTFP provide significant values although with different results. An expert was called upon to determine which study to use for a national estimate. On average NTFPs were reported to contribute to rural households representing 44% of subsistence value, 55% of cash income, or 46% of the total household economy. Using these average household data the study estimates that NTFPs may be worth USD 182 million in total. Firewood, fish and aquatic resource consumption values are not included in this figure.
Livestock
With the exception of limited commercial pig, chicken and cattle farms in and around urban centres, the majority of livestock originate from stock domesticated within Lao PDR and are indigenous or traditional breeds. All livestock depend primarily on natural vegetation and crop residues for their energy intake. Therefore, according to the study, assumes that the full output of buffalo, cattle, pig and poultry production depends directly on indigenous biodiversity. By applying market values to the livestock production the study shows that biodiversity, through livestock, contributes almost USD 80 million a year.
Livestock production under traditional management practices has an additional benefit to agriculture in terms of maintaining soil fertility for crop production. Little use is made of chemical fertilisers in most farming systems in Lao PDR. Cattle and buffalo provide manure which supplements soil nutrients and maintains soil fertility. Local breeds of cattle and buffalo produce an average of 0.7 tonnes of dung per year, containing 1.4% nitrogen and 1.3% phosphorus, which are equivalent to 9.8 kg of combined nutrients. The study estimates that a quarter of livestock manure is applied to fields. Hence, the contribution of livestock manure to soil fertility and savings on fertilisers amount to an estimated annual value of USD 1 million.
Forest carbon sequestration
Forest ecosystems have the ability to store carbon dioxide. A number of estimates on sequestered carbon by tropical forests had previously been made, ranging from 100 to 250 tonnes of carbon per hectare depending on the type of forest. Studies of the benefits of sequestration had ranged between USD 5 to 25 per tonne of CO2. The economic assessment study estimated sequestration levels between 125-150 tonnes
ENV/WKP(2008)4
37
of carbon for dense natural forests, 75 t/C for disturbed natural forests and 50-75 t/C for re-growth and mosaic forests. This suggests a value of carbon sequestration of USD 6 billion.
Nature-based tourism
Lao PDR opened its doors to international tourism in 1990 and since then the industry has developed rapidly to become one of the country’s largest earners of foreign currency. Visitor arrivals have increased over 100 fold from under 7 000 in 1990 to around 700 000 at the beginning of this century (National Tourism Authority).
The principal tourist attraction for international visitors is the nation’s rich nature and cultural heritage. An average of 70% of international visitors come to Lao PDR for touristic reasons and stay on average between 1 and 8 days, according to the National Tourism Authority. It is assumed that half of these tourists are expatriate Lao PDR visiting family and friends, and that 70% of the remaining international tourists visit Lao PDR primarily to enjoy the country’s biodiversity. Estimates of average daily expenditures for non-regional international tourists range from USD 50 (National Tourism Authority) to USD 90 (UNDP and WTO 1998) a day. Based on an average expenditure of USD 60 it is estimated that the gross value of nature-based tourism in 2001 may have exceeded USD 59 million a year.
Communication
Several large workshops and seminars were held to discuss the findings of the study; participants included government representatives, international donors, NGOs and various stakeholders. In addition, smaller seminars were held at individual sector ministries, where the results were discussed in more technical terms. These were also complemented with general awareness seminars and training on the use of economic tools for biodiversity planning. The report was planned and carried out with the aim of contributing to the Lao PDR NBSAP, and the team helped to integrate the findings into the plan. One advantage in the Lao PDR case, from a communication perspective, was that there was already an awareness of the importance of conserving biodiversity. On the other hand, concrete figures underpinning general claims were lacking.
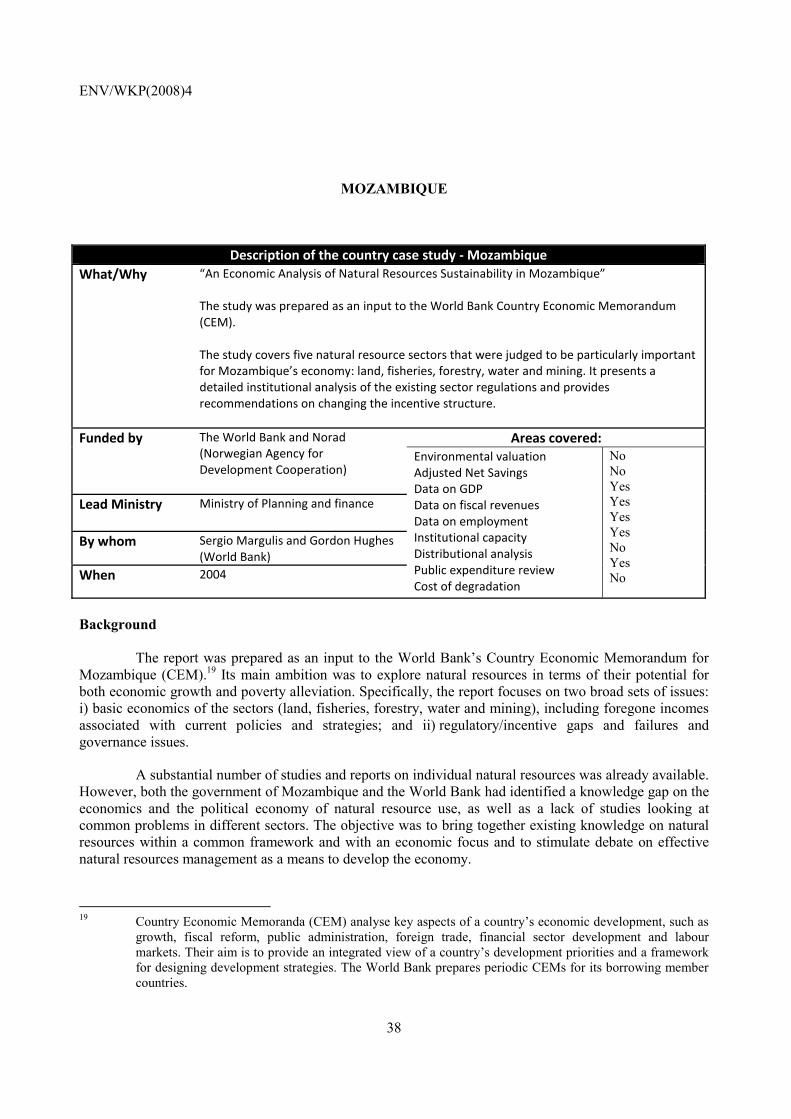
ENV/WKP(2008)4
38
MOZAMBIQUE
Description of the country case study - MozambiqueWhat/Why
“An Economic Analysis of Natural Resources Sustainability in Mozambique” The study was prepared as an input to the World Bank Country Economic Memorandum (CEM). The study covers five natural resource sectors that were judged to be particularly important for Mozambique’s economy: land, fisheries, forestry, water and mining. It presents a detailed institutional analysis of the existing sector regulations and provides recommendations on changing the incentive structure.
Funded by The World Bank and Norad (Norwegian Agency for Development Cooperation)
Areas covered: Environmental valuation Adjusted Net Savings Data on GDP Data on fiscal revenues Data on employment Institutional capacity Distributional analysis Public expenditure review Cost of degradation
No No Yes Yes Yes Yes No Yes No
Lead Ministry
Ministry of Planning and finance
By whom Sergio Margulis and Gordon Hughes (World Bank)
When 2004
Background The report was prepared as an input to the World Bank’s Country Economic Memorandum for Mozambique (CEM).19 Its main ambition was to explore natural resources in terms of their potential for both economic growth and poverty alleviation. Specifically, the report focuses on two broad sets of issues: i) basic economics of the sectors (land, fisheries, forestry, water and mining), including foregone incomes associated with current policies and strategies; and ii) regulatory/incentive gaps and failures and governance issues.
A substantial number of studies and reports on individual natural resources was already available. However, both the government of Mozambique and the World Bank had identified a knowledge gap on the economics and the political economy of natural resource use, as well as a lack of studies looking at common problems in different sectors. The objective was to bring together existing knowledge on natural resources within a common framework and with an economic focus and to stimulate debate on effective natural resources management as a means to develop the economy.
19 Country Economic Memoranda (CEM) analyse key aspects of a country’s economic development, such as
growth, fiscal reform, public administration, foreign trade, financial sector development and labour markets. Their aim is to provide an integrated view of a country’s development priorities and a framework for designing development strategies. The World Bank prepares periodic CEMs for its borrowing member countries.
ENV/WKP(2008)4
39
Selected key findings
Laws and regulations establishing rules for natural resources management in Mozambique, including mechanisms like quotas, concessions, and fees, are well designed. However, final implementation and enforcement are insufficient.
Major efficiency and equity gains could be achieved by implementing better mechanisms for
charging for both services and access to resources. Currently, the government is foregoing significant rents without achieving any clear benefits in return.
Public revenues from natural resource rents could be increased from USD 31 million to USD 82
million per year under current economic conditions, mostly by adopting more adequate charges for land and bulk water.
The public revenues from natural resource rents in 2015 could realistically increase to USD 215
million per year, representing almost 3% of GDP or 20% of total tax revenues. The majority of the increase after 2005 comes from the expected growth of the mining sector, so that the total contribution from this sector alone would almost equal that of the others combined.
Main steps
Getting started
The World Bank and the government of Mozambique identified the need for a detailed analysis of the economics of natural resources use as input to the Country Economic Memorandum. It was decided to bring in international experts and to ensure that local experts/stakeholders within government and agencies participated in interviews and reviewed findings. Terms of reference were agreed by the government and the World Bank after a first exploratory mission.
The analysis was designed to build on existing data and to focus on the aspect of the environment that could be most easily valued, i.e. the direct use of the resource It was also agreed to adhere to a sectoral structure that corresponds to the ministries’ organisational structure. Sectors were chosen in function of their potential impact on economic growth and poverty reduction. The sectors’ common features were highlighted in order to arrive at a policy design based on common principles.
Data collection and analysis
The report is primarily based on a desk review of five background studies, one for each of the examined sectors. The background studies were based on official statistics, field interviews with officials, private agents, NGOs and academic experts as well as several previous reports and existing literature. Basic knowledge and ideas originated mainly from local expertise.
In the case of water resources a complementary two-week fact-finding mission was undertaken. The background documents and the main report were critically reviewed by four high-ranking Mozambican experts in natural resources issues.
A central theme of the study was to maintain and enhance the economy’s growth capacity. In relation to this objective, charging proper rates for natural capital consumption was seen as crucial. The study’s main objective was to calculate optimal rate levels for access to, and use of, resources.
ENV/WKP(2008)4
40
The availability of data in Mozambique is generally not good, so the calculations are based on rough estimations. The objective was to inform a discussion by showing orders of magnitude, not trying to provide exact figures.
Different methods were used to deal with data gaps. Where data were scarce, approximate figures were “borrowed” from similar calculations in other African countries, or studies were undertaken to reach realistic estimates. Where there was contradictory data, an expert was called upon to identify the most appropriate figures.
Data on access to water was an example of contradictory data. Official data suggested that 38% of the urban population was served by piped water while data from studies made specifically for the CEM showed that 64% of urban households had access to safe drinking water. This data was considered more reliable as it included households with indirect access to a water tap, for example, via neighbors.
Products from forestry, mining, agriculture, fisheries and the water sector are subject to market transactions. To keep calculations as simple as possible, current market prices were used to assess the future value of the resource and estimate possible future gains.
The team evaluated whether or not rents were up-to-date and collected at appropriate levels. One of the main findings of the study is that the rent for leasing natural resources in Mozambique, especially regarding land, is too low and this could potentially increase government revenues. The following paragraphs give selected examples of the analysis made for different sectors.
Land
In Mozambique all land is state property. User rights of long duration can be obtained at low cost. The cost is so low that many people have acquired user rights to much more land than they actually exploit. Others cultivate the land but pay a very small rent. To address this problem, the team carried out a simple simulation to estimate potential revenues from land rents. The average size of small holdings was 1.15 hectares/household. All households were allowed to have significantly more, i.e. 5 hectares without paying a land tax. If an average tax of USD 1320 per ha, instead of the current USD 1,3 per ha, was imposed on all cultivated land above 5 ha per holding, the total tax revenue would be about USD 8,5 million. The proposed average tax was considered rather low by international standards and represents barely more than 1% of agricultural value-added.
Forestry
Previous studies had shown that, in spite of protective legislation, logging is carried out with minimal reforestation efforts and non-optimal management practices. As a consequence, forest resources are consumed and loggers are making abnormal profits. A forest license fee was established to capture part of this revenue. Even though the study shows that the fee revenue increased over the period 1998-2003, it still accounted for only 0,4% of total government revenue. The study team suggested befitting rent rates in order to estimate whether or not current rents had been set and collected at appropriate levels. It was found that the current average license fee was within the expected range for scarcity rent values. However, license fees would gain by being differentiated in order to facilitate optimal resource use, i.e. different fees for different species. A gradual elimination of subsidies (such as reduced fees for new industries) could potentially increase revenues. Also, national wood output was around 127 000 m3/year and the most conservative estimates of the forest potential around 500 000 m3/per year of sustainable logging. Increased forest revenues would first and foremost be associated with increased production.
20 300 000 Mozambique Metical = USD13 in April 2004.
ENV/WKP(2008)4
41
The team also examined foregone revenues due to subsidies. To stimulate growth of a forest processing industry the average subsidy on a processed log was 60%. The study team calculated the foregone government revenues due to subsidies for amount to USD 360 000.
Fisheries
Lack of data hampered the analysis of fisheries. Nevertheless, the study attempted to assess the potential for increasing these revenues. A previous study had estimated the net income generated by fisheries to be at least 40% of the total revenue. Taking as an example the shrimp fishery, which is the most important in the country in terms of export value and influx of foreign currency, and assuming that 80% of the exported catch is efficiently produced, the study team estimated that every ton of shrimp caught generates over USD 3 800 of net revenue. This, expressed as an annual value, is equivalent to USD 24 million.
Because the total fisheries rent was based on limited data an expert estimated it to be in the order of USD 10-30 million annually, exports at USD 70 million annually, and license fees at USD 5 million. However, no information was available on the amounts collected and the sums passed on to the ministry of planning and finance.
Mining
Despite Mozambique’s substantial mineral assets the sector’s formal contribution to the economy was less than 2% of GDP. Fiscal revenues were estimated to be about USD 3-5 million annually. Available estimates indicated that about USD 10 million of gold and USD 30 million of semi-precious stones were exported through informal channels each year, which represent some USD 1 million in foregone fiscal revenues at current royalty levels. The latter were estimated to be appropriate but a large potential for further government revenues could be achieved through a substantial expansion of the sector. It was estimated that the potential long term export revenues could reach USD 500 million by 2010 and as much as USD 700 million by 2015.
Communicating
On completion, the report was presented to corresponding sector ministries in Mozambique and it was well received. No formal meetings, seminars or focus group interviews took place. This was considered unnecessary, since sector ministries had taken an active part in the study, both at the start, by aiding in the formulation of objectives, and during the process, by providing data.
In addition, a small team returned to Mozambique in 2005 to discuss at a more technical level the main findings of the report with ministry officials. Their task was made easier because the consultants involved in the study and the team leader spoke Portuguese. Another factor which helped communicate the results of the study was that the head of research at the ministry of finance took a personal interest in the project and took part in drafting the terms of reference for the study.
The findings were included in the Country Economic Memorandum and, later on, some of the findings of the study were reported in the PRS. The PRSP activity matrix also included the objective “to improve inspections to monitor compliance with laws on natural resources”.
ENV/WKP(2008)4
42
PERU
Description of the country case study: PeruWhat/Why
“Environmental Sustainability: A Key to Poverty Reduction in Peru Country Environmental Analysis” The findings of the CEA were specifically intended to help design and implement policies to improve the effectiveness and efficiency of Peru’s environmental management system, and integrate principles of sustainable development into key sector policies, with an emphasis on protecting the most vulnerable groups.
Funded by
World bank, Norway and Finland through the TFESSD funds
Areas covered: Environmental valuation Adjusted Net Savings Data on GDP Data on fiscal revenues Data on employment Institutional capacity Distributional analysis Public expenditure review Cost of degradation
No No Yes No No Yes Yes Yes Yes
Lead Ministry
Consejo Nacional Ambiental (CONAM), National Environmental Authority
By whom World Bank team leader: Ernesto Sánchez Triana
When 2006
Background Over the past five decades, Peru has restructured its legal and regulatory landscape, undertaken numerous policy initiatives and strengthened its institutional capacity for protecting and managing the environment and natural resources. However, Peru still faces the serious challenge of slowing and reversing environmental degradation. The Country Environmental Analysis (CEA) was specifically intended to help design and implement policies to i) improve the effectiveness and efficiency of Peru’s environmental management system, and ii) integrate principles of sustainable development into key sector policies, with an emphasis on protecting the most vulnerable sectors of the population. The main elements of the CEA include analyses of i) the institutional capacity for environmental management in Peru; and ii) the cost of environmental degradation.
The CEA was initiated in 2005 through a workshop, organised by the World Bank, in Paracas, Peru, involving national stakeholders and development partners. Participants included representatives from agencies from various sectors, including environment, health, energy and mines, regional environmental authorities, the private sector, non-governmental organisations and international organizations. Workshop participants provided input for the overall diagnosis of the state of the environment in Peru and helped to identify crucial information gaps that needed to be addressed by the CEA. The workshop also constituted an opportunity to help build consensus around the importance, scope and methodologies used to carry out the analysis.
The government of Peru, mainly through the national environmental authority (Consejo Nacional Ambiental, CONAM), provided key feedback during the preparation of the study and participated actively in the production of different parts of the report. Important feedback was also received from members of international donor agencies, non-governmental organisations and UNDP.
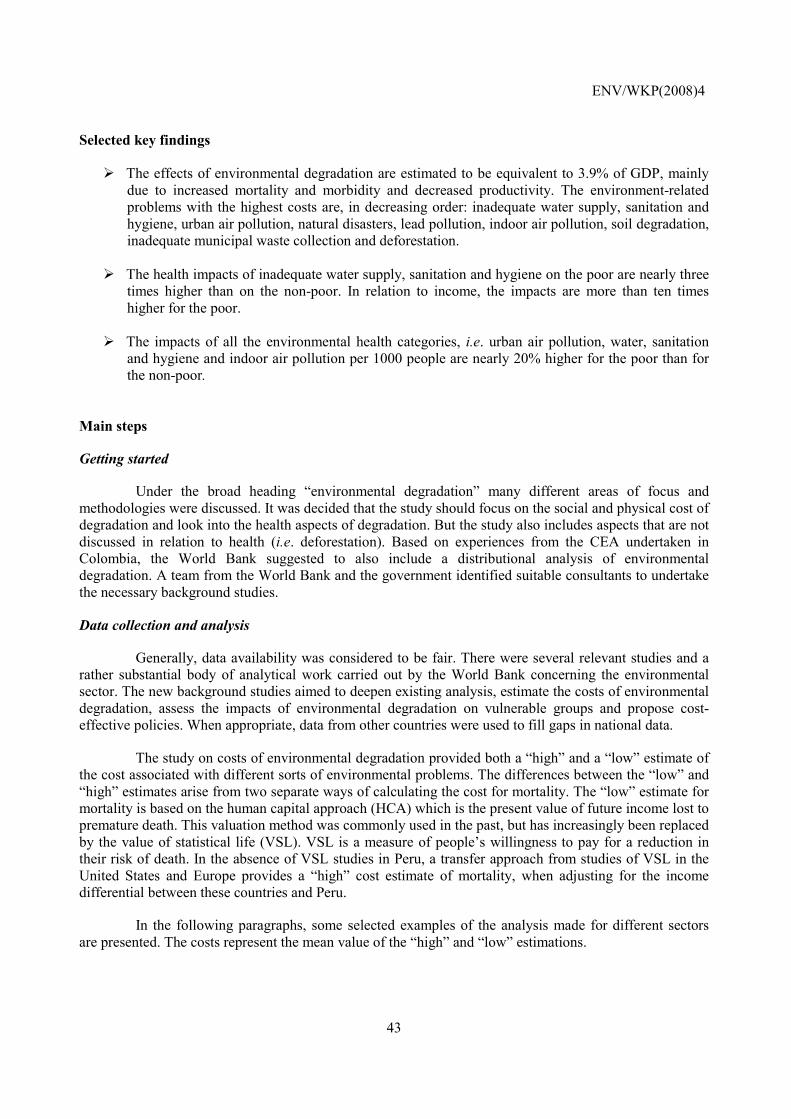
ENV/WKP(2008)4
43
Selected key findings
The effects of environmental degradation are estimated to be equivalent to 3.9% of GDP, mainly due to increased mortality and morbidity and decreased productivity. The environment-related problems with the highest costs are, in decreasing order: inadequate water supply, sanitation and hygiene, urban air pollution, natural disasters, lead pollution, indoor air pollution, soil degradation, inadequate municipal waste collection and deforestation.
The health impacts of inadequate water supply, sanitation and hygiene on the poor are nearly three
times higher than on the non-poor. In relation to income, the impacts are more than ten times higher for the poor.
The impacts of all the environmental health categories, i.e. urban air pollution, water, sanitation
and hygiene and indoor air pollution per 1000 people are nearly 20% higher for the poor than for the non-poor.
Main steps
Getting started
Under the broad heading “environmental degradation” many different areas of focus and methodologies were discussed. It was decided that the study should focus on the social and physical cost of degradation and look into the health aspects of degradation. But the study also includes aspects that are not discussed in relation to health (i.e. deforestation). Based on experiences from the CEA undertaken in Colombia, the World Bank suggested to also include a distributional analysis of environmental degradation. A team from the World Bank and the government identified suitable consultants to undertake the necessary background studies.
Data collection and analysis
Generally, data availability was considered to be fair. There were several relevant studies and a rather substantial body of analytical work carried out by the World Bank concerning the environmental sector. The new background studies aimed to deepen existing analysis, estimate the costs of environmental degradation, assess the impacts of environmental degradation on vulnerable groups and propose cost-effective policies. When appropriate, data from other countries were used to fill gaps in national data.
The study on costs of environmental degradation provided both a “high” and a “low” estimate of the cost associated with different sorts of environmental problems. The differences between the “low” and “high” estimates arise from two separate ways of calculating the cost for mortality. The “low” estimate for mortality is based on the human capital approach (HCA) which is the present value of future income lost to premature death. This valuation method was commonly used in the past, but has increasingly been replaced by the value of statistical life (VSL). VSL is a measure of people’s willingness to pay for a reduction in their risk of death. In the absence of VSL studies in Peru, a transfer approach from studies of VSL in the United States and Europe provides a “high” cost estimate of mortality, when adjusting for the income differential between these countries and Peru.
In the following paragraphs, some selected examples of the analysis made for different sectors are presented. The costs represent the mean value of the “high” and “low” estimations.
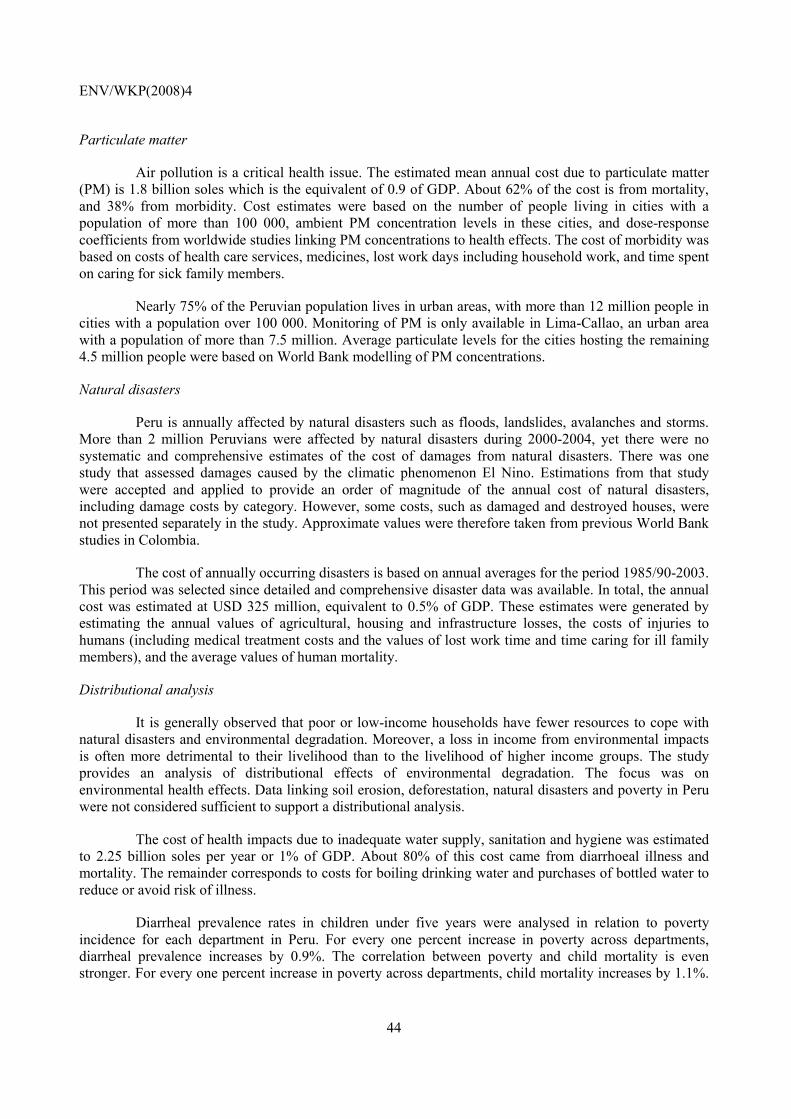
ENV/WKP(2008)4
44
Particulate matter
Air pollution is a critical health issue. The estimated mean annual cost due to particulate matter (PM) is 1.8 billion soles which is the equivalent of 0.9 of GDP. About 62% of the cost is from mortality, and 38% from morbidity. Cost estimates were based on the number of people living in cities with a population of more than 100 000, ambient PM concentration levels in these cities, and dose-response coefficients from worldwide studies linking PM concentrations to health effects. The cost of morbidity was based on costs of health care services, medicines, lost work days including household work, and time spent on caring for sick family members.
Nearly 75% of the Peruvian population lives in urban areas, with more than 12 million people in cities with a population over 100 000. Monitoring of PM is only available in Lima-Callao, an urban area with a population of more than 7.5 million. Average particulate levels for the cities hosting the remaining 4.5 million people were based on World Bank modelling of PM concentrations.
Natural disasters
Peru is annually affected by natural disasters such as floods, landslides, avalanches and storms. More than 2 million Peruvians were affected by natural disasters during 2000-2004, yet there were no systematic and comprehensive estimates of the cost of damages from natural disasters. There was one study that assessed damages caused by the climatic phenomenon El Nino. Estimations from that study were accepted and applied to provide an order of magnitude of the annual cost of natural disasters, including damage costs by category. However, some costs, such as damaged and destroyed houses, were not presented separately in the study. Approximate values were therefore taken from previous World Bank studies in Colombia.
The cost of annually occurring disasters is based on annual averages for the period 1985/90-2003. This period was selected since detailed and comprehensive disaster data was available. In total, the annual cost was estimated at USD 325 million, equivalent to 0.5% of GDP. These estimates were generated by estimating the annual values of agricultural, housing and infrastructure losses, the costs of injuries to humans (including medical treatment costs and the values of lost work time and time caring for ill family members), and the average values of human mortality.
Distributional analysis
It is generally observed that poor or low-income households have fewer resources to cope with natural disasters and environmental degradation. Moreover, a loss in income from environmental impacts is often more detrimental to their livelihood than to the livelihood of higher income groups. The study provides an analysis of distributional effects of environmental degradation. The focus was on environmental health effects. Data linking soil erosion, deforestation, natural disasters and poverty in Peru were not considered sufficient to support a distributional analysis.
The cost of health impacts due to inadequate water supply, sanitation and hygiene was estimated to 2.25 billion soles per year or 1% of GDP. About 80% of this cost came from diarrhoeal illness and mortality. The remainder corresponds to costs for boiling drinking water and purchases of bottled water to reduce or avoid risk of illness.
Diarrheal prevalence rates in children under five years were analysed in relation to poverty incidence for each department in Peru. For every one percent increase in poverty across departments, diarrheal prevalence increases by 0.9%. The correlation between poverty and child mortality is even stronger. For every one percent increase in poverty across departments, child mortality increases by 1.1%.
ENV/WKP(2008)4
45
The mortality rate among the poorest 20% of the population was about 5 times higher than among the richest 20% in 1996 and in 2000.
The impact on health per 1000 people is nearly three times higher in poor populations than in the non-poor population. The main reasons for this are that poor families have more children, that diarrheal mortality largely relates to children, and diarrheal incidence rate is much higher for children than for adults. The estimate is based on the child mortality rates and the diarrheal prevalence rates in children, and estimates of diarrheal prevalence rate in the population above the age of five years. There are many reasons why the diarrheal disease burden is higher in the poor population than in the non-poor population. First of all, the poor have much lower access to improved water supply and safe sanitation. Secondly, hygiene conditions are likely to be worse.
The incidence of health problems relative to income is even higher. Health impacts were more than 10 times higher in the poor population than in the non-poor population per unit of income. This was because the income of the non-poor was nearly four times higher than the income of the poor and the poor’s lower ability to invest in medical care thereby prolonging and worsening sickness.
Communication
An important way to enhance the chances of policy impact was to involve the government of Peru as well as other national stakeholders throughout the process. The process, the study results and methodology were discussed continuously with relevant ministries. Moreover, preliminary output was shared with all sector ministries. Input and comments came mostly from the sector ministries for environment, health, energy and mining.
The preliminary results of the CEA were presented during a conference (VI Ecodialogue) in 2006 reaching more than 400 representatives from public entities, indigenous peoples, professional associations, academic centres, non-governmental organisations and civil society.
When the report was completed, four workshops were held on the CEA for Peru, and the report was posted on the Internet. In addition, four policy notes were prepared on the basis of the CEA; these addressed environmental health, natural resources, fisheries and mining. The team conducted discussions with all political parties during the presidential campaign. The dialogue continued after the elections, including contacts at the highest political level.
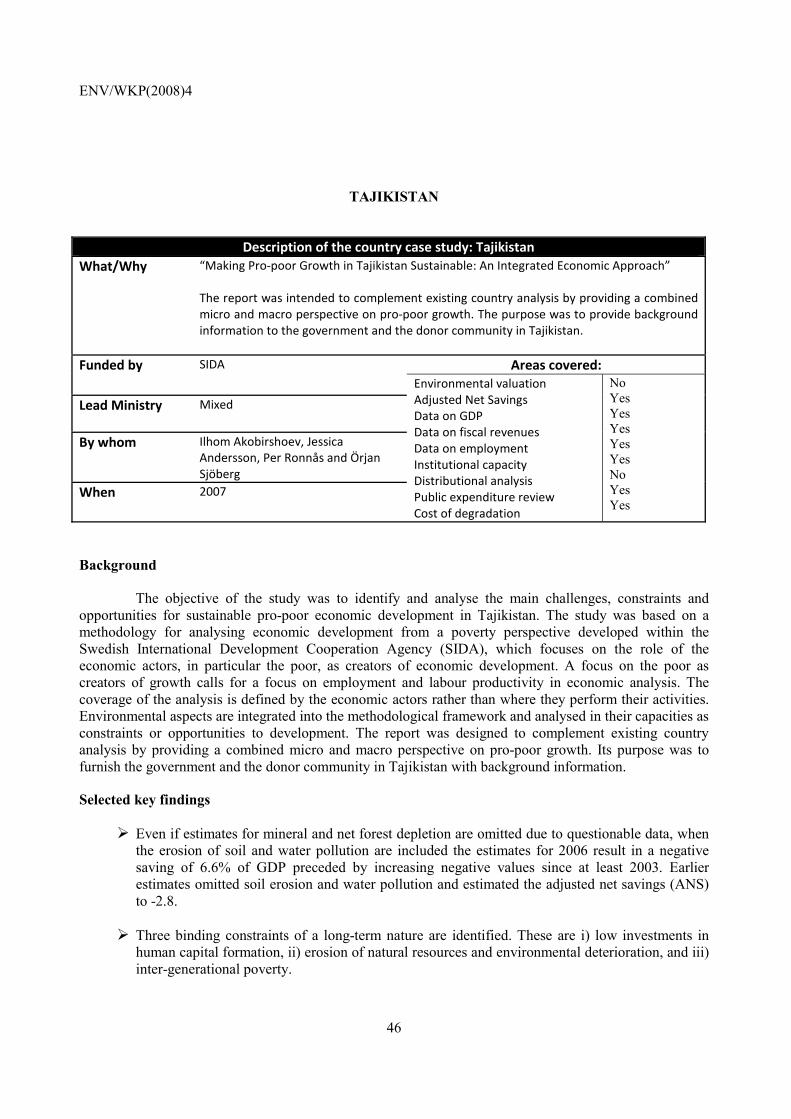
ENV/WKP(2008)4
46
TAJIKISTAN
Description of the country case study: TajikistanWhat/Why
“Making Pro-poor Growth in Tajikistan Sustainable: An Integrated Economic Approach” The report was intended to complement existing country analysis by providing a combined micro and macro perspective on pro-poor growth. The purpose was to provide background information to the government and the donor community in Tajikistan.
Funded by SIDA Areas covered: Environmental valuation Adjusted Net Savings Data on GDP Data on fiscal revenues Data on employment Institutional capacity Distributional analysis Public expenditure review Cost of degradation
No Yes Yes Yes Yes Yes No Yes Yes
Lead Ministry
Mixed
By whom Ilhom Akobirshoev, Jessica Andersson, Per Ronnås and Örjan Sjöberg
When 2007
Background The objective of the study was to identify and analyse the main challenges, constraints and opportunities for sustainable pro-poor economic development in Tajikistan. The study was based on a methodology for analysing economic development from a poverty perspective developed within the Swedish International Development Cooperation Agency (SIDA), which focuses on the role of the economic actors, in particular the poor, as creators of economic development. A focus on the poor as creators of growth calls for a focus on employment and labour productivity in economic analysis. The coverage of the analysis is defined by the economic actors rather than where they perform their activities. Environmental aspects are integrated into the methodological framework and analysed in their capacities as constraints or opportunities to development. The report was designed to complement existing country analysis by providing a combined micro and macro perspective on pro-poor growth. Its purpose was to furnish the government and the donor community in Tajikistan with background information.
Selected key findings
Even if estimates for mineral and net forest depletion are omitted due to questionable data, when the erosion of soil and water pollution are included the estimates for 2006 result in a negative saving of 6.6% of GDP preceded by increasing negative values since at least 2003. Earlier estimates omitted soil erosion and water pollution and estimated the adjusted net savings (ANS) to -2.8.
Three binding constraints of a long-term nature are identified. These are i) low investments in human capital formation, ii) erosion of natural resources and environmental deterioration, and iii) inter-generational poverty.
ENV/WKP(2008)4
47
Main steps
Getting started
The initiative to undertake new research on impediments for economic development came from SIDA staff in Tajikistan. Government representatives showed a considerable interest in the project and a workshop - where a number of ministries were represented - was held to discuss the focus of the study. Environmental aspects were not, at first, considered a priority area, but they became so during dialogue and ongoing meetings. One of the objectives of the methodology was to create a dialogue and start/strengthen co-operation as an explicit strategy for impact.
As economists were the study’s main target group the team decided to use the national accounting framework with gross national savings as point of departure for the analysis (the World Bank concept of adjusted net savings). ANS depicts a more realistic level of savings after accounting for depreciation of produced capital, investments in human capital and depletion of natural capital. Based on the estimations of ANS, recommendations with binding constraints for pro-poor growth in Tajikistan were identified.
Data collection and analysis
The World Bank has a database on ANS for most nations. Existing data on Tajikistan was used and, when judged necessary, modified and complemented with new data. According to the World Bank, adjusted net savings for Tajikistan amounted to -2.8% of GNI in 2006. This estimate, although already negative, does not include two of the country’s most important resources, water and soil, an omission addressed in the study. In addition, the World Bank report ascribes zero values on mineral and net forest depletion. This is explained by a lack of reliable data, but provides an incorrect picture of the savings.
It should be remembered that national data are often estimates and not always reliable. Gross National Saving (% of GDP) figures are based on IMF estimates and information from the State Statistical Committee of Tajikistan.
In the following paragraphs the methods for calculating costs of water and soil degradation are presented as well as an example of how the study discussed economics of forestry.
Soil
There were a number of important indications of land degradation. A study from 1997 reported that 97% of agricultural land was affected by soil erosion. Another study had estimated the cost of land degradation to USD 224 million per year by looking at decreased yields of cotton, potatoes, vegetables etc. Given the indications of land degradation and lack of reliable national data the approach taken was to use average figures from countries with similar problems. An international meta study estimated that problems from sustainable land management deduct between 3–7% of the agricultural GDP. The average measure of this estimate, i.e. 5% of agricultural GDP is used. Numbers for Tajikistan’s agricultural GDP was deduced from the IMF. The estimate shows that the effect of soil degradation on GDP is -1.3%.
Water
There are some 4 000 registered pollution sources in Tajikistan and only 29% of the drinking water meets bacteriological standards. National health statistics showed that waterborne diseases had increased considerably. A common way of estimating water pollution damage is to estimate the willingness to pay (WTP) for improved water quality. No such studies had been made in Tajikistan. Instead data from a recent household study in Egypt was used and adjusted for income differences. The study comments that
ENV/WKP(2008)4
48
the transfer of figures from other countries could be questionable due to economic, geographical, ecological, cultural and demographic differences. A notable similarity between Tajikistan and Egypt was the fact that the impact on health of the poor quality of water lately had increased considerably in both countries. The Egypt study estimated a WTP of USD 37.5 per household/year for improved water quality. The calculated contribution to GDP of water pollution in Tajikistan was -2.5. For the purpose of estimating water pollutant damage, non-household impacts should also have been taken into account (agriculture, industry). Therefore the team argues that the reported figure is an underestimation.
Forest depletion
In simple terms, net forest depletion occurs when more wood (round wood and fuel wood) is extracted than the forest is able to renew. The World Bank reports zero net forest depletion due to lack of data. However there are indications that forest depletion is actually a considerable problem. The data published by the Tajik Forest Research Institute differ considerably from those obtained through international remote sensing observations. Using the lowest numbers given by different sources, the team estimates that wood extraction exceeds increment by 8 000 m3 annually. This figure could have been used to estimate the cost of forest depletion. However, in Tajikistan the main function of the little forest available (2.9% of land area) is to protect the environment, that is, to provide services such as water storage, prevent erosion and soil degradation. For this reason logging is prohibited except for sanitary and restoration work. By implication, the cost of forest depletion does not come from lost future revenues from logging, it comes from the increased cost of ecological degradation such as soil erosion and, in some areas, from increased risks of severe disasters such as landslides. To estimate the value of soil erosion damage due to deforestation is extremely complex, and very refined data is needed, since soil erosion is dependent on a multiple of natural and anthropogenic factors that interact and reinforce each other. In addition, these types of relationships are rarely linear, but typically react at a threshold level (for example a landslide) after which the damage might not only be extremely costly but also irreversible. No estimate for net forest depletion is therefore given although, as the information provided above shows, this value is likely to be far from negligible.
Communication
When completed, the report was presented to corresponding sector ministries via seminars, which were well attended. Participants included representatives from the ministry of finance, planning and environment, as well as NGOs. In addition, the recommendations with binding constraints were presented at a consultative groups meeting which was chaired by the president. It is also important that a dissemination strategy be built into the methodological framework. The study was backed up by continuous dialogue and meetings. Besides a workshop, held at the start of the project, the process, methodology, and the study results were discussed thoroughly, and at several different occasions during the process, with counterpart ministries.
The final report was translated to Russian, which is the working language of the Tajik authorities. It was also made available on the Internet.
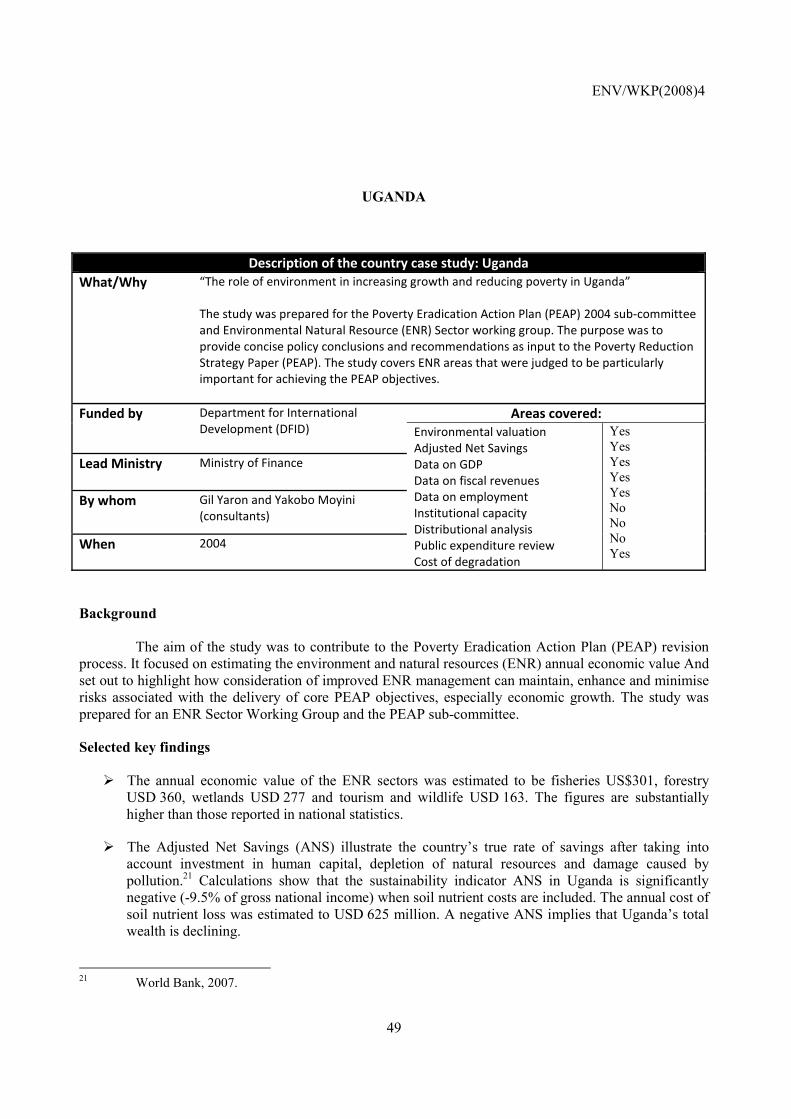
ENV/WKP(2008)4
49
UGANDA
Description of the country case study: UgandaWhat/Why
“The role of environment in increasing growth and reducing poverty in Uganda” The study was prepared for the Poverty Eradication Action Plan (PEAP) 2004 sub-committee and Environmental Natural Resource (ENR) Sector working group. The purpose was to provide concise policy conclusions and recommendations as input to the Poverty Reduction Strategy Paper (PEAP). The study covers ENR areas that were judged to be particularly important for achieving the PEAP objectives.
Funded by Department for International Development (DFID)
Areas covered: Environmental valuation Adjusted Net Savings Data on GDP Data on fiscal revenues Data on employment Institutional capacity Distributional analysis Public expenditure review Cost of degradation
Yes Yes Yes Yes Yes No No No Yes
Lead Ministry
Ministry of Finance
By whom Gil Yaron and Yakobo Moyini (consultants)
When 2004
Background The aim of the study was to contribute to the Poverty Eradication Action Plan (PEAP) revision process. It focused on estimating the environment and natural resources (ENR) annual economic value And set out to highlight how consideration of improved ENR management can maintain, enhance and minimise risks associated with the delivery of core PEAP objectives, especially economic growth. The study was prepared for an ENR Sector Working Group and the PEAP sub-committee.
Selected key findings
The annual economic value of the ENR sectors was estimated to be fisheries US$301, forestry USD 360, wetlands USD 277 and tourism and wildlife USD 163. The figures are substantially higher than those reported in national statistics.
The Adjusted Net Savings (ANS) illustrate the country’s true rate of savings after taking into account investment in human capital, depletion of natural resources and damage caused by pollution.21 Calculations show that the sustainability indicator ANS in Uganda is significantly negative (-9.5% of gross national income) when soil nutrient costs are included. The annual cost of soil nutrient loss was estimated to USD 625 million. A negative ANS implies that Uganda’s total wealth is declining.
21 World Bank, 2007.
ENV/WKP(2008)4
50
The ENR sectors (fisheries, forestry, wetlands, and tourism and wildlife) are important for the Ugandan economy as they generate employment. The number of full-time equivalent jobs provided by the ENR sectors is estimated to be 3 761 00022, including both formal and informal employment within the sectors. Sustainable use of the ENR sectors implies a continued source of rural employment for the poor. Unsustainable use of the ENR will eliminate jobs from this sector.
Main steps
Getting started
Staff within the ministry of finance, planning and economic development (MFPED) considered that economic data on environment and natural resources were inadequate. This created a demand to shed light on the ENR sector by providing evidence estimating the economic impact. This happened at the same time as a new ENR Sector Working Group was established to address environmental issues for the PEAP revision. The analytical work process started with meetings between consultants, government and donors. The purpose of the study was both to create awareness for improved management of environment and natural resources as well as to provide recommendations for future action. Rather than trying to cover all possible ENR areas the study focused on those that were particularly important for achieving the PEAP objectives, on sectors where the ENR had the largest economic impact, and specifically on areas where data were available. The following ENR areas are described in the study: soil nutrient loss, fisheries, forestry, wetlands, tourism and wildlife. Following a request from the MFPED, the Department for International Development (DFID) funded the study.
Data collection and analysis
Access to reliable data was a constraint. The main sources were a combination of Ugandan research results both at local and national level. To deal with data gaps, approximate figures from pilot areas were scaled up to correspond to Uganda as a whole. Existing data was updated to current figures by using approximate values. Selections of the methods used are described below.
Land degradation
Land degradation reduces agricultural production, thus threatening growth of the Ugandan economy. The study team estimated the value of nutrient loss to be equivalent to 11% of GDP. Calculations were primarily based on a 2003 International Food Policy Research Institute (IFPRI) report. The report had examined nutrient losses (of nitrogen [N], potassium [P], and phosphorus [K]) in five districts of Uganda. The cost of replacing soil fertility loss with chemical fertilizers was estimated to be USD 153 per household. The figure was assumed to be representative for all of Uganda and was multiplied with the total number of agrarian households. The total cost was approximately USD 625 million, corresponding to the above mentioned 11% of GDP. However, it should be noted that these are upper limit figures. An older Ugandan study had estimated the cost to be in the range of 4-11% of GDP.
Wetlands
Wetlands play a vital role in the socio-economy of Uganda and a major role in providing livelihood for rural communities. Valuing wetlands is complex because of the difficulties in estimating 22 Please note that the figure 3,761 000 does not include employment in the agricultural sector. For reference,
the total labour force in Uganda is approximately 10 million people according to the 2002/2003 Ugandan National Household Survey.
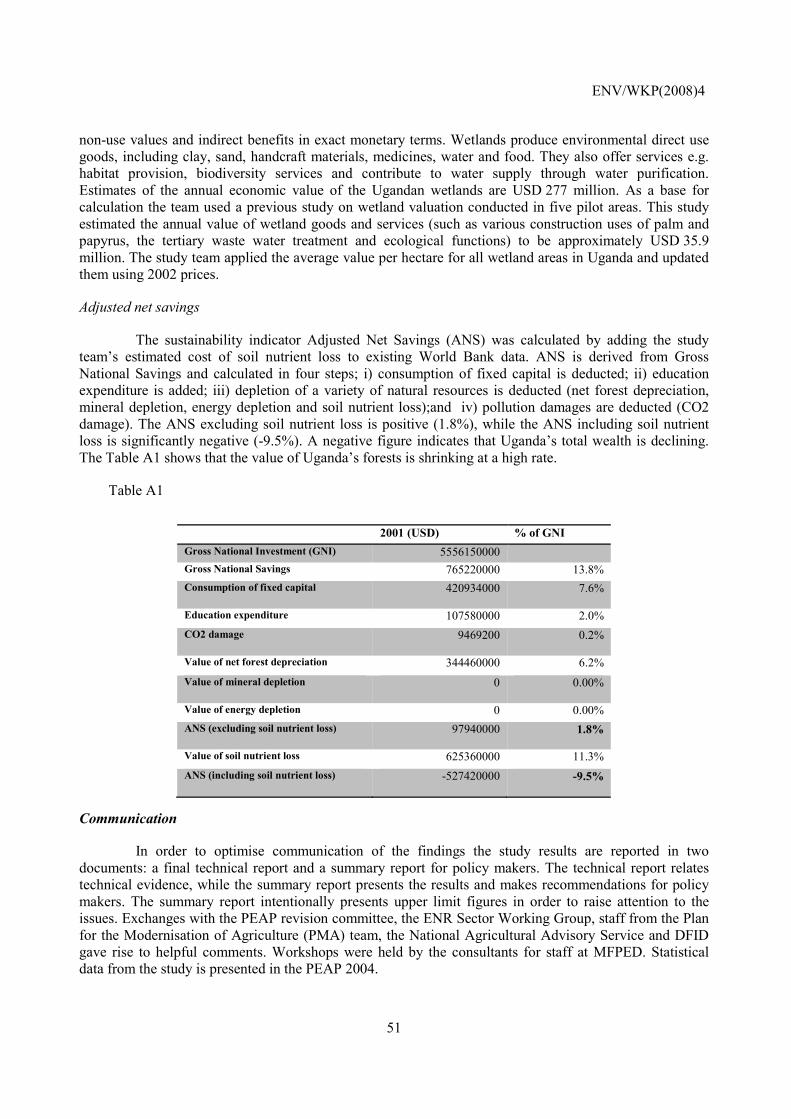
ENV/WKP(2008)4
51
non-use values and indirect benefits in exact monetary terms. Wetlands produce environmental direct use goods, including clay, sand, handcraft materials, medicines, water and food. They also offer services e.g. habitat provision, biodiversity services and contribute to water supply through water purification. Estimates of the annual economic value of the Ugandan wetlands are USD 277 million. As a base for calculation the team used a previous study on wetland valuation conducted in five pilot areas. This study estimated the annual value of wetland goods and services (such as various construction uses of palm and papyrus, the tertiary waste water treatment and ecological functions) to be approximately USD 35.9 million. The study team applied the average value per hectare for all wetland areas in Uganda and updated them using 2002 prices.
Adjusted net savings
The sustainability indicator Adjusted Net Savings (ANS) was calculated by adding the study team’s estimated cost of soil nutrient loss to existing World Bank data. ANS is derived from Gross National Savings and calculated in four steps; i) consumption of fixed capital is deducted; ii) education expenditure is added; iii) depletion of a variety of natural resources is deducted (net forest depreciation, mineral depletion, energy depletion and soil nutrient loss);and iv) pollution damages are deducted (CO2 damage). The ANS excluding soil nutrient loss is positive (1.8%), while the ANS including soil nutrient loss is significantly negative (-9.5%). A negative figure indicates that Uganda’s total wealth is declining. The Table A1 shows that the value of Uganda’s forests is shrinking at a high rate.
Table A1
Communication
In order to optimise communication of the findings the study results are reported in two documents: a final technical report and a summary report for policy makers. The technical report relates technical evidence, while the summary report presents the results and makes recommendations for policy makers. The summary report intentionally presents upper limit figures in order to raise attention to the issues. Exchanges with the PEAP revision committee, the ENR Sector Working Group, staff from the Plan for the Modernisation of Agriculture (PMA) team, the National Agricultural Advisory Service and DFID gave rise to helpful comments. Workshops were held by the consultants for staff at MFPED. Statistical data from the study is presented in the PEAP 2004.
2001 (USD) % of GNI Gross National Investment (GNI) 5556150000 Gross National Savings 765220000 13.8% Consumption of fixed capital 420934000 7.6%
Education expenditure 107580000 2.0% CO2 damage 9469200 0.2%
Value of net forest depreciation 344460000 6.2% Value of mineral depletion 0 0.00%
Value of energy depletion 0 0.00% ANS (excluding soil nutrient loss) 97940000 1.8%
Value of soil nutrient loss 625360000 11.3% ANS (including soil nutrient loss) -527420000 -9.5%
ENV/WKP(2008)4
52
SOURCES OF INFORMATION FOR CASE STUDIES
Akobirshoev, I. et al.(2007), “Making Pro-Poor Growth in Tajikistan Sustainable An Integrated Economic Analysis Approach”, Country Economic Report 2007:2, Sida.
Bouttavong, S. et al. (2002), “Lao PDR Biodiversity: Economic Assessment”, IUCN.
Emerton, L., Philavong, O. and Thanthaep, K. (2002), “Nam Et-Phou Loei National Biodiversity Conservation Area, Lao PDR: A Case Study of Economic and Development Linkages”, IUCN.
Emerton, L., (2005), Making the Economic Links Between Biodiversity and Poverty Reduction The Case of Lao PDR, IUCN — The World Conservation Union, Ecosystems and Livelihoods Group Asia, Colombo
Margulis, S. and Hughes, G. (2005), “An Economic Analysis of Natural Resources Sustainability in Mozambique”, The World Bank.
Background material for the economic analysis of natural resources sustainability in Mozambique (2005), “An Economic Analysis of Natural Resources in Mozambique: Rural Land Issues And Politics”
Seroa da Motta, R., (2004), “An Economic Evaluation of Forestry Regulation in Mozambique” (2005), “Mozambique Country Economic Memorandum: Background Paper on Mining”
Eide, A., (2004), “An Economic Analysis of Natural Resources Sustainability in Mozambique Fisheries” (2005), “Economic Analysis of Natural Resources in Mozambique: Water Resources”
World Bank (2007), “Republic of Peru Environmental Sustainability: A key to Poverty Reduction in Peru, Country Environmental Analysis”, Report No. 40190-PE, the World Bank.
World Bank (2005), “Mozambique Country Economic Memorandum Sustaining Growth and Reducing Poverty”, Report No. 32615-MZ, the World Bank.
Yaron, G. et al. (2004), “The role of environment and reducing poverty in Uganda Summary Report: Final”, GY Associates.
Yaron, G. et al. (2004), “The role of environment and reducing poverty in Uganda Technical Report: Final”, GY Associates.
ENV/WKP(2008)4
53
ANNEX B. GUIDE TO FURTHER READING
This report should stimulate increased and effective use of economic analysis in relation to key national planning processes. Numerous useful tools, handbooks and databases are available that can deepen understanding, provide data and concrete guidance on both technical and tactical issues. A modest selection follows which lists documents and websites judged to be of particular interest for those seeking practical advice or concrete data in this field.
Economic analysis Poverty Environment Initiative (2008) “Making the economic case – a primer for mainstreaming environment in national development planning”
This primer is expected to be of particular interest for readers of this report. The report is targeted at PEI country staff and provides a framework and practical guidance for generating economic arguments for increasing environmental investments and integration in development planning. The documents include an extensive list of websites that contain data and case studies on the economic contribution of the environment to pro-poor economic growth.
Poverty-Environment Partnership (2005), Investing in Environmental Wealth for Poverty Reduction
The report documents and evaluates the economic evidence surrounding investment in environmental assets as a strategy for fighting poverty. The report surveys the current state of knowledge on several key environmental dimensions of poverty, including the direct and indirect dependence of the poor on natural resources and the vulnerability of the poor to environmental risk. It evaluates the total cost of environmental interventions and investments needed to reach the MDGs, the economic benefits and rates of return to environmental investments, and major reforms needed to create policy and governance context that will be conducive to cost-effective investments.
OECD (2006), Cost-Benefit Analysis and the Environment: Recent Developments, with David Pearce, Giles Atkinson and Susana Mourato.
This report has a particular focus on cost-benefit analysis (as the key rationale for decision making in environmental policy), environmental monetary valuation and valuation techniques. It provides useful input to the discussion on environmentally effective and economically efficient environmental policies and sustainable development.
OECD (2002), Handbook of Biodiversity Valuation: A Guide for Policy Makers.
A handbook for policy makers focusing on the nature of values associated with biological diversity and the methodological approaches that can be adopted to assign values for policy purposes. It guides the reader through the major methodologies that are available, illustrated by examples, and gives an excellent overview of the subject.
ENV/WKP(2008)4
54
World Bank (2005), Estimating the Cost of Environmental Degradation:-A Training Manual in English, French and Arabic by Katherine Bolt, Giovanni Ruta, Maria Sarraf.
A comprehensive guide for project task managers, policy makers and NGO officials dealing with environmental management issues. The guide addresses and provides answers to the questions: i) When is a valuation technique a useful tool for decision-making? ii) What is the theoretical basis of economic valuation? iii) What are the technical and human resources needed to engage in a valuation process? iv) How is valuation used in practice?
OECD (2008), Costs of Inaction on Environmental Policy Challenges: Summary Report
This informative report summarises available information about the “costs of inaction” on key environmental challenges with concrete examples on air and water pollution, climate change and natural resources management in OECD countries.
Tactics, research and public policy making Overseas Development Institute (2005), Successful Communication: A Toolkit for Researchers and Civil Society Organisations by Ingie Hovland. Overseas Development Institute (2004), Tools for Policy Impact: A Handbook for Researchers by Daniel Start and Ingie Hovland. The two handbooks look at critical aspects of communication and specific tools for policy impact and builds on experience from a research programme (RAPID) looking at links between research and policy-making, largely in developing countries. Even though these two handbooks are intended for researchers they provide useful reading for policy makers. The website provides several additional reports of interest: http://www.odi.org.uk/RAPID/Index.html
Global Development Network, Bridging Research and Policy. The Global Development Network (GDN) is a worldwide network of research and policy institutes working to generate research at the local level in developing and transition countries. See www.gdnet.org/middle.php?oid=176
OECD (2008b), Natural Resources and Pro-poor Growth: The economics and politics of natural resource use in developing countries. This publication demonstrates that natural resources can contribute to growth, employment, exports and fiscal revenues. It highlights the importance of policies encouraging the sustainable management of these resources, and emphasises the need to address the political challenges of natural resource management for long-term pro-poor economic growth. It is divided into two parts: Part I describes the unique features of natural resources and resulting management challenges and provides an overview of the economics and politics of natural resources. It then offers recommendations for policy makers on how to support the approaches advocated in the paper. Part II examines these issues with respect to seven specific natural resource sectors: fisheries, forests, wildlife and ecotourism, soil productivity, water security, minerals and renewable energy.
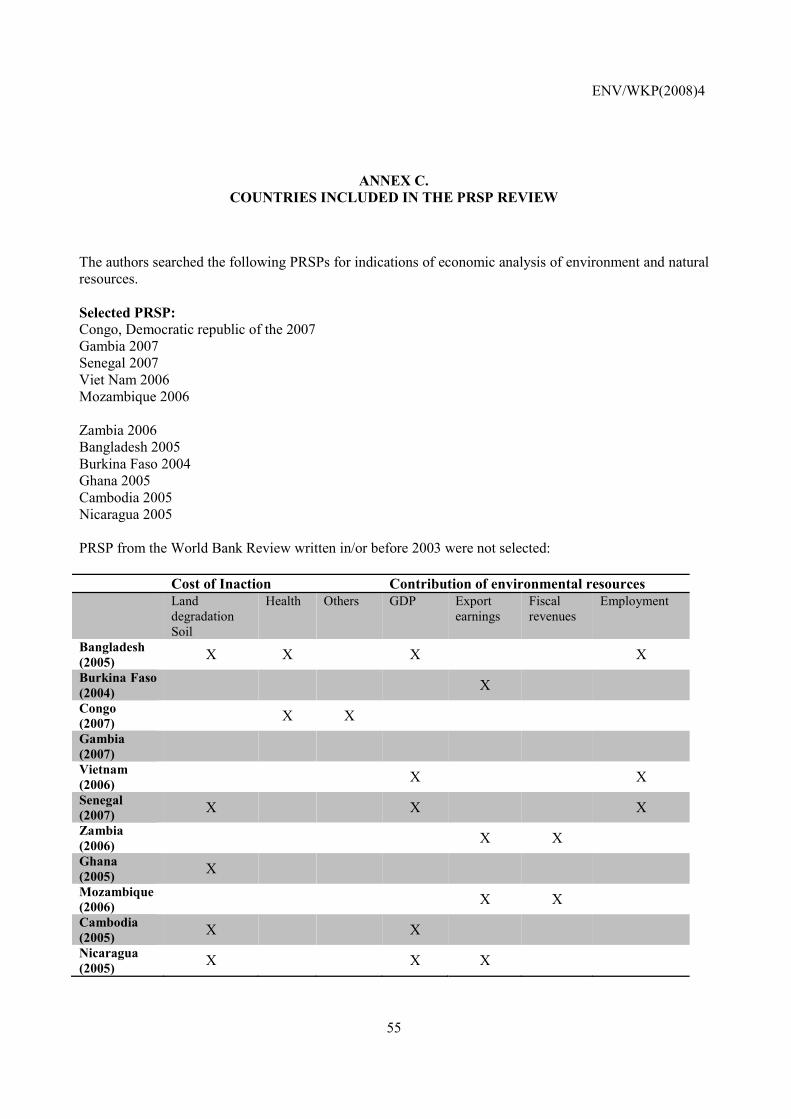
ENV/WKP(2008)4
55
ANNEX C. COUNTRIES INCLUDED IN THE PRSP REVIEW
The authors searched the following PRSPs for indications of economic analysis of environment and natural resources. Selected PRSP: Congo, Democratic republic of the 2007 Gambia 2007 Senegal 2007 Viet Nam 2006 Mozambique 2006 Zambia 2006 Bangladesh 2005 Burkina Faso 2004 Ghana 2005 Cambodia 2005 Nicaragua 2005 PRSP from the World Bank Review written in/or before 2003 were not selected:
Cost of Inaction Contribution of environmental resources Land
degradation Soil
Health Others GDP Export earnings
Fiscal revenues
Employment
Bangladesh (2005) X X X X Burkina Faso (2004) X Congo (2007) X X Gambia (2007) Vietnam (2006) X X Senegal (2007) X X X Zambia (2006) X X Ghana (2005) X Mozambique (2006) X X Cambodia (2005) X X Nicaragua (2005) X X X
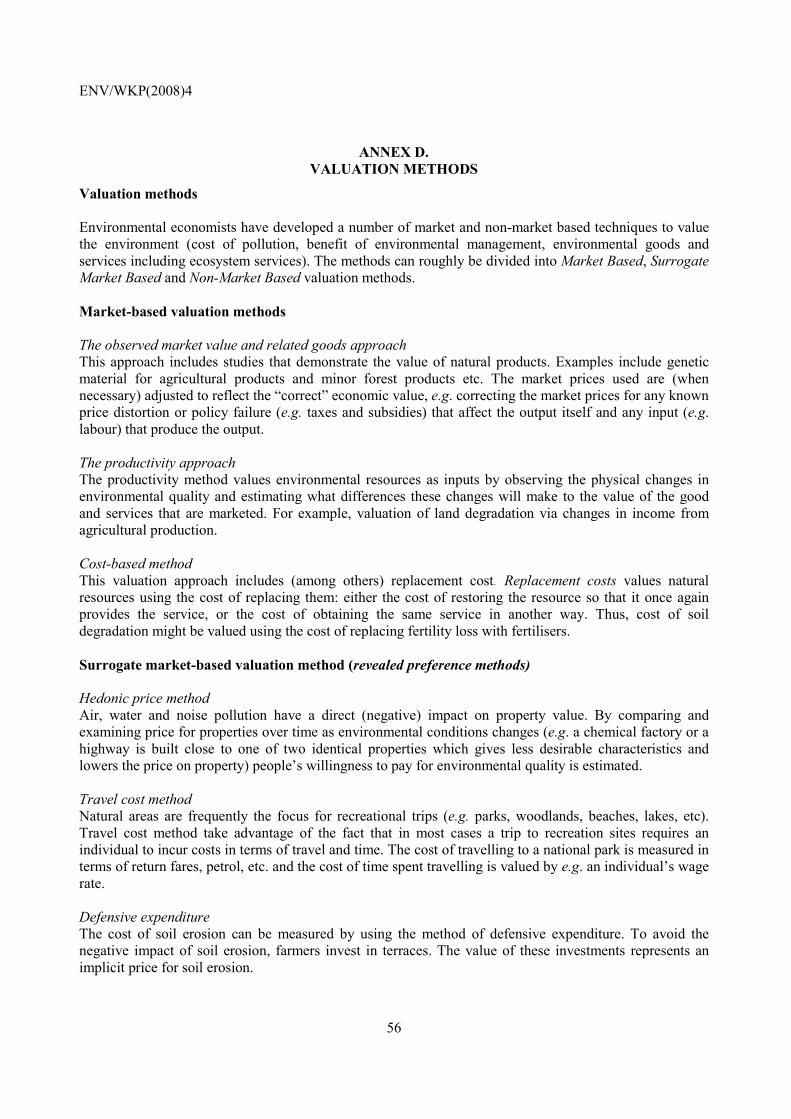
ENV/WKP(2008)4
56
ANNEX D.
VALUATION METHODS
Valuation methods Environmental economists have developed a number of market and non-market based techniques to value the environment (cost of pollution, benefit of environmental management, environmental goods and services including ecosystem services). The methods can roughly be divided into Market Based, Surrogate Market Based and Non-Market Based valuation methods. Market-based valuation methods The observed market value and related goods approach This approach includes studies that demonstrate the value of natural products. Examples include genetic material for agricultural products and minor forest products etc. The market prices used are (when necessary) adjusted to reflect the “correct” economic value, e.g. correcting the market prices for any known price distortion or policy failure (e.g. taxes and subsidies) that affect the output itself and any input (e.g. labour) that produce the output. The productivity approach The productivity method values environmental resources as inputs by observing the physical changes in environmental quality and estimating what differences these changes will make to the value of the good and services that are marketed. For example, valuation of land degradation via changes in income from agricultural production. Cost-based method This valuation approach includes (among others) replacement cost. Replacement costs values natural resources using the cost of replacing them: either the cost of restoring the resource so that it once again provides the service, or the cost of obtaining the same service in another way. Thus, cost of soil degradation might be valued using the cost of replacing fertility loss with fertilisers. Surrogate market-based valuation method (revealed preference methods) Hedonic price method Air, water and noise pollution have a direct (negative) impact on property value. By comparing and examining price for properties over time as environmental conditions changes (e.g. a chemical factory or a highway is built close to one of two identical properties which gives less desirable characteristics and lowers the price on property) people’s willingness to pay for environmental quality is estimated. Travel cost method Natural areas are frequently the focus for recreational trips (e.g. parks, woodlands, beaches, lakes, etc). Travel cost method take advantage of the fact that in most cases a trip to recreation sites requires an individual to incur costs in terms of travel and time. The cost of travelling to a national park is measured in terms of return fares, petrol, etc. and the cost of time spent travelling is valued by e.g. an individual’s wage rate. Defensive expenditure The cost of soil erosion can be measured by using the method of defensive expenditure. To avoid the negative impact of soil erosion, farmers invest in terraces. The value of these investments represents an implicit price for soil erosion.
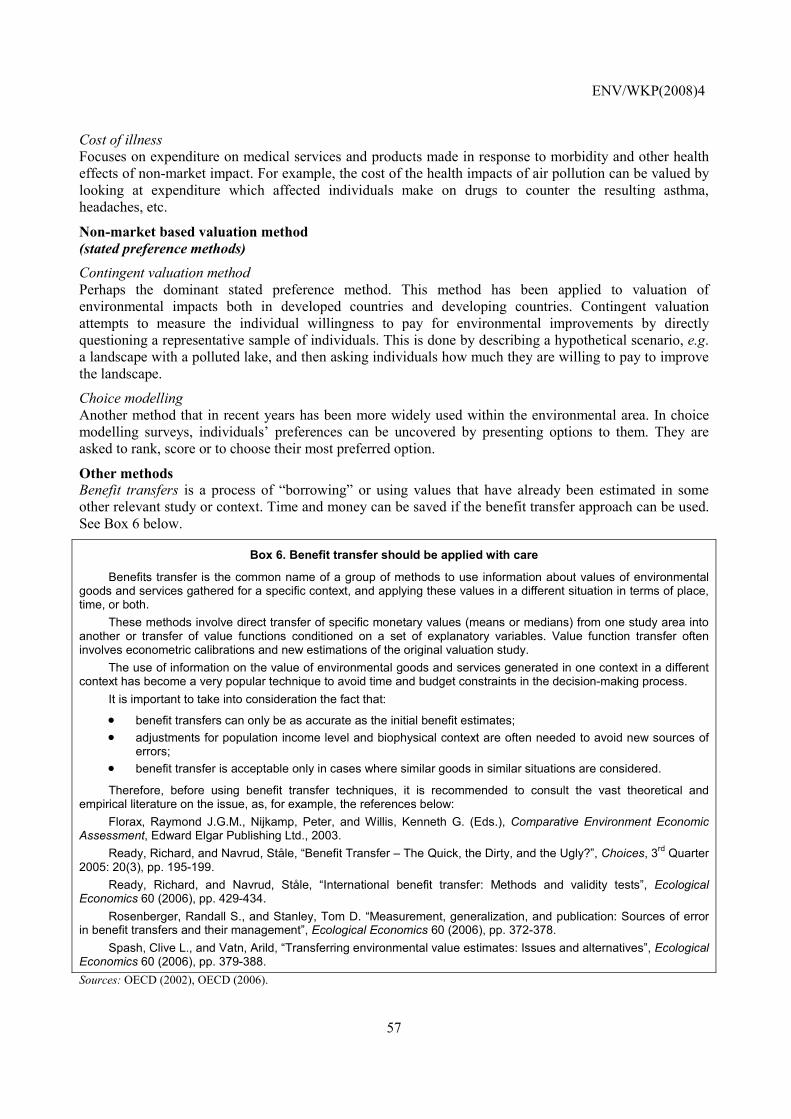
ENV/WKP(2008)4
57
Cost of illness Focuses on expenditure on medical services and products made in response to morbidity and other health effects of non-market impact. For example, the cost of the health impacts of air pollution can be valued by looking at expenditure which affected individuals make on drugs to counter the resulting asthma, headaches, etc.
Non-market based valuation method (stated preference methods)
Contingent valuation method Perhaps the dominant stated preference method. This method has been applied to valuation of environmental impacts both in developed countries and developing countries. Contingent valuation attempts to measure the individual willingness to pay for environmental improvements by directly questioning a representative sample of individuals. This is done by describing a hypothetical scenario, e.g. a landscape with a polluted lake, and then asking individuals how much they are willing to pay to improve the landscape.
Choice modelling Another method that in recent years has been more widely used within the environmental area. In choice modelling surveys, individuals’ preferences can be uncovered by presenting options to them. They are asked to rank, score or to choose their most preferred option.
Other methods Benefit transfers is a process of “borrowing” or using values that have already been estimated in some other relevant study or context. Time and money can be saved if the benefit transfer approach can be used. See Box 6 below.
Box 6. Benefit transfer should be applied with care
Benefits transfer is the common name of a group of methods to use information about values of environmental goods and services gathered for a specific context, and applying these values in a different situation in terms of place, time, or both.
These methods involve direct transfer of specific monetary values (means or medians) from one study area into another or transfer of value functions conditioned on a set of explanatory variables. Value function transfer often involves econometric calibrations and new estimations of the original valuation study.
The use of information on the value of environmental goods and services generated in one context in a different context has become a very popular technique to avoid time and budget constraints in the decision-making process.
It is important to take into consideration the fact that:
• benefit transfers can only be as accurate as the initial benefit estimates; • adjustments for population income level and biophysical context are often needed to avoid new sources of
errors; • benefit transfer is acceptable only in cases where similar goods in similar situations are considered.
Therefore, before using benefit transfer techniques, it is recommended to consult the vast theoretical and empirical literature on the issue, as, for example, the references below:
Florax, Raymond J.G.M., Nijkamp, Peter, and Willis, Kenneth G. (Eds.), Comparative Environment Economic Assessment, Edward Elgar Publishing Ltd., 2003.
Ready, Richard, and Navrud, Ståle, “Benefit Transfer – The Quick, the Dirty, and the Ugly?”, Choices, 3rd Quarter 2005: 20(3), pp. 195-199.
Ready, Richard, and Navrud, Ståle, “International benefit transfer: Methods and validity tests”, Ecological Economics 60 (2006), pp. 429-434.
Rosenberger, Randall S., and Stanley, Tom D. “Measurement, generalization, and publication: Sources of error in benefit transfers and their management”, Ecological Economics 60 (2006), pp. 372-378.
Spash, Clive L., and Vatn, Arild, “Transferring environmental value estimates: Issues and alternatives”, Ecological Economics 60 (2006), pp. 379-388. Sources: OECD (2002), OECD (2006).