Embed Size (px)
Citation preview
Greenhouse Gas Mitigation in the Power
Sector: Case Studies From India
ESM237
4= S F! 1i i xS s '' .. X . 9 ,'S
C f _ e ie:; -,
Energy
Sector
Management
Assistance
Programme
Clk A in Report 237/01
February 2001
Pub
lic D
iscl
osur
e A
utho
rized
Pub
lic D
iscl
osur
e A
utho
rized
Pub
lic D
iscl
osur
e A
utho
rized
Pub
lic D
iscl
osur
e A
utho
rized
JOINT UNDP t WORLD BANKENERGY SECTOR MANAGEMENT ASSISTANCE PROGRAMME (ESMAP)
PURPOSE
The Joint UNDP/World Bank Energy Sector Management Assistance Programme(ESMAP) is a special global technical assistance program run as part of the World Bank'sEnergy, Mining and Telecommunications Department. ESMAP provides advice togovernments on sustainable energy development. Established with the support of UNDPand bilateral official donors in 1983, it focuses on the role of energy in the developmentprocess with the objective of contributing to poverty alleviation, improving living conditionsand preserving the environment in developing countries and transition economies.ESMAP centers its interventions on three priority areas: sector reform and restructuring;access to modern energy for the poorest; and promotion of sustainable energy practices.
GOVERNANCE AND OPERATIONS
ESMAP is governed by a Consultative Group (ESMAP CG) composed of representativesof the UNDP and World Bank, other donors, and development experts from regionsbenefiting from ESMAP's assistance. The ESMAP CG is chaired by a World Bank VicePresident, and advised by a Technical Advisory Group (TAG) of four independent energyexperts that reviews the Programme's strategic agenda, its work plan, and itsachievements. ESMAP relies on a cadre of engineers, energy.planners, and economistsfrom the World Bank to conduct its activities under the guidance of the Manager ofESMAP, responsible for administering the Programme.
FUNDING
ESMAP is a cooperative effort supported over the years by the World Bank, the UNDPand other United Nations agencies, the European Union, the Organization of AmericanStates (OAS), the Latin American Energy Organization (OLADE), and public and privatedonors from countries including Australia, Belgium, Canada, Denmark, Germany, Finland,France, Iceland, Ireland, Italy, Japan, the Netherlands, New Zealand, Norway, Portugal,Sweden, Switzerland, the United Kingdom, and the United States of America.
FURTHER INFORMATION
An up-to-date listing of completed ESMAP projects is appended to this report. For furtherinformation, a copy of the ESMAP Annual Report, or copies of project reports, contact:
ESMAPc/o Energy and Water
The World Bank1818 H Street, NW
Washington, DC 20433U.S.A.
Greenhouse Gas Mitigation in thePower Sector:
Case Studies From India
February 2001
Joint UNDP/World Bank Energy Sector Management Assistance Programme(ESMAP)
Copyright C 1999The International Bank for Reconstructionand Development/THE WORLD BANK1818 H Street, N.W.Washington, D.C. 20433, U.S.A.
All rights reservedManufactured in the United States of AmericaFirst printing February 2001
ESMAP Reports are published to conmunicate the results of theESMAP's work to the development community with the least possibledelay. The typescript of the paper therefore has not been prepared inaccordance with the procedures appropriate to formal documents.Some sources cited in this paper may be informal documents that arenot readily available.
The findings, interpretations, and conclusions expressed in thispaper are entirely those of the author(s) and should not be attributed inany manner to the World Bank, or its affiliated organizations, or tomembers of its Board of Executive Directors or the countries theyrepresent. The World Bank does not guarantee the accuracy of the dataincluded in this publication and accepts no responsibility whatsoeverfor any consequence of their use. The Boundaries, colors,denominations, other information shown on any map in this volume donot imply on the part of the World Bank Group any judgement on thelegal status of any territory or the endorsement or acceptance of suchboundaries.
The mnaterial in this publication is copyrighted. Requests forpennission to reproduce portions of it should be sent to the ESMAPManager at the address shown in the copyright notice above. ESMAPencourages dissemination of its work and will normally givepermission promptly and, when the reproduction is for noncommnercialpurposes, without asking a fee.
ContentsContents .............. iii
Units of Measurement .................. v
A. Introduction ................ 1
Genesis of the Work .............. 1Basic Information on the Case Study States . ................................................................. 2
(i) Bihar .................................................................. 2(ii) Andhra Pradesh .................................................................. 2
B. The Concept and Scope of a Global Overlay ......................................................................2
Concept ................................................................. 2Scope ................................................................. 3
C. Methodology ..................................................................... 3
Overview ................................................................. 3Load Forecasts .................................................................. 4
(i) Bihar .................................................................. 4(ii) Andhra Pradesh .................................................................. 5(i) Business as Usual (BA U) Scenario ................................. 7................................7(ii) Reform Scenario .................................................................. 7a. Bihar .................................................................. 8b. Andhra Pradesh .................................................................. 9(iii) Greenhouse Gas (GHG) Mitigation Scenario .............................................................9a. Bihar ................................................................. 10b. Andhra Pradesh ................................................................. 12
Modeling the Power Systems ................................................................. 14(i) The Load Module ................................................................. 15(ii) The Production Cost Module ................................................................. 15(iii) The Report Module ................................................................. 17
D. Results ..................................................................... 17
GHG Emissions Under Bau and Reform ................................................................. 17Incremental Impact of Individual GHG Reduction Options: GHG Mitigation Option SupplyCurves ............................................................... 18Incremental Impact of Combinations of GHG Reduction Options: GHG Mitigation Scenarios.................................................................................................................................................. .21
E. Conclusions ..................................................................... 24
Annexes
Annex 1: Load Forecasts ..................................................................... 29
Annex 2: Supply-Side Options ..................................................................... 31
Annex 3: Demand-Side Options ...................................................................... 37
Annex 4: Local Emissions ..................................................................... 39
iii
Tables
Table 1: Price and Income Elasticities by Sector in Bihar under BAU and Reform .....................4Table 2: BAU and Reform: Forecasts of Energy (GWh) and Maximum Demand
(MW) for Bihar, 1997-2015 ................................................................ 5Table 3: BAU and Reform: Price and Income Elasticities for AP by Sector .............. .................6Table 4: BAU and Reform: Forecasts of Energy (GWh) and Maximum Demand
(MW) for AP, 1998-2018 ............................................................... 6Table 5: Estimated Characteristics and Outcome of DSM Program in Bihar
under Reform, 2000-2015 ................. ............................................... 9Table 6: Salient Characteristics and Outcome of DSM Program for High-Efficiency
Refrigerators in Bihar under GHG Mitigation Scenario,1997-2015 ............................................................... 11
Table 7: Salient Characteristics and Outcome of DSM Program for Urban Lightingin Bihar under GHG Mitigation Scenario, 1997-2015 ................... ...................... 12
Table 8: Main Features of DSM Lighting Program in AP under GHG MitigationScenario, 1999-2015 ............................................................... 13
Table 9: Main Features of Integrated Agricultural DSM Project for AP under GHGMitigation Scenario, 1999-2015 ............................................................... 14
Table 10: Carbon Emissions Factors for Liquid Fuels ......................................................... 16Table 11: Methane Emissions from Coal Mining Activities ............................................... 16Table 12: GHG Emissions and LOLP under BAU and Reform: AP and Bihar .............. 18Table 13: GHG Mitigation Scenarios for Bihar ............................................................... 20
Figures
Figure 1: Bihar - GHG Mitigation Option Supply Curve - Individual Options(Group A) ............................................................... 18
Figure 2: Bihar - GHG Mitigation Option Supply Curve - Individual Options(Group B) ............................................................... 19
Figure 3: Andhra Pradesh - GHG Mitigation Option Supply Curve - IndividualOptions ............................................................... 21
Figure 4: Bihar - GHG Mitigation Option Supply Curve - Combination ScenariosGroup A ............................................................... 22
Figure 5: Bihar - GHG Mitigation Option Supply Curve - Combination ScenariosGroup B ............................................................... 23
Figure 6: AP - GHG Mitigation Option Supply Curve - Combination Scenarios ................. 24
iv
Units of Measurement
At the time the work was conducted, the exchange rate between the US$ and Indian Rupees(Rs.) was:
US$1=Rs. 43
In India, it is common to express numbers in terms of crores and lakhs, where:
1 crore = IO million (107)
1 lakh= 100,000 (105)
v

Greenhouse Gas Mitigation In The Power Sector:Case Studies From India
A. Introduction
Genesis of the Work
Case studies were completed for two states in India in 1998, as part of an activity onIndia: Environmental Issues in The Power Sector (EIPS). The activity was undertaken bythe World Bank, on behalf of the Government of India (Gol), through the Ministry ofPower (MoP). Liaison with MoP on day-to-day matters was facilitated by MoP's EnergyManagement Centre (EMC). The activity was supported by funding from the UKDepartment for Intemational Development (DFID), through the Joint World Bank/UNDPEnergy Management Assistance Programme (ESMAP), and by the World Bank's SouthAsia Region. A final report was issued as ESMAP Report No. 205/98 in June 1998.
The Administrative Staff College of India (ASCI) and the Sone Command AreaDevelopment Agency (SCADA), with the assistance of Metallurgical & EngineeringConsultants (India) Ltd. (MECON), carried out the case studies in Andhra Pradesh (AP)and Bihar, respectively. The case studies identified the enviromnental impacts ofalternative options for the development of the power sector in those states. In particular,they estimated the atmospheric emissions of particulate matter (PM) and oxides ofsulphur and nitrogen (SO2 and NO,, respectively), as well as the production of ash and thepreemption of land. But the case studies gave only limited attention to greenhouse gas(GHG) emissions and global warming issues, by tracking CO2 and including somepreliminary analysis of the possible effects of a carbon tax. A detailed discussion of themethodology used in the case studies, including a description of the set of analytical toolsand the decisionmaking process that were developed for the case studies under EIPS, waspublished in India: Environmental Issues in The Power Sector, Manual forEnvironmental Decision Making, ESMAP Report No. 2 13/99 in June 1999.
The present study extends the previous work through applying a global overlay, i.e., by (i)including GHG emission impacts; (ii) including GHG mitigation analysis; and (iii)estimating the incremental costs of GHG reduction. The global overlay was conducted inaccordance with the World Bank's Guidelines for Climate Change Global Overlays(Environment Department Paper No. 047, Climate Change Series, February 1997). It wasfunded by the World Bank's Global Overlay Programme, with help from Denmark,Norway, ESMAP, and the World Bank's South Asia Region. The AP case study wasagain conducted by ASCI, while MECON had the responsibility for Bihar. The twoconsulting teams worked under common terns of reference that were provided by theWorld Bank. However, the teams were given discretion in developing their methodologyfor the case studies, wherever the differences in approach did not compromise the
I
2 Greenhouse Gas Mitigation in the Power Sector: Case Studies from India
comparability of the results. The task managers were Robin Bates (EIFEG) and MudassarImran (SASEG), who also prepared this synthesis report.
Basic Information on the Case Study States
AP and Bihar were chosen as case studies for EIPS because they offered a good cross-section of the issues and options related to the environmental impacts of powergeneration in India.
(i) Bihar
Bihar is one of the poorest states in India, and the Bihar State Electricity Board (BSEB) isin a particularly precarious financial and technical condition. It experiences heavyfinancial losses and requires burdensome state subsidies; its thermal plants are old andpoorly maintained; and transmission and distribution (T&D) losses, estimated at nearly40%, are high. About 50% of electricity sales are to heavy industry; 21% to agriculture;and 11% to domestic consumers. The power sector depends heavily on coal, with morethan 90% of power generation coming from that fuel. The state is also comparativelyremote from alternative domestic sources of energy, although it is reasonably well placedto import energy from Bangladesh and Nepal in the longer term and it has significantbiomass potential.
(ii) Andhra Pradesh
In contrast to Bihar, AP has a wider range of supply options for its power sector: apartfrom coal (54%), they include hydropower (43%) and small amounts of nuclear (from thecentral sector), wind, and solar energy. Furthermore, its long coastline and good portsoffer better possibilities for importing fuels, including LNG and coal. Agricultureaccounts for some 45% of electricity sales; industry 36%; and domestic consumers 15%.The financial, technical, and operational performance of the AP State Electricity Board(APSEB) has been better than that of BSEB, although (as in Bihar) T&D losses(estimated at 32%) are still high.
B. The Concept and Scope of a Global Overlay
Concept
The World Bank routinely carries out energy sector work in its client countries, often inassociation with restructuring efforts. Such sector work analyzes the implications ofpursuing existing policies under a business-as-usual (BAU) scenario as well as changesthat are associated with energy sector reform and restructuring. These analyses will covereconomic, financial, and technical issues, but not necessarily environmental impacts. Theobjective of a global overlay is to add to these analyses-or "overlay" them with-asystematic process for assessing the GHG implications of BAU and reform; and to design
Greenhouse Gas Mitigation in the Power Sector: Case Studies from India 3
and cost a new scenario, known as the GHG Mitigation Scenario, to reduce GHGemissions.
Scope
Usually a global overlay covers the energy sector for an entire country. It calculates GHGemissions for the production, transmission, distribution, and consumption of bothimported and indigenous fuels, i.e., the related emissions are calculated wherever theyoccur in the world; and its scope is limited to carbon dioxide (CO2 ), methane (CH4), andnitrous oxide (N2 0). In this work, only two states within India were covered, although itshould be noted that the population in each state is greater than that of many entirecountries: the population of Bihar is about 100 million, and that of AP about 70 million.The work also limited its scope to the power sector in AP and Bihar, although it tracedback down the entire fuel chain to calculate GHG emissions caused by the production,transmission, and distribution of all fuels used by the power sector, both in India andoverseas. However, it did estimate the contribution of the power sector to total GHGemissions in each state. In Bihar, it was found that the power sector contributed 4.9million metric tons (Mt) of carbon equivalent in 1995-96 out of a total of 16.6 Mt, i.e.,30%. Most of the carbon emitted from the power sector (4.7 Mt) came from coal burning.In AP, for the base year 1996-97, the total emissions of carbon equivalent were estimatedat 18.4 Mt, to which the power sector contributed 9.2 Mt or 50% of the total.
C. Methodology
Overview
The implementation of the global overlays required load forecasts and powerdevelopment plans (investment program and operating regime) for both the BAU and theReform scenarios. The GHG emissions associated with those load forecasts and powerdevelopment plans were then estimated. Next, a set of GHG mitigation options wasidentified and appropriate GHG mitigation scenarios formulated. The difference betweenGHG emissions and total power system costs under the BAU, Reform, and GHGMitigation scenarios were compared; and the end result was an estimate of theincremental cost of GHG reduction. In general, that result is important for the WorldBank's clients, because it could form the basis for (i) financing from the World Bank andthe Global Environment Facility (GEF); (ii) the creation of opportunities under jointimplementation or carbon trading arrangements; and (iii) the clearer identification of the"win-win" opportunities presented by energy pricing and energy sector reform. It isemphasized that no attempt was made to link the Reform scenario with any particularinstitutional or managerial model in either AP or Bihar, nor to patterns of ownership.Rather, the global overlays proceeded on the basis of reasonable assumptions andjudgements about the likely economic and technical consequences of reform, in terms ofthe growth rate of the economy, electricity tariffs, and the efficiency of the power system.
4 Greenhouse Gas Mitigation in the Power Sector: Case Studies from India
Load Forecasts
The two case studies projected the unconstrained energy (GWh) and power (MW)demand over a 20-year planning horizon for the BAU and Reform scenarios, brokendown by the main consumer categories, viz.:
* Domestic* Commercial* Low tension (LT) and high tension (HT) industry and* Agriculture.
Econometric modeling, combined with judgements based on experience in othercountries, was used to estimate the income and price elasticities for each consumercategory. Given specific assumptions and projections about income growth and likelytariff changes for each consumer category, it was possible to forecast sales of energy andmaximum demand.
(i) Bihar
In the case of Bihar, BAU load forecasts were made for both low-growth and high-growthassumptions about Gross State Domestic Product (GSDP), maintaining the existingsectoral shares constant over the planning period. The projected GSDP growth rates are inAnnex I.1. As far as electricity prices are concerned, it was anticipated that tariffincreases would be modest and confined to the residential and agricultural sectors, wheretariffs are currently set well below costs. The assumptions are in Annex I.2. The sectoralincome and price elasticities are those derived for EIPS (India: Environmental Issues inThe Power Sector, ESMAP Report No. 205/98, June 1998, Table 2:14), Teproduced inTable 1.
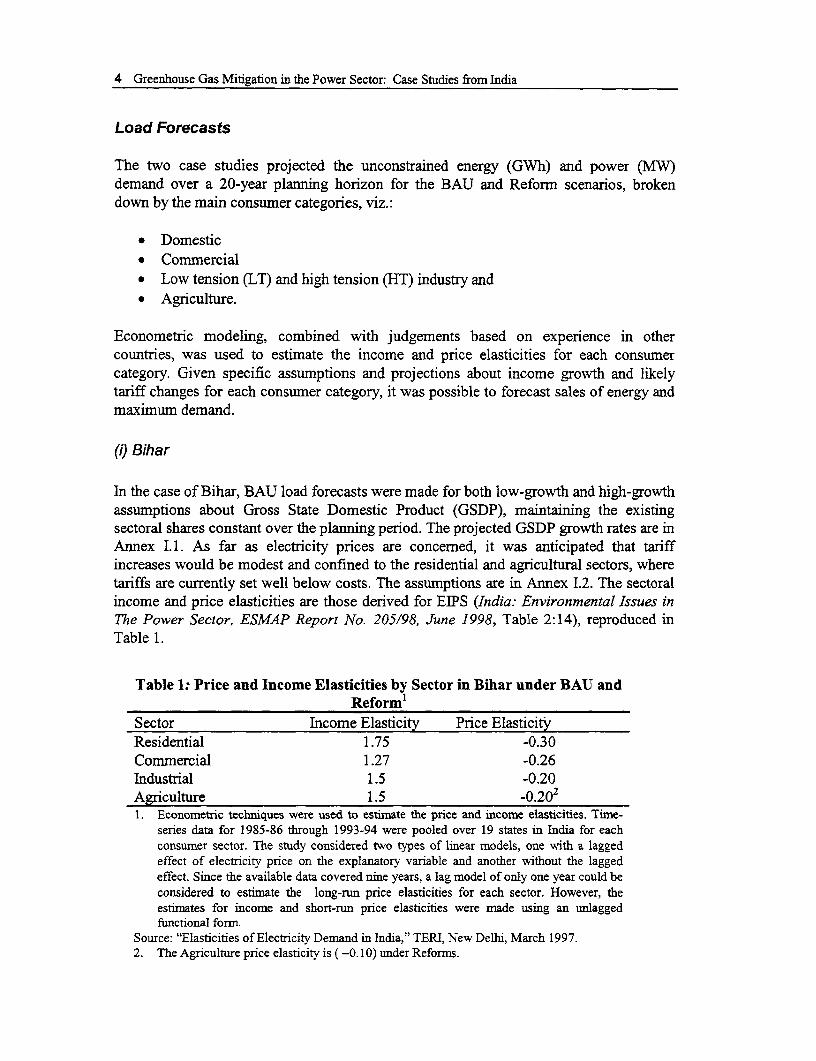
Table 1: Price and Income Elasticities by Sector in Bihar under BAU andReform1
Sector Income Elasticity Price ElasticityResidential 1.75 -0.30Commercial 1.27 -0.26Industrial 1.5 -0.20Agriculture 1.5 -O.2021. Econometric techniques were used to estimate the price and income elasticities. Time-
series data for 1985-86 through 1993-94 were pooled over 19 states in India for eachconsumer sector. The study considered two types of linear models, one with a laggedeffect of electricity price on the explanatory variable and another without the laggedeffect. Since the available data covered nine years, a lag model of only one year could beconsidered to estimate the long-run price elasticities for each sector. However, theestimates for income and short-run price elasticities were made using an unlaggedfunctional form.
Source: "Elasticities of Electricity Demand in India," TERI, New Delhi, March 1997.2. The Agriculture price elasticity is (-0.10) under Reforms.
Greenhouse Gas Mitigation in the Power Sector: Case Studies from India 5
For the purposes of the global overlay, in approaching the Reform scenario, it wasassumed that power sector reform would start in Bihar in the year 2000 and be completedover a seven-year period. It can be expected that reform would induce faster growth ratesfor GSDP, under both low-growth and high-growth assumptions, as depicted in AnnexI.3. Furthermore, under reform, it should be possible to increase the tariff level, to allowthe utility to eam an acceptable return on equity (taken as 16%). However, bearing inmind the experience so far in reforming states such as AP and Haryana, it was assumedthat there would be constraints on adjusting the tariff structure. In particular, agriculturaltariff increases are limited, going from the existing level of Rs. 0.15/kWh to Rs.1.50/kWh from 2003 to 2006 and reaching only about 50% of the supply cost by 2007.Accordingly, the tariffs of other sectors were adjusted so as to achieve a 16% return onequity, as shown in Annex I.4.
Finally, the sectoral income and price elasticities are kept the same under Reform as inthe BAU scenario, except for agriculture, which is reduced to reflect the expectation thatan integrated agricultural demand-side management (DSM) program would already havebeen implemented as part of the reform package (see Table 1). This program wouldinclude the metering of agricultural pumpsets and a variety of technical measures-seethe discussion of Power Development Plans, Section (ii)a below.
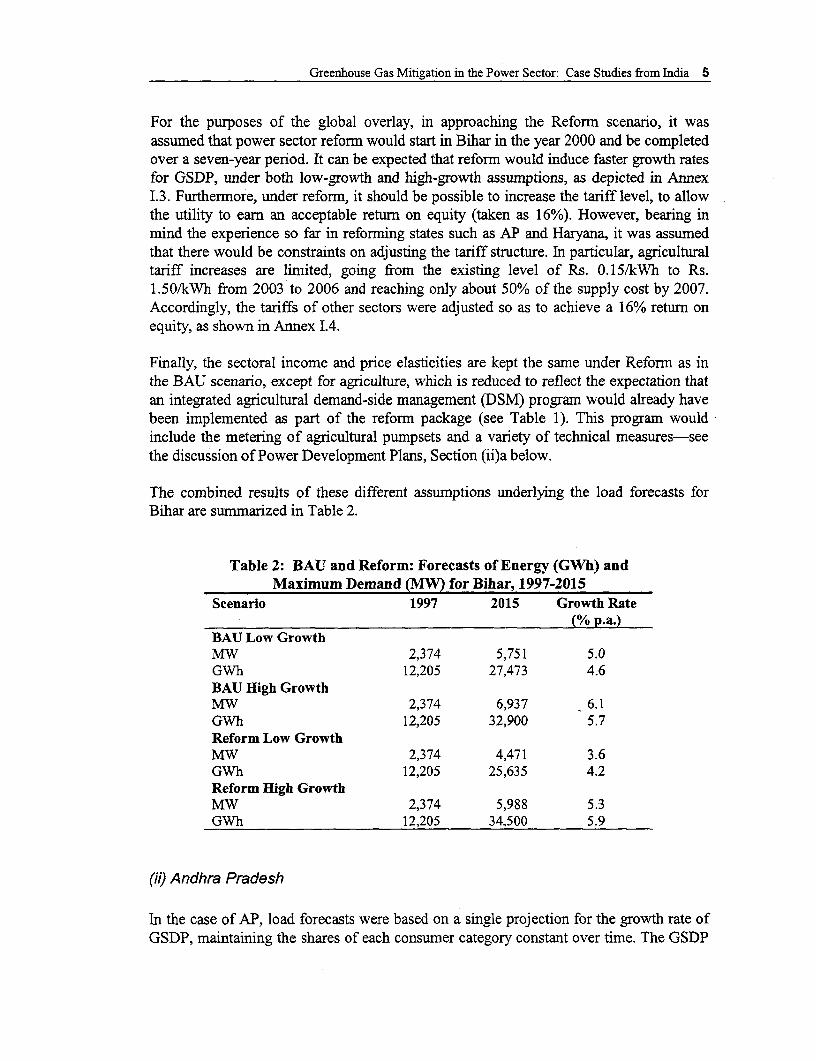
The combined results of these different assumptions underlying the load forecasts forBihar are summarized in Table 2.
Table 2: BAU and Reform: Forecasts of Energy (GWh) andMaximum Demand (MW) for Bihar, 1997-2015
Scenario 1997 2015 Growth Rate(% p.a.)
BAU Low GrowthMW 2,374 5,751 5.0GWh 12,205 27,473 4.6BAU EHigh GrowthMW 2,374 6,937 6.1GWh 12,205 32,900 5.7Reform Low GrowthMW 2,374 4,471 3.6GWh 12,205 25,635 4.2Reform High GrowthMW 2,374 5,988 5.3GWh 12,205 34,500 5.9
(ii) Andhra Pradesh
In the case of AP, load forecasts were based on a single projection for the growth rate ofGSDP, maintaining the shares of each consumer category constant over time. The GSDP
6 Greenhouse Gas Mitigation in the Power Sector: Case Studies from India
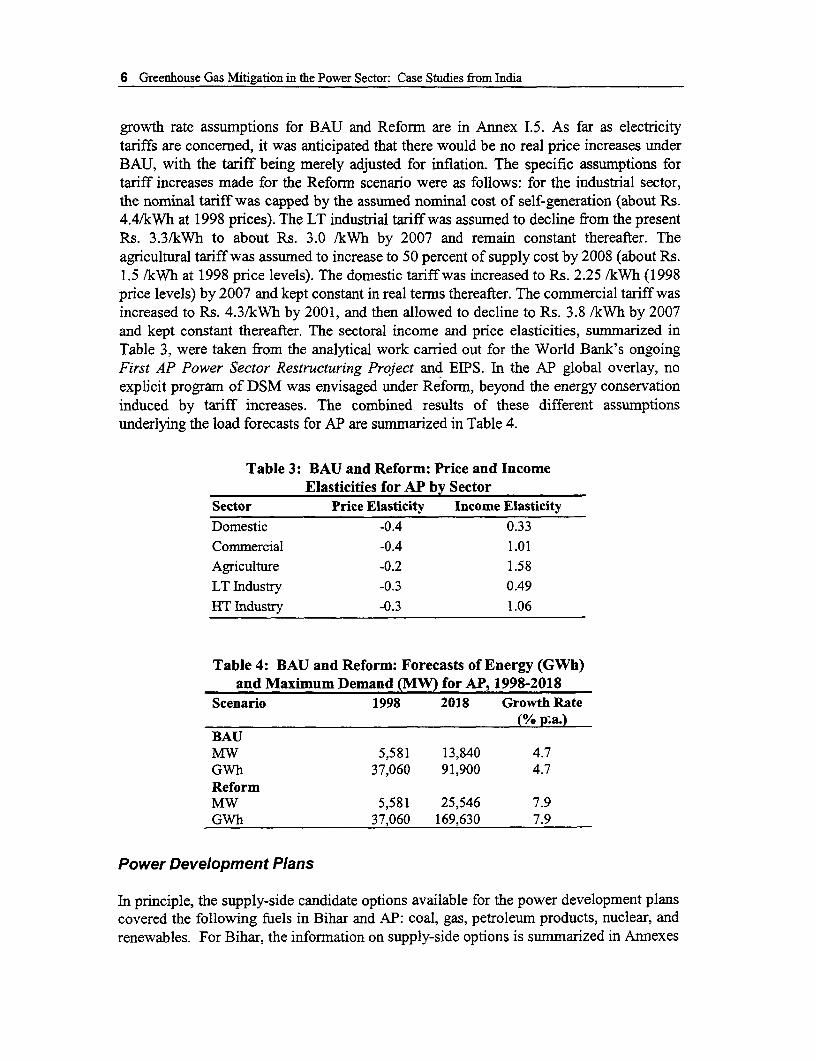
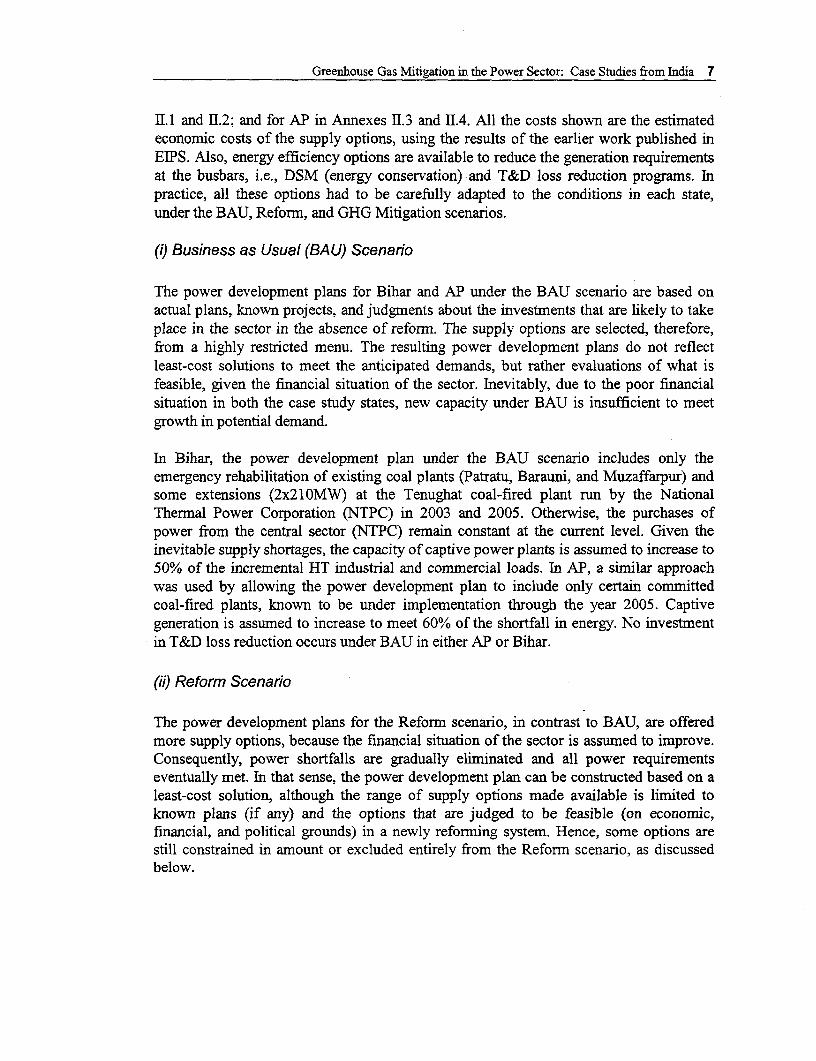
growth rate assumptions for BAU and Reform are in Annex I.5. As far as electricitytariffs are concemed, it was anticipated that there would be no real price increases underBAU, with the tariff being merely adjusted for inflation. The specific assumptions fortariff increases made for the Reform scenario were as follows: for the industrial sector,the nominal tariff was capped by the assumed nominal cost of self-generation (about Rs.4.4/kWh at 1998 prices). The LT industrial tariff was assumed to decline from the presentRs. 3.3/kWh to about Rs. 3.0 /kWh by 2007 and remain constant thereafter. Theagricultural tariff was assumed to increase to 50 percent of supply cost by 2008 (about Rs.1.5 /kWh at 1998 price levels). The domestic tariff was increased to Rs. 2.25 /kWh (1998price levels) by 2007 and kept constant in real terms thereafter. The commercial tariff wasincreased to Rs. 4.3/kWh by 2001, and then allowed to decline to Rs. 3.8 /kWh by 2007and kept constant thereafter. The sectoral income and price elasticities, sunmmarized inTable 3, were taken from the analytical work carried out for the World Bank's ongoingFirst AP Power Sector Restructuring Project and EIPS. In the AP global overlay, noexplicit program of DSM was envisaged under Reform, beyond the energy conservationinduced by tariff increases. The combined results of these different assumptionsunderlying the load forecasts for AP are summarized in Table 4.
Table 3: BAU and Reform: Price and IncomeElasticities for AP by Sector
Sector Price Elasticity Income ElasticityDomestic -0.4 0.33Commercial -0.4 1.01Agriculture -0.2 1.58LT Industry -0.3 0.49HT Industry -0.3 1.06
Table 4: BAU and Reform: Forecasts of Energy (GWh)and Maximum Demand (MW) for AP, 1998-2018
Scenario 1998 2018 Growth Rate(% p;a.)
BAUMW 5,581 13,840 4.7GWh 37,060 91,900 4.7ReformMW 5,581 25,546 7.9GWh 37,060 169,630 7.9
Power Development Plans
In principle, the supply-side candidate options available for the power development planscovered the following fuels in Bihar and AP: coal, gas, petroleum products, nuclear, andrenewables. For Bihar, the information on supply-side options is summarized in Annexes
Greenhouse Gas Mitigation in the Power Sector: Case Studies from India 7
11.1 and 11.2; and for AP in Annexes 11.3 and 11.4. All the costs shown are the estimatedeconomic costs of the supply options, using the results of the earlier work published inEIPS. Also, energy efficiency options are available to reduce the generation requirementsat the busbars, i.e., DSM (energy conservation) and T&D loss reduction programs. Inpractice, all these options had to be carefully adapted to the conditions in each state,under the BAU, Reform, and GHG Mitigation scenarios.
(i) Business as Usual (BAU) Scenario
The power development plans for Bihar and AP under the BAU scenario are based onactual plans, known projects, and judgments about the investments that are likely to takeplace in the sector in the absence of reform. The supply options are selected, therefore,from a highly restricted menu. The resulting power development plans do not reflectleast-cost solutions to meet the anticipated demands, but rather evaluations of what isfeasible, given the financial situation of the sector. Inevitably, due to the poor financialsituation in both the case study states, new capacity under BAU is insufficient to meetgrowth in potential demand.
In Bihar, the power development plan under the BAU scenario includes only theemergency rehabilitation of existing coal plants (Patratu, Barauni, and Muzaffarpur) andsome extensions (2x2lOMW) at the Tenughat coal-fired plant run by the NationalThermal Power Corporation (NTPC) in 2003 and 2005. Otherwise, the purchases ofpower from the central sector (NTPC) remain constant at the current level. Given theinevitable supply shortages, the capacity of captive power plants is assumed to increase to50% of the incremental HT industrial and commercial loads. In AP, a similar approachwas used by allowing the power development plan to include only certain committedcoal-fired plants, known to be under implementation through the year 2005. Captivegeneration is assumed to increase to meet 60% of the shortfall in energy. No investmentin T&D loss reduction occurs under BAU in either AP or Bihar.
(ii) Reform Scenario
The power development plans for the Reform scenario, in contrast to BAU, are offeredmore supply options, because the financial situation of the sector is assumed to improve.Consequently, power shortfalls are gradually eliminated and all power requirementseventually met. In that sense, the power development plan can be constructed based on aleast-cost solution, although the range of supply options made available is limited toknown plans (if any) and the options that are judged to be feasible (on economic,financial, and political grounds) in a newly reforming system. Hence, some options arestill constrained in amount or excluded entirely from the Reform scenario, as discussedbelow.
8 Greenhouse Gas Mitigation in the Power Sector: Case Studies from India
a. Bihar
In Bihar, starting in the year 2000, the target under Reform is to eliminate curtailmentsover a seven-year period. At present, BSEB draws only half of its entitlements (in energyterms) from NTPC as a consequence of its financial distress (about 3,700 GWh in 1996).Under the reform scenario, tariff increases would help to restore the sector's financialstrength, and power supplies could progressively increase from NTPC plants, until thesector reaches its full entitlement of 6,500 GWh by 2004. Rehabilitation of BSEB'sthermal plants (Patratu, Barauni, and Muzzafarpur) could commence immediately,targeted at remedying the most serious environmental and operational problems: plantavailability could increase from the present levels of 18-25% to 50%. However, the old50 MW units are assumed to be retired gradually by 2004. In line with current practice inreforming states in India, and to offset the uncertainty related to hydro plants, open-cyclecombustion turbines (OCCT), fuelled by naphtha, are forced into the expansion plan forpeaking purposes: the first is commissioned in 2005. Bihar has substantial quantities ofcoal to supply extensions to the existing thermal plants (at Patratu, Tenughat, andMuzzafarpur) and new base-load power stations (e.g., Katihar, Chandil, and Nabinagar).For convenience, a generic coal plant, based on the characteristics of Nabinagar, was usedto represent new candidate coal-fired stations (Annex 11.1).
Preliminary screening analysis demonstrated that neither nuclear power nor clean-coaltechnologies, such as IGCC or PFBC, would compete with Nabinagar: they weretherefore not candidate options under Reform, but were considered as GHG mitigationcandidates. Similarly, Bangladesh gas and coal washing were not made available, becausethe former hinges on decisions outside the power sector and the latter would require amuch broader set of reforms across the energy sector: they were analyzed only as GHGreduction candidates.
As far as renewables are concerned, there is considerable uncertainty over Bihar'sremaining major hydro projects (Annex II.2). The largest of these is the 710-MW Koel-Karo project, which has recently been given to the National Hydro Power Corporation(NBPC) for implementation. This project involves the resettlement of some 50,000people in a tribal area, as a result of which little progress has been made over the past 20years. The project is therefore omitted from the Reform case and considered for GHGmitigation. The most attractive of the other large hydro options is Kadwan, a 450-MWproject that could be built at the Kadwan irrigation scheme. Power generation would beincidental to irrigation, and it is considered as a candidate powerhouse-only project forReform. A large number of potential mini-hydro schemes exist in Bihar and wereconsidered as candidate options for Reform. However, the import of electric power fromhydro plants in Nepal, like Bangladesh gas, will depend on decisions outside the powersector; solar photovoltaics (PVs) are still uneconomic for grid supply; and the use ofbagasse appears unlikely to be taken up under Reform: these supply options weretherefore retained only for GHG mitigation.
The energy efficiency measures introduced under Reform cover DSM and T&D lossreduction. Specifically, the rehabilitation of the T&D network is expected to reduce
Greenhouse Gas Mitigation in the Power Sector: Case Studies from India 9
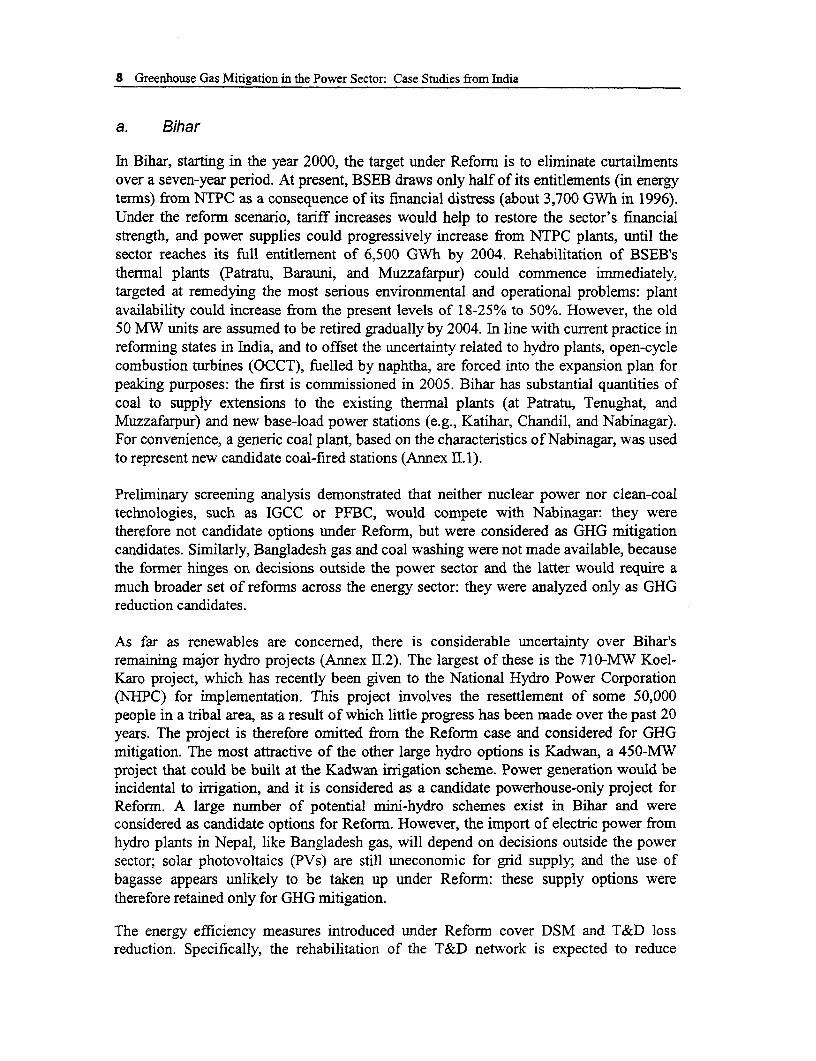
technical losses from the existing level of 28% to 18% by 2004, while nontechnical lossesfall from 9% to 4% by 2004. The DSM program in the Bihar Reform scenario is based onthe Integrated Agricultural DSM Project proposed for the state of AP. It combinesimprovement of the power distribution system, by converting low voltage (LV) feeders tohigh voltage (HV) feeders; the introduction of automated load control, to facilitate thesupply of nonagricultural customers; and the installation of high-efficiency pumpsets andassociated pipes and valves. Due to the substantial investment requirements, the programis implemented in a phased manner: 15% of total customers are covered in 2000, and anadditional 30%, 45%, 60%, 75%, and 100% of customers are covered in 2001, 2002,2003, 2004, and 2005, respectively. Starting in 2005, all customers are assumed to becovered under this scheme for the total study period. At the same time, the number ofcustomers grows by 1% p.a. The main characteristics and outcome of the DSM programare in Table 5.
Table 5: Estimated Characteristics and Outcome of DSM Program inBihar under Reform, 2000-2015
Parameters 2000 2002 2007 2012 2015Total number of Customers ('000s) 276 282 295 311 321DSM Coverage (%) 15 45 100 100 100Energy savings (GWh) 181 553 1290 1356 1397Cost of energy savings (Rs./kWh) 0.85Note: The cost of energy savings is defined as the ratio of the present value (PV) of the
cost of energy saved to the PV of energy saved.
b. Andhra Pradesh
In AP, all plants currently scheduled for construction or under consideration were allowedunder the Reform scenario. These plants consume either naphtha or coal, as shown inAnnex 11.5. Additionally, the candidate options in Annex 11.3 cover the Juralahydroelectric plant; generic conventional coal plants, located at the pit-head or near loadcenters and using domestic coal (from Singareni or Talcher) or imported coal; clean-coaltechnology (PFBC); LNG, naphtha and nuclear plants; and plants using various forms ofrenewable energy, such as wind, bagasse, solar, and mini-hydro-. The possibility ofgenerating power using refinery residues was also explored. In terms of the energyefficiency measures introduced under Reform in AP, T&D losses were assumed to dropfrom the current level of about 32% to 15%, although no explicit program wasimplemented for DSM.
(iii) Greenhouse Gas (GHG) Mitigation Scenario
The power development plans for the GHG Mitigation scenario in Bihar and APessentially force in the options that were constrained or excluded under Reform, or evenrejected under Reform as not part of the least-cost solution. These options are forced in sothat their effectiveness as GHG mitigation options can be explicitly examined. In mostcases, it is expected that special policies or initiatives would normally be required to
10 Greenhouse Gas Mitigation in the Power Sector: Case Studies from India
overcome the obstacles to their implementation. Initially, each option is forced into theReform development plan individually, to assess its cost per metric ton of GHGemissions mitigated. This cost is defined as the change in total power system costs,relative to the Reform scenario, divided by the reduction in GHG emissions, relative tothe Reform scenario. In a second stage, combinations of individual options are formed, toevaluate the cost per metric ton of alternative mitigation scenarios. The GHG mitigationoptions considered in Bihar are shown in Annex II.6 and those for AP in Annex 11.7.
a. Bihar
As already discussed under the options provided for the Reform scenario in Bihar, nuclearpower, Bangladesh gas, and coal washing were not included as candidates for the BiharReform scenario, but instead were considered as GHG mitigation options. Nuclear poweris considered a candidate because of the absence of GHG emissions, despite otherobvious environmental problems and considerable uncertainty surrounding the costs. ForBangladesh gas, it is assumed that the gas would be imported by pipeline and burned incombined cycle gas plants at Calcutta. An allowance has been made for the additionalcost of transmission lines and for transmission losses from Calcutta to Jamshedpur. Twoalternatives were considered in estimating the sensitivity of the cost of GHG reductionwith respect to the cost of gas imports. For the coal washing option, the costs were takenfrom the EIPS (ESMAP Report No. 213/99, p. 103).
In terms of renewables, as explained above, solar PVs, bagasse, the large Koel-Karohydroelectric project, mini-hydro, and imports of hydroelectric power from Nepal wereretained as supply options only for GHG mitigation. Although solar PVs are stilluneconomic for grid supply, they have obvious environmental benefits, especially from aGHG reduction viewpoint. On the expectation that further substantial technical progresscan be anticipated to reduce their capital costs, their low operating costs may bring totalcosts per kWh down to a competitive level in the future. The global overlay for Bihartherefore took two alternatives, with the capital costs of solar PVs at about US$5/Wp inone case (in line with current technology), and the capital costs reduced by 50% in theother. The abundant supply of sugarcane in the Ganga plains of North Bihar and ineastem Uttar Pradesh make bagasse available in large quantities. However, the economicuse of this solid residue from sugarcane crushing will be limited by its value in alternativeuses, like paper manufacture, and the cost of transportation, given its low calorific value.In face of the uncertainties about supply and costs for power generation, the total likelyavailable capacity was restricted to two units of 210 MW (a net capacity addition of 380MW), which were analyzed under two alternative assumptions using differing costs. Toassess the impact of the Koel-Karo project as a GHG reduction measure, it was forcedinto the plan in 2010, after the Kadwan project.
For the purposes of the global overlay, two tranches of mini-hydro projects wereconsidered, based upon projections made by the Bihar Hydroelectric Power Corporation(BHPC). Only the first was offered in the Reform scenario, as the cost figures projectedfor the second tranche were regarded as much more uncertain. The second tranche was
Greenhouse Gas Mitigation in the Power Sector: Case Studies from India 11
therefore forced into the development plan as a GHG mitigation option, with a highercapital cost than the first tranche.
For Nepal hydro, the global overlay collected information on projects that had beenidentified by the Government of Nepal for future development and that might be suitablefor export to India. The results are in Annex 11.8. Out of the identified projects,Kaligandaki-A and Kaligandaki-Il were identified as the most likely sources of powerimports from Nepal to reduce GHG emissions. The total capacity imported was restrictedto a maximum of 500 MW until 2015. The additional transmission line costs wereincluded in the total project costs and allowance was also made for additionaltransmission losses. The option was considered under two alternatives, to reflect differentpossible timings for Kaligandaki-II.
PFBC and IGCC were selected as the possible clean-coal technologies for GHG emissionreduction. While the thermal efficiencies and environmental benefits of both of theprocesses are comparable, the capital costs of PFBC are lower at present. However, bothalternatives were examined under the GHG mitigation scenario, by forcing all new Biharcoal-based units to incorporate either IGCC technology from 2004 onward, with the costsshown in Annex 11.1, or PFBC technology, from the same date, but with the capital costper kW being 20% lower than for IGCC.
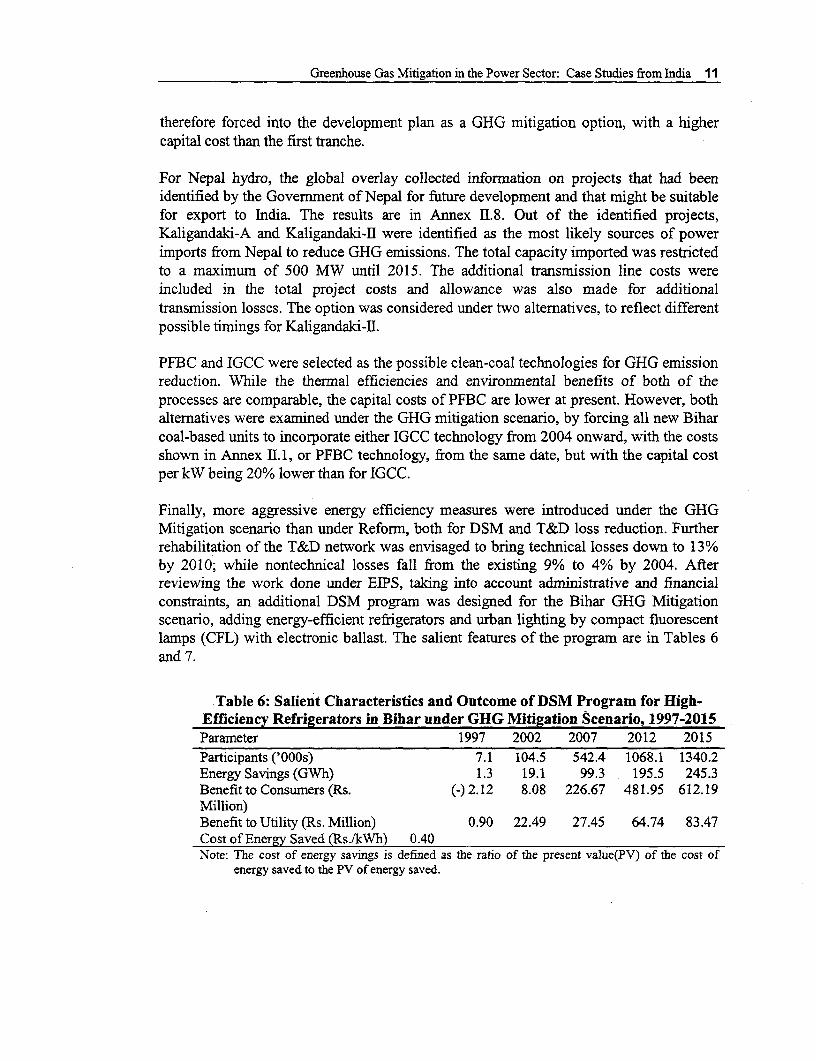
Finally, more aggressive energy efficiency measures were introduced under the GHGMitigation scenario than under Reform, both for DSM and T&D loss reduction. Furtherrehabilitation of the T&D network was envisaged to bring technical losses down to 13%by 2010; while nontechnical losses fall from the existing 9% to 4% by 2004. Afterreviewing the work done under EIPS, taking into account administrative and financialconstraints, an additional DSM program was designed for the Bihar GHG Mitigationscenario, adding energy-efficient refrigerators and urban lighting by compact fluorescentlamps (CFL) with electronic ballast. The salient features of the program are in Tables 6and 7.
Table 6: Salient Characteristics and Outcome of DSM Program for High-Efficiency Refrigerators in Bihar under GHG Mitigation Scenario, 1997-2015Parameter 1997 2002 2007 2012 2015Participants ('000s) 7.1 104.5 542.4 1068.1 1340.2Energy Savings (GWh) 1.3 19.1 99.3 195.5 245.3Benefitto Consumers (Rs. (-) 2.12 8.08 226.67 481.95 612.19Million)Benefit to Utility (Rs. Million) 0.90 22.49 27.45 64.74 83.47Cost of Energy Saved (Rs./kWh) 0.40Note: The cost of energy savings is defined as the ratio of the present value(PV) of the cost of
energy saved to the PV of energy saved.
12 Greenhouse Gas Mitigation in the Power Sector: Case Studies from India
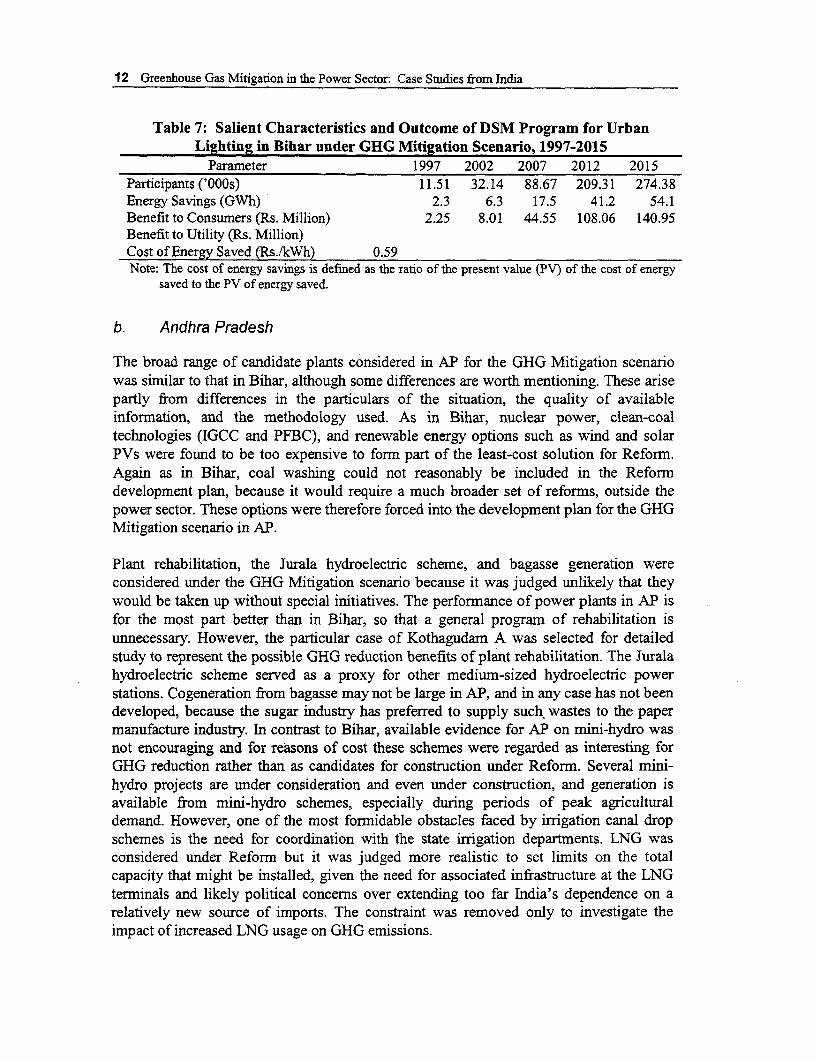
Table 7: Salient Characteristics and Outcome of DSM Program for UrbanLighting in Bihar under GHG Mitigation Scenario, 1997-2015
Parameter 1997 2002 2007 2012 2015Participants ('OOOs) 11.51 32.14 88.67 209.31 274.38Energy Savings (GWh) 2.3 6.3 17.5 41.2 54.1Benefit to Consumers (Rs. Million) 2.25 8.01 44.55 108.06 140.95Benefit to Utility (Rs. Million)Cost of Energy Saved (Rs./kWh) 0.59Note: The cost of energy savings is defined as the ratio of the pTesent value (PV) of the cost of energy
saved to the PV of energy saved.
b. Andhra Pradesh
The broad range of candidate plants considered in AP for the GHG Mitigation scenariowas similar to that in Bihar, although some differences are worth mentioning. These arisepartly from differences in the particulars of the situation, the quality of availableinformation, and the methodology used. As in Bihar, nuclear power, clean-coaltechnologies (IGCC and PFBC), and renewable energy options such as wind and solarPVs were found to be too expensive to form part of the least-cost solution for Reform.Again as in Bihar, coal washing could not reasonably be included in the Reformdevelopment plan, because it would require a much broader set of reforms, outside thepower sector. These options were therefore forced into the development plan for the GHGMitigation scenario in AP.
Plant rehabilitation, the Jurala hydroelectric scheme, and bagasse generation wereconsidered under the GHG Mitigation scenario because it was judged unlikely that theywould be taken up without special initiatives. The performance of power plants in AP isfor the most part better than in Bihar, so that a general program of rehabilitation isunnecessary. However, the particular case of Kothagudam A was selected for detailedstudy to represent the possible GHG reduction benefits of plant rehabilitation. The Juralahydroelectric scheme served as a proxy for other medium-sized hydroelectric powerstations. Cogeneration from bagasse may not be large in AP, and in any case has not beendeveloped, because the sugar industry has preferred to supply such, wastes to the papermanufacture industry. In contrast to Bihar, available evidence for AP on mini-hydro wasnot encouraging and for reasons of cost these schemes were regarded as interesting forGHG reduction rather than as candidates for construction under Reform. Several mini-hydro projects are under consideration and even under construction, and generation isavailable from mini-hydro schemes, especially during periods of peak agriculturaldemand. However, one of the most formidable obstacles faced by irrigation canal dropschemes is the need for coordination with the state irrigation departments. LNG wasconsidered under Reform but it was judged more realistic to set limits on the totalcapacity that might be installed, given the need for associated infrastructure at the LNGterminals and likely political concerns over extending too far India's dependence on arelatively new source of imports. The constraint was removed only to investigate theimpact of increased LNG usage on GHG emissions.
Greenhouse Gas Mitigation in the Power Sector: Case Studies from India 13
The option of using refinery residues for power generation was not considered in theBihar global overlay. As mentioned under Reform, it was given consideration in AP, dueto strong interest in establishing a plant at Visakhapatnam. According to the detailedwork carried out under the AP case study for EIPS, this option would use refineryresidual fuel oil having a gross calorific value of 7400 kcal/kg. Power could be generatedusing conventional steam generators, Fluidized Bed Combustion Technology (FBC), orthe Integrated Gasification and Combined Cycle System (IGCC). The main benefitswould come from reducing local pollution, but GHG emissions would also be reduced.From an efficiency and environmental perspective, IGCC, with a plant efficiency of about43%, scores over the other technologies. The costs for power generation would besensitive to the location and it is difficult to arrive at generic generation costs. With thecosts shown in Annex 11.3, which incorporate the data available to ASCI from its specialstudy of refinery residues, the option would not be picked up under the Reform scenario.Hence, it was forced into the development plan for the GHG Mitigation Scenario, withresidual fuel oil being used for power generation with the IGCC process.
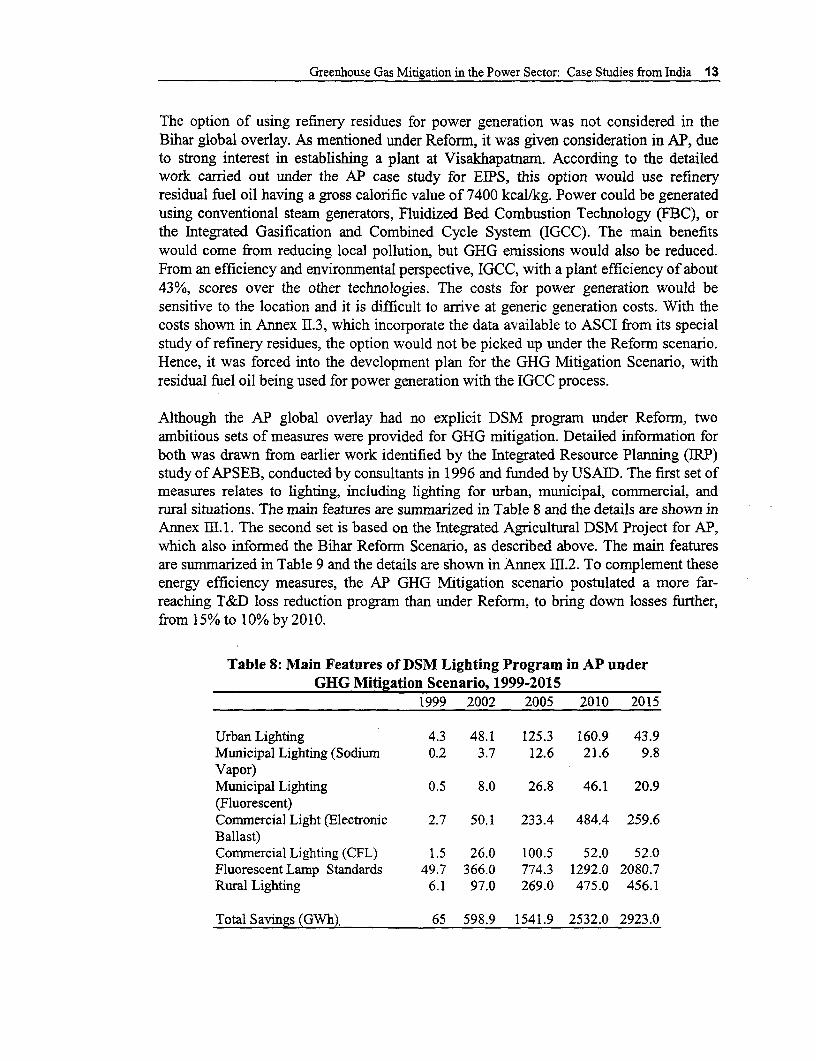
Although the AP global overlay had no explicit DSM program under Reform, twoambitious sets of measures were provided for GHG mitigation. Detailed information forboth was drawn from earlier work identified by the Integrated Resource Planming (IRP)study of APSEB, conducted by consultants in 1996 and funded by USAID. The first set ofmeasures relates to lighting, including lighting for urban, municipal, commercial, andrural situations. The main features are summarized in Table 8 and the details are shown inAnnex III.1. The second set is based on the Integrated Agricultural DSM Project for AP,which also informed the Bihar Reform Scenario, as described above. The main featuresare summarized in Table 9 and the details are shown in Annex 11.2. To complement theseenergy efficiency measures, the AP GHG Mitigation scenario postulated a more far-reaching T&D loss reduction program than under Reform, to bring down losses further,from 15% to 10% by 2010.
Table 8: Main Features of DSM Lighting Program in AP underGHG Mitigation Scenario, 1999-2015
1999 2002 2005 2010 2015
Urban Lighting 4.3 48.1 125.3 160.9 43.9Municipal Lighting (Sodium 0.2 3.7 12.6 21.6 9.8Vapor)Municipal Lighting 0.5 8.0 26.8 46.1 20.9(Fluorescent)Commercial Light (Electronic 2.7 50.1 233.4 484.4 259.6Ballast)Commercial Lighting (CFL) 1.5 26.0 100.5 52.0 52.0Fluorescent Lamp Standards 49.7 366.0 774.3 1292.0 2080.7Rural Lighting 6.1 97.0 269.0 475.0 456.1
Total Savings (GWh) 65 598.9 1541.9 2532.0 2923.0
14 Greenhouse Gas Mitigation in the Power Sector: Case Studies from India
Modeling the Power Systems
In order to examine the implications of these power development plans for GHGemissions, a computational tool is needed to:
* Simulate the operating regime of the BAU scenario;* Construct and simulate the least-cost solution to meet the unconstrained demand
of the Reform scenario, albeit limiting the least-cost solution to a subset of the fullrange of potential options represented by any known plans and the options that arejudged to be feasible;
* Calculate emissions of GHG for both BAU and Reform;* Simulate the incremental impact of individual GHG reduction options; and* Simulate the incremental impact of selected GHG mitigation scenarios (i.e., using
combinations of options to achieve target reductions in GHG emissions).
Both of the case studies relied heavily on a least-cost power system expansion planningsoftware called A/SPLAN (designed by Analytical Solutions - A/S - of Bayport, NewYork). A/SPLAN is based on the WASP model (the Wien Automatic SimulationPackage, produced by the International Atomic Energy Agency) and employs a dynamicprogramming algorithm.
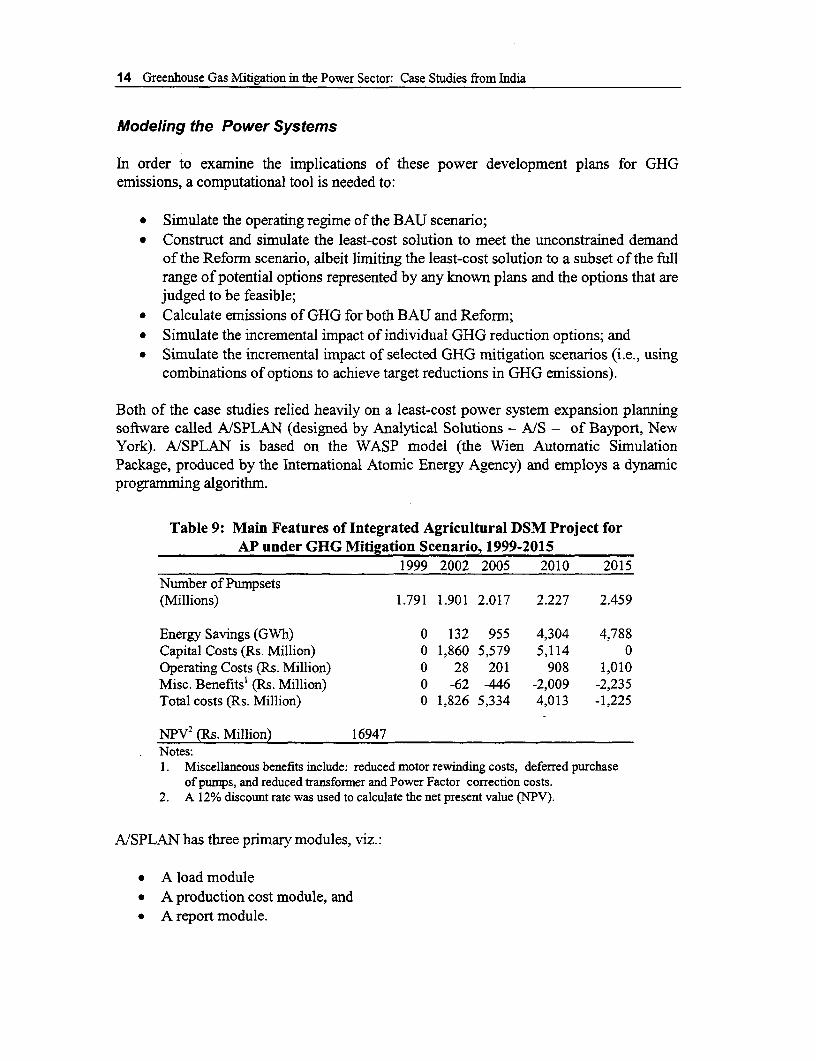
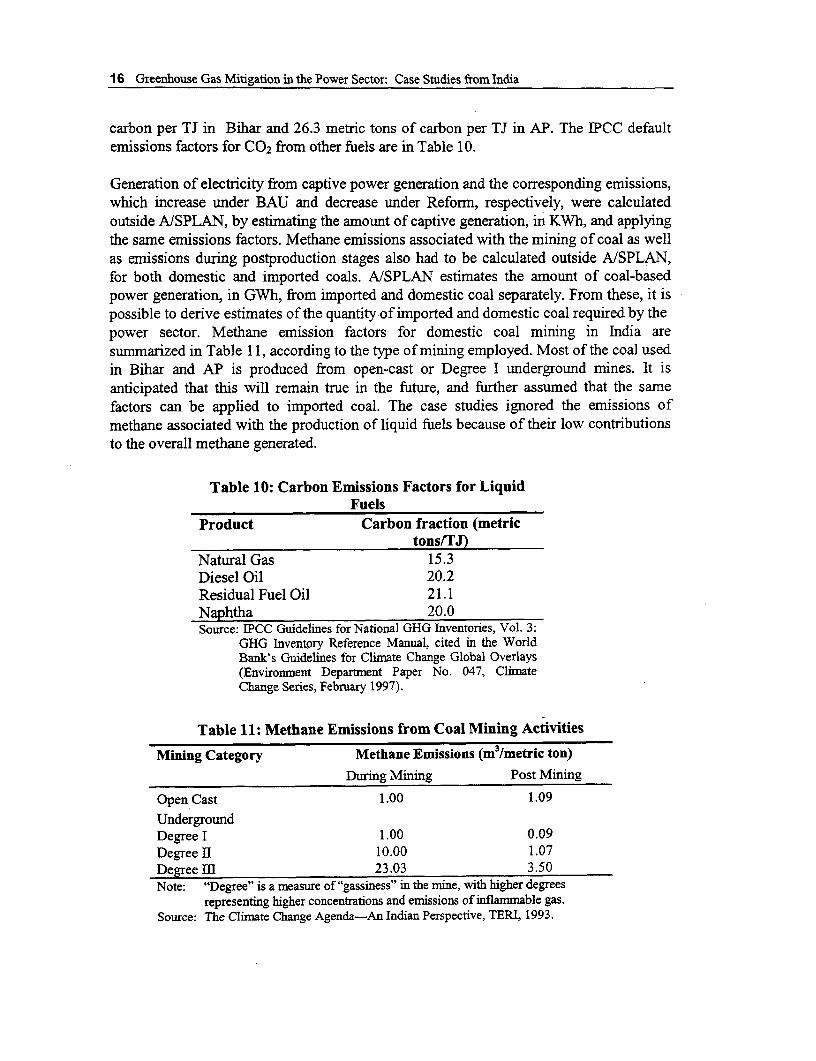
Table 9: Main Features of Integrated Agricultural DSM Project forAP under GHG Mitigation Scenario, 1999-2015
1999 2002 2005 2010 2015Number of Pumpsets(Millions) 1.791 1.901 2.017 2.227 2.459
Energy Savings (GWh) 0 132 955 4,304 4,788Capital Costs (Rs. Million) 0 1,860 5,579 5,114 0Operating Costs (Rs. Million) 0 28 201 908 1,010Misc. Benefits' (Rs. Million) 0 -62 -446 -2,009 -2,235Total costs (Rs. Million) 0 1,826 5,334 4,013 -1,225
NPV2 (Rs. Million) 16947Notes:1. Miscellaneous benefits include: reduced motor rewinding costs, deferred purchase
of pumps, and reduced transformer and Power Factor correction costs.2. A 12% discount rate was used to calculate the net present value (NPV).
AISPLAN has three primary modules, viz.:
* A load module* A production cost module, and* A report module.
Greenhouse Gas Mitigation in the Power Sector: Case Studies from India 15
(i) The Load Module
The basic inputs for the load module are the hourly time series data for energy, accordingto the season (rainy, dry, winter) and consumer category (residential, commercial,industrial, and agricultural). A/SPLAN then constructs stylized annual, seasonal, anddaily load duration curves (LDCs), which feed directly into the production cost module.
(ii) The Production Cost Module
The production cost module carries out a probabilistic simulation to minimize the totaldiscounted system costs of the power system over a given time horizon, using a 12%discount factor. It combines the scheduled and forced plant outage rates with the LDCs tocalculate the Loss of Load Probability (LOLP) and the Energy Not Served (ENS). LOLPis a measure of power system reliability and is defined as the probability that loadshedding will occur in any given year. It takes a value between zero and one. It is possibleto specify LOLP and A/SPLAN will optimize the power system to achieve that particularlevel of reliability. For example, in Bihar, LOLP was set at 0.05 (5%), meaning that loadshedding would occur on average in 438 hours per year, compared with an LOLP thatcurrently exceeds 40%, or 3504 hours per year. Alternatively, as in AP, the analyst canspecify a cost per unit of ENS and the model will select a value for LOLP to optimize thepower system, i.e., by balancing the cost of increasing the reserve margin against thesavings in cost of a consequent reduction in the amount of ENS. In AP, LOLP also nowexceeds 40%, and the cost of ENS was fixed at ten times the average tariff for thepurposes of the global overlay. It is interesting to note that this assumption led to thesame result as in Bihar, i.e., an LOLP of 5%. The key results of the system simulation areestimates of system production costs (for operation, maintenance, and investment); theconsumption of different fuels (based on inputs for the heat rates and unit costs of thefuels); and undiscounted emissions of GHG for the simulated power sector.
A/SPLAN can be run using either financial or economic costs. In these two globaloverlays, economic costs were used for all investments and fuels, i.e., they exclude taxesand add back subsidies. Furthermore, they include estimates of the costs necessary tomeet environmental standards in the electric power and coal mining sectors and to thatextent internalize the costs of local environmental impacts.
The emissions of GHG for the simulated power sector are calculated directly from theconsumption of different fuels, as estimated by A/SPLAN, using emissions factors. TheCO2, CH4 , and N2 0 emissions factors used in the two case studies are based on the IPCCdefault values, as reported in the World Bank's Guidelines for Climate Change GlobalOverlays (Environment Department Paper No. 047, Climate Change Series, February1997), Exhibits 4-6 and 4-9, except for the burning and mining of coal, where thecoefficients were adapted to fit the particular conditions in India. The emissions factorsused for CO2 attributable to coal burning in the power sector, the single most importantsource of GHG emissions in the power sectors in Bihar and AP, were 25.9 metric tons of
16 Greenhouse Gas Mitigation in the Power Sector: Case Studies from India
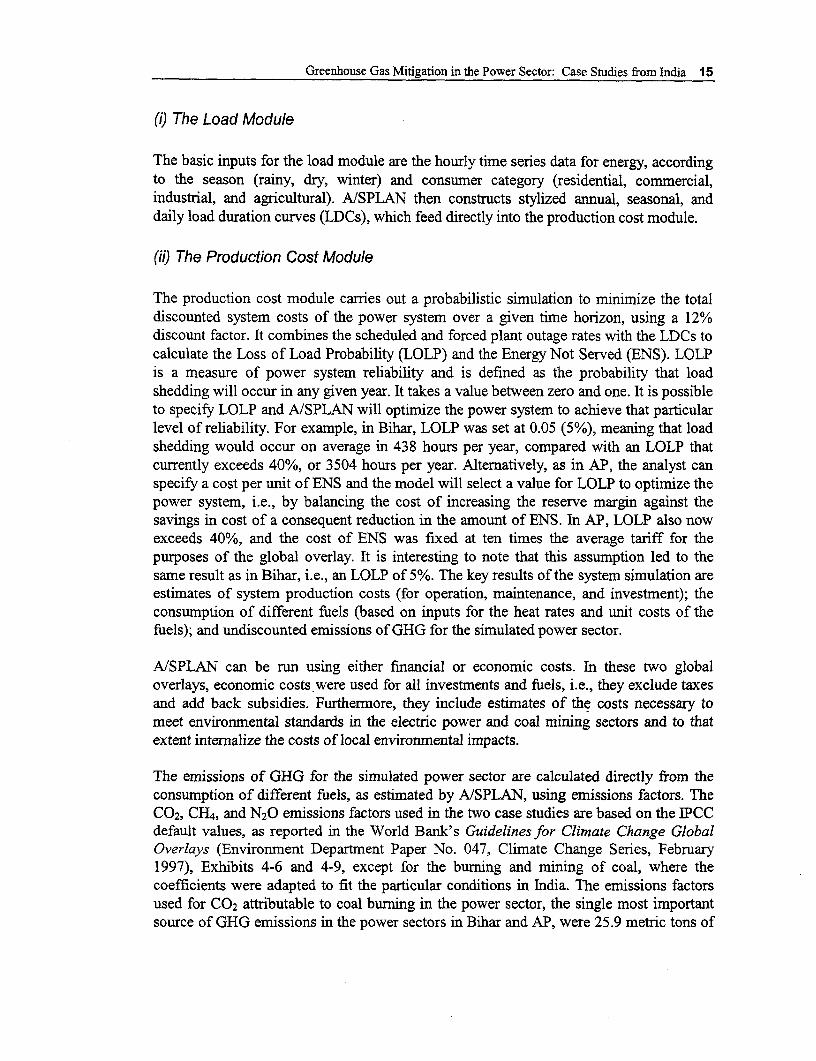
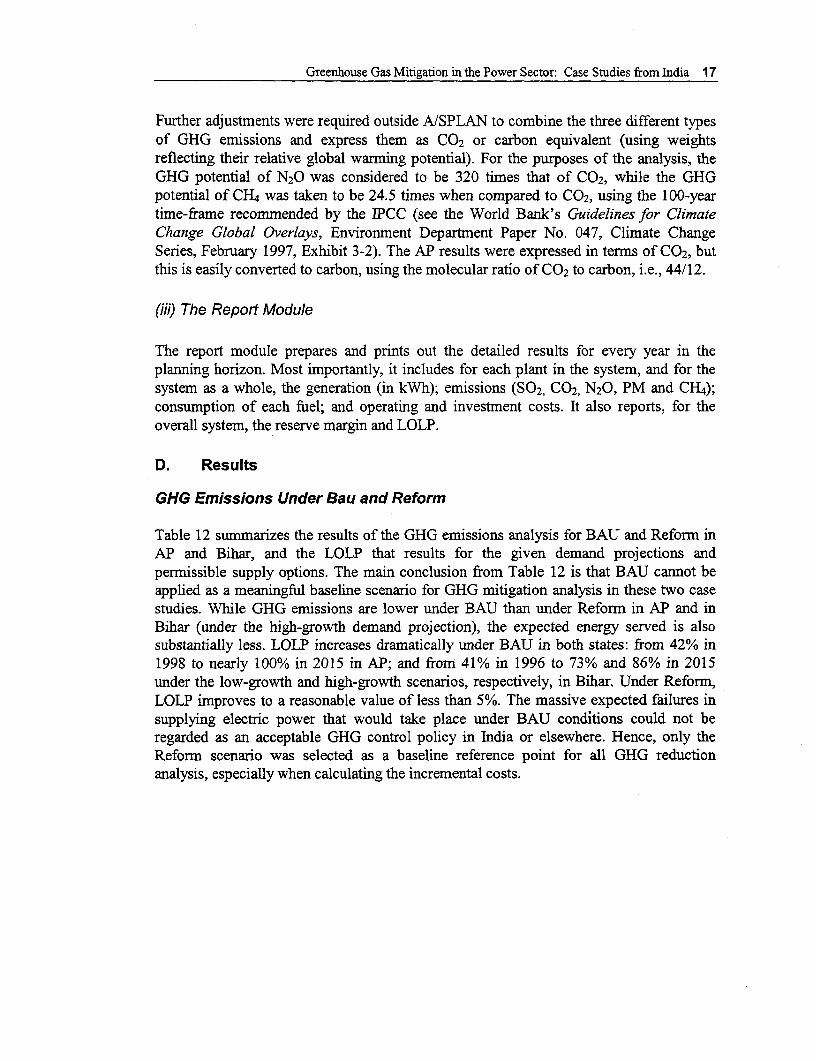
carbon per TJ in Bihar and 26.3 metric tons of carbon per TJ in AP. The IPCC defaultemissions factors for C0 2 from other fuels are in Table 10.
Generation of electricity from captive power generation and the corresponding emissions,which increase under BAU and decrease under Reform, respectively, were calculatedoutside AISPLAN, by estimating the amount of captive generation, in KWh, and applyingthe same emissions factors. Methane emissions associated with the mining of coal as wellas emissions during postproduction stages also had to be calculated outside A/SPLAN,for both domestic and imported coals. A/SPLAN estimates the amount of coal-basedpower generation, in GWh, from imported and domestic coal separately. From these, it ispossible to derive estimates of the quantity of imported and domestic coal required by thepower sector. Methane emission factors for domestic coal mining in India aresummarized in Table 11, according to the type of mining employed. Most of the coal usedin Bihar and AP is produced from open-cast or Degree I underground mines. It isanticipated that this will remain true in the future, and further assumed that the samefactors can be applied to imported coal. The case studies ignored the emissions ofmethane associated with the production of liquid fuels because of their low contributionsto the overall methane generated.
Table 10: Carbon Emissions Factors for LiquidFuels
Product Carbon fraction (metrictons/TJ)
Natural Gas 15.3Diesel Oil 20.2Residual Fuel Oil 21.1Naphtha 20.0Source: IPCC Guidelines for National GHG Inventories, Vol. 3:
GHG Inventory Reference Manual, cited in the WorldBank's Guidelines foT Climate Change Global Overlays(Enviromnent Department Paper No. 047, ClimateChange Series, February 1997).
Table 11: Methane Emissions from Coal Mining Activities
Mining Category Methane Emissions (m3/metric ton)During Mining Post Mining
Open Cast 1.00 1.09
UndergroundDegree I 1.00 0.09Degree II 10.00 1.07Degree HI 23.03 3.50Note: "Degree" is a measure of "gassiness" in the mine, with higher degrees
representing higher concentrations and emissions of inflammable gas.Source: The Climate Change Agenda-An Indian Perspective, TERI, 1993.
Greenhouse Gas Mitigation in the Power Sector: Case Studies from India 17
Further adjustments were required outside A/SPLAN to combine the three different typesof GHG emissions and express them as CO2 or carbon equivalent (using weightsreflecting their relative global warming potential). For the purposes of the analysis, theGHG potential of N20 was considered to be 320 times that of CO2, while the GHGpotential of CH4 was taken to be 24.5 times when compared to C02, using the 100-yeartime-frame recommended by the IPCC (see the World Bank's Guidelines for ClimateChange Global Overlays, Environment Department Paper No. 047, Climate ChangeSeries, February 1997, Exhibit 3-2). The AP results were expressed in terms of C02 , butthis is easily converted to carbon, using the molecular ratio of CO2 to carbon, i.e., 44/12.
(iii) The Report Module
The report module prepares and prints out the detailed results for every year in theplanning horizon. Most importantly, it includes for each plant in the system, and for thesystem as a whole, the generation (in kWh); emissions (SO2, C02, N2 0, PM and CG14);consumption of each fuel; and operating and investment costs. It also reports, for theoverall system, the reserve margin and LOLP.
D. Results
GHG Emissions Under Bau and Reform
Table 12 summarizes the results of the GHG emissions analysis for BAU and Reform inAP and Bihar, and the LOLP that results for the given demand projections andpermissible supply options. The main conclusion from Table 12 is that BAU cannot beapplied as a meaningful baseline scenario for GHG mitigation analysis in these two casestudies. While GHG emissions are lower under BAU than under Reform in AP and inBihar (under the high-growth demand projection), the expected energy served is alsosubstantially less. LOLP increases dramatically under BAU in both states: from 42% in1998 to nearly 100% in 2015 in AP; and from 41% in 1996 to 73% and 86% in 2015under the low-growth and high-growth scenarios, respectively, in Bihar. Under Refonn,LOLP improves to a reasonable value of less than 5%. The massive expected failures insupplying electric power that would take place under BAU conditions could not beregarded as an acceptable GHG control policy in India or elsewhere. Hence, only theReform scenario was selected as a baseline reference point for all GHG reductionanalysis, especially when calculating the incremental costs.
18 Greenhouse Gas Mitigation in the Power Sector: Case Studies from India
Table 12: GHG Emissions and LOLP under BAU andReform: AP and Bihar
Scenario Equivalent Carbon LOLP in 2015(Mt) (%)
AP
BAU 323.5 99.6Reform 520.1 4.2BiharBAU (LG) 100.7 73.4BAU (HG) 101.7 86.4Reform (LG) 91.1 4.5Reform (HG) 105.9 3.9
Incremental Impact of Individual GHG Reduction Options: GHG MitigationOption Supply Curves
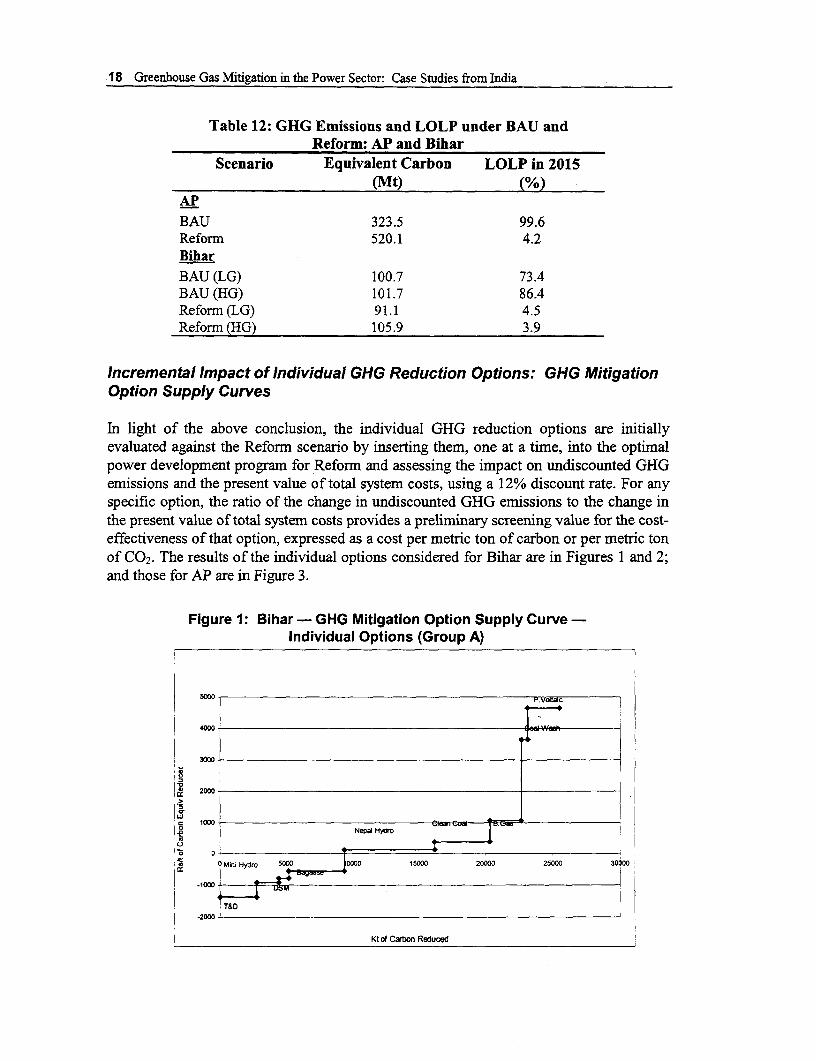
In light of the above conclusion, the individual GHG reduction options are initiallyevaluated against the Reform scenario by inserting them, one at a time, into the optimalpower development program for Reform and assessing the impact on undiscounted GHGemissions and the present value of total system costs, using a 12% discount rate. For anyspecific option, the ratio of the change in undiscounted GHG emissions to the change inthe present value of total system costs provides a preliminary screening value for the cost-effectiveness of that option, expressed as a cost per metric ton of carbon or per metric tonof CO2. The results of the individual options considered for Bihar are in Figures 1 and 2;and those for AP are in Figure 3.
Figure 1: Bihar - GHG Mitigation Option Supply Curve -Individual Options (Group A)
3000
1z 2000.o Nepal Hydro
o o 'F*,0.Mini Hydro 5000 0000 15000 20000 25000 30000
r&D-2000
Kt of Catbon Reduced
Greenhouse Gas Mitigation in the Power Sector: Case Studies from India 19
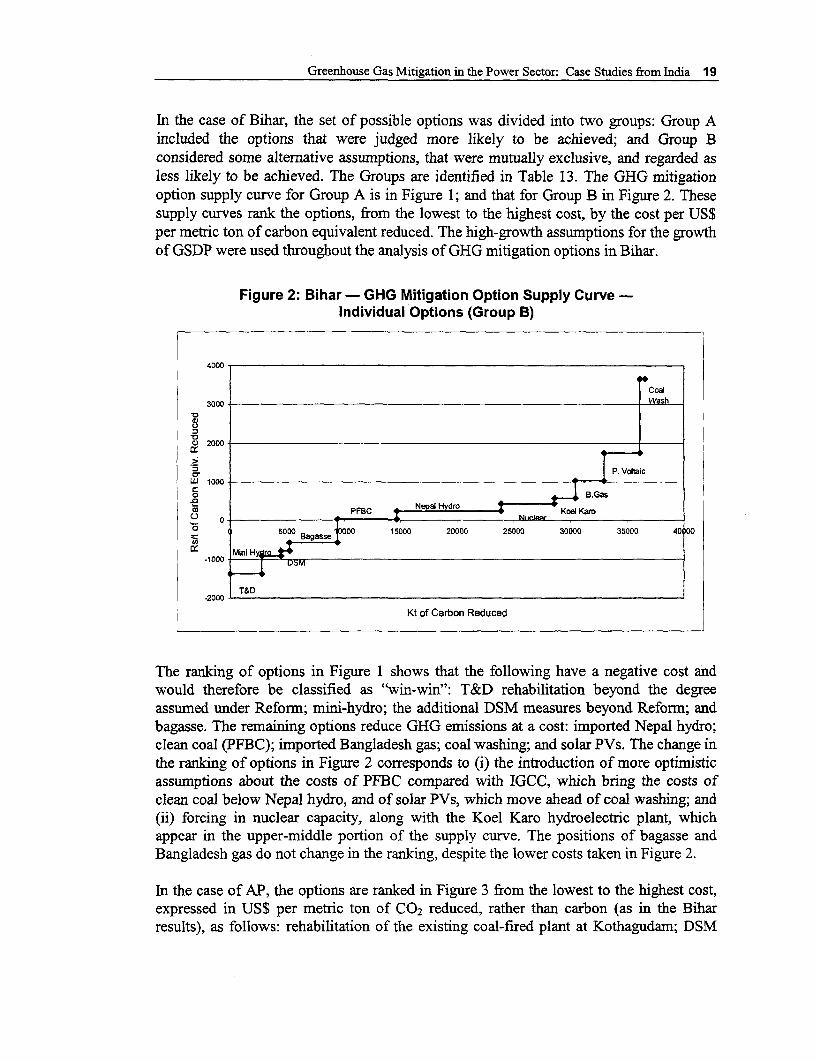
In the case of Bihar, the set of possible options was divided into two groups: Group Aincluded the options that were judged more likely to be achieved; and Group Bconsidered some alternative assumptions, that were mutually exclusive, and regarded asless likely to be achieved. The Groups are identified in Table 13. The GHG mitigationoption supply curve for Group A is in Figure 1; and that for Group B in Figure 2. Thesesupply curves rank the options, from the lowest to the highest cost, by the cost per US$per metric ton of carbon equivalent reduced. The high-growth assumptions for the growthof GSDP were used throughout the analysis of GHG mitigation options in Bihar.
Figure 2: Bihar - GHG Mitigation Option Supply Curve -Individual Options (Group B)
4000
Coal
3000 Wash
W) 2000 t_ l
D3 P. VoltaicLU 1000-
2 Nepal Hydro KoelKao
O 500 s 0 15000 20000 25000 30000 35000 40 00Bagass
Mini Hy-1000 _
T&D-2000
Kt of Carbon Reduced
The ranking of options in Figure 1 shows that the following have a negative cost andwould therefore be classified as "win-win": T&D rehabilitation beyond the degreeassumed under Reform; mini-hydro; the additional DSM measures beyond Reform; andbagasse. The remaining options reduce GHG emissions at a cost: imported Nepal hydro;clean coal (PFBC); imported Bangladesh gas; coal washing; and solar PVs. The change inthe ranking of options in Figure 2 corresponds to (i) the introduction of more optimisticassumptions about the costs of PFBC compared with IGCC, which bring the costs ofclean coal below Nepal hydro, and of solar PVs, which move ahead of coal washing; and(ii) forcing in nuclear capacity, along with the Koel Karo hydroelectric plant, whichappear in the upper-middle portion of the supply curve. The positions of bagasse andBangladesh gas do not change in the ranking, despite the lower costs taken in Figure 2.
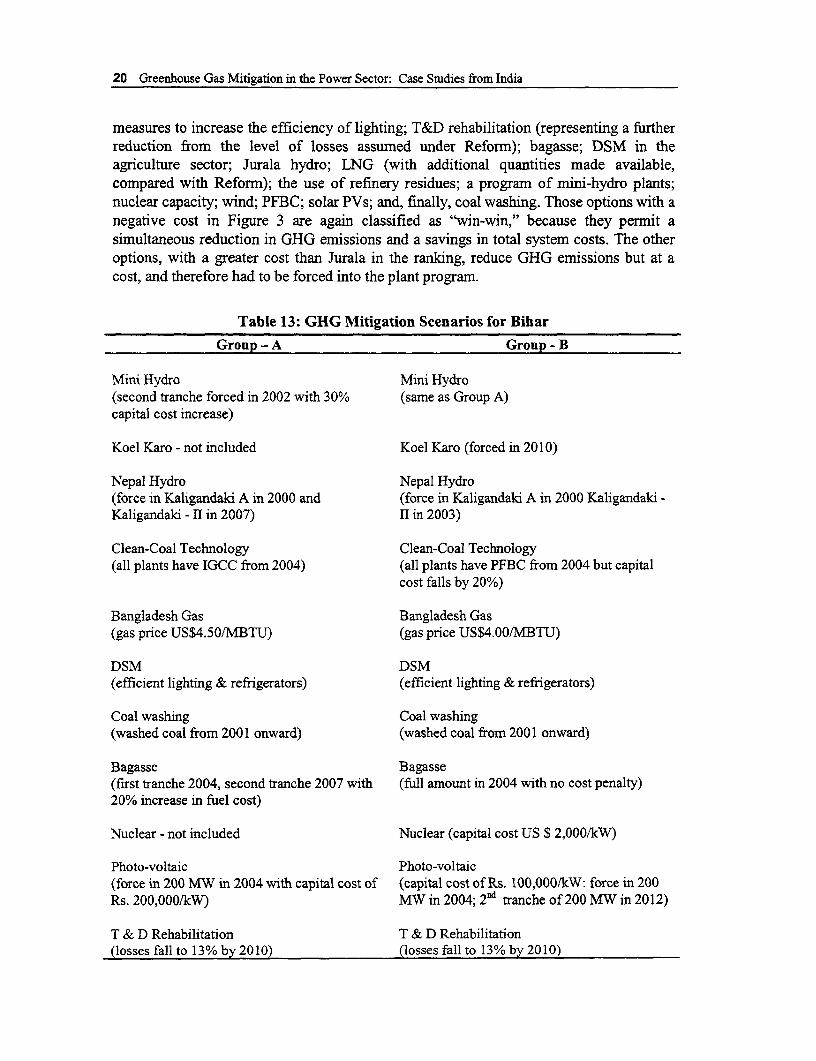
In the case of AP, the options are ranked in Figure 3 from the lowest to the highest cost,expressed in US$ per metric ton of CO2 reduced, rather than carbon (as in the Biharresults), as follows: rehabilitation of the existing coal-fired plant at Kothagudam; DSM
20 Greenhouse Gas Mitigation in the Power Sector: Case Studies from India
measures to increase the efficiency of lighting; T&D rehabilitation (representing a furtherreduction from the level of losses assumed under Reform); bagasse; DSM in theagriculture sector; Jurala hydro; LNG (with additional quantities made available,compared with Reform); the use of refinery residues; a program of mini-hydro plants;nuclear capacity; wind; PFBC; solar PVs; and, finally, coal washing. Those options with anegative cost in Figure 3 are again classified as "win-win," because they permit asimultaneous reduction in GHG emissions and a savings in total system costs. The otheroptions, with a greater cost than Jurala in the ranking, reduce GHG emissions but at acost, and therefore had to be forced into the plant program.
Table 13: GHG Mitigation Scenarios for Bihar
Group - A Group - B
Mini Hydro Mini Hydro(second tranche forced in 2002 with 30% (same as Group A)capital cost increase)
Koel Karo - not included Koel Karo (forced in 2010)
Nepal Hydro Nepal Hydro(force in Kaligandaki A in 2000 and (force in Kaligandaki A in 2000 Kaligandaki -Kaligandaki -II in 2007) II in 2003)
Clean-Coal Technology Clean-Coal Technology(all plants have IGCC from 2004) (all plants have PFBC from 2004 but capital
cost falls by 20%)
Bangladesh Gas Bangladesh Gas(gas price US$4.50/MBTU) (gas price USS4.00/MBTU)
DSM DSM(efficient lighting & refrigerators) (efficient lighting & refrigerators)
Coal washing Coal washing(washed coal from 2001 onward) (washed coal from 2001 onward)
Bagasse Bagasse(first tranche 2004, second tranche 2007 with (full amount in 2004 with no cost penalty)20% increase in fuel cost)
Nuclear - not included Nuclear (capital cost US $ 2,000/kW)
Photo-voltaic Photo-voltaic(force in 200 MW in 2004 with capital cost of (capital cost of Rs. 100,000/kW: force in 200Rs. 200,000/kW) MW in 2004; 2d tranche of 200 MW in 2012)
T & D Rehabilitation T & D Rehabilitation(losses fall to 13% by 2010) (losses fall to 13% by 2010)
Greenhouse Gas Mitigation in the Power Sector: Case Studies from India 21
Figure 3: Andhra Pradesh - GHG Mitigation Option Supply Curve-Individual Options
GHG Mltigation Option Supply Curve
Coal Washing
Photovoltaic
0
Q 15- PFBC
1! ~~~~~~~~~~~~~~~~~Mini Hydel Win DSM-Agriculture Ref Rsd
.. Fr . . . . . . ..... .... t , ............ .......... .....
% Jurala Hydro-5 - Lighting T&D Rehab
Kothagud imRehab
-25- O 100 200 300 400 500 600 700 800
Million Tons of C02 Reduced
Incremental Impact of Combinations of GHG Reduction Options: GHGMitigation Scenarios
Based on the preceding screening analysis, combinations of options were put together inthe case studies to form GHG mitigation scenarios. The combinations were selectedaccording to the cost-effectiveness ranking of the options, as measured by cost per metricton of carbon reduced. In forming the combinations, the goal was to achieve reductions ofroughly 10%, 15%, and 20% in GHG emissions. The results could not be exact, due todiscontinuities between the combinations (i.e., "lumpiness" was encountered), so thatsometimes the goal was overachieved and sometimes underachieved. The results forBihar are in Figures 4 and 5 and those for in AP are in Figure 6. Before discussing theseresults, it is convenient to convert the cost data into consistent units, so that comparisonsbetween the two case studies can be drawn more easily. The following presentation istherefore expressed in US$ per metric ton of carbon reduced, converting CO2 to carbon,using the molecular ratio of CO2 to carbon, i.e., 44/12. It is useful to note that the GEFguidelines for evaluating projects suggest that cost-effective projects (options) wouldtypically mitigate GHG emissions for approximately US$10/metric ton of carbon or less(see the World Bank's Guidelines for Climate Change Global Overlays, EnvironmentDepartment Paper No. 047, Climate Change Series, February 1997, Exhibit 1-1).
22 Greenhouse Gas Mitigation in the Power Sector: Case Studies from India
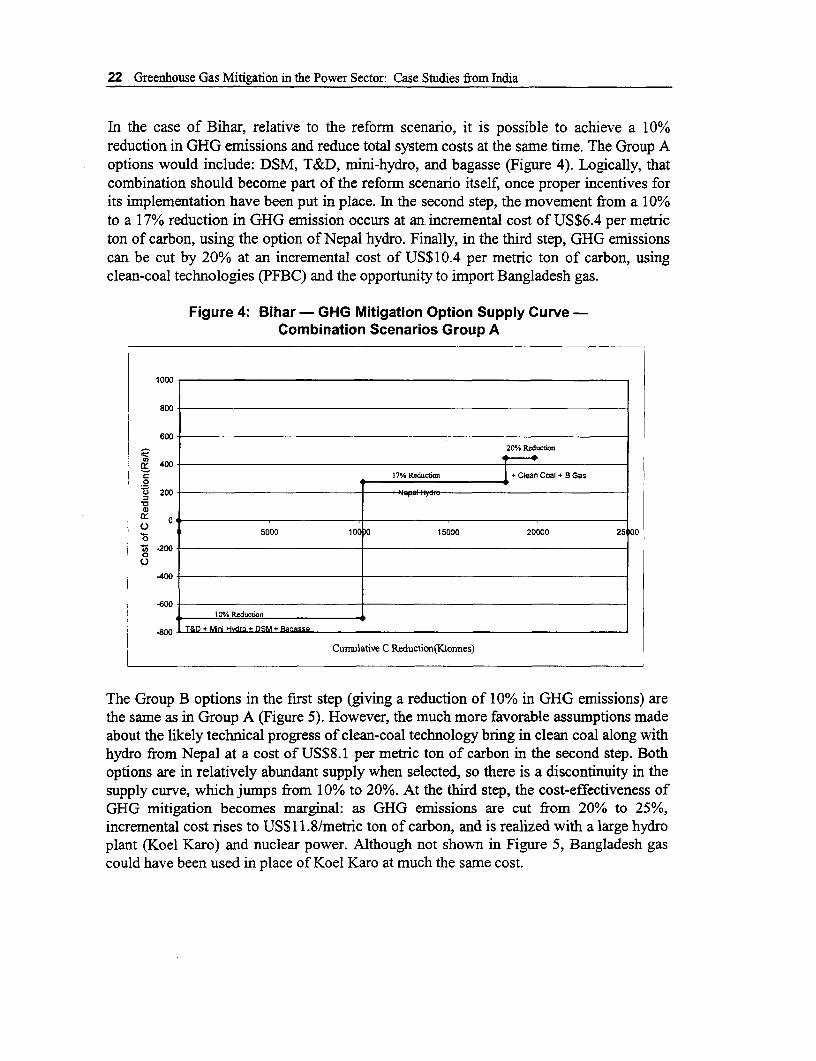
In the case of Bihar, relative to the reform scenario, it is possible to achieve a 10%reduction in GHG emissions and reduce total system costs at the same time. The Group Aoptions would include: DSM, T&D, mini-hydro, and bagasse (Figure 4). Logically, thatcombination should become part of the reform scenario itself, once proper incentives forits implementation have been put in place. In the second step, the movement from a 10%to a 17% reduction in GHG emission occurs at an incremental cost of US$6.4 per metricton of carbon, using the option of Nepal hydro. Finally, in the third step, GHG emissionscan be cut by 20% at an incremental cost of US$10.4 per metric ton of carbon, usingclean-coal technologies (PFBC) and the opportunity to import Bangladesh gas.
Figure 4: Bihar - GHG Mitigation Option Supply Curve -Combination Scenarios Group A
1000
800
600
2D0/ Roduction
17% Reduction + Clean Coal B.Gas
i 200 -Nel -
0
S=I 15000 100 15000 20000 25 00*Z; -200-00
-400-
-6D01 0% Reduction
-800 T&D + Mni Hydro + OSM + Bapase
Cumulative C Reduction(Ktonnes)
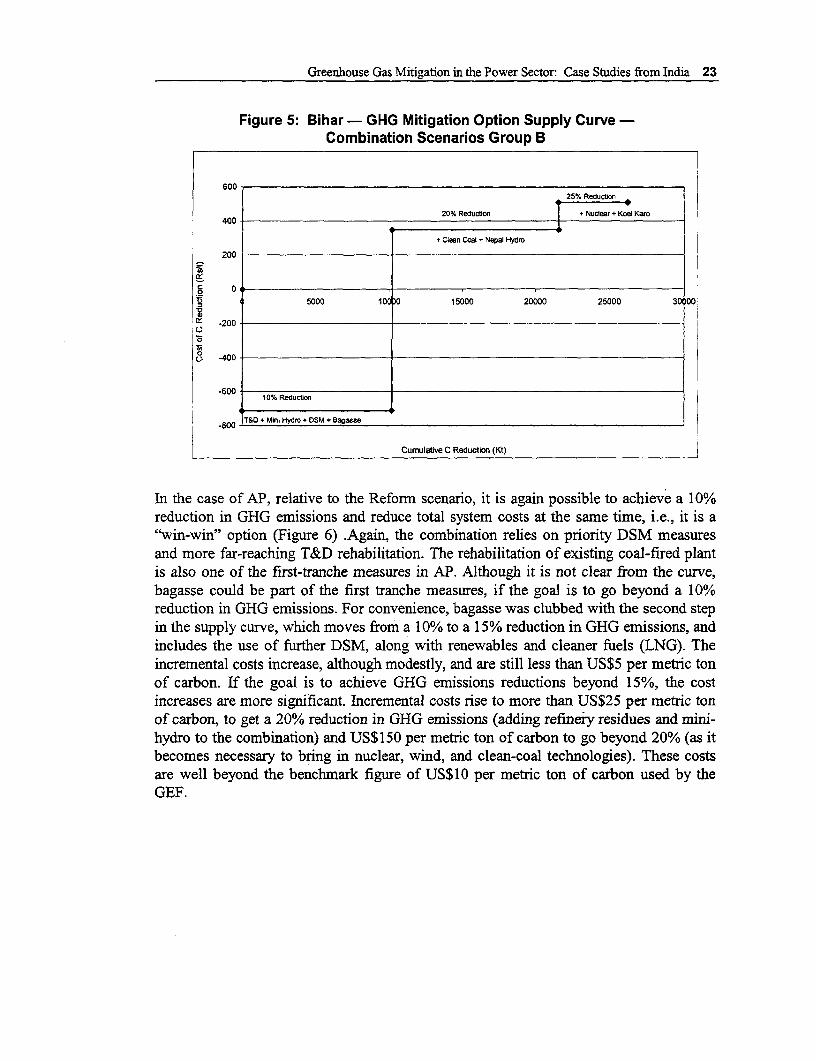
The Group B options in the first step (giving a reduction of 10% in GHG emissions) arethe same as in Group A (Figure 5). However, the much more favorable assumptions madeabout the likely technical progress of clean-coal technology bring in clean coal along withhydro from Nepal at a cost of US$8.1 per metric ton of carbon in the second step. Bothoptions are in relatively abundant supply when selected, so there is a discontinuity in thesupply curve, which jumps from 10% to 20%. At the third step, the cost-effectiveness ofGHG mitigation becomes marginal: as GHG emissions are cut from 20% to 25%,incremental cost rises to US$1 1.8/metric ton of carbon, and is realized with a large hydroplant (Koel Karo) and nuclear power. Although not shown in Figure 5, Bangladesh gascould have been used in place of Koel Karo at much the same cost.
Greenhouse Gas Mitigation in the Power Sector: Case Studies from India 23
Figure 5: Bihar - GHG Mitigation Option Supply Curve-Combination Scenarios Group B
60025% Reducfion
400 ~~~~~~~~~20% Reduction tNudear + Koel Karo400-
+ CDean Coal + Nepal Hydro
200 -
5 05000 100 )O 15000 20000 25000 30 00
-200
-400 l
-60010% Reducton
-800 T&D + Mini Hydro + DSM . Bagasse
Cumulatve C Reduction (Kt)
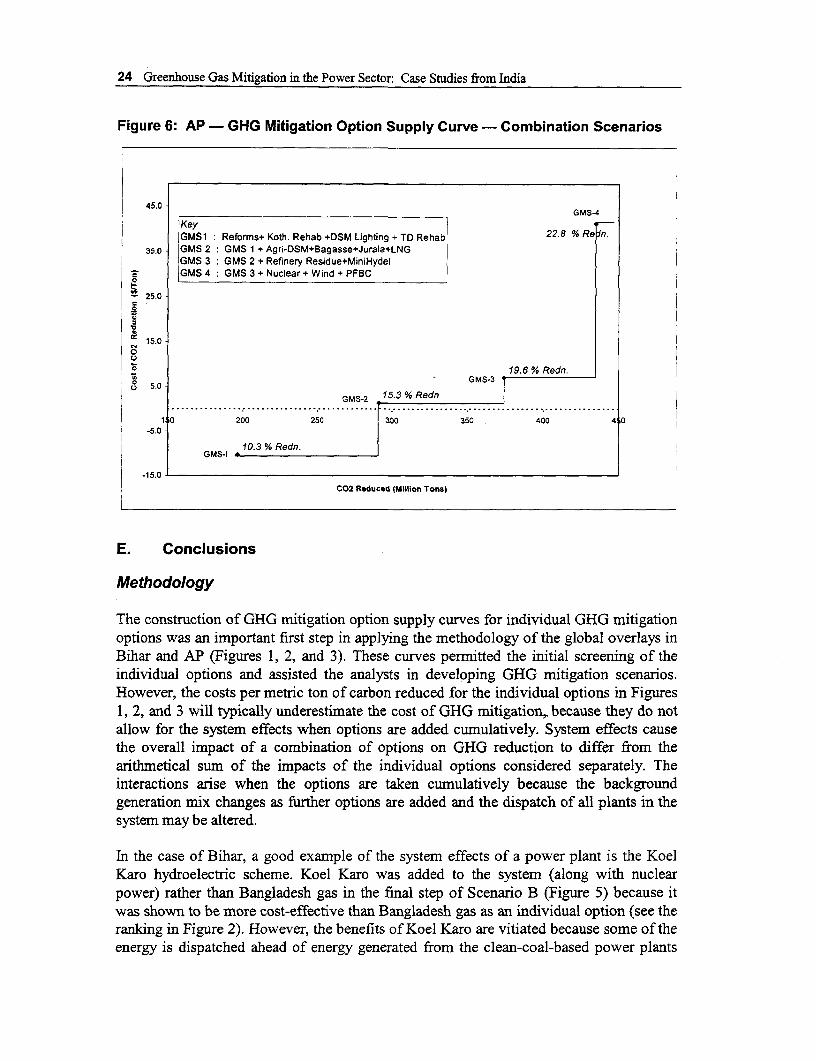
In the case of AP, relative to the Reform scenario, it is again possible to achieve a 10%reduction in GHG emissions and reduce total system costs at the same time, i.e., it is a"win-win" option (Figure 6) .Again, the combination relies on priority DSM measuresand more far-reaching T&D rehabilitation. The rehabilitation of existing coal-fired plantis also one of the first-tranche measures in AP. Although it is not clear from the curve,bagasse could be part of the first tranche measures, if the goal is to go beyond a 10%reduction in GHG emissions. For convenience, bagasse was clubbed with the second stepin the supply curve, which moves from a 10% to a 15% reduction in GHG emissions, andincludes the use of further DSM, along with renewables and cleaner fuels (LNG). Theincremental costs increase, although modestly, and are still less than US$5 per metric tonof carbon. If the goal is to achieve GHG emissions reductions beyond 15%, the costincreases are more significant. Incremental costs rise to more than US$25 per metric tonof carbon, to get a 20% reduction in GHG emissions (adding refmery residues and mini-hydro to the combination) and US$150 per metric ton of carbon to go beyond 20% (as itbecomes necessary to bring in nuclear, wind, and clean-coal technologies). These costsare well beyond the benchmark figure of US$10 per metric ton of carbon used by theGEF.
24 Greenhouse Gas Mitigation in the Power Sector: Case Studies from India
Figure 6: AP - GHG Mitigation Option Supply Curve- Combination Scenarios
45.0
350~ KeyjGMSI Reforms+ Koth. Rehab +DSM Lighting + TD Rehab' 22.8 % Re In.
35.0 |GMS 2 GMS 1 + Agri-DSM+Bagasse+Jurala+LNGIGMS 3 GMS 2 + Refinery Residue+MiniHydel
GMS 4 GMS 3 + Nuclear + Wind + PFBC
25.0
0
1:t5.0O
o0 19.6 % Redn.a - ~~~~~~~~~~~~~~~GMS-3
c., 5.0 G
GMS-2 15.3 % Redn
10 200 250 300 350 400 40 -5.0O
GMS1 t10.3 % Redn.
C02 Reduced (Million Tons)
E. Conclusions
Methodology
The construction of GHG mitigation option supply curves for individual GHG mitigationoptions was an important first step in applying the methodology of the global overlays inBihar and AP (Figures 1, 2, and 3). These curves permitted the initial screening of theindividual options and assisted the analysts in developing GHG mitigation scenarios.However, the costs per metric ton of carbon reduced for the individual options in Figures1, 2, and 3 will typically underestimate the cost of GHG mitigation, because they do notallow for the system effects when options are added cumulatively. System effects causethe overall impact of a combination of options on GHG reduction to differ from thearithmetical sum of the impacts of the individual options considered separately. Theinteractions arise when the options are taken cumulatively because the backgroundgeneration mix changes as further options are added and the dispatch of all plants in thesystem may be altered.
In the case of Bihar, a good example of the system effects of a power plant is the KoelKaro hydroelectric scheme. Koel Karo was added to the system (along with nuclearpower) rather than Bangladesh gas in the final step of Scenario B (Figure 5) because itwas shown to be more cost-effective than Bangladesh gas as an individual option (see theranking in Figure 2). However, the benefits of Koel Karo are vitiated because some of theenergy is dispatched ahead of energy generated from the clean-coal-based power plants
Greenhouse Gas Mitigation in the Power Sector: Case Studies from India 25
that were installed earlier in the sequence. As a consequence, it was found that essentiallythe same results could have been achieved by adding Bangladesh gas in place of KoelKaro, even though the cost of the former was 80% higher when taken as an individualoption. There is a further important conclusion related to the issue of system effects. Acumulative addition of options may be appropriate to achieve successive increments inGHG reduction over time, e.g., from 10% to 20% to 25%. However, a differentinvestment program may be appropriate if it is decided at the outset that the goal is toachieve a large reduction, say 25%, rather than a succession of incremental reductions inGHG emissions. There may be no point in installing a succession of thermal plants basedon clean-coal technologies if it will be necessary subsequently to install a large hydroscheme to meet the required (significant) target. The clean-coal plants might becomeredundant.
In the case of AP, system effects are also apparent in the final step of Figure 6. The costof GHG mitigation per metric ton of CC2 is substantially higher for the addition ofnuclear power, wind, and clean coal than the cost of each option individually (see Figure3). First, by adding these options cumulatively, total C0 2 equivalent is reduced by only 61million metric tons compared with the arithmetic sum of 77 million metric tons for thethree options taken individually. The reason is that a substantial impact has already beenmade on the CO2 equivalent of the system by the previous introduction of measures suchas DSM, T&D rehabilitation, hydro, and bagasse. Second, the reserve margin of thesystem must be increased to maintain the required value of LOLP, given the variablenature of wind energy, so that the capital costs of the combination are multiplied.
Results
According to the results of these two global overlays, the options identified could reduceGHG emissions by 20% in Bihar and AP (i.e., by about 1 million and 19 million metrictons annually, respectively) at an incremental cost of roughly US$8 to US$10 per metricton of carbon equivalent in Bihar; and about US$26/metric ton of carbon equivalent inAP. The costs of the individual measures vary widely:
* Even if power sector reforms are implemented, there are likely to be unexploitedopportunities to reduce GHG emissions and total system costs in tandem. Theanalysis shows that more aggressive DSM measures, additional T&D lossreduction, and a focus on renewables such as bagasse are highly cost-effective oreven "win-win." Ideally, these opportunities would be taken up under Reforms asa matter of good business practice, once the incentive system has beenrationalized, but realistically, special policy measures may be required in theshort- and even medium-term if GHG emissions are to be brought down as amatter of priority.
* Mini-hydro is "win-win" in Bihar and offers the low GHG mitigation cost ofUS$4/metric ton of carbon equivalent in AP and should therefore be examinedclosely as a GHG reduction strategy. However, it is case-specific and its potential
26 Greenhouse Gas Mitigation in the Power Sector: Case Studies from India
in practice is probably small relative to the size of the goals for GHG reductionthat are likely to face most countries.
* Large and medium hydro schemes may also be effective, with costs ofUS$13.4/metric ton of carbon for Koel Karo in Bihar and minus US$8.4/metricton of carbon for Jurala in AP. But their feasibility depends very much on specificcircumstances and the social and environmental costs they create may be muchmore significant than recognized here.
* For Bihar, imported energy supplies from Nepal and Bangladesh promise to yieldsignificant environmental benefits. Obviously prices would have to be negotiatedthat would make them sufficiently attractive, from an economic and financialviewpoint, to be adopted in a reformed power system. The Bihar case studysuggests that Nepal hydro imports would be the higher priority, based on existinginformation. For AP, imported LNG needs special mention. Although total systemcosts increased when LNG was added to the Reform scenario, the effect wasmarginal. The results are very sensitive to the assumptions made about capital andoperating costs. The sensitivity analysis indicates that, for relatively smallreductions in these costs, the LNG option would displace imported coal in theReform scenario, reducing total system costs and thereby joining the list of "win-win" options. The cost of LNG as a fuel choice for carbon reduction wasestimated at less than US$ 1/metric ton of carbon equivalent.
* Clean-coal technologies, such as PFBC and IGCC, seem to be among the morecostly options at present for GHG emission reduction, especially in AP (nearlyUS$33/metric ton of carbon equivalent). But the more favorable assumptions forPFBC used for the Group B options in Bihar show that clean-coal technologiesmay well have a significant future role to play in seeking larger reductions ofGHG emissions because they could offer a way to use the substantial availabilityof domestic coal more efficiently.
* Solar PVs, wind, and coal washing seem to be the most expensive carbonreduction options, with costs exceeding US$100/metric ton of carbon equivalentfor solar PVs (in both AP and Bihar), US$22/metric ton of carbon equivalent forwind (in AP), US$85/metric ton of carbon equivalent for coal washing in Bihar,and nearly US$170/metric ton of carbon equivalent for coal washing in AP. Whilethese options are not cost-effective for reducing GHG emissions, they certainlyhave other advantages, such as offering a decentralized power supply and areduction of local pollution, such as ash.
* The work done in the course of the AP case study for EIPS and the AP globaloverlay strongly suggests that the use of refinery residues for power generation isworth exploring further. Preliminary analysis indicated that it might beeconomical at most refinery locations in India, and a number of existing andproposed refineries have prepared feasibility reports and identified joint venture
Greenhouse Gas Mitigation in the Power Sector: Case Studies from India 27
partners. At the time of the case study, there were proposals to set up almost 3,500MW of capacity, using residual fuel oil in India. It was expected that somepercentage of this would be located in AP. While the associated environmentalproblems are not well documented, sulphur dioxide and NO2 emissions could bea problem. In terms of GHG emissions, the AP global overlay placed refineryresidues very high in the cost-effectiveness ranking, at US$3.3/metric ton ofcarbon equivalent.
* Nuclear power appears to be a relatively unattractive carbon reduction option oncost grounds. Although the specific cost of carbon reduction for nuclear power asa single option, in both Bihar and AP, was about US$10/metric ton, it appeared inthe mitigation scenarios only when very substantial target reductions wereenvisaged. Furthermore, both global overlays clearly recognized that the economicand environmental case for nuclear power would be further undermined if furtherallowance is made for the costs of handling nuclear fuel and disposing of nuclearwaste fuel and the risks of nuclear accidents.
Finally, both case studies found a close correlation between the local and global benefitsof the options. The emissions of local pollutants (NO,, SO,,, and PM) decline almostunifonnly in step with GHG emissions, as seen in Annex IV. 1 for Bihar and Annex IV.2for AP. The decline reflects the steady drop in coal consumption in both power sectors ascarbon reduction proceeds (Annex IV.3). The only exception, which is very minor, occursin Bihar's Group A combination: when GHG emissions are reduced from 17% to 20%,NO, emissions go up by 0.2%. Although at first sight the result seems counter-intuitive,it is another of the system effects mentioned in the previous section, combined with thechoice of time horizon and discounting. The reason is that the GHG mitigation optionsdisplaced new low-NO, thermal units and, in some instances, more energy will bedispatched from existing higher-NO, thermal units in the short term. If the time horizonfor discounting local pollutants were extended beyond 20 years, these short-termdispatching effects could be expected to disappear.

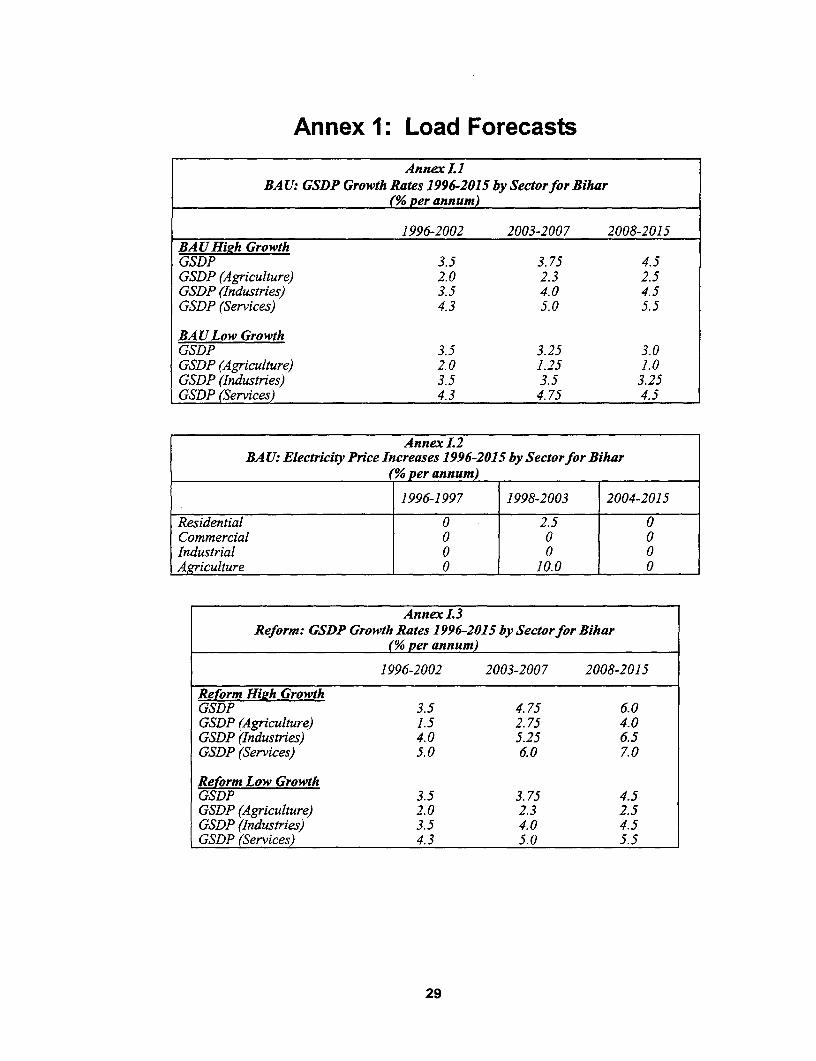
Annex 1: Load Forecasts
Annex 1.BA U: GSDP Growth Rates 1996-2015 by Sector for Bihar
(% per annum)
1996-2002 2003-2007 2008-2015BAUHigh GrowthGSDP 3.5 3.75 4.5GSDP (Agriculture) 2.0 2.3 2.5GSDP (Industries) 3.5 4.0 4.5GSDP (Services) 4.3 5.0 5.5
BAULow GrowthGSDP 3.5 3.25 3.0GSDP (Agriculture) 2.0 1.25 1.0GSDP (Industries) 3.5 3.5 3.25GSDP (Services) 4.3 4.75 4.5
Annex L2BA U: Electricity Price Increases 1996-2015 by Sector for Bihar
(% per annum)
1996-1997 1998-2003 2004-2015
Residential 0 2.5 0Commercial 0 0 0Industrial 0 0 0Agriculture 0 10.0 0
Annex L3Reform: GSDP Growth Rates 1996-2015 by Sectorfor Bihar
(% per annum)
1 996-2002 2003-2007 2008-2015
Reform Hieh GrowthGSDP 3.5 4.75 6.0GSDP (Agriculture) 1.5 2.75 4.0GSDP (Industries) 4.0 5.25 6.5GSDP (Services) 5.0 6.0 7.0
Reform Low GrowthGSDP 3.5 3.75 4.5GSDP (Agriculture) 2.0 2.3 2.5GSDP (Industries) 3.5 4.0 4.5GSDP (Services) 4.3 5.0 5.5
29
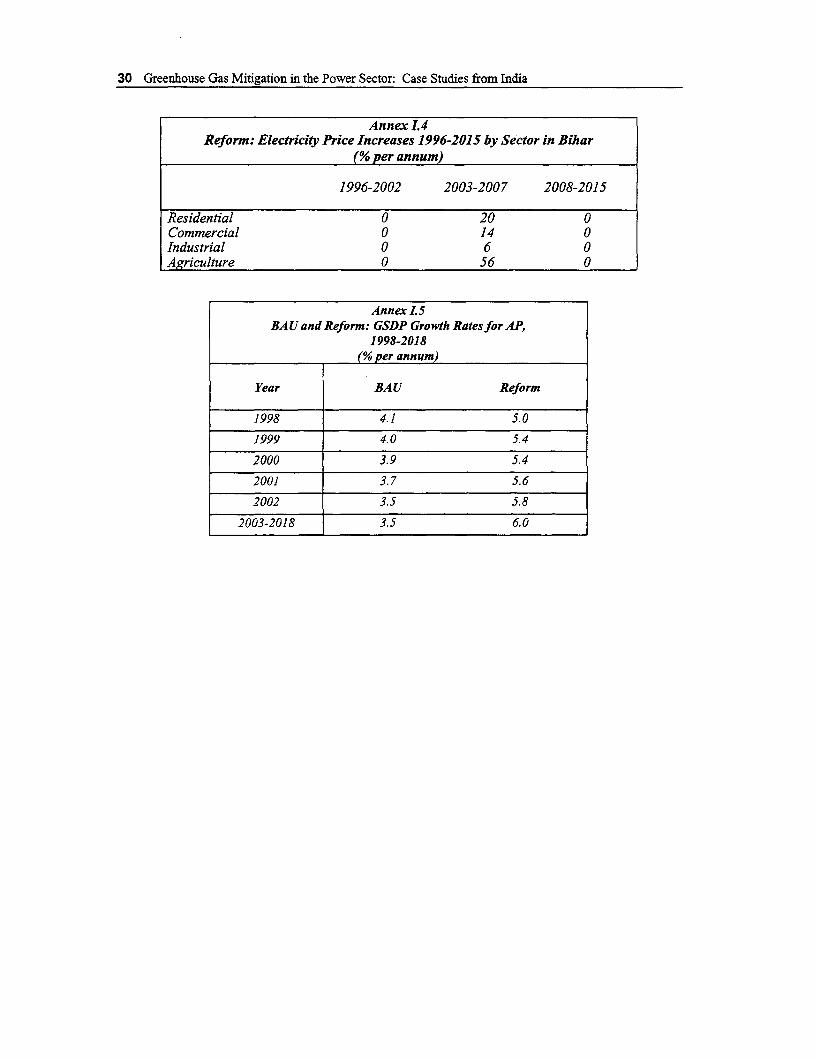
30 Greenhouse Gas Mitigation in the Power Sector: Case Studies from India
Annex I.4Reform: Electricity Price Increases 1996-2015 by Sector in Bihar
(% per annum)
1996-2002 2003-2007 2008-2015
Residential 0 20 0Commercial 0 14 0Industrial 0 6 0Agriculture 0 56 0
AnnexLI.5BAU and Reform: GSDP Growth Rates for AP,
1998-2018(% per annum)
Year BAU Reform
1998 4.1 5.0
1999 4.0 5.4
2000 3.9 5.4
2001 3.7 5.6
2002 3.5 5.8
2003-2018 3.5 6.0
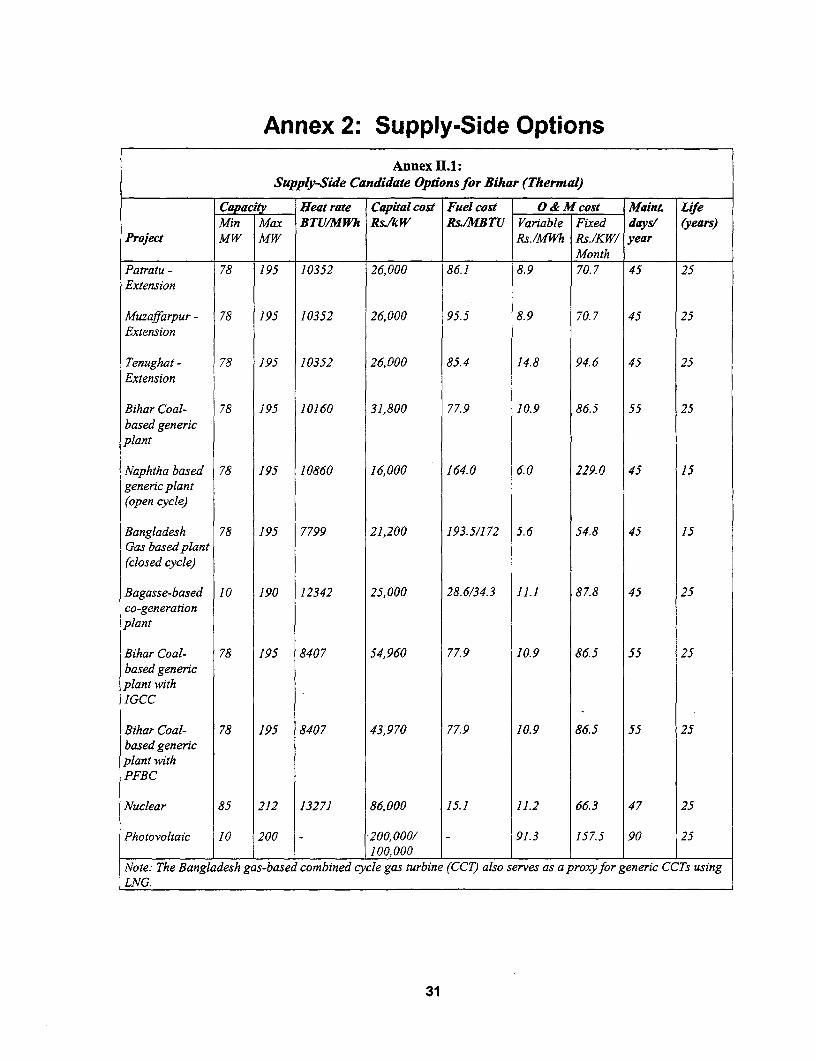
Annex 2: Supply-Side OptionsAnnex 11.1:
Supply-Side Candidate Options for Bihar (Thermal)
Capacdiy Heat rate Capital cost Fuel cost O & M cost Maint LifeMin Max BTU/MWh RsIkW Rs./MBTU Variable Fixed days' (years)
Project MW MW Rs./MWh Rs./KW/ year______________ _____ __________ ~M onth _ _ _ _
Patratu - 78 195 10352 26,000 86.1 8.9 70.7 45 25Extension
Muzaffarpur - 78 195 10352 26,000 95.5 8.9 70.7 45 25Extension
Tenughat- 78 195 10352 26,000 85.4 14.8 94.6 45 25Extension
Bihar Coal- 78 195 10160 31,800 77.9 10.9 86.5 55 25based genericplant
Naphtha based 78 195 10860 16,000 164.0 6.0 229.0 45 15generic plant(open cycle)
Bangladesh 78 195 7799 21,200 193.5/172 5.6 54.8 45 15Gas based plant(closed cycle)
Bagasse-based 10 190 12342 25,000 28.6/34.3 11.1 87.8 45 25co-generationplant
Bihar Coal- 78 195 8407 54,960 77.9 10.9 86.5 55 25based genericplant withIGCC
Bihar Coal- 78 195 8407 43,970 77.9 10.9 86.5 55 25based genericplant withPFBC
Nuclear 85 212 13271 86,000 15.1 11.2 66.3 47 25
Photovoltaic 10 200 - 200,000/ - 91.3 157.5 90 25_____ _____ _________ 100,000 I I
Note: The Bangladesh gas-based combined cycle gas turbine (CCT) also serves as a proxy for generic CCTs usingLNG.
31
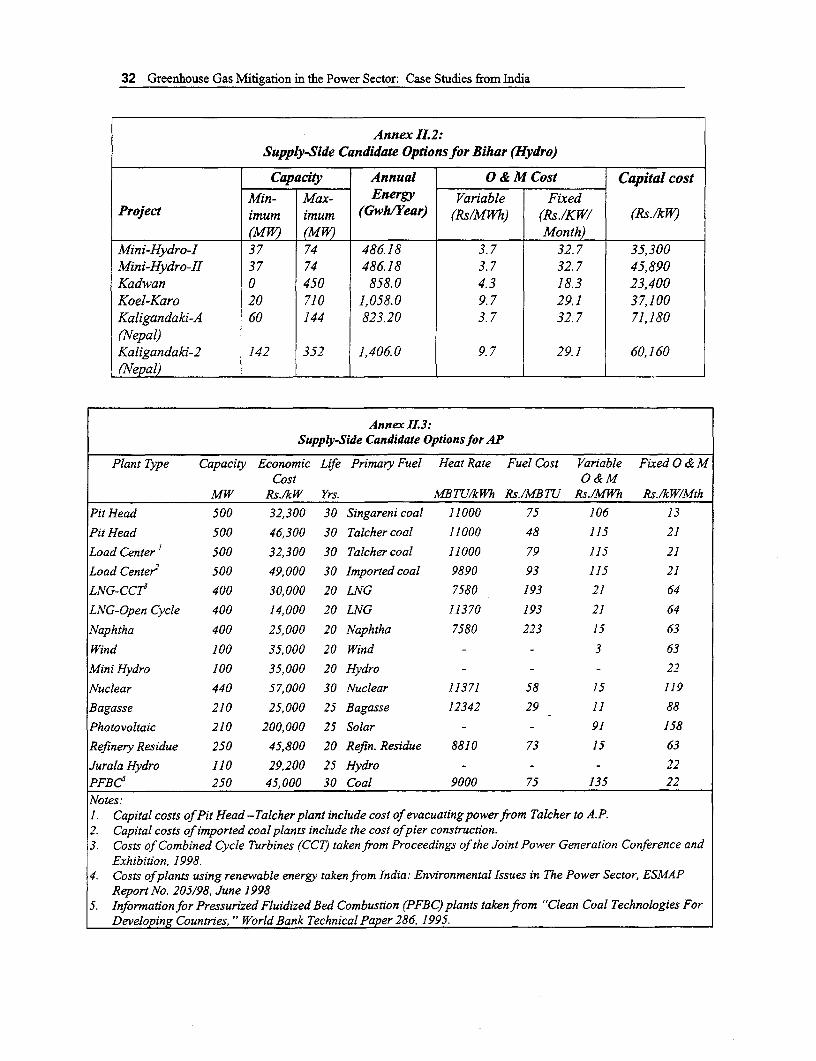
32 Greenhouse Gas Mitigation in the Power Sector: Case Studies from India
Annex 112:Supply-Side Candidate Optionsfor Bihar (Hydro)
Capacity Annual 0 & M Cost Capital costMin- Max- Energy Variable Fixed
Project imum imum (Gwh/Year) (Rs/MWEh) (Rs./KW/ (Rs./k P)
(MW) (MW) Month)Mini-Hydro-I 37 74 48618 3.7 32.7 35,300Mini-Hydro-II 37 74 486.18 3.7 32.7 45,890Kadwan 0 450 858.0 4.3 18.3 23,400Koel-Karo 20 710 1,058.0 9.7 29.1 37,100Kaligandaki-A 60 144 823.20 3.7 32.7 71,180(Nepal)Kaligandaki-2 142 352 1,406.0 9.7 29.1 60,160(Nepal)
Annex I1.3:Supply-Side Candidate Optionsfor AP
Plant Type Capacity Economic Life Primary Fuel Heat Rate Fuel Cost Variable Fixed O & MCost O&M
MW Rs./kW Yrs. MBTU/kWh Rs./MBTU Rs./MWh Rs./kW/Mth
Pit Head 500 32,300 30 Singareni coal 11000 75 106 13
Pit Head 500 46,300 30 Talcher coal 11000 48 115 21
Load Center' 500 32,300 30 Talcher coal 11000 79 115 21
Load Center2 500 49,000 30 Imported coal 9890 93 115 21
LNG-CCT3 400 30,000 20 LNG 7580 193 21 64
LNG-Open Cycle 400 14,000 20 LNG 11370 193 21 64
Naphtha 400 25,000 20 Naphtha 7580 223 15 63
Wind 100 35,000 20 Wind - - 3 63
Mini Hydro 100 35,000 20 Hydro - - - 22
Nuclear 440 57,000 30 Nuclear 11371 58 15 119
Bagasse 210 25,000 25 Bagasse 12342 29 11 88
Photovoltaic 210 200,000 25 Solar - - 91 158
Refinery Residue 250 45,800 20 Refin. Residue 8810 73 15 63
Jurala Hydro 110 29,200 25 Hydro - - - 22PFBC5 250 45,000 30 Coal 9000 75 135 22Notes:1. Capital costs of Pit Head -Talcher plant include cost of evacuating power from Talcher to A.P.2. Capital costs of imported coal plants include the cost ofpier construction.3. Costs of Combined Cycle Turbines (CCT) taken from Proceedings of the Joint Power Generation Conference and
Exhibition, 1998.4. Costs ofplants using renewable energy taken from India: Environmental Issues in The Power Sector, ESMAP
Report No. 205/98, June 19985. Information for Pressurized Fluidized Bed Combustion (PFBC) plants taken from "Clean Coal Technologies For
Developing Countries, " World Bank Technical Paper 286, 1995.
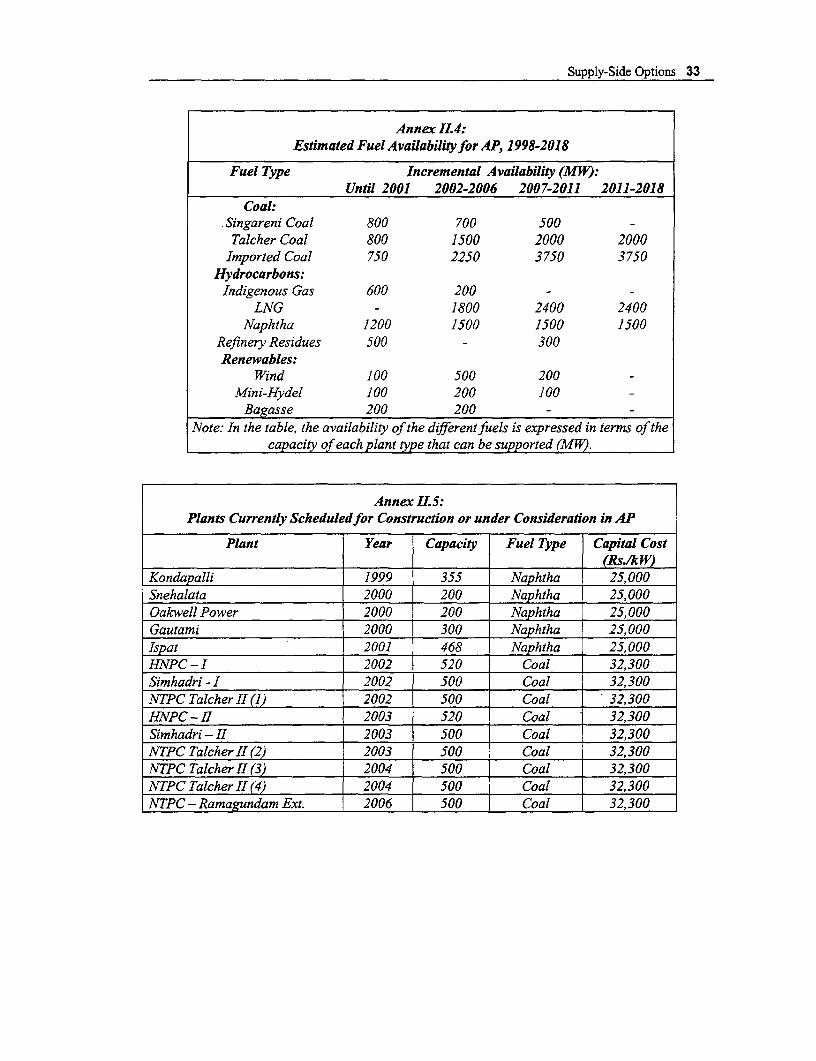
Supply-Side Options 33
Annex I1.4:Estimated Fuel Availability for AP, 1998-2018
Fuel Type Incremental Availability (MW):Until 2001 2002-2006 2007-2011 2011-2018
Coal.Singareni Coal 800 700 500 -
Talcher Coal 800 1500 2000 2000Imported Coal 750 2250 3750 3750
Hydrocarbons:Indigenous Gas 600 200 - -
LNG - 1800 2400 2400Naphtha 1200 1500 1500 1500
Refinery Residues 500 - 300Renewables:
Wind 100 500 200 -
Mini-Hydel 100 200 100Bagasse 200 200 -
|Note: In the table, the availability of the different fuels is expressed in tenns of thecapacity of each plant type that can be supported (MWV).
Annex 11.5:Plants Currently Scheduledfor Construction or under Consideration in AP
Plant Year Capacity Fuel Type Capital Cost~~~~~~~~(Rs.1k W)
Kondapalli 1999 355 Naphtha 25,000Snehalata 2000 200 Naphtha 25,000Oakwell Power 2000 200 Naphtha 25,000Gautami 2000 300 Naphtha 25,000Ispat 2001 468 Naphtha 25,000HNPC - I 2002 520 Coal 32,300Simhadri - I 2002 500 Coal 32,300NTPC Talcher 11(1) 2002 500 Coal 32,300HNPC - II 2003 520 Coal 32,300Simhadri - II 2003 500 Coal 32,300NTPC TalcherII (2) 2003 500 Coal 32,300NTPC Talcher 11( 3) 2004 500 Coal 32,300NTPC Talcher II6(4) 2004 500 Coal 32,300NTPC - Ramagundam Ext. 2006 500 Coal 32,300
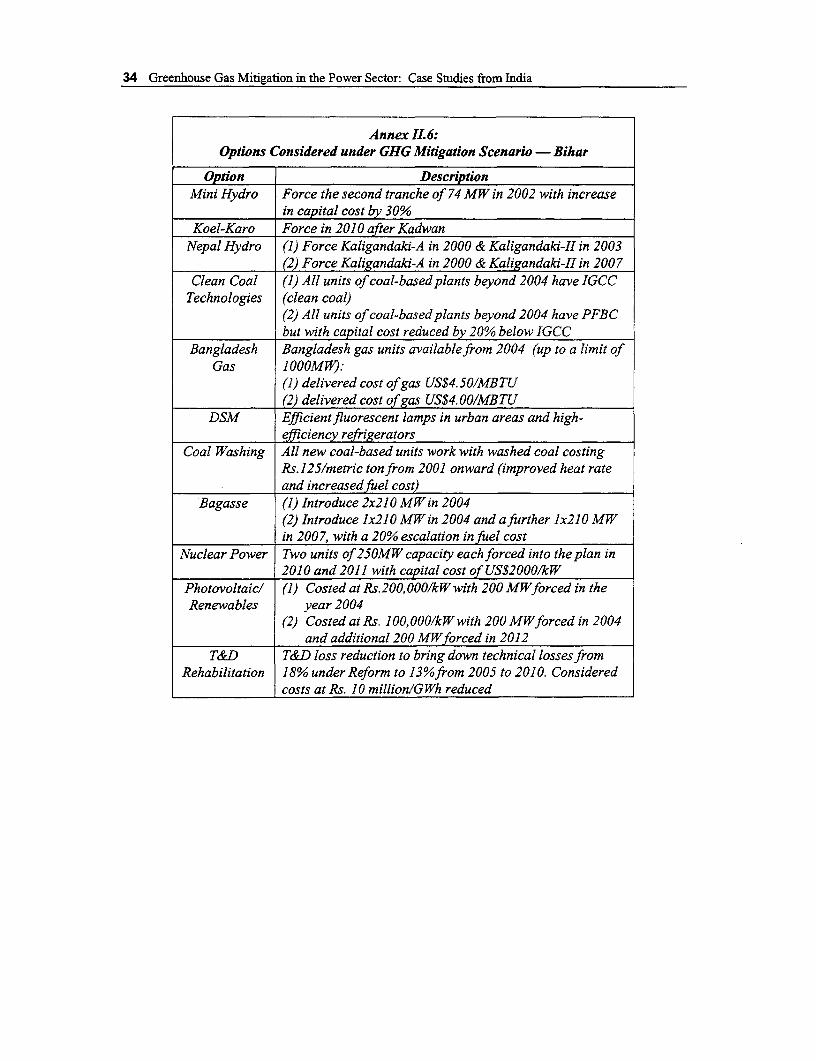
34 Greenhouse Gas Mitigation in the Power Sector: Case Studies from India
Annex II.6:Options Considered under GHG Mitigation Scenario - Bihar
Opiion DescriptionMini Hydro Force the second tranche of 74 MW in 2002 with increase
in capital cost by 30%Koel-Karo Force in 2010 after Kadwan
Nepal Hydro (1) Force Kaligandaki-A in 2000 & Kaligandaki-II in 2003(2) Force Kaligandaki-A in 2000 & Kaligandaki-II in 2007
Clean Coal (1) All units of coal-based plants beyond 2004 have IGCCTechnologies (clean coal)
(2) All units of coal-based plants beyond 2004 have PFBCbut with capital cost reduced by 20% below IGCC
Bangladesh Bangladesh gas units available from 2004 (up to a limit ofGas 1000MW):
(1) delivered cost of gas US$4.50/MBTU(2) delivered cost of gas US$4. 00/MBTU
DSM Efficientfluorescent lamps in urban areas and high-efficiency refrigerators
Coal Washing All new coal-based units work with washed coal costingRs. 125/metric ton from 2001 onward (improved heat rateand increased fuel cost)
Bagasse (1) Introduce 2x210 MW in 2004(2) Introduce lx210 MWin 2004 and a further 1x210 MWin 2007, with a 20% escalation in fuel cost
Nuclear Power Two units of25OMW capacity each forced into the plan in2010 and 2011 with capital cost of US$20001/kW
Photovoltaicl (1) Costed atRs.200,000/kWwith 200MWforced in theRenewables year 2004
(2) Costed at Rs. 100,000/kW with 200 MWforced in 2004and additional 200 MWforced in 2012
T&D T&D loss reduction to bring down technical losses fromRehabilitation 18% under Reform to 13%from 2005 to 2010. Considered
costs at Rs. 10 million/GWh reduced
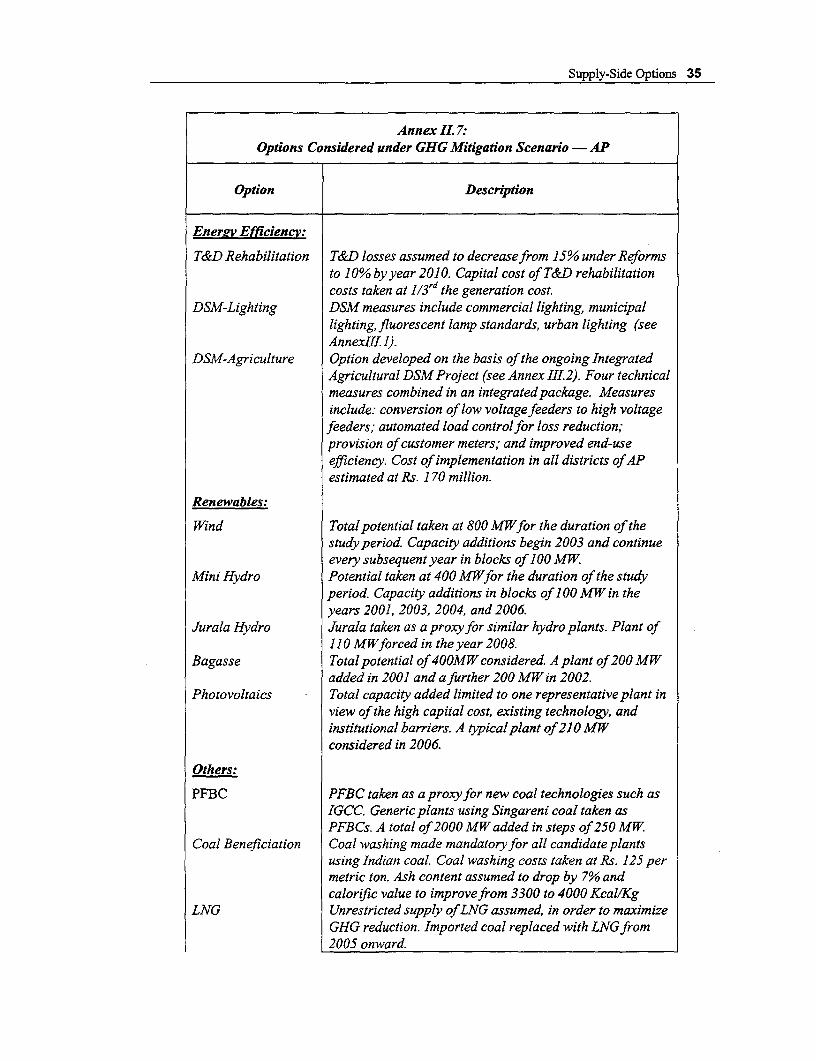
Supply-Side Options 35
Annex II. 7:Options Considered under GHG Mitigation Scenario -AP
Option Description
Enermy Efficiency:
T&D Rehabilitation T&D losses assumed to decrease from 15% under Reformsto 10% by year 2010. Capital cost of T&D rehabilitationcosts taken at 1 /3rd the generation cost.
DSM-Lighting DSM measures include commercial lighting, municipallighting, fluorescent lamp standards, urban lighting (seeAnnexIll. l).
DSM-Agriculture Option developed on the basis of the ongoing IntegratedAgricultural DSM Project (see Annex 111.2). Four technicalmeasures combined in an integrated package. Measuresinclude: conversion of low voltage feeders to high voltage
feeders; automated load controlfor loss reduction;provision of customer meters; and improved end-useefficiency. Cost of implementation in all districts of APestimated at Rs. 170 million.
Renewables:
Wind Total potential taken at 800 MWfor the duration of thestudy period. Capacity additions begin 2003 and continueevery subsequent year in blocks of 100MW.
Mini Hydro Potential taken at 400 MWfor the duration of the studyperiod. Capacity additions in blocks of 100 MW in theyears 2001, 2003, 2004, and 2006.
Jurala Hydro Jurala taken as a proxyfor similar hydro plants. Plant of110 MWforced in the year 2008.
Bagasse Total potential of 400MW considered. A plant of 200 MWadded in 2001 and a further 200 MW in 2002.
Photovoltaics - Total capacity added limited to one representative plant inview of the high capital cost, existing technology, andinstitutional barriers. A typical plant of 210 MWconsidered in 2006.
Others:
PFBC PFBC taken as a proxy for new coal technologies such asIGCC. Generic plants using Singareni coal taken asPFBCs. A total of 2000 MW added in steps of 250 MWV
Coal Beneficiation Coal washing made mandatory for all candidate plantsusing Indian coal. Coal washing costs taken at Rs. 125 permetric ton. Ash content assumed to drop by 7% andcalorific value to improve from 3300 to 4000 Kcal/Kg
LNG Unrestricted supply of LNG assumed, in order to maximizeGHG reduction. Imported coal replaced with LNG from2005 onward.
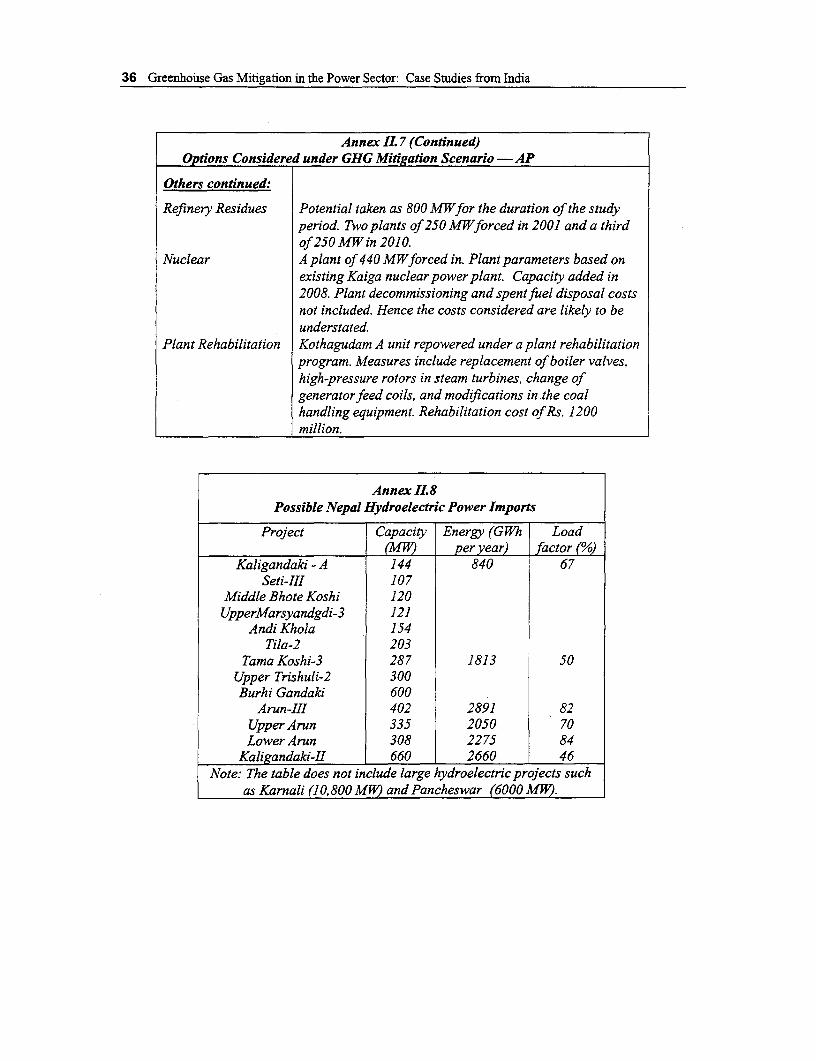
36 Greenhouse Gas Mitigation in the Power Sector: Case Studies from India
Annex IL 7 (Continued)Options Considered under GHG Mitigation Scenario - AP
Others continued:
Refinery Residues Potential taken as 800 MWfor the duration of the studyperiod. Two plants of 250 MWforced in 2001 and a thirdof 250 MWin 2010.
Nuclear A plant of 440 MWforced in. Plant parameters based onexisting Kaiga nuclear power plant. Capacity added in2008. Plant decommissioning and spent fuel disposal costsnot included. Hence the costs considered are likely to beunderstated.
Plant Rehabilitation Kothagudam A unit repowered under a plant rehabilitationprogram. Measures include replacement of boiler valves,high-pressure rotors in steam turbines, change ofgeneratorfeed coils, and modifications in the coalhandling equipment. Rehabilitation cost of Rs. 1200million.
Annex I1.8Possible Nepal Hydroelectric Power Imports
Project Capacity Energy (GWh Load(MW) peryear) factor (/)
Kaligandaki - A 144 840 67Seti-III 107
Middle Bhote Koshi 120UpperMarsyandgdi-3 121
Andi Khola 154Tila-2 203
Tama Koshi-3 287 1813 50Upper Trishuli-2 300Burhi Gandaki 600
A run-III 402 2891 82Upper Arun 335 2050 70Lower Arun 308 2275 84
Kaligandaki -II 660 2660 46Note: The table does not include large hydroelectric projects such
as Karnali (10,800MW) and Pancheswar (6000MW).
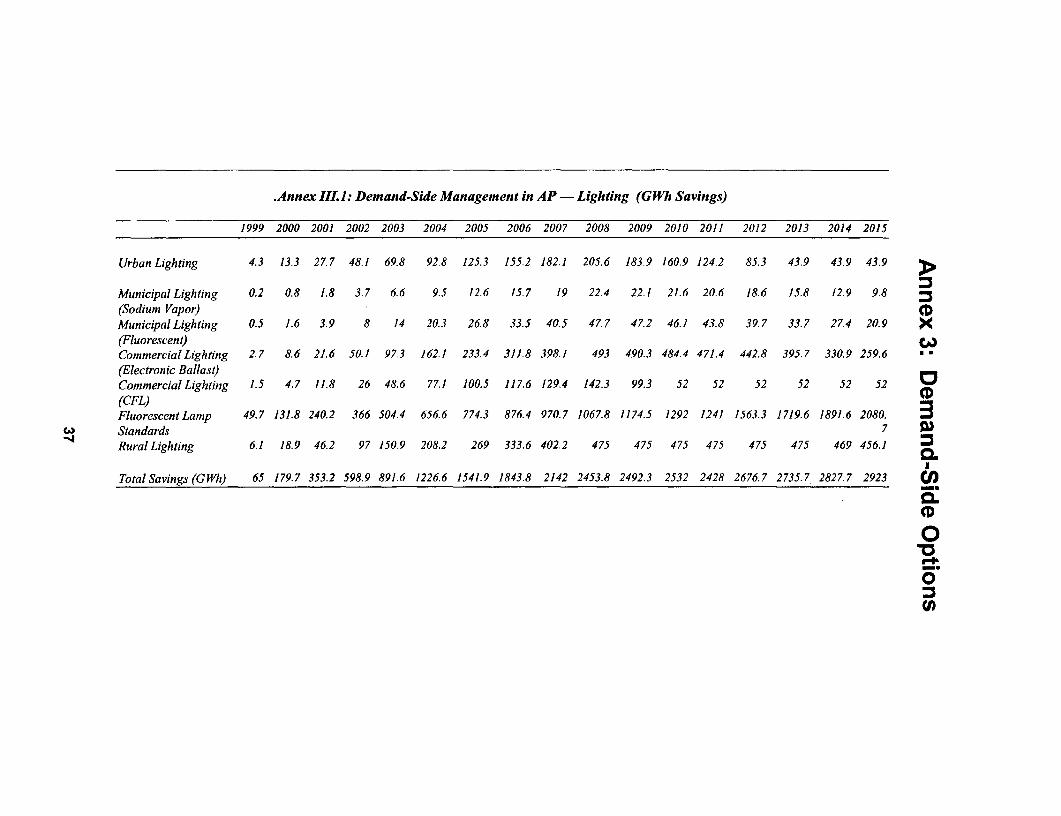
.Annex III. : Demand-Side Management in AP - Lighting (GWh Savings)
1999 2000 2001 2002 2003 2004 2005 2006 2007 2008 2009 2010 2011 2012 2013 2014 2015
Urban Lighting 4.3 13.3 27.7 48.1 69.8 92.8 125.3 155.2 182.1 205.6 183.9 160.9 124.2 85.3 43.9 43.9 43.9 >
Municipal Lighting 0.2 0.8 1.8 3.7 6.6 9.5 12.6 15.7 19 22.4 22.1 21.6 20.6 18.6 15.8 12.9 9.8(Sodium Vapor) SDMunicipal Lighting 0.5 1.6 3.9 8 14 20.3 26.8 33.5 40.5 47.7 47.2 46.1 43.8 39.7 33.7 27.4 20.9 X(Fluorescent)CommercialLighting 2.7 8.6 21.6 50.1 97.3 162.1 233.4 311.8 398.1 493 490.3 484.4 471.4 442.8 395.7 330.9 259.6(Electronic Ballast)Commercial Lighting 1.5 4.7 11.8 26 48.6 77.1 100.5 117.6 129.4 142.3 99.3 52 52 52 52 52 52(CFL) (DFluorescent Lamp 49.7 131.8 240.2 366 504.4 656.6 774.3 876.4 970.7 1067.8 1174.5 1292 1241 1563.3 1719.6 1891.6 2080. aStandards 7 WRural Lighting 6.1 18.9 46.2 97 150.9 208.2 269 333.6 402.2 475 475 475 475 475 475 469 456.1
Total Savings (GCWh) 65 179.7 353.2 598.9 891.6 1226.6 1541.9 1843.8 2142 2453.8 2492.3 2532 2428 2676.7 2735.7 2827.7 2923 C
(D
0
C,)
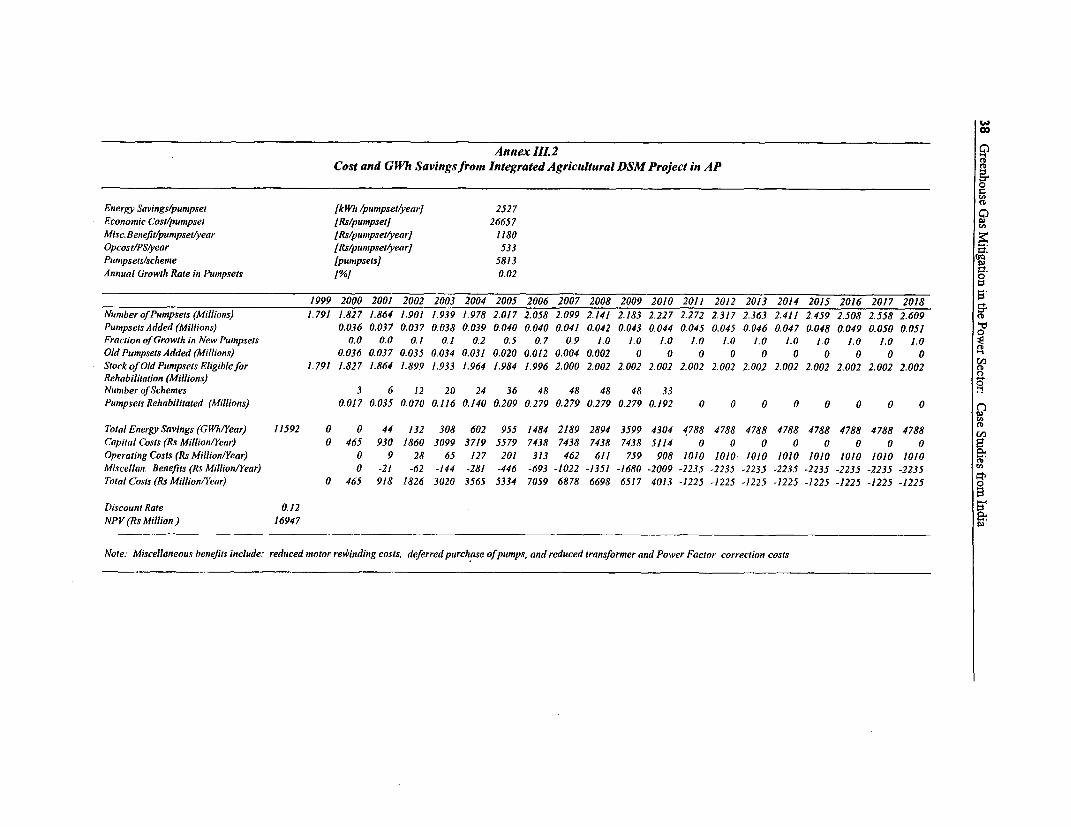
Annex II1212Cost and GWh Savingsfrom Integrated Agricultural DSM Project in AP
Energy Savings/pumpset [kWh /pumpset/yearl 2527 Q
Economic Cost/pumpset [Rs/pumpset] 26657 P
Misc.Benefit/pumpset/year [Rs/pumpset/yearJ 1180Opcost/PS/year [Rs/pumpset/yearl 533
Pumnpsets/scheme [pumipsets] 5813 r;.
Annual Growth Rate in Pumpsets [%] 0.02 0
1999 2000 2001 2002 2003 2004 2005 2006 2007 2008 2009 2010 2011 2012 2013 2014 2015 2016 2017 2018 _
Number of Pumpsets (Millions) 1.791 1.827 1.864 1.901 1.939 1.978 2.017 2.058 2.099 2.141 2.183 2.227 2.272 2.317 2.363 2.411 2.459 2.508 2.558 2.609 C
Pumpsels Added (Millions) 0.036 0.037 0.037 0.038 0.039 0.040 0.040 0.041 0.042 0.043 0.044 0.045 0.045 0.046 0.047 0.048 0.049 0.050 0.051 o
Fraction of Growth in New Pumpsets 0.0 0.0 0.1 0.1 0.2 0.5 0.7 0.9 1.0 1.0 1.0 1.0 1.0 1.0 1.0 1.0 1.0 1.0 1.0
Old Ptmpsets Added (Millions) 0.036 0.037 0.035 0.034 0.031 0.020 0.012 0.004 0.002 0 0 0 0 0 0 0 0 0 0
Stock of Old Pumpsets Eligiblefor 1.791 1.827 1.864 1.899 1.933 1.964 1.984 1.996 2.000 2.002 2.002 2.002 2.002 2.002 2.002 2.002 2.002 2.002 2.002 2.002 CD
Rehabilitation (Millions) o0Numiber of Schemes 3 6 12 20 24 36 48 48 48 48 33
Pumpsets Rehabilitated (Millions) 0.017 0.035 0.070 0.116 0.140 0.209 0.279 0.279 0.279 0.279 0.192 0 0 0 0 0 0 0 0
Total Energy Savings (GWh/Year) 11592 0 0 44 132 308 602 955 1484 2189 2894 3599 4304 4788 4788 4788 4788 4788 4788 4788 4788 0
Capital Costs (Rs Million/Year) 0 465 930 1860 3099 3719 5579 7438 7438 7438 7438 5114 0 0 0 0 0 0 0 0
Operating Costs (Rs Million/Year) 0 9 28 65 127 201 313 462 611 759 908 1010 1010 1010 1010 1010 1010 1010 1010
Miscellan. Benefits (Rs Million/Year) 0 -21 -62 -144 -281 -446 -693 -1022 -1351 -1680 -2009 -2235 -2235 -2235 -2235 -2235 -2235 -2235 -2235
Total Costs (Rs Million/Year) 0 465 918 1826 3020 3565 5334 7059 6878 6698 6517 4013 -1225 -1225 -1225 -1225 -1225 -1225 -1225 -1225 0
Discount Rate 0.12NP V (Rs Million) 16947
Note: Miscellaneous benefits include: reduced motor rewinding costs, deferred purchase of pumps, and reduced transformer and Power Factor correction costs
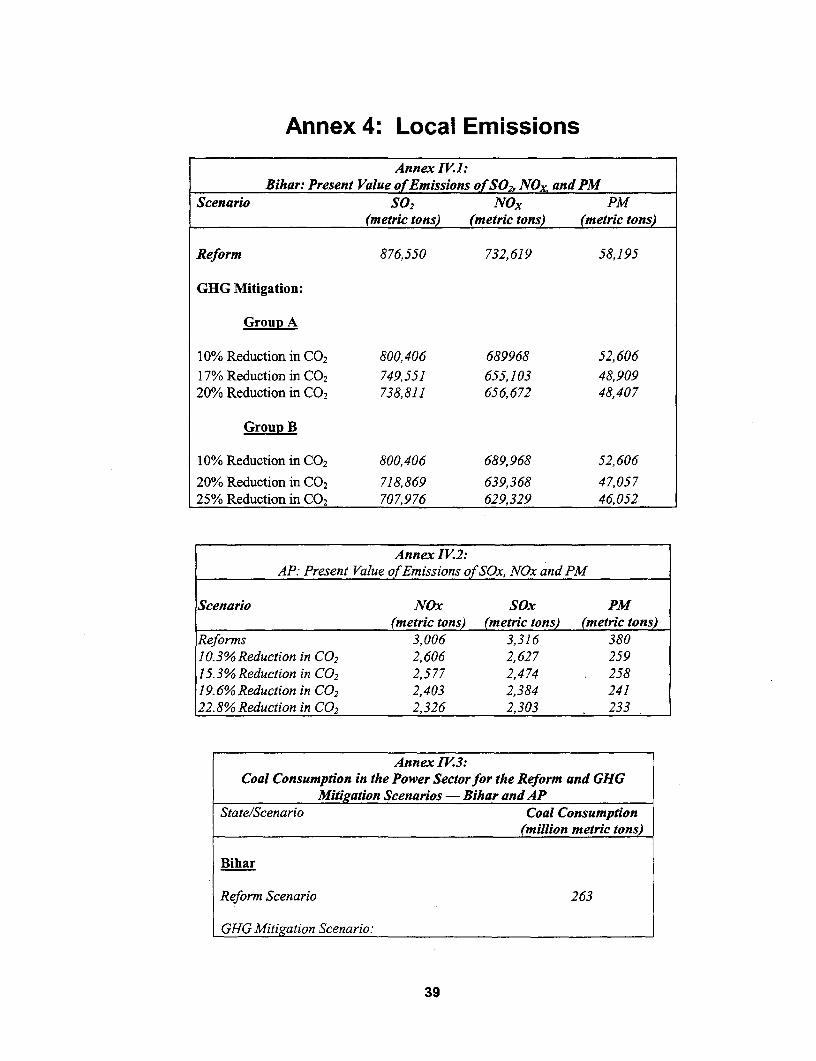
Annex 4: Local Emissions
Annex IVI:Bihar: Present Value of Emissions of SO2, NOx, and PM
Scenario SO2 NOx PM(metric tons) (metric tons) (metric tons)
Reform 876,550 732,619 58,195
GHG Mitigation:
Group A
10% Reduction in C0 2 800,406 689968 52,60617% Reduction in C0 2 749,551 655,103 48,90920% Reduction in C0 2 738,811 656,672 48,407
Group B
10% Reduction in C02 800,406 689,968 52,606
20% Reduction in C0 2 718,869 639,368 47,05725% Reduction in C02 707,976 629,329 46,052
Annex IV.2:AP: Present Value of Emissions of SOx, NOx and PM
Scenario NOx SOx PM(metric tons) (metric tons) (metric tons)
Reforms 3,006 3,316 38010.3% Reduction in CO2 2,606 2,627 25915.3% Reduction in CO2 2,577 2,474 25819.6% Reduction in C0 2 2,403 2,384 24122.8% Reduction in CO2 2,326 2,303 233
Annex IV.3:Coal Consumption in the Power Sector for the 12eform and GHG
Mifigation Scenarios -Bihar and APState/Scenario Coal Consumption
(million metric tons)
Bihar
Reform Scenario 263
GHG Mitigation Scenario:
39
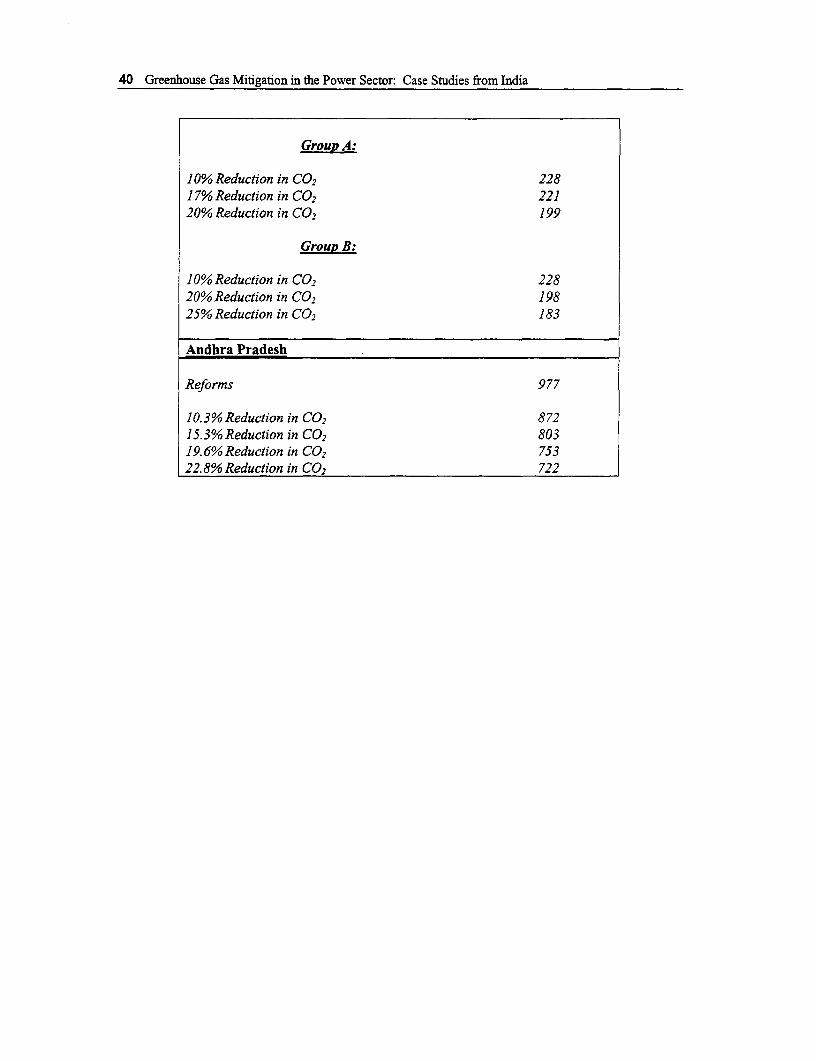
40 Greenhouse Gas Mitigation in the Power Sector: Case Studies from India
Group A:
10% Reduction in CO2 228
17% Reduction in C02 22120% Reduction in C02 199
Group B:
10% Reduction in C02 228
20% Reduction in C02 198
25% Reduction in C02 183
Andhra Pradesh
Reforms 977
10.3% Reduction in C02 872
15.3% Reduction in C02 803
19.6% Reduction in C02 75322.8% Reduction in C02 722
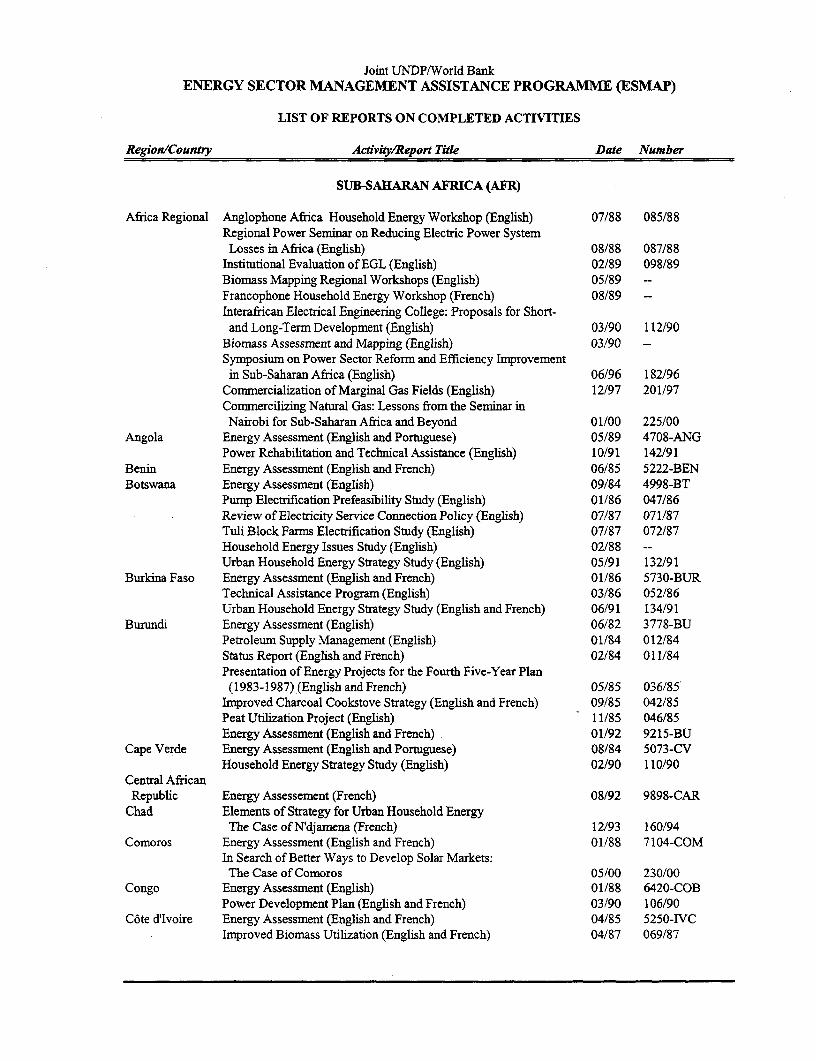
Joint UNDP/World BankENERGY SECTOR MANAGEMENT ASSISTANCE PROGRAMME (ESMAP)
LIST OF REPORTS ON COMPLETED ACTIVITIES
Region/Country Activity/Report Title Date Number
SUB-SAHARAN AFRICA (AFR)
Africa Regional Anglophone Africa Household Energy Workshop (English) 07/88 085/88Regional Power Seminar on Reducing Electric Power SystemLosses in Africa (English) 08/88 087/88
Institutional Evaluation of EGL (English) 02/89 098/89Biomass Mapping Regional Workshops (English) 05/89 -
Francophone Household Energy Workshop (French) 08/89 --Interafrican Electrical Engineering College: Proposals for Short-and Long-Term Development (English) 03/90 112/90
Biomass Assessment and Mapping (English) 03/90 --Symposium on Power Sector Reform and Efficiency Improvementin Sub-Saharan Africa (English) 06/96 182/96
Commnercialization of Marginal Gas Fields (English) 12/97 201/97Commercilizing Natural Gas: Lessons from the Seminar inNairobi for Sub-Saharan Africa and Beyond 01/00 225/00
Angola Energy Assessment (English and Portuguese) 05/89 4708-ANGPower Rehabilitation and Technical Assistance (English) 10/91 142/91
Benin Energy Assessment (English and French) 06/85 5222-BENBotswana Energy Assessment (English) 09/84 4998-BT
Pumnp Electrification Prefeasibility Study (English) 01/86 047/86Review of Electricity Service Connection Policy (English) 07/87 071/87Tuli Block Farms Electrification Study (English) 07/87 072/87Household Energy Issues Study (English) 02/88 --Urban Household Energy Strategy Study (English) 05/91 132/91
Burkina Faso Energy Assessment (English and French) 01/86 5730-BURTechnical Assistance Program (English) 03/86 052/86Urban Household Energy Strategy Study (English and French) 06/91 134/91
Burundi Energy Assessment (English) 06/82 3778-BUPetroleum Supply Management (English) 01/84 012/84Status Report (English and French) 02/84 011/84Presentation of Energy Projects for the Fourth Five-Year Plan(1983-1987) (English and French) 05/85 036/85
Improved Charcoal Cookstove Strategy (English and French) 09/85 042/85Peat Utilization Project (English) 11/85 046/85Energy Assessment (English and French) 01/92 9215-BU
Cape Verde Energy Assessment (English and Portuguese) 08/84 5073-CVHousehold Energy Strategy Study (English) 02/90 110/90
Central AfricanRepublic Energy Assessement (French) 08/92 9898-CAR
Chad Elements of Strategy for Urban Household EnergyThe Case of N'djamena (French) 12/93 160/94
Comoros Energy Assessment (English and French) 01/88 7104-COMIn Search of Better Ways to Develop Solar Markets:The Case of Comnoros 05/00 230/00
Congo Energy Assessment (English) 01/88 6420-COBPower Development Plan (English and French) 03/90 106/90
C6te d'Ivoire Energy Assessment (English and French) 04/85 5250-IVCImproved Biomass Utilization (English and French) 04/87 069/87
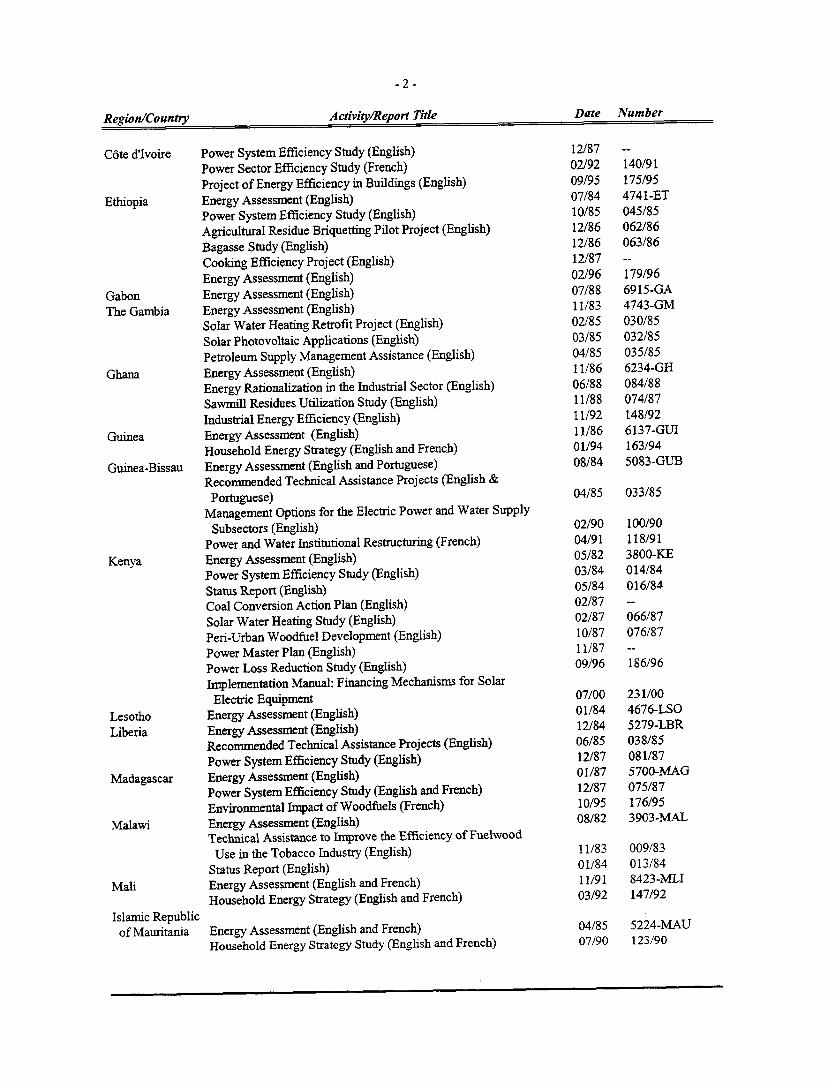
-2 -
Region/Country Activity/lReport Title Date Number
C6te dlvoire Power System Efficiency Study (English) 12/87 --Power Sector Efficiency Study (French) 02/92 140/91Project of Energy Efficiency in Buildings (English) 09/95 175/95
Ethiopia Energy Assessment (English) 07/84 4741-ETPower System Efficiency Study (English) 10/85 045/85Agricultural Residue Briquetting Pilot Project (English) 12/86 062/86Bagasse Study (English) 12/86 063/86Cooking Efficiency Project (English) 12/87 --Energy Assessment (English) 02/96 179/96
Gabon Energy Assessment (English) 07/88 6915-GAThe Garmbia Energy Assessment (English) 11/83 4743-GM
Solar Water Heating Retrofit Project (English) 02/85 030/85Solar Photovoltaic Applications (English) 03/85 032/85Petroleum Supply Management Assistance (English) 04/85 035/85
Ghana Energy Assessment (English) 11/86 6234-GHEnergy Rationalization in the Industrial Sector (English) 06/88 084/88Sawmill Residues Utilization Study (English) 11/88 074/87Industrial Energy Efficiency (English) 11/92 148/92
Guinea Energy Assessment (English) 11/86 6137-GUIHousehold Energy Strategy (English and French) 01/94 163/94
Guinea-Bissau Energy Assessment (English and Portuguese) 08/84 5083-GUBRecommended Technical Assistance Projects (English &Portuguese) 04/85 033/85
Management Options for the Electric Power and Water SupplySubsectors (English) 02/90 100/90
Power and Water Institutional Restructuring (French) 04/91 118/91Kenya Energy Assessment (English) 05/82 3800-KE
Power System Efficiency Study (English) 03/84 014/84Status Report (English) 05/84 016/84Coal Conversion Action Plan (English) 02/87 -
Solar Water Heating Study (English) 02/87 066/87Peri-Urban Woodfuel Development (English) 10/87 076/87Power Master Plan (English) 11/87 --Power Loss Reduction Study (English) 09/96 186/96Implementation Manual: Financing Mechanisms for SolarElectric Equipment 07/00 231/00
Lesotho Energy Assessment (English) 01/84 4676-LSOLiberia Energy Assessment (English) 12/84 5279-LBR
Recommended Technical Assistance Projects (English) 06/85 038/85Power System Efficiency Study (English) 12/87 081/87
Madagascar Energy Assessment (English) 01/87 5700-MAGPower System Efficiency Study (English and French) 12/87 075/87Environmental Impact of Woodfuels (French) 10/95 176/95
Malawi Energy Assessment (English) 08/82 3903-MALTechnical Assistance to hnprove the Efficiency of FuelwoodUse in the Tobacco Industry (English) 11/83 009/83
Status Report (English) 01/84 013/84Mali Energy Assessment (English and French) 11/91 8423-MLI
Household Energy Strategy (English and French) 03/92 147/92Islamic Republicof Mauritania Energy Assessment (English and French) 04/85 5224-MAU
Household Energy Strategy Study (English and French) 07/90 123/90
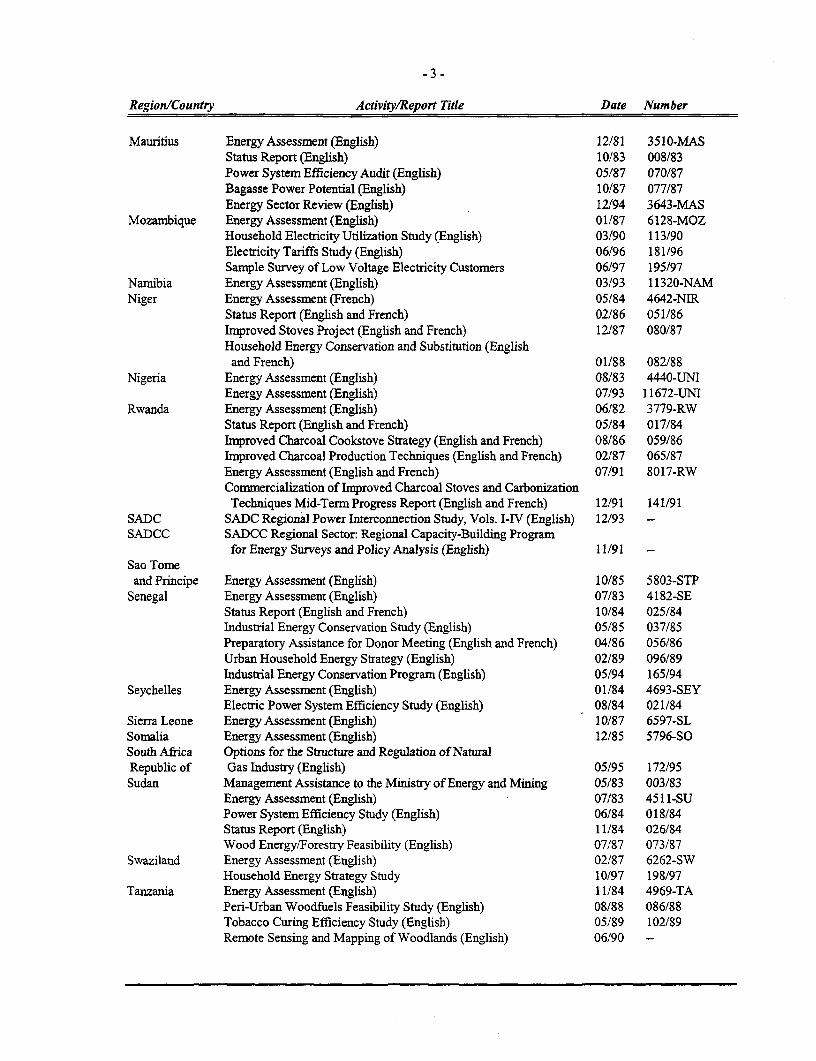
- 3 -
Region/Country Activity/Report Title Date Number
Mauritius Energy Assessment (English) 12/81 3510-MASStatus Report (English) 10/83 008/83Power System Efficiency Audit (English) 05/87 070/87Bagasse Power Potential (English) 10/87 077/87Energy Sector Review (English) 12/94 3643-MAS
Mozambique Energy Assessment (English) 01/87 6128-MOZHousehold Electricity Utilization Study (English) 03/90 113/90Electricity Tariffs Study (English) 06/96 181/96Sample Survey of Low Voltage Electricity Customers 06/97 195/97
Narnibia Energy Assessment (English) 03/93 11320-NAMNiger Energy Assessment (French) 05/84 4642-NIR
Status Report (English and French) 02186 051/86Improved Stoves Project (English and French) 12/87 080/87Household Energy Conservation and Substitution (Englishand French) 01/88 082/88
Nigeria Energy Assessmnent (English) 08/83 4440-UNIEnergy Assessment (English) 07/93 11672-UNI
Rwanda Energy Assessment (English) 06/82 3779-RWStatus Report (English and French) 05/84 017/84Improved Charcoal Cookstove Strategy (English and French) 08/86 059/86Improved Charcoal Production Techniques (English and French) 02/87 065/87Energy Assessment (English and French) 07/91 8017-RWCommercialization of Improved Charcoal Stoves and CarbonizationTechniques Mid-Term Progress Report (English and French) 12/91 141/91
SADC SADC Regional Power Interconnection Study, Vols. I-IV (English) 12/93 -
SADCC SADCC Regional Sector: Regional Capacity-Building Programfor Energy Surveys and Policy Analysis (English) 11/91 -
Sao Tomeand Principe Energy Assessment (English) 10/85 5803-STP
Senegal Energy Assessment (English) 07/83 4182-SEStatus Report (English and French) 10/84 025/84Industrial Energy Conservation Study (English) 05/85 037/85Preparatory Assistance for Donor Meeting (English and French) 04/86 056/86Urban Household Energy Strategy (English) 02/89 096/89Industrial Energy Conservation Program (English) 05/94 165/94
Seychelles Energy Assessment (English) 01/84 4693-SEYElectric Power System Efficiency Study (English) 08/84 021/84
Sierra Leone Energy Assessment (English) 10/87 6597-SLSomnalia Energy Assessment (English) 12/85 5796-SOSouth Africa Options for the Structure and Regulation of NaturalRepublic of Gas Industry (English) 05/95 172/95Sudan Management Assistance to the Ministry of Energy and Mining 05/83 003/83
Energy Assessment (English) 07/83 4511-SUPower System Efficiency Study (English) 06/84 018/84Status Report (English) 11/84 026/84Wood Energy/Forestry Feasibility (English) 07/87 073/87
Swaziland Energy Assessment (English) 02/87 6262-SWHousehold Energy Strategy Study 10/97 198/97
Tanzania Energy Assessment (English) 11/84 4969-TAPeri-Urban Woodfuels Feasibility Study (English) 08/88 086/88Tobacco Curing Efficiency Study (English) 05/89 102/89Remote Sensing and Mapping of Woodlands (English) 06/90 --
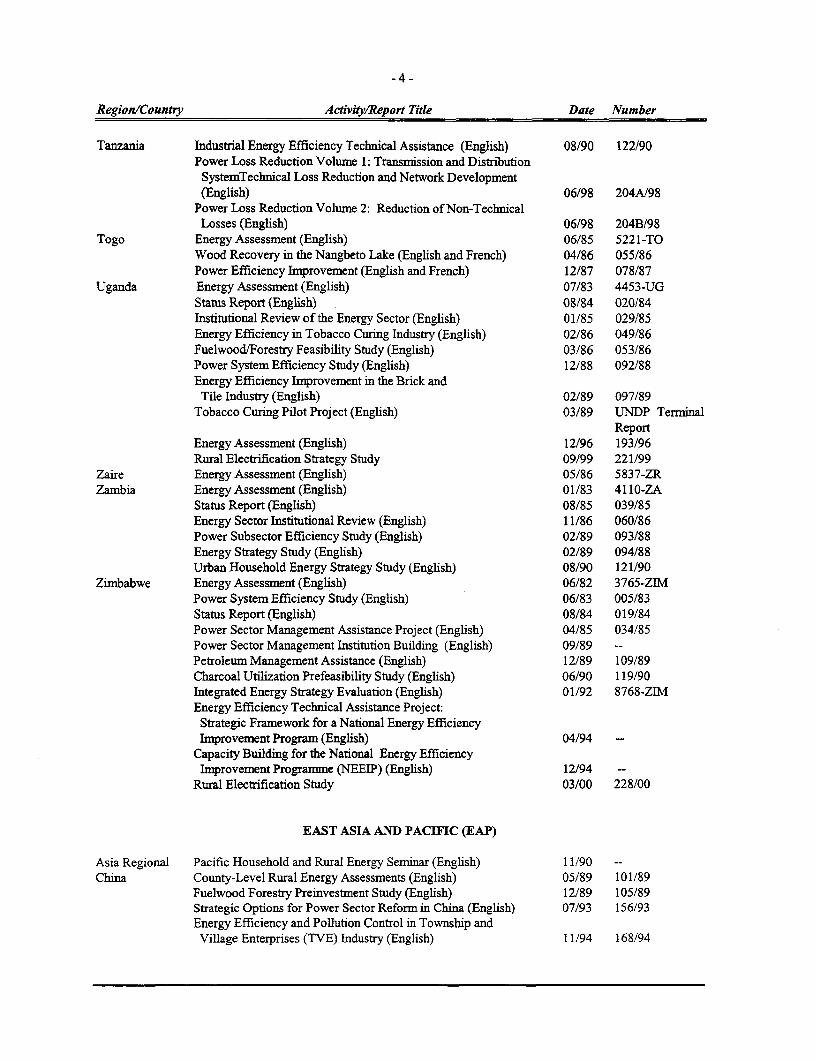
-4 -
Region/Countiy Activity/Report Title Date Number
Tanzania Industrial Energy Efficiency Technical Assistance (English) 08/90 122/90Power Loss Reduction Volume 1: Transmission and Distribution
SystemTechnical Loss Reduction and Network Development(English) 06/98 204A/98
Power Loss Reduction Volume 2: Reduction of Non-TechnicalLosses (English) 06/98 204B/98
Togo Energy Assessment (English) 06/85 5221-TOWood Recovery in the Nangbeto Lake (English and French) 04/86 055/86Power Efficiency Improvement (English and French) 12/87 078/87
Uganda Energy Assessment (English) 07/83 4453-UGStatus Report (English) 08/84 020/84Institutional Review of the Energy Sector (English) 01/85 029/85Energy Efficiency in Tobacco Curing Industry (English) 02/86 049/86Fuelwood/Forestry Feasibility Study (English) 03/86 053/86Power System Efficiency Study (English) 12/88 092/88Energy Efficiency Improvement in the Brick andTile Industry (English) 02/89 097/89
Tobacco Curing Pilot Project (English) 03/89 UNDP TenninalReport
Energy Assessment (English) 12/96 193/96Rural Electrification Strategy Study 09/99 221/99
Zaire Energy Assessment (English) 05/86 5837-ZRZambia Energy Assessment (English) 01/83 4110-ZA
Status Report (English) 08/85 039/85Energy Sector Institutional Review (English) 11/86 060/86Power Subsector Efficiency Study (English) 02/89 093/88Energy Strategy Study (English) 02/89 094/88Urban Household Energy Strategy Study (English) 08/90 121/90
Zimbabwe Energy Assessment (English) 06/82 3765-ZIMPower System Efficiency Study (English) 06/83 005/83Status Report (English) 08/84 019/84Power Sector Management Assistance Project (English) 04/85 034/85Power Sector Management Institution Building (English) 09/89 --
Petroleum Management Assistance (English) 12/89 109/89Charcoal Utilization Prefeasibility Study (English) 06/90 119/90Integrated Energy Strategy Evaluation (English) 01/92 8768-ZIMEnergy Efficiency Technical Assistance Project:Strategic Framework for a National Energy EfficiencyImprovement Program (English) 04/94 -
Capacity Building for the National Energy EfficiencyImprovement Progranmne (NEEIP) (English) 12/94 -
Rural Electrification Study 03/00 228/00
EAST ASIA AND PACIFIC (EAP)
Asia Regional Pacific Household and Rural Energy Seminar (English) 11/90 --China County-Level Rural Energy Assessments (English) 05/89 101/89
Fuelwood Forestry Preinvestment Study (English) 12/89 105/89Strategic Options for Power Sector Reform in China (English) 07/93 156/93Energy Efficiency and Pollution Control in Township andVillage Enterprises (TVE) Industry (English) 11/94 168/94
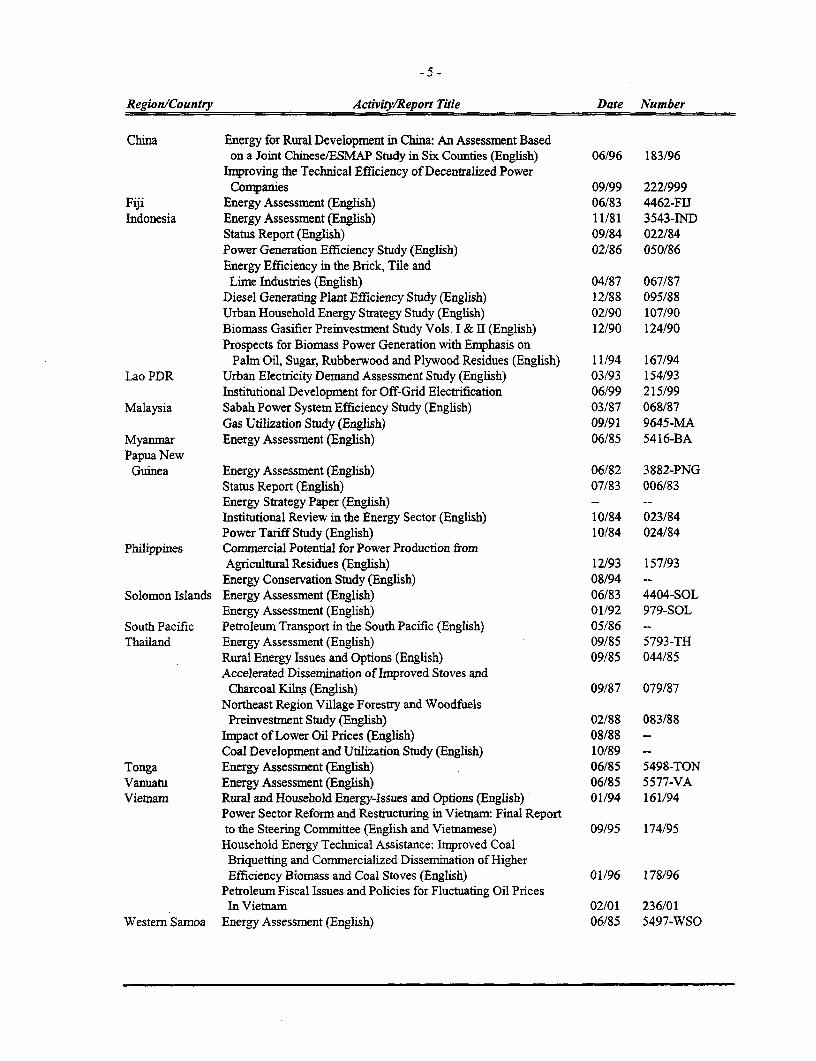
-5 -
Region/Country Activity/Report Title Date Number
China Energy for Rural Development in China: An Assessment Basedon a Joint Chinese/ESMAP Study in Six Counties (English) 06/96 183/96
Improving the Technical Efficiency of Decentralized PowerCompanies 09/99 222/999
Fiji Energy Assessment (English) 06/83 4462-FITIndonesia Energy Assessment (English) 11/81 3543-IND
Status Report (English) 09/84 022/84Power Generation Efficiency Study (English) 02/86 050/86Energy Efficiency in the Brick, Tile andLime Industries (English) 04/87 067/87
Diesel Generating Plant Efficiency Study (English) 12/88 095/88Urban Household Energy Strategy Study (English) 02/90 107/90Biomass Gasifier Preinvestment Study Vols. I & II (English) 12/90 124/90Prospects for Biomass Power Generation with Ernphasis on
Palm Oil, Sugar, Rubberwood and Plywood Residues (English) 11/94 167/94Lao PDR Urban Electricity Demand Assessment Study (English) 03/93 154/93
Institutional Development for Off-Grid Electrification 06/99 215/99Malaysia Sabah Power System Efficiency Study (English) 03/87 068/87
Gas Utilization Study (English) 09/91 9645-MAMyanmar Energy Assessment (English) 06/85 5416-BAPapua NewGuinea Energy Assessment (English) 06/82 3882-PNG
Status Report (English) 07/83 006/83Energy Strategy Paper (English) - --Institutional Review in the Energy Sector (English) 10/84 023/84Power Tariff Study (English) 10/84 024/84
Philippines Commercial Potential for Power Production fromAgricultural Residues (English) 12/93 157/93
Energy Conservation Study (English) 08/94 --Solomon Islands Energy Assessment (English) 06/83 4404-SOL
Energy Assessment (English) 01/92 979-SOLSouth Pacific Petroleumn Transport in the South Pacific (English) 05/86 --Thailand Energy Assessment (English) 09/85 5793-TH
Rural Energy Issues and Options (English) 09/85 044/85Accelerated Dissemination of Inproved Stoves andCharcoal Kilns (English) 09/87 079/87
Northeast Region Village Forestry and WoodfuelsPreinvestment Study (English) 02/88 083/88
Impact of Lower Oil Prices (English) 08/88 -
Coal Development and Utilization Study (English) 10/89 -
Tonga Energy Assessment (English) 06/85 5498-TONVanuatu Energy Assessment (English) 06/85 5577-VAVietnam Rural and Household Energy-Issues and Options (English) 01/94 161/94
Power Sector Reform and Restructuring in Vietnam: Final Reportto the Steering Committee (English and Vietnamese) 09/95 174195Household Energy Technical Assistance: Improved CoalBriquetting and Commercialized Dissemination of HigherEfficiency Biomass and Coal Stoves (English) 01/96 178/96
Petroleum Fiscal Issues and Policies for Fluctuating Oil PricesIn Vietnam 02/01 236/01
Western Samoa Energy Assessment (English) 06/85 5497-WSO
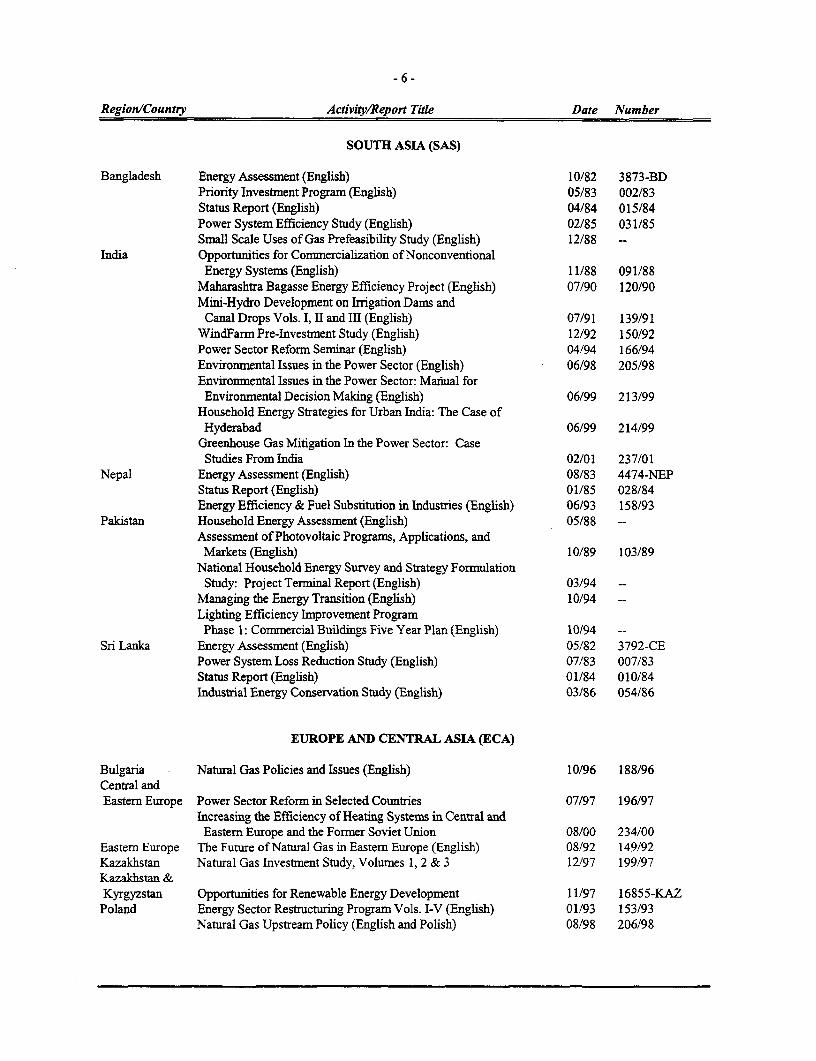
-6-
Region/Country Activity/Report Title Date Number
SOUTH ASIA (SAS)
Bangladesh Energy Assessment (English) 10/82 3873-BDPriority Investment Program (English) 05/83 002/83Status Report (English) 04/84 015/84Power System Efficiency Study (English) 02/85 031/85Small Scale Uses of Gas Prefeasibility Study (English) 12/88 --
India Opportunities for Comnmercialization of NonconventionalEnergy Systems (English) 11/88 091/88
Maharashtra Bagasse Energy Efficiency Project (English) 07/90 120/90Mini-Hydro Development on Irrigation Dams andCanal Drops Vols. I, II and I1:I (English) 07/91 139/91
WindFarm Pre-Investment Study (English) 12/92 150/92Power Sector Reform Seminar (English) 04/94 166/94Environmental Issues in the Power Sector (English) 06/98 205/98Environmental Issues in the Power Sector: Mariual forEnvironmental Decision Making (English) 06/99 213/99
Household Energy Strategies for Urban India: The Case ofHyderabad 06/99 214/99
Greenhouse Gas Mitigation In the Power Sector: CaseStudies From India 02/01 237/01
Nepal Energy Assessment (English) 08/83 4474-NEPStatus Report (English) 01/85 028/84Energy Efficiency & Fuel Substitution in Industries (English) 06/93 158/93
Pakistan Household Energy Assessment (English) 05/88 --Assessment of Photovoltaic Programs, Applications, andMarkets (English) 10/89 103/89
National Household Energy Survey and Strategy FormulationStudy: Project Terminal Report (English) 03/94 --
Managing the Energy Transition (English) 10/94Lighting Efficiency Improvement ProgramPhase 1: Commercial Buildings Five Year Plan (English) 10/94
Sri Lanka Energy Assessment (English) 05/82 3792-CEPower System Loss Reduction Study (English) 07/83 007/83Status Report (English) 01/84 010/84Industrial Energy Conservation Study (English) 03/86 054/86
EUROPE AND CENTRAL ASIA (ECA)
Bulgaria Natural Gas Policies and Issues (English) 10/96 188/96Central andEastem Europe Power Sector Reform in Selected Countries 07/97 196/97
Increasing the Efficiency of Heating Systems in Central andEastem Europe and the Former Soviet Union 08/00 234/00
Eastern Europe The Future of Natural Gas in Eastem Europe (English) 08/92 149/92Kazakhstan Natural Gas Investment Study, Volumes 1, 2 & 3 12/97 199/97Kazakhstan &Kyrgyzstan Opportunities for Renewable Energy Development 11/97 16855-KAZ
Poland Energy Sector Restructuring Program Vols. I-V (English) 01/93 153/93Natural Gas Upstream Policy (English and Polish) 08/98 206/98
Region/Country Activity/Report Title Date Number
Poland Energy Sector Restructuring Program: Establishing the EnergyRegulation Authority 10/98 208/98
Portugal Energy Assessment (English) 04/84 4824-PORomania Natural Gas Development Strategy (English) 12/96 192/96Slovenia Workshop on Private Participation in the Power Sector (English) 02/99 211/99Turkey Energy Assessment (English) 03/83 3877-TU
Energy and the Environment: Issues and Options Paper 04/00 229/00
MIDDLE EAST AND NORTH AFRICA (MNA)
Arab Republicof Egypt Energy Assessment (English) 10196 189/96
Energy Assessment (English and French) 03/84 4157-MORStatus Report (English and French) 01186 048/86
Morocco Energy Sector Institutional Development Study (English and French) 07/95 173/95Natural Gas Pricing Study (French) 10/98 209/98Gas Development Plan Phase II (French) 02/99 210/99
Syria Energy Assessment (English) 05/86 5822-SYRElectric Power Efficiency Study (English) 09/88 089/88Energy Efficiency Improvement in the Cement Sector (English) 04/89 099/89Energy Efficiency Improvement in the Fertilizer Sector (English) 06/90 115/90
Tunisia Fuel Substitution (English and French) 03/90 --Power Efficiency Study (English and French) 02/92 136/91Energy Management Strategy in the Residential and
Tertiary Sectors (English) 04/92 146/92Renewable Energy Strategy Study, Volume I (French) 11/96 190A/96Renewable Energy Strategy Study, Volume II (French) 11/96 190B/96
Yemen Energy Assessment (English) 12/84 4892-YAREnergy Investment Priorities (English) 02/87 6376-YARHousehold Energy Strategy Study Phase I (English) 03/91 126/91
LATIN AMERICA AND THE CARIBBEAN (LAC)
LAC Regional Regional Seminar on Electric Power System Loss Reductionin the Caribbean (English) 07/89 -
Elimination of Lead in Gasoline in Latin America andthe Caribbean (English and Spanish) 04/97 194/97
Elimination of Lead in Gasoline in Latin America andthe Caribbean - Status Report (English and Spanish) 12197 200/97
Harmonization of Fuels Specifications in Latin America andthe Caribbean (English and Spanish) 06/98 203/98
Bolivia Energy Assessment (English) 04/83 4213-BONational Energy Plan (English) 12/87 --La Paz Private Power Technical Assistance (English) 11/90 111/90Prefeasibility Evaluation Rural Electrification and Demand
Assessment (English and Spanish) 04191 129/91National Energy Plan (Spanish) 08/91 131/91Private Power Generation and Transmission (English) 01/92 137/91Natural Gas Distribution: Economics and Regulation (English) 03/92 125/92
- 8-
Region/Country Activity/lReport Title Date Number
Bolivia Natural Gas Sector Policies and Issues (English and Spanish) 12/93 164/93Household Rural Energy Strategy (English and Spanish) 01/94 162/94Preparation of Capitalization of the Hydrocarbon Sector 12/96 191/96Introducing Competition into the Electricity Supply Industry inDeveloping Countries: Lessons from Bolivia 08/00 233/00
Final Report on Operational Activities Rural Energy and EnergyEfficiency 08/00 235/00
Brazil Energy Efficiency & Conservation: Strategic Partnership forEnergy Efficiency in Brazil (English) 01/95 170/95
Hydro and Thermal Power Sector Study 09/97 197/97Rural Electrification with Renewable Energy Systems in theNortheast: A Preinvestment Study 07/00 232/00
Chile Energy Sector Review (English) 08/88 7129-CHColombia Energy Strategy Paper (English) 12/86 --
Power Sector Restructuring (English) 11/94 169/94Energy Efficiency Report for the Commercialand Public Sector (English) 06/96 184/96
Costa Rica Energy Assessment (English and Spanish) 01/84 4655-CRRecomnnended Technical Assistance Projects (English) 11/84 027/84Forest Residues Utilization Study (English and Spanish) 02/90 108/90
DominicanRepublic Energy Assessment (English) 05/91 8234-DO
Ecuador Energy Assessment (Spanish) 12/85 5865-ECEnergy Strategy Phase I (Spanish) 07/88 --
Energy Strategy (English) 04/91 --
Private Minihydropower Development Study (English) 11/92 --
Energy Pricing Subsidies and Interfuel Substitution (English) 08/94 11798-ECEnergy Pricing, Poverty and Social Mitigation (English) 08/94 12831-EC
Guatemala Issues and Options in the Energy Sector (English) 09/93 12160-GUHaiti Energy Assessment (English and French) 06/82 3672-HA
Status Report (English and French) 08/85 041/85Household Energy Strategy (English and French) 12/91 143/91
Honduras Energy Assessment (English) 08/87 6476-HOPetroleum Supply Management (English) 03/91 128/91
Jamaica Energy Assessment (English) 04/85 5466-JMPetroleum Procurement, Refining, andDistribution Study (English) 11/86 061/86
Energy Efficiency Building Code Phase I (English) 03/88 --Energy Efficiency Standards and Labels Phase I (English) 03/88 --
Management Information System Phase I (English) 03/88 --
Charcoal Production Project (English) 09/88 090/88FIDCO Sawmill Residues Utilization Study (English) 09/88 088/88Energy Sector Strategy and Investment Planning Study (English) 07/92 135/92
Mexico Inproved Charcoal Production Within Forest Management forthe State of Veracruz (English and Spanish) 08/91 138/91
Energy Efficiency Management Technical Assistance to theComision Nacional para el Ahorro de Energia (CONAE) (English) 04/96 180/96
Panama Power System Efficiency Study (English) 06/83 004/83Paraguay Energy Assessment (English) 10/84 5145-PA
Recommended Technical Assistance Projects (English) 09/85 --
Status Report (English and Spanish) 09/85 043/85Peru Energy Assessment (English) 01/84 4677-PE
-9-
Region/Country Activity/Report Title Date Number
Peru Status Report (English) 08/85 040/85Proposal for a Stove Dissemination Program inthe Sierra (English and Spanish) 02/87 064/87
Energy Strategy (English and Spanish) 12/90 --Study of Energy Taxation and Liberalizationof the Hydrocarbons Sector (English and Spanish) 120/93 159/93
Reform and Privatization in the HydrocarbonSector (English and Spanish) 07/99 216/99
Saint Lucia Energy Assessment (English) 09/84 5111 -SLUSt. Vincent andthe Grenadines Energy Assessment (English) 09/84 5103-STV
Sub Andean Environmental and Social Regulation of Oil and GasOperations in Sensitive Areas of the Sub-Andean Basin(English and Spanish) 07/99 217/99
Trinidad andTobago Energy Assessment (English) 12/85 5930-TR
GLOBAL
Energy End Use Efficiency: Research and Strategy (English) 11/89 -
Women and Energy--A Resource GuideThe International Network: Policies and Experience (English) 04/90 --
Guidelines for Utility Customer Management andMetering (English and Spanish) 07/91
Assessment of Personal Computer Models for EnergyPlanning in Developing Countries (English) 10/91
Long-Term Gas Contracts Principles and Applications (English) 02/93 152/93Comparative Behavior of Firms Under Public and PrivateOwnership (English) 05/93 155/93
Development of Regional Electric Power Networks (English) 10/94 --
kounatable on Energy Efflciency (English) 02J95 171/95Assessing Pollution Abatement Policies with a Case Studyof Ankara (English) 11/95 177/95
A Synopsis of the Third Annual Roundtable on Independent Power
Projects; Rhetoqc and Reality (English) 08/96 187/96Rural Energy and Development Roundtable (English) 05/98 202/98A Synopsis of the Second Roundtable on Energy Efficiency:Institutional and Financial Delivery Mechanisms (English) 09/98 207/98
The Effect of a Shadow Price on Carbon Emission in theEnergy Portfolio of the World Bank: A CarbonBackcasting Exercise (English) 02/09 212)90
Increasing the Efficiency of Gas Distribution Phase 1:Case Studies and Themnatic Data Sheets 07/99 218/99
Global Energy Sector Reform in Developing Countries:A Scorecard 07/99 219/99
Global Lighting Services for the Poor Phase II: TextMarketing of Smnall "Solar" Batteries for RuralElectrification Purposes 08/99 220/99
A Review of the Renewable Energy Activities of the UTNDP/World Bank Energy Sector Management AssistanceProgramme 1993 to 1998 11/99 223/99
- 10-
Region/Countiy Activity/Report Title Date Number
Global Energy, Transportation and Environment: Policy Options forEnvironmental Improvement 12/99 224/99
Privatization, Competition and Regulation in the British ElectricityIndustry, With Implications for Developing Countries 02/00 226/00
Reducing the Cost of Grid Extension for Rural Electrification 02/00 227/00
2/8/01

The World Bank
1818 H Street, NW
Washington, DC 20433 USA
Tel.: 1.202.458.2321 Fax.: 1.202.522.3018
Internet: www.esmap.org
Email: [email protected]
A )oir~t UNDPJWOrhBan Programme ia
A joint UNDPfWortd Bank Programme