Embed Size (px)
Citation preview
Greenhouse Gas Inventory Management Plan and Reporting Document (IMPRD)
Entergy Corporation New Orleans, LA Prepared by: Rick N. Johnson ([email protected])
Manager, Corporate Environmental Operations Environmental Strategy and Policy Group
Original Draft: July 2005 Finalized: December 2005 Latest Update: March 2012 QUANTIFICATION STANDARD: ISO 14064-1 Level of Assurance: Limited Entergy’s GHG Commitment Snapshot Base Year – 2000 Original Commitment Years – 2001 to 2005 Original Commitment – Stabilize at 2000 levels direct CO2 emissions from power plants Original Commitment Funding – $25 million ($5 million per year) Second Commitment Years – 2006 to 2010 Second Commitment – 20% below 2000 levels direct CO2 emissions & cont. purchased power Second Commitment Funding – $3.25 million ($650K per year) Third Commitment Years – 2011 to 2020 Third Commitment – 20% below 2000 levels direct CO2 emissions & cont. purchased power Third Commitment Funding – $10 million ($1 million per year)
1
Entergy Corporation Greenhouse Gas Inventory Management Plan and Reporting Document
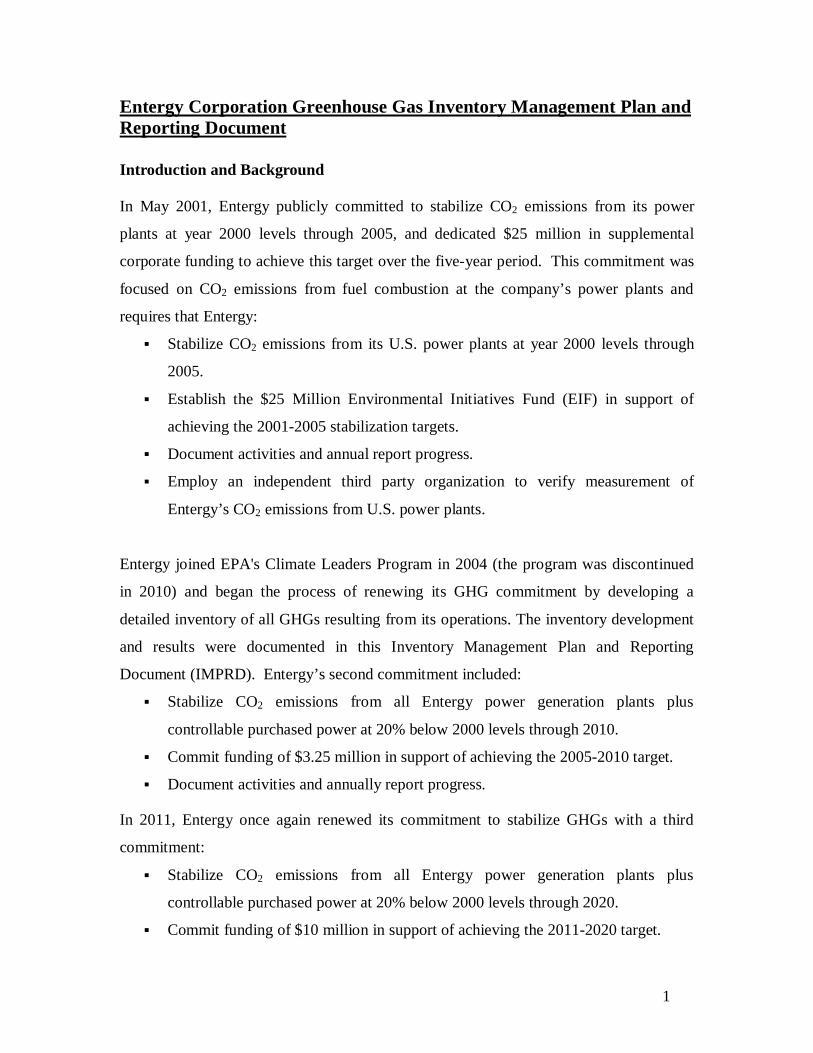
Introduction and Background In May 2001, Entergy publicly committed to stabilize CO2 emissions from its power
plants at year 2000 levels through 2005, and dedicated $25 million in supplemental
corporate funding to achieve this target over the five-year period. This commitment was
focused on CO2 emissions from fuel combustion at the company’s power plants and
requires that Entergy:
Stabilize CO2 emissions from its U.S. power plants at year 2000 levels through
2005.
Establish the $25 Million Environmental Initiatives Fund (EIF) in support of
achieving the 2001-2005 stabilization targets.
Document activities and annual report progress.
Employ an independent third party organization to verify measurement of
Entergy’s CO2 emissions from U.S. power plants.
Entergy joined EPA's Climate Leaders Program in 2004 (the program was discontinued
in 2010) and began the process of renewing its GHG commitment by developing a
detailed inventory of all GHGs resulting from its operations. The inventory development
and results were documented in this Inventory Management Plan and Reporting
Document (IMPRD). Entergy’s second commitment included:
Stabilize CO2 emissions from all Entergy power generation plants plus
controllable purchased power at 20% below 2000 levels through 2010.
Commit funding of $3.25 million in support of achieving the 2005-2010 target.
Document activities and annually report progress.
In 2011, Entergy once again renewed its commitment to stabilize GHGs with a third
commitment:
Stabilize CO2 emissions from all Entergy power generation plants plus
controllable purchased power at 20% below 2000 levels through 2020.
Commit funding of $10 million in support of achieving the 2011-2020 target.
2
Document activities and annually report progress.
Beginning in 2012, Entergy decided to conduct the third-party verification audit to the
International Standards Organization (ISO) standard for GHG development and
verification (ISO 14064). As a part of this verification, this document was revised and
upgraded in 2012 to include several aspects required by the standard. This IMPRD and
Entergy’s 2011 GHG Inventory is verified to ISO 14064-1 at a LIMITED Level of
Assurance.
This IMPRD has been created and subsequently revised according to the requirements in
the World Resources Institute and the World Business Council for Sustainable
Development Greenhouse Gas Protocol, 2004 revised edition, and formatted according
to the US EPA Climate Leaders 2004 draft checklist of IMPRD components.
Additionally, the document was upgraded in 2012 to the standards contained in ISO
14064-1.
This IMPRD is used to create and document an inventory that was previously reported
to the Climate Leaders program and other external parties. However, EPA announced
in 2010 that the Climate Leaders program was being discontinued. This IMPRD will
continue to be updated and used to document Entergy’s GHG Inventory methodology
and results on an annual basis. Entergy has made an estimate of all emissions,
including small sources, for reporting externally. Entergy also registers its emissions
and offset purchases to the American Carbon Registry
(www.americancarbonregistry.org).
The current GHG Inventory (by calendar year) is attached to this document as
Attachment 1 and is referenced throughout.
3
Reporting Entity Information Entergy Corporation (Entergy) is an integrated energy company engaged primarily in
electric power production and retail distribution operations. Entergy owns and operates
power plants with approximately 30,000 megawatts of electric generating capacity, and it
is the second largest nuclear generator in the United States. Entergy delivers electricity to
2.7 million utility customers in Arkansas, Louisiana, Mississippi, and Texas. Entergy has
annual revenues of more than $11 billion (2011) and approximately 15,000 employees.
Additional company information can be located at www.entergy.com.
Company address: 639 Loyola Avenue
New Orleans, Louisiana 70113
IMPRD/GHG Inventory Contact: Brent Dorsey - Director, Environmental Programs
Environmental Strategy and Policy (ESP) Group
(504) 576-5084 (New Orleans)
(281) 297-3321 (Houston)
4
Boundary Conditions
Consolidated Approach for Emissions Reporting – Entergy has elected to include all
company-owned assets and those under a capital lease, consistent with “equity share”
reporting under EPA and WRI reporting protocols. Where partial ownership share of an
asset exists, only Entergy’s owned portion of the asset/emissions is included in the
inventory. Additionally, Entergy has opted to include those emissions associated with the
electricity purchased to support grid operations and meet customer demand, primarily due
to an increased reliance on purchased power since 2003. The GHG emissions resulting
from the full life cycle of the various fuel sources are not included in the inventory.
Other emission sources (including transportation assets, sulfur hexafluoride [SF6],
building air conditioning and refrigeration equipment, losses from natural gas distribution
system, etc.) that have emissions estimated to be less than 1% of the total inventory are
considered de minimus unless they are anticipated to change dramatically and grow above
this threshold. Emissions of each GHG from facilities/assets that are de minimus are
estimated and included in the inventory for each gas and/or source. The same data are
used for future years unless one of the categories of emissions changes significantly.
These estimates will be recalculated approximately every five years (or as updated data
becomes available), after major equipment changes, asset acquisition and/or asset
divestiture in order to reconfirm de minimus status.
Facilities List –The majority of Entergy’s emissions are from fossil-fueled electricity
generation facilities. However, other sources include small sources at other company
facilities, a full list of facilities included in the inventory is contained in Attachment 1.
This list identifies Entergy’s fossil-fueled electricity generation assets and ownership
share. All other GHG emission-producing assets are assumed to be 100% owned by
Entergy.
List of GHGs Included – Entergy includes the following from various sources in its
inventory and management program:
Carbon dioxide (CO2)
Methane (CH4)
5
Nitrous Oxide (N2O)
Sulfur Hexafluoride (SF6)
Hydrofluorocarbons (HFC)
Entergy Corporation Emission Sources Process for Identifying Emissions Sources – The Climate Leaders spreadsheet “General
Emission Source Checklist” (Attachment 2), created by Platts/E-source as contractors to
EPA’s Climate Leaders program, was originally utilized as an overall roadmap to help
identify GHG emission sources at Entergy locations. Within each line item, a
determination was made as to the applicability to Entergy’s operations. The findings of
this analysis are presented in the section below. Additionally, publicly-available data,
previous equipment inventories, internal company data and existing air permit
information were utilized to identify GHG sources at company locations. This includes
an extensive analysis and estimates of emissions from small combustion sources co-
located at electrical power generating facilities or at stand alone facilities. The specific
information gathered and its sources are shown in Attachment 1 and 2 and summarized in
the sections below. Additionally, this information was further refined and updated based
on data submitted to the EPA GHG Reporting Program in 2011. Entergy is confident that
this methodology has captured emission estimate information for the majority of small
source equipment at its locations.
Direct Sources
Entergy’s direct emissions are included in the following categories:
Stationary combustion: Entergy’s direct sources of GHGs include emissions from
the direct combustion of fossil-fuels in electrical generation boilers and small
sources at company facilities.
Mobile Combustion: Fossil fuels combusted in company fleet vehicles.
Fugitive Emissions: Methane (CH4) from natural gas distribution systems, SF6
from power transmission and distribution equipment, and HFCs from building
HVAC systems and district cooling operations.
6
Company activity data sources including contacts and information for the various
emissions from and/or usage of these assets are included in Attachment 2.
Indirect Sources Entergy’s indirect sources of emissions include those from purchased electricity and
electrical line transmission/conversion losses. Data sources for the various emissions
from and/or usage of these assets are included in Attachment 2. All electricity consumed
in the operation of generating plants and consumed in Entergy’s various administrative
and commercial buildings and operations are accounted for in Entergy’s direct emissions
for stationary combustion. Additionally, line losses for self-generated and purchased
electricity are accounted for by the additional generation necessary to make-up for these
losses. There are no other indirect sources included in Entergy’s inventory or program.
Optional Sources
Entergy is reporting emissions associated with power purchased to meet customer
demand and support grid operations. This emission source is not required under EPA and
WRI reporting protocols. Entergy has elected to report these emissions because it has
decreased its self generation while increasing the amount of power it purchases.
Subsequently, trends in the Direct emissions category will not accurately represent the
full corporate emissions footprint and trends toward a reduction goal. Including
purchased power presents the most accurate representation of the emission footprint
required to support grid operations and meet customer demand. Other optional sources
such as employee travel and commuting are not included at this time; however, these will
be evaluated for inclusion in the future.
GHG Emissions Quantification
Quantification Method and Emission Factors
The quantification methodologies used in the Entergy inventory are commonly accepted
methods for measuring GHG emissions. For inventory years 2000-2004, Entergy used
methodologies outlined in the EPA Climate Leaders Protocol, or methodologies proposed
by Platts/E-source staff and approved by EPA Climate Leaders staff. In a number of
7
cases, Entergy has used conservative estimation methodologies for expected de minimus
emission sources (<1% of corporate total). In all cases, these estimation methodologies
have were reviewed and approved by EPA Climate Leaders staff. When emissions are
based on these conservative estimates, they are identified as such below.
Emission factors used for the initial inventory were derived from various sources
including USEPA Climate Leaders GHG Protocol (derived from AP-42), US DOE, and
EPA’s eGRID system. The quantification methodologies, emission factors and their
sources can be found in the GHG inventory calculation spreadsheets, accessible through
Entergy’s internal website, SENet. Entergy remained engaged with the EPA Climate
Leaders Program updates and staff until the program was eliminated by the agency.
Entergy will monitor WRI protocol and other leading sources for updates in order to stay
aware of any changes to quantification methodologies, emission factors, or protocol
changes.
These approaches for emission quantifications were chosen because they represent the
most accurate and, in most cases, the only data source for such an exercise. Other
methods were not chosen due to the fact that other methods simply do not exist.
Direct Emissions
Entergy’s direct emissions are either measured directly via a continuous emissions
monitoring (CEM) system, calculated using emission factors and fuel throughput or other
relevant data, or estimated using equipment capacity factors and maximum fuel
throughput data. Direct GHG emissions are quantified separately for each GHG, and
then aggregated across Entergy by GHG constituent. The quantification method and data
source for each major category of direct GHG sources is detailed below.
Fossil-Fuel Combustion Boilers and Gas Turbines – Entergy’s electrical
generation equipment is heavily regulated by state and federal agencies and is
required to report emissions on a periodic basis. A continuous emission
monitoring (CEM) system is used at most plants to directly monitor emissions.
CO2 is directly monitored in these systems and other GHGs, such as CH4 and
8
N2O, are calculated based on the data collected by these systems. However, in
some cases, CO2 is calculated based on fuel throughput and heat rate data.
However the CO2 number is derived, it is reported to the EPA as required under
various agency regulatory programs. In 2011, this category represented 68.3% of
the corporate total.
Source: This GHG emissions data is reported to the ESP Group by Entergy’s Fossil Environmental Support Group annually (at a minimum).
Small Sources at Company Facilities – This category includes equipment such as
emergency generators, house service boilers, natural gas-fired comfort heaters,
and other small combustion/emission sources not monitored by CEM systems at
company facilities. Inventories for 2000 to 2010 used an available equipment
inventory and information contained in facility air permits and real estate
personnel, small source emissions were calculated for each plant for which this
data was available. This data was compiled in 1994 in the Fossil Operations
Equipment Inventory. In 2011, Entergy reported small sources to the EPA GHG
Reporting Program. These numbers were used in the 2011 inventory in order to
align regulatory reporting with this voluntary inventory. Changes to the overall
number were not material. In 2011, this category represented 0.7% of the
corporate total.
Transportation Fleet Vehicles – Entergy’s Transportation Group maintains a
detailed inventory of vehicles owned and/or leased throughout the company. This
group also tracks information regarding the fleet’s fuel usage and miles traveled.
Additionally, Entergy’s Aviation Group (part of Human Resources and
Administration) maintains fuel usage information for our fleet of corporate
aircraft. This information was updated with 2009 data and used to calculate GHG
emissions for this equipment category. In 2011, this category represented 0.1% of
the corporate total. Entergy decided not to include GHG emissions resulting from
employee business travel and employee commuting; however, it may be included
9
in the future. Fleet emissions were quantified using units of all mobile fossil fuels
and default emission factors.
Source: The source of this information is the Manager, Transportation.
Fugitive Emissions: Methane in Natural Gas Distribution and Storage Facilities –
This category of emissions includes losses of methane from Entergy’s natural gas
distribution system and Entergy’s natural gas storage facility. Losses of methane
from the distribution system were estimated using the Gas Research Institute’s
protocol which USEPA may adopt as its standard methodology for quantifying
these emissions. This protocol uses input data such as miles of pipe and number
of services (steel, coated, and plastic), number of meters (commercial and
residential) and gas vented to estimate methane emissions from these types of
distribution systems. The emissions from the storage facility were estimated,
using Tier 1 factors for natural gas storage for both vented and fugitive natural
gas. In 2011, this category represented 0.3% of the corporate total.
Source: These input data were obtained from the Manager, Gas Distribution Operations and
Fossil Operations, Sabine Plant.
Fugitive Emissions: HFCs – This category of emissions includes losses of HFCs
from HVAC equipment at buildings which Entergy owns or for which it holds a
capital lease, from Entergy’s district cooling/thermal operations (chillers), and
from Entergy vehicular air conditioning. For the indoor air cooling equipment,
square footage of company building space was collected and an emission factor
developed by Platts/E-source was applied to this number in order to estimate HFC
losses from this equipment. This emission factor is based on national averages of
tonnage of equipment per square foot of space and average leakage rates of
common air conditioning equipment. An investigation revealed that no HFC-
based air or water pre-cooling is performed at any Entergy electric power
generation facilities. Conservative estimates were completed for all sources of
HFC emissions; this category of emissions was determined to be de minimus. In
10
2011, this category represented less than 0.1% of the corporate total. For the
district cooling operations, information regarding chiller equipment located at
these facilities, along with estimates of equipment leakage rates were used to
derive the initial inventory estimates. The calculations behind all factors used in
estimating HFC emissions can be found in the inventory spreadsheet (Attachment
1).
Source: The source of this information was the Manager, Real Estate Operations and the Director,
Thermal Operations.
Fugitive Emissions: SF6 – This category of emissions includes unintentional
releases of SF6 used in electricity transmission equipment. Emissions of this gas
are estimated using a protocol similar to the protocol utilized for EPA’s SF6
Emission Reduction Partnership Program. The protocol for derivation of this
emission estimate is primarily a mass balance exercise. In 2011, this category
represented 0.3% of the corporate total.
Source: The source of this information is the Manager, Environmental in Entergy’s Transmission
and Distribution Organization. SF6 emission estimates are reported to ESP at least once per year.
Estimates completed for each fugitive GHG emissions category above resulted in
finding that aggregated fugitive emissions from all sources across Entergy are
de minimus. Accordingly, a consistent quantity of emissions is included in the
inventory for each emissions source category and will be carried forward annually
unless a significant change in this category occurs.
Indirect Emissions
Transmission/Distribution System Line Losses – Line losses associated with
power purchased to support the utility operations are considered required indirect
emissions under EPA and Scope 2 Indirect under WRI reporting requirements.
Emissions from T&D losses of purchased power are calculated by applying
Entergy’s system loss factor to the total amount of power purchased. The custom
11
loss factor is developed using power data from the 5 utilities’ FERC Form 1s
(specific data noted in “purchased power” worksheet in inventory). This custom
factor was calculated for 2004 data using 2004 FERC forms. The custom loss
factor calculated for 2004 was applied to purchased power amounts of previous
years of GHG inventories (2000-2003) rather than recalculating this factor for
each prior year. This emission estimate is calculated and presented; however, it is
not subtracted from the purchased power emission number described below since
the bulk of purchased power is generated from within Entergy’s service area.
T&D line losses are already accounted for in the extra generation required to
make up for these losses.
Optional Emissions
Purchased Power – This category of emissions includes those from power
purchased by Entergy to supplement its own supply in order to meet customer
demand and/or support utility operations. In some cases, the source of this power
is known (controllable or unit-contingent purchases). The remaining sources of
purchased power are either not known (non-controllable or grid purchases) or can
not be controlled for some other reason. Under the EPA and WRI protocols,
including emissions from power purchased by utilities is optional. Entergy has
opted to include all purchased power in its GHG inventory and subsequent
tracking since these purchases are required to meet customer demand and in order
to fully characterize the GHG footprint of its operations. In 2011, this category
represented 30.3% of the corporate total.
Both controllable and non-controllable purchase information (in terms of millions
of megawatt-hours) was collected. In the case of non-controllable purchases, the
SERC MS Valley emission factors from the eGRID system (2010 version using
2007 data) were used to calculate GHG emissions. In the case of controllable
purchases, supplier and unit-specific emission rate information from eGRID,
where available, was used to develop a supplier-specific custom GHG emissions
12
factor. If supplier-specific GHG emission factors were not available, the regional
grid factor from eGRID was used as a default.
To avoid double counting, intra-system billing (ISB) purchases were subtracted
from the non-controllable purchase total. These purchases are from the Entergy
unregulated generation business (Entergy Wholesale Commodities – EWC) and
are already accounted for in direct emissions. This results in obtaining the “non-
affiliated purchases” from the appropriate data manager.
Source: All data regarding power purchases were obtained and are available from Entergy’s
System Planning Group. Primary contact for the data was the Sr. Staff Engineer in the Energy
Analysis and Reporting Group. Generation Accounting supplies the TOTAL purchased power
number for the entire company.
Impact of Uncertainties
The quantification and estimation methodologies used to generate Entergy’s GHG
Inventory have inherent uncertainties associated with them. As described above, these
methodologies involve direct measurements of emissions and power generation, various
types of activity data and published emission factors. Many of the data parameters
described above are captured in accordance with Federal or State laws/regulations or for
purposes of billing/invoicing. Accordingly, these data parameters are important to
Entergy’s business and are carefully scrutinized and managed.
Entergy makes every effort to ensure its GHG inventory is accurate and complete.
Despite these efforts, uncertainty may still have an impact on Entergy’s GHG Inventory
efforts. These uncertainties are minimized using the data management tools, quality
assurance efforts and validation/verification efforts described in the remainder of this
document. Any impact of uncertainties is not expected to have a material impact.
13
Data Management
Activity Data
In all cases, the best available activity data was used to calculate or estimate emissions
from a specific source. All collected data for each source is maintained by the data
source identified in the previous section.
The primary source of data related to Entergy’s largest category of emissions
(representing 68.2% of total corporate emissions in 2011) is CEM system data. CEM
system data from monitored plants is managed by Entergy’s Fossil Environmental
Support Group. CEM system data is closely managed and maintains a high level of
quality control as required by EPA regulations (40 CFR Part 75). The Director, Fossil
Environmental Support is responsible for maintaining these data; the primary contact for
these data is the Supervisor, Emission Monitoring and Markets. CEMS data is sourced
from the data acquisition and handling system (DAHS), which is the software package
used to manage and query CEMS data. A report is generated for the annual CO2
emissions and provided to the Manager, Corporate Environmental Operations (see further
description below of how the inventory is generated).
Controllable Power purchase information is managed by the Manager, System Planning
using an internally developed software package called TRADES. This system is used by
the power buyers to track, validate and eventually invoice individual transactions
necessary to support grid operations. Total power purchase data is sourced from the
Manager, Generation and Fuels Accounting and is sourced from the General Ledger
(GL). ISB feeds data into the GL on a monthly basis; accordingly, the initial source of
these data is ISB through the GL. Other data categories are managed as described in the
section above.
Data Management
All data required for the inventory is either reported to or collected by the Manager,
Corporate Environmental Operations in the ESP Group in the January/February
timeframe. This information is maintained in electronic files and calculation
spreadsheets. The specific steps of the process are described further below:
14
DATA RECEIPT – the data described above are transmitted to ESP in the form of
spreadsheet files via email attachment. This transmittal method is secure and
reliable. Once received, the spreadsheet files are saved to a shared Directory
under the ‘GHG Inventory’ folder.
DATA REVIEW AND MANIPULATION – spreadsheets are accessed and
reviewed for the relevant information. In some cases, the data are sorted, totaled
and formatted to facilitate entry into the inventory spreadsheet. The data also is
reviewed during this step to evaluate the overall magnitude to identify any
obvious errors or omissions.
DATA ENTRY – data is entered into the draft working version of the GHG
inventory. During this step, an additional review for data reasonableness and
completeness is performed. Any obvious errors or omissions are addressed
directly with the data manager by phone or email, as needed. All of the data
sources are either entered directly into the inventory or are used for further
calculation of the necessary data points required to develop the overall inventory.
All supporting calculations and spreadsheets are housed on the shared directory
noted above.
QA/QC AND TECHNICAL REVIEW – where data entry is required, a double
check and a reverse double check is always performed. A double check review is
simply another review of the numbers entered into the working draft version of
the inventory, while a reverse double check is an evaluation of the data entered
against the working draft version of the inventory to ensure all data points are
included. Once this review is completed, the draft version is circulated to several
technical reviewers within the company; feedback is used to modify the inventory
as needed.
15
Annual inventories and IMPRD updates are published and posted on SENet, Entergy’s
intranet portal for all information related to Safety and Environmental issues.
Additionally, Entergy posts the total inventory number, along with the verification
statement and other information to its registry account with the American Carbon
Registry (www.americancarbonregistry.org). Entergy will continue to use and update the
inventory template in future years in order to remain as consistent as possible.
Key Performance Indicator Selection and Data Collection
Entergy’s goal is to stabilize GHG emissions at 20% below 2000 levels on an absolute
basis through 2020. The goal does not use emissions intensity; however, on an as needed
basis, Entergy does calculate and evaluate GHG emission intensities. The primary
intensity measure used is tons of emissions per megawatt hour.
Data Collection Process Quality Assurance
The owners of data identified in the previous section are responsible for maintaining
data quality assurance. Every effort should be made to ensure that the data reported are
accurate and complete. ESP will evaluate the data, once collected, to ensure that it is
reasonable and consistent with past years. ESP will also conduct and document QA
checks during the production of the inventory.
As part of the process each data manager uses for collecting GHG data, they must define
and document any areas of possible error and the QA/QC actions they use to maintain
accuracy. CEMS data quality is maintained in accordance with the compliance
requirements contained in EPA regulations (40 CFR Part 75). Any departures from these
data quality measures (i.e. non-compliance events) should be communicated to ESP.
Possible errors in emissions factors and calculations are also documented with the
emissions factors and calculations records. Any inconsistencies and large unexpected
changes from the previous year’s data should be sufficiently explained when the data is
transmitted. The Manager, Corporate Environmental Operations will compare the current
year’s data for each source category to the previous year’s data in order to identify any
16
large, unexpected variations. The data should also be reviewed and all calculations that
are required to ensure that the calculations are correct.
Data Collection System Security and Integrated Tools
Data is typically transferred through Entergy’s e-mail system. Security of this system is
the responsibility of the IT group. Security of the data once it is collected and
consolidated is the responsibility of ESP. Every effort will be made to ensure the security
of the inventory information, primarily by saving this information to the shared directory
in the ‘GHG Inventory’ folder. Entergy’s SENet and the Entergy’s registry account with
the American Carbon Registry (www.americancarbonregistry.org) will serve as the final
publication repository for the GHG inventory. SENet is accessible by all employees
through any computer connected to the internal network, which is password protected
and controlled by IT.
Frequency
Data will be reported to/collected by ESP on an annual basis. This information will be
used to produce an updated GHG inventory each year. No later than the end of the 1st
quarter of each year, ESP will produce an updated inventory for the previous calendar
year. A verification audit will be conducted by an independent third-party. Beginning in
2012, this verification audit will be conducted in accordance with the international
standard – ISO 14064. This updated inventory will be used to track progress against the
reduction goal discussed above.
Base Year
Adjustment for Structural Changes – The base year (2000) will be adjusted for mergers,
acquisitions, and divestitures that occur during the reporting time frame for the goal.
Actual yearly emissions the acquisition of each emission-producing entity/asset that
existed during the base year will be added to the base year and each year that follows.
Emissions from divestitures of assets that existed during the base year will be removed
from the base year and every year that follows. Mergers and capital leases on emission-
producing assets will be planned in the same manner as the acquisitions to the degree that
17
it is practical. There are no planned adjustments for outsourcing. Mergers, acquisition,
divestitures, and capital leases will be identified by ESP and integrated into the GHG
inventory for the calendar year when the deal closes. Additionally, data managers should
keep ESP informed of any such changes. Finally, ESP will monitor such changes
through the investment approval process, which it participates in on as a subject matter
expert.
Since 2000, Entergy has purchased and divested several assets. The table below shows
these transactions and describes any adjustments to the base year that were required,
along with a justification of such changes.
Transaction/Asset Year of
Close Year of COD
Comments
Rhode Island Plant (acquisition)
2011 2002 Did not exist in base year – no adjustment needed
Harrison County Plant (divestiture)
2011 2003 Did not exist in base year – no adjustment needed
Acadia Plant (acquisition)
2011 2002 Did not exist in base year – no adjustment needed
Ouachita Plant (acquisition)
2008 2002 Did not exist in base year – no adjustment needed
Calcasieu Plant – Unit 1 (acquisition)
2008 2000 Estimated plant emissions fall well below materiality threshold (1%) – no adjustment needed
Calcasieu Plant – Unit 2 (acquisition)
2008 2001 Did not exist in base year – no adjustment needed
Perryville Plant (acquisition)
2005 2001/2 Did not exist in base year – no adjustment needed
Spindletop Gas Storage (acquisition)
2004 Pre-2000 Estimated plant emissions fall well below materiality threshold (1%) – no adjustment needed
Thermal Plant – Houston (acquisition)
2003 Pre-2000 Estimated plant emissions fall well below materiality threshold (1%) – no adjustment needed
Thermal Plant – NOLA (acquisition)
2000 Pre-2000 Estimated plant emissions fall well below materiality threshold (1%) – no adjustment needed
Adjustment for Methodology Changes - Changes will be made to calculations and
emissions factors only if justified by regulatory changes, scientific/engineering judgment,
or updates to the various protocols employed. The Director, Corporate Environmental
Programs will make the final decision as to whether or not make such adjustments. In
cases where changes are made, the changes will be made to all years in the inventory,
18
including the base year, so that all emissions are reported using the same basis for all
years.
An IMPRD Revision Log is included in this document as Attachment 3 and should be
used to document any structural or methodological changes to corporate greenhouse gas
inventories or this IMPRD.
Management Tools
Roles and Responsibilities
The Director, Corporate Environmental Programs is responsible for overall GHG
program management and external reporting. This individual is also responsible for
compiling the data required to update the GHG inventory on an annual basis before the
end of Q1 and for evaluating the reasonableness of the GHG data.
The Vice President, Environmental Strategy and Policy reviews changes to the programs
that Entergy participates in and updates the IMPRD as needed. These responsibilities are
defined in more detail in specific sections of this IMPRD. ESP then produces and
distributes needed reports summarizing the emissions inventory and progress toward the
goal.
ESP also provides guidance and feedback to relevant company Managers and Directors
on what sources to include in the inventory, what data to use and collect, and what
emissions factors are most appropriate.
Various Managers and Directors around the company are responsible for maintaining the
data necessary to complete the inventory and subsequent updates. Entergy’s
Environmental Leadership Team (ELT) reviews and approves the summary of each
year’s data.
19
Communication
The IMPRD will be communicated upon initial finalization and subsequently on a
periodic basis, when major revisions occur or as needed. Opportunities for
communication with Data Managers include when training is delivered, when data
requests are made and when the IMPRD is revised.
Training
Entergy currently has no training materials available regarding GHG management or
inventory. Training will be delivered on an ad hoc basis to employees involved in the
process. The Manager, Corporate Environmental Operations will conduct this training as
needed.
Document Retention and Control Policy
Entergy’s GHG management program and all relevant records and documentation should
be managed in accordance with Entergy's Records Management & Retention Policy.
Entergy’s SENet will serve as the final publication repository for the GHG inventory.
SENet is accessible by all employees through any computer connected to the internal
network. Additionally, the annual inventory, verification statement and IMPRD will be
submitted to the American Carbon Registry for posting on Entergy’s registry account.
This is accessible to anyone via the ACR website (www.americancarbonregistry.com).
Data verification and documentation is essential for the authenticity of this program. To
maintain a high standard, all records verifying the GHG inventories and registry contents
will be maintained by ESP for a minimum of three years. Documentation of GHG
reduction project expenditures and project close-out reports shall also be maintained for a
minimum of three years.
20
Auditing and Verification
Internal Auditing
Internal auditing of the GHG program will be conducted by ESP staff or designee. Some
of the data used to develop emission estimates are also audited through Entergy’s Safety
and Environment Audit Program (i.e., CEMS data/processes) administered by ESP.
Findings related to the GHG Inventory will be provided to the VP, ESP who will
determine the responsible individual for each finding’s corrective action. The audit will
include a review of the IMPRD and the latest version of the inventory. A consistency
check is also performed against the prior year’s data, especially in the area of direct
emissions. Changes to the IMPRD driven by audit results will also be entered into the
IMPRD Revision Log (Attachment 3).
External Validation and/or Verification
Entergy is committed to an external third-party audit of the GHG baseline/inventory data,
calculations, and records. This third-party verification of the program will be conducted
at least every other year, including 2006 and the goal year. Since 2006, Entergy has
sought annual, third-party verification of the GHG Inventory. The verification statement
and report are made available via the ACR website and SENet.
In 2012, Entergy decided to elevate this third-party verification audit to the ISO standard
for GHG Inventory preparation and verification (ISO 14064). This is an expanded
verification effort that requires a higher level of scrutiny, additional data
review/evaluation. The verification report will include additional details and statements
regarding the type of verification, level of assurance and an uncertainty analysis. This
IMPRD and Entergy’s 2011 GHG Inventory are verified in accordance with ISO 14064-3
at a LIMITED Level of Assurance.
Management Review
The GHG emissions summary data will be reviewed and approved annually by the ELT.
Goal setting, progress toward meeting goals, and any additional action or options
necessary to meet the goals will be covered in this management review. The VP, ESP
21
will verify that the information has been reviewed and found to be substantially
compliant with this IMPRD. Additionally, this information will be presented to our
Safety and Environmental Executive Forum and to the Audit Committee of the Board of
Directors during our annual reporting cycle.
Corrective Action
Any findings identified through QA/QC and internal and external reviews related to the
greenhouse gas inventory or IMPRD are assigned to the appropriate Manager or Director
for action by the VP, ESP. The VP, ESP will maintain a list of identified gaps related to
the program, the person that is responsible for closing the gap, and the required timing for
gap closure. Changes to the IMPRD driven by this process will also be entered into the
IMPRD Revision Log (Attachment 3).
Any findings identified through QA/QC and internal and external audits related to the
GHG emission inventory, calculations, or reporting are assigned to the VP, ESP or his
designee.
22
Voluntary Commitment and Reduction Efforts
Voluntary Commitments
In May 2001, Entergy publicly committed to stabilize CO2 emissions from its power
plants at year 2000 levels through 2005, and dedicated $25 million in supplemental
corporate funding to achieve this target over the five-year period. This commitment was
focused on CO2 emissions from fuel combustion at the company’s power plants and
requires that Entergy:
Stabilize CO2 emissions from its U.S. power plants at year 2000 levels through
2005.
Establish the $25 Million Environmental Initiatives Fund (EIF) in support of
achieving the 2001-2005 stabilization targets.
Document activities and annual report progress.
Employ an independent third party organization to verify measurement of
Entergy’s CO2 emissions from U.S. power plants.
Entergy completed this first commitment 23 percent below year 2000 levels.
Entergy’s second commitment, made in 2005, included:
Stabilize CO2 emissions from all Entergy operations at 20% below 2000 levels
through 2010.
Commit funding of $3.25 million in support of achieving the 2005-2010 target.
Document activities and annually report progress.
Entergy completed this second commitment more than three percent below the target. On
a cumulative basis, Entergy bettered the two commitments by over 14 percent.
In 2011, Entergy once again renewed its commitment to stabilize GHGs with a third
commitment:
Stabilize CO2 emissions from all Entergy operations at 20% below 2000 levels
through 2020.
23
Commit funding of $10 million in support of achieving the 2011-2020 target.
Document activities and annually report progress.
Additional information on these commitments can be viewed on Entergy's website. Voluntary Reductions
Since 2001, Entergy has invested in various types of internal and external emission
reduction projects. These projects range from internal plant efficiency improvements, to
reforestation projects, to carbon offset purchases. These projects are described annually
in the Environmental Section of Entergy’s Sustainability Report.
In addition to the projects described above, Entergy owns several facilities that generate
electricity without emission of GHGs. Entergy’s nuclear fleet (10,101 MW), wind farms
(80 MW) and hydro plants (74 MW) generate virtually emission free electricity and
constitute a major portion of Entergy’s overall generation mix (approximately 36.5% at
the end of 2010) [Source – Entergy’s 2010 Statistical Report].

Attachment 1
2011 GHG Inventory – FINAL
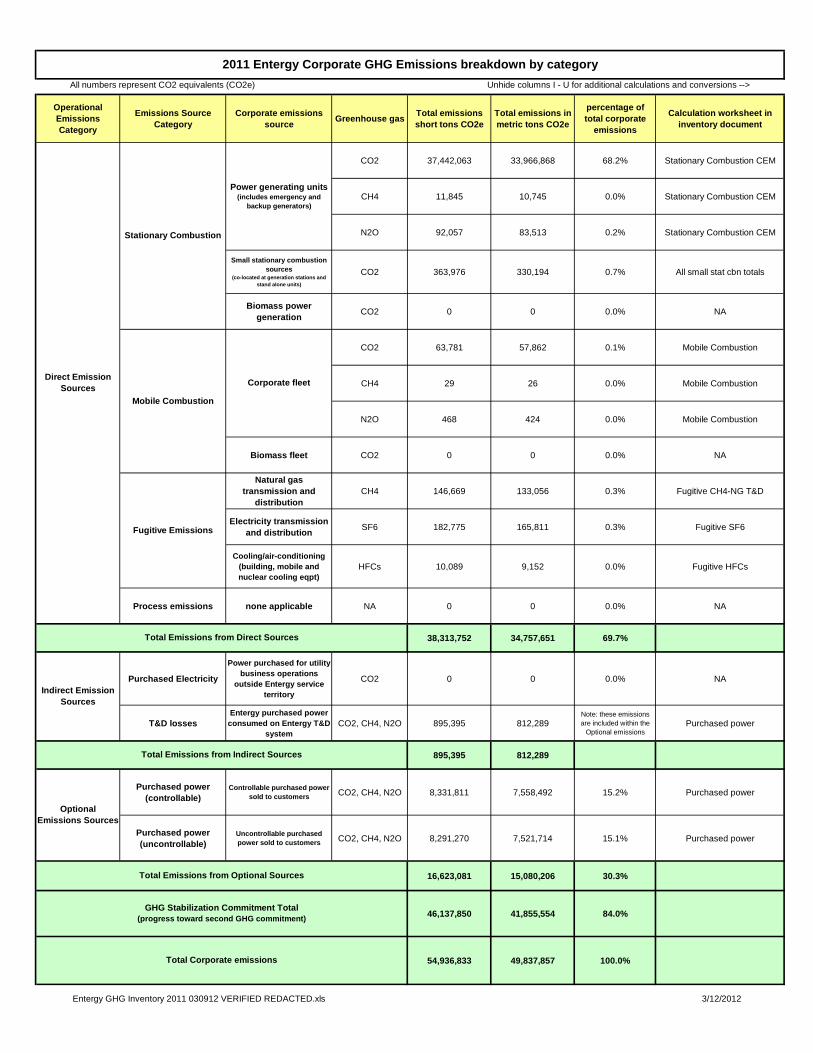
Operational Emissions Category
Emissions Source Category
Corporate emissions source Greenhouse gas Total emissions
short tons CO2eTotal emissions in metric tons CO2e
percentage of total corporate
emissions
Calculation worksheet in inventory document
CO2 37,442,063 33,966,868 68.2% Stationary Combustion CEM
CH4 11,845 10,745 0.0% Stationary Combustion CEM
N2O 92,057 83,513 0.2% Stationary Combustion CEM
Small stationary combustion sources
(co-located at generation stations and stand alone units)
CO2 363,976 330,194 0.7% All small stat cbn totals
Biomass power generation CO2 0 0 0.0% NA
CO2 63,781 57,862 0.1% Mobile Combustion
CH4 29 26 0.0% Mobile Combustion
N2O 468 424 0.0% Mobile Combustion
Biomass fleet CO2 0 0 0.0% NA
Natural gas transmission and
distributionCH4 146,669 133,056 0.3% Fugitive CH4-NG T&D
Electricity transmission and distribution SF6 182,775 165,811 0.3% Fugitive SF6
Cooling/air-conditioning (building, mobile and nuclear cooling eqpt)
HFCs 10,089 9,152 0.0% Fugitive HFCs
Process emissions none applicable NA 0 0 0.0% NA
38,313,752 34,757,651 69.7%
Purchased Electricity
Power purchased for utility business operations
outside Entergy service territory
CO2 0 0 0.0% NA
T&D lossesEntergy purchased power
consumed on Entergy T&D system
CO2, CH4, N2O 895,395 812,289Note: these emissions are included within the
Optional emissionsPurchased power
895,395 812,289
Purchased power (controllable)
Controllable purchased power sold to customers CO2, CH4, N2O 8,331,811 7,558,492 15.2% Purchased power
Purchased power (uncontrollable)
Uncontrollable purchased power sold to customers CO2, CH4, N2O 8,291,270 7,521,714 15.1% Purchased power
16,623,081 15,080,206 30.3%
46,137,850 41,855,554 84.0%
54,936,833 49,837,857 100.0%
Total Emissions from Direct Sources
Power generating units (includes emergency and
backup generators)
Corporate fleet
Total Corporate emissions
Total Emissions from Indirect Sources
Indirect Emission Sources
Optional Emissions Sources
GHG Stabilization Commitment Total (progress toward second GHG commitment)
Total Emissions from Optional Sources
2011 Entergy Corporate GHG Emissions breakdown by categoryAll numbers represent CO2 equivalents (CO2e) Unhide columns I - U for additional calculations and conversions -->
Stationary Combustion
Direct Emission Sources
Mobile Combustion
Fugitive Emissions
Entergy GHG Inventory 2011 030912 VERIFIED REDACTED.xls 3/12/2012
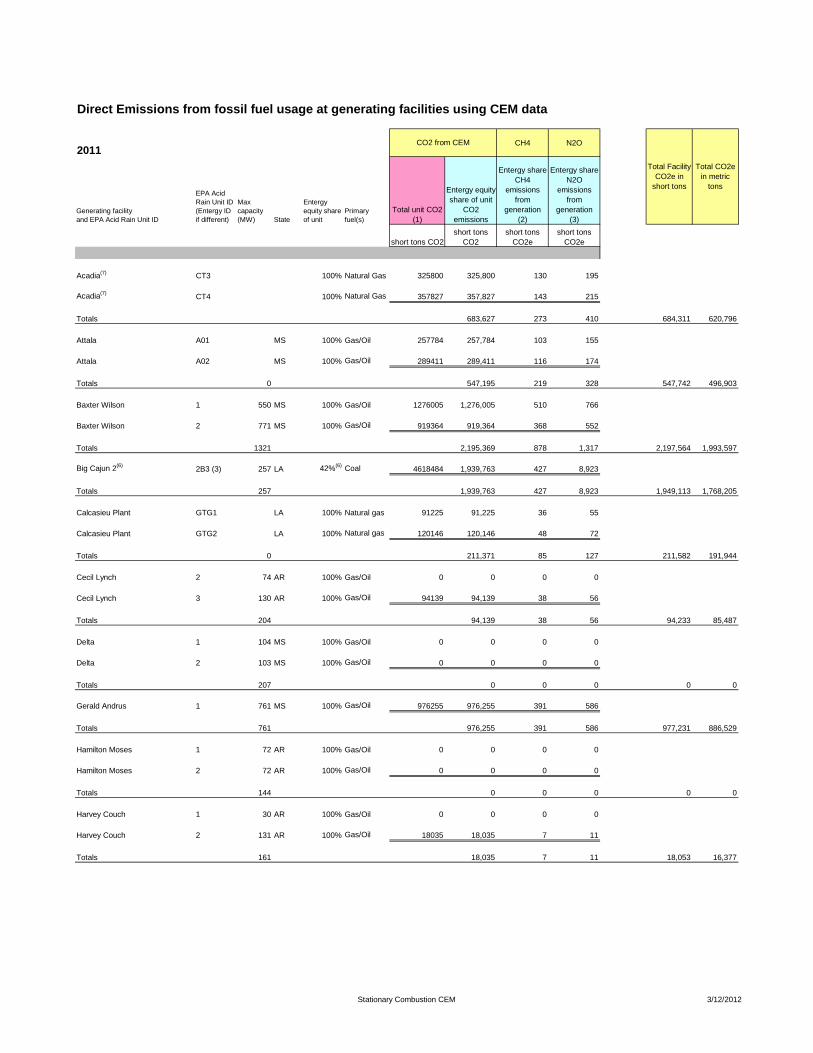
2011CH4 N2O
Generating facility and EPA Acid Rain Unit ID
EPA Acid Rain Unit ID (Entergy ID if different)
Max capacity (MW) State
Entergy equity share of unit
Primary fuel(s)
Total unit CO2 (1)
Entergy equity share of unit
CO2 emissions
Entergy share CH4
emissions from
generation(2)
Entergy share N2O
emissions from
generation(3)
short tons CO2short tons
CO2short tons
CO2eshort tons
CO2e
Acadia(7) CT3 100% Natural Gas 325800 325,800 130 195
Acadia(7) CT4 100% Natural Gas 357827 357,827 143 215
Totals 683,627 273 410 684,311 620,796
Attala A01 MS 100% Gas/Oil 257784 257,784 103 155
Attala A02 MS 100% Gas/Oil 289411 289,411 116 174
Totals 0 547,195 219 328 547,742 496,903
Baxter Wilson 1 550 MS 100% Gas/Oil 1276005 1,276,005 510 766
Baxter Wilson 2 771 MS 100% Gas/Oil 919364 919,364 368 552
Totals 1321 2,195,369 878 1,317 2,197,564 1,993,597
Big Cajun 2(6) 2B3 (3) 257 LA 42%(6) Coal 4618484 1,939,763 427 8,923
Totals 257 1,939,763 427 8,923 1,949,113 1,768,205
Calcasieu Plant GTG1 LA 100% Natural gas 91225 91,225 36 55
Calcasieu Plant GTG2 LA 100% Natural gas 120146 120,146 48 72
Totals 0 211,371 85 127 211,582 191,944
Cecil Lynch 2 74 AR 100% Gas/Oil 0 0 0 0
Cecil Lynch 3 130 AR 100% Gas/Oil 94139 94,139 38 56
Totals 204 94,139 38 56 94,233 85,487
Delta 1 104 MS 100% Gas/Oil 0 0 0 0
Delta 2 103 MS 100% Gas/Oil 0 0 0 0
Totals 207 0 0 0 0 0
Gerald Andrus 1 761 MS 100% Gas/Oil 976255 976,255 391 586
Totals 761 976,255 391 586 977,231 886,529
Hamilton Moses 1 72 AR 100% Gas/Oil 0 0 0 0
Hamilton Moses 2 72 AR 100% Gas/Oil 0 0 0 0
Totals 144 0 0 0 0 0
Harvey Couch 1 30 AR 100% Gas/Oil 0 0 0 0
Harvey Couch 2 131 AR 100% Gas/Oil 18035 18,035 7 11
Totals 161 18,035 7 11 18,053 16,377
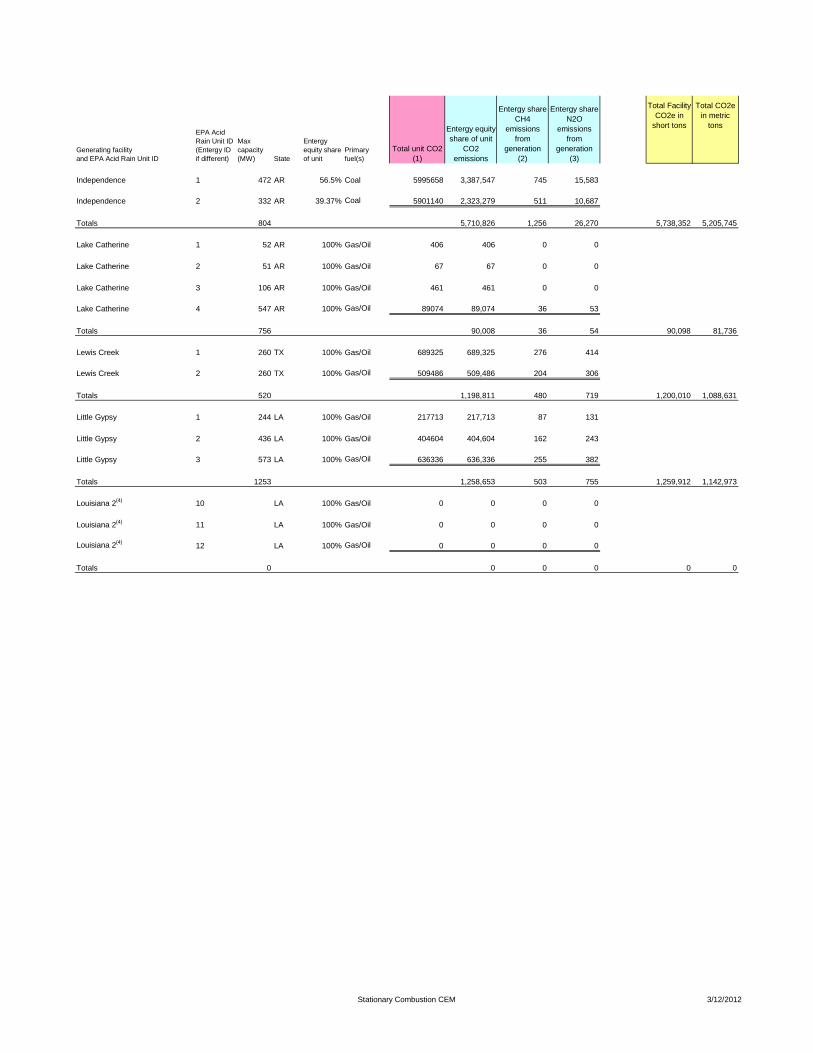
Direct Emissions from fossil fuel usage at generating facilities using CEM data
CO2 from CEM
Total Facility CO2e in
short tons
Total CO2e in metric
tons
Stationary Combustion CEM 3/12/2012
Generating facility and EPA Acid Rain Unit ID
EPA Acid Rain Unit ID (Entergy ID if different)
Max capacity (MW) State
Entergy equity share of unit
Primary fuel(s)
Total unit CO2 (1)
Entergy equity share of unit
CO2 emissions
Entergy share CH4
emissions from
generation(2)
Entergy share N2O
emissions from
generation(3)
Total Facility CO2e in
short tons
Total CO2e in metric
tons
Independence 1 472 AR 56.5% Coal 5995658 3,387,547 745 15,583
Independence 2 332 AR 39.37% Coal 5901140 2,323,279 511 10,687
Totals 804 5,710,826 1,256 26,270 5,738,352 5,205,745
Lake Catherine 1 52 AR 100% Gas/Oil 406 406 0 0
Lake Catherine 2 51 AR 100% Gas/Oil 67 67 0 0
Lake Catherine 3 106 AR 100% Gas/Oil 461 461 0 0
Lake Catherine 4 547 AR 100% Gas/Oil 89074 89,074 36 53
Totals 756 90,008 36 54 90,098 81,736
Lewis Creek 1 260 TX 100% Gas/Oil 689325 689,325 276 414
Lewis Creek 2 260 TX 100% Gas/Oil 509486 509,486 204 306
Totals 520 1,198,811 480 719 1,200,010 1,088,631
Little Gypsy 1 244 LA 100% Gas/Oil 217713 217,713 87 131
Little Gypsy 2 436 LA 100% Gas/Oil 404604 404,604 162 243
Little Gypsy 3 573 LA 100% Gas/Oil 636336 636,336 255 382
Totals 1253 1,258,653 503 755 1,259,912 1,142,973
Louisiana 2(4) 10 LA 100% Gas/Oil 0 0 0 0
Louisiana 2(4) 11 LA 100% Gas/Oil 0 0 0 0
Louisiana 2(4) 12 LA 100% Gas/Oil 0 0 0 0
Totals 0 0 0 0 0 0
Stationary Combustion CEM 3/12/2012
Generating facility and EPA Acid Rain Unit ID
EPA Acid Rain Unit ID (Entergy ID if different)
Max capacity (MW) State
Entergy equity share of unit
Primary fuel(s)
Total unit CO2 (1)
Entergy equity share of unit
CO2 emissions
Entergy share CH4
emissions from
generation(2)
Entergy share N2O
emissions from
generation(3)
Total Facility CO2e in
short tons
Total CO2e in metric
tons
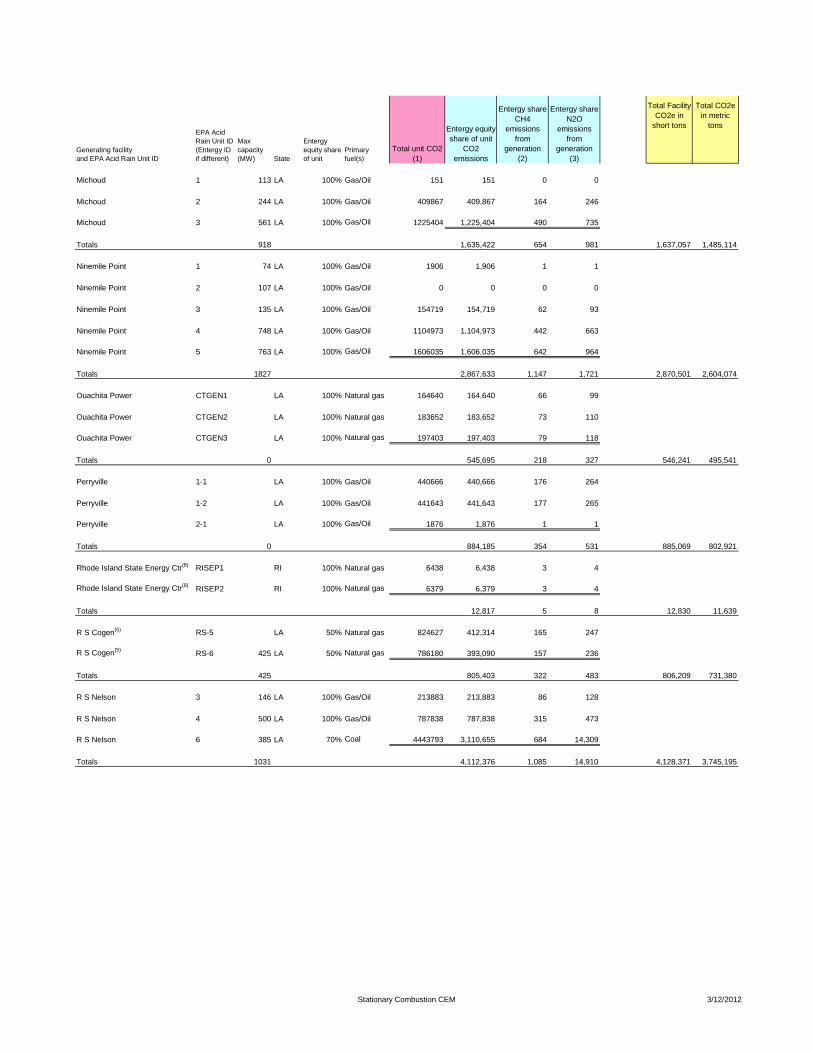
Michoud 1 113 LA 100% Gas/Oil 151 151 0 0
Michoud 2 244 LA 100% Gas/Oil 409867 409,867 164 246
Michoud 3 561 LA 100% Gas/Oil 1225404 1,225,404 490 735
Totals 918 1,635,422 654 981 1,637,057 1,485,114
Ninemile Point 1 74 LA 100% Gas/Oil 1906 1,906 1 1
Ninemile Point 2 107 LA 100% Gas/Oil 0 0 0 0
Ninemile Point 3 135 LA 100% Gas/Oil 154719 154,719 62 93
Ninemile Point 4 748 LA 100% Gas/Oil 1104973 1,104,973 442 663
Ninemile Point 5 763 LA 100% Gas/Oil 1606035 1,606,035 642 964
Totals 1827 2,867,633 1,147 1,721 2,870,501 2,604,074
Ouachita Power CTGEN1 LA 100% Natural gas 164640 164,640 66 99
Ouachita Power CTGEN2 LA 100% Natural gas 183652 183,652 73 110
Ouachita Power CTGEN3 LA 100% Natural gas 197403 197,403 79 118
Totals 0 545,695 218 327 546,241 495,541
Perryville 1-1 LA 100% Gas/Oil 440666 440,666 176 264
Perryville 1-2 LA 100% Gas/Oil 441643 441,643 177 265
Perryville 2-1 LA 100% Gas/Oil 1876 1,876 1 1
Totals 0 884,185 354 531 885,069 802,921
Rhode Island State Energy Ctr(8) RISEP1 RI 100% Natural gas 6438 6,438 3 4
Rhode Island State Energy Ctr(8) RISEP2 RI 100% Natural gas 6379 6,379 3 4
Totals 12,817 5 8 12,830 11,639
R S Cogen(5) RS-5 LA 50% Natural gas 824627 412,314 165 247
R S Cogen(5) RS-6 425 LA 50% Natural gas 786180 393,090 157 236
Totals 425 805,403 322 483 806,209 731,380
R S Nelson 3 146 LA 100% Gas/Oil 213883 213,883 86 128
R S Nelson 4 500 LA 100% Gas/Oil 787838 787,838 315 473
R S Nelson 6 385 LA 70% Coal 4443793 3,110,655 684 14,309
Totals 1031 4,112,376 1,085 14,910 4,128,371 3,745,195
Stationary Combustion CEM 3/12/2012
Generating facility and EPA Acid Rain Unit ID
EPA Acid Rain Unit ID (Entergy ID if different)
Max capacity (MW) State
Entergy equity share of unit
Primary fuel(s)
Total unit CO2 (1)
Entergy equity share of unit
CO2 emissions
Entergy share CH4
emissions from
generation(2)
Entergy share N2O
emissions from
generation(3)
Total Facility CO2e in
short tons
Total CO2e in metric
tons
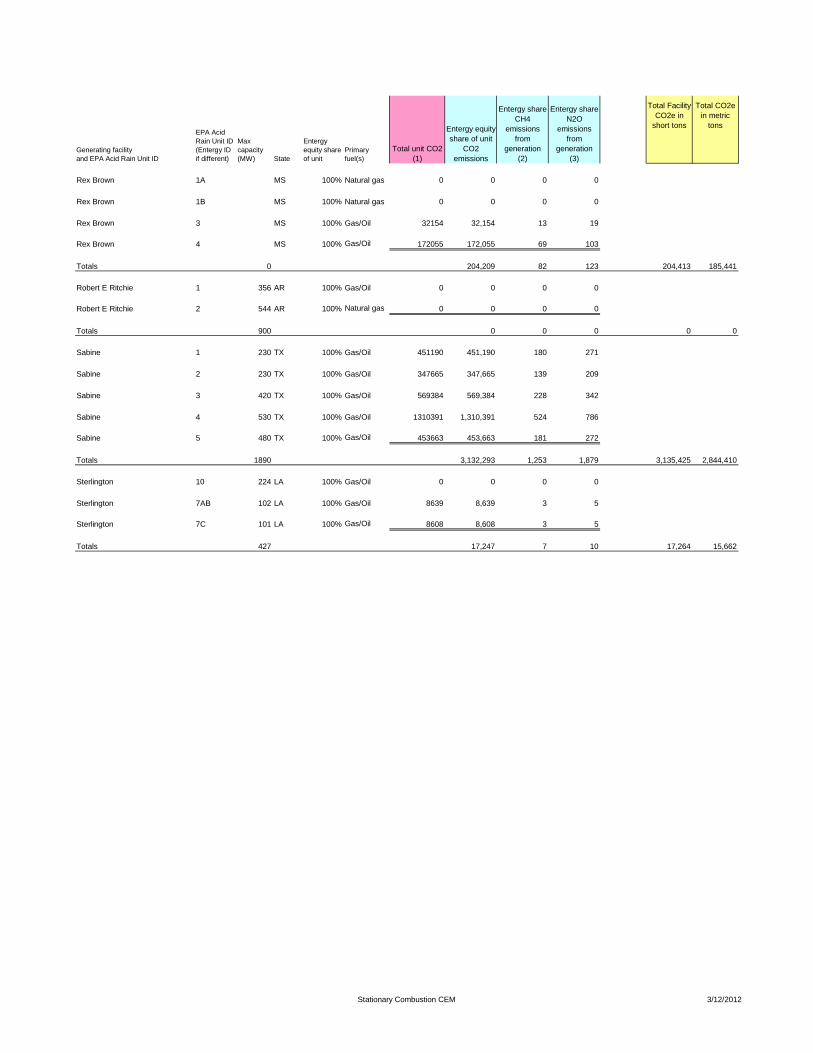
Rex Brown 1A MS 100% Natural gas 0 0 0 0
Rex Brown 1B MS 100% Natural gas 0 0 0 0
Rex Brown 3 MS 100% Gas/Oil 32154 32,154 13 19
Rex Brown 4 MS 100% Gas/Oil 172055 172,055 69 103
Totals 0 204,209 82 123 204,413 185,441
Robert E Ritchie 1 356 AR 100% Gas/Oil 0 0 0 0
Robert E Ritchie 2 544 AR 100% Natural gas 0 0 0 0
Totals 900 0 0 0 0 0
Sabine 1 230 TX 100% Gas/Oil 451190 451,190 180 271
Sabine 2 230 TX 100% Gas/Oil 347665 347,665 139 209
Sabine 3 420 TX 100% Gas/Oil 569384 569,384 228 342
Sabine 4 530 TX 100% Gas/Oil 1310391 1,310,391 524 786
Sabine 5 480 TX 100% Gas/Oil 453663 453,663 181 272
Totals 1890 3,132,293 1,253 1,879 3,135,425 2,844,410
Sterlington 10 224 LA 100% Gas/Oil 0 0 0 0
Sterlington 7AB 102 LA 100% Gas/Oil 8639 8,639 3 5
Sterlington 7C 101 LA 100% Gas/Oil 8608 8,608 3 5
Totals 427 17,247 7 10 17,264 15,662
Stationary Combustion CEM 3/12/2012
Generating facility and EPA Acid Rain Unit ID
EPA Acid Rain Unit ID (Entergy ID if different)
Max capacity (MW) State
Entergy equity share of unit
Primary fuel(s)
Total unit CO2 (1)
Entergy equity share of unit
CO2 emissions
Entergy share CH4
emissions from
generation(2)
Entergy share N2O
emissions from
generation(3)
Total Facility CO2e in
short tons
Total CO2e in metric
tons
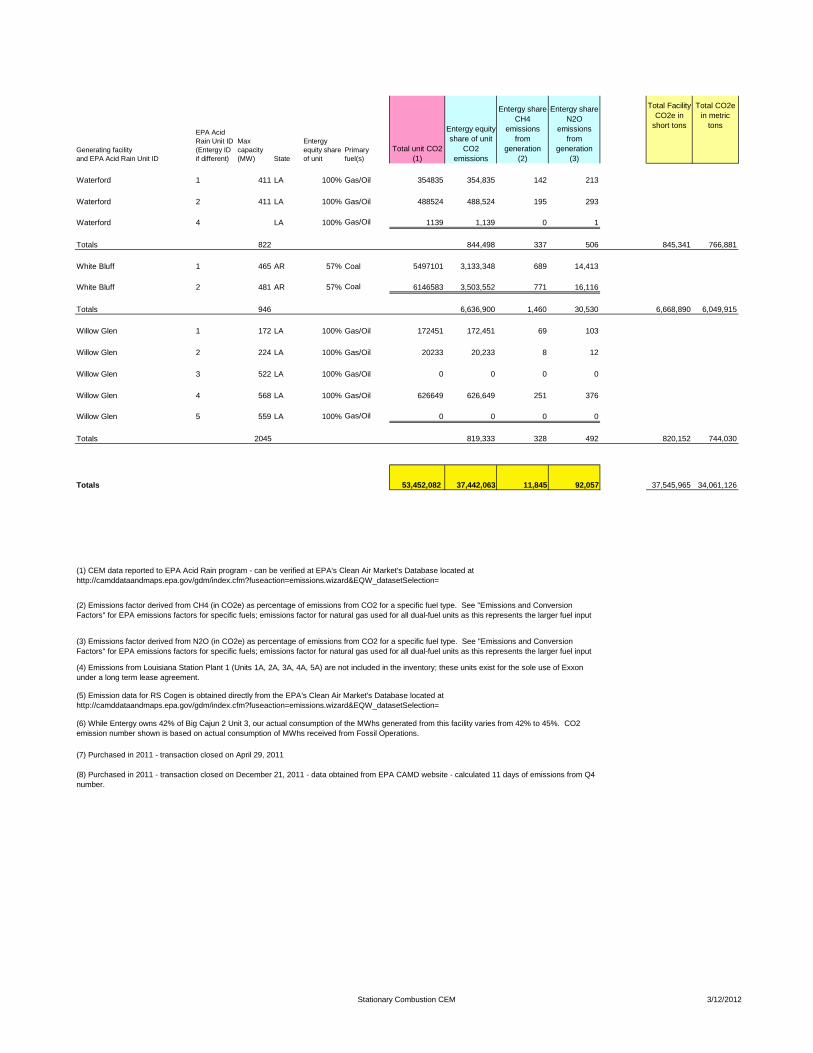
Waterford 1 411 LA 100% Gas/Oil 354835 354,835 142 213
Waterford 2 411 LA 100% Gas/Oil 488524 488,524 195 293
Waterford 4 LA 100% Gas/Oil 1139 1,139 0 1
Totals 822 844,498 337 506 845,341 766,881
White Bluff 1 465 AR 57% Coal 5497101 3,133,348 689 14,413
White Bluff 2 481 AR 57% Coal 6146583 3,503,552 771 16,116
Totals 946 6,636,900 1,460 30,530 6,668,890 6,049,915
Willow Glen 1 172 LA 100% Gas/Oil 172451 172,451 69 103
Willow Glen 2 224 LA 100% Gas/Oil 20233 20,233 8 12
Willow Glen 3 522 LA 100% Gas/Oil 0 0 0 0
Willow Glen 4 568 LA 100% Gas/Oil 626649 626,649 251 376
Willow Glen 5 559 LA 100% Gas/Oil 0 0 0 0
Totals 2045 819,333 328 492 820,152 744,030
Totals 53,452,082 37,442,063 11,845 92,057 37,545,965 34,061,126
(2) Emissions factor derived from CH4 (in CO2e) as percentage of emissions from CO2 for a specific fuel type. See "Emissions and Conversion Factors" for EPA emissions factors for specific fuels; emissions factor for natural gas used for all dual-fuel units as this represents the larger fuel input
(3) Emissions factor derived from N2O (in CO2e) as percentage of emissions from CO2 for a specific fuel type. See "Emissions and Conversion Factors" for EPA emissions factors for specific fuels; emissions factor for natural gas used for all dual-fuel units as this represents the larger fuel input
(1) CEM data reported to EPA Acid Rain program - can be verified at EPA's Clean Air Market's Database located at http://camddataandmaps.epa.gov/gdm/index.cfm?fuseaction=emissions.wizard&EQW_datasetSelection=
(8) Purchased in 2011 - transaction closed on December 21, 2011 - data obtained from EPA CAMD website - calculated 11 days of emissions from Q4 number.
(6) While Entergy owns 42% of Big Cajun 2 Unit 3, our actual consumption of the MWhs generated from this facility varies from 42% to 45%. CO2 emission number shown is based on actual consumption of MWhs received from Fossil Operations.
(5) Emission data for RS Cogen is obtained directly from the EPA's Clean Air Market's Database located at http://camddataandmaps.epa.gov/gdm/index.cfm?fuseaction=emissions.wizard&EQW_datasetSelection=
(4) Emissions from Louisiana Station Plant 1 (Units 1A, 2A, 3A, 4A, 5A) are not included in the inventory; these units exist for the sole use of Exxon under a long term lease agreement.
(7) Purchased in 2011 - transaction closed on April 29, 2011
Stationary Combustion CEM 3/12/2012
Plant Capacity (total MW of all units)
GHG Emissions reported under Mandatory Reporting Rule (short tons of all gases in 2010)[obtained from Fossil Operations unless otherwise noted]
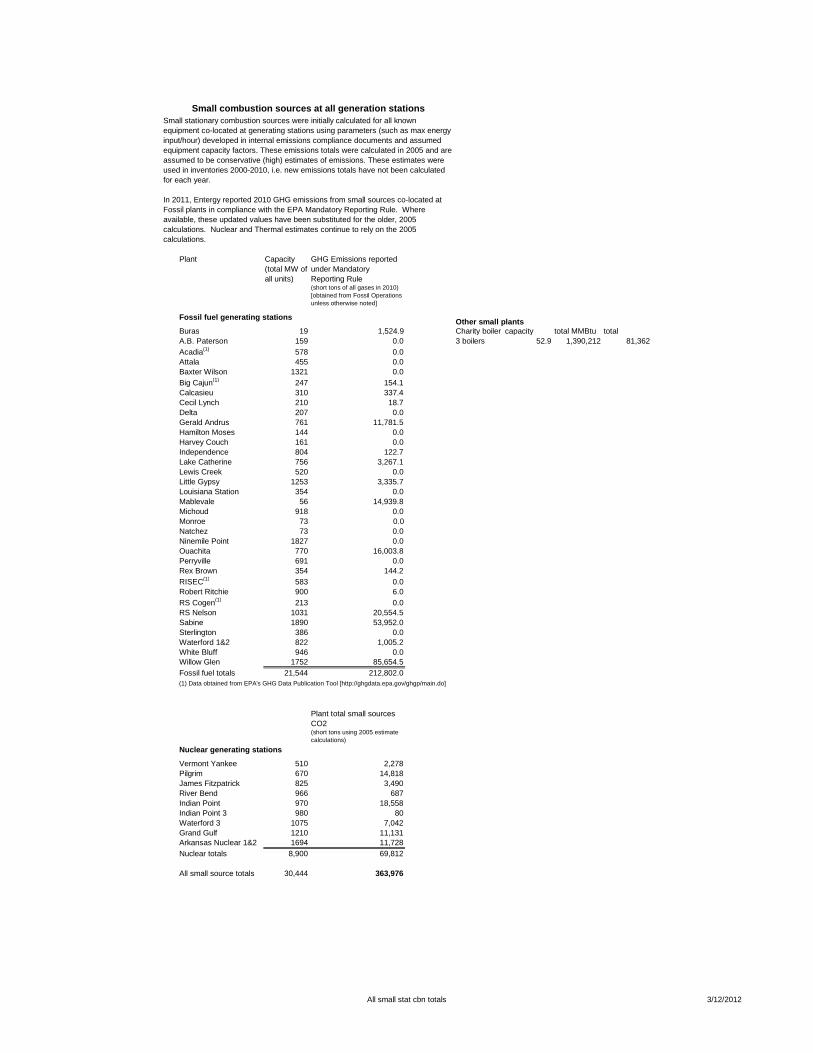
Fossil fuel generating stations Other small plantsBuras 19 1,524.9 Charity boiler capacity total MMBtu total A.B. Paterson 159 0.0 3 boilers 52.9 1,390,212 81,362Acadia(1) 578 0.0Attala 455 0.0Baxter Wilson 1321 0.0Big Cajun(1) 247 154.1Calcasieu 310 337.4Cecil Lynch 210 18.7Delta 207 0.0Gerald Andrus 761 11,781.5Hamilton Moses 144 0.0Harvey Couch 161 0.0Independence 804 122.7Lake Catherine 756 3,267.1Lewis Creek 520 0.0Little Gypsy 1253 3,335.7Louisiana Station 354 0.0Mablevale 56 14,939.8Michoud 918 0.0Monroe 73 0.0Natchez 73 0.0Ninemile Point 1827 0.0Ouachita 770 16,003.8Perryville 691 0.0Rex Brown 354 144.2RISEC(1) 583 0.0Robert Ritchie 900 6.0RS Cogen(1) 213 0.0RS Nelson 1031 20,554.5Sabine 1890 53,952.0Sterlington 386 0.0Waterford 1&2 822 1,005.2White Bluff 946 0.0Willow Glen 1752 85,654.5Fossil fuel totals 21,544 212,802.0(1) Data obtained from EPA's GHG Data Publication Tool [http://ghgdata.epa.gov/ghgp/main.do]
Plant total small sources CO2 (short tons using 2005 estimate calculations)
Nuclear generating stations
Vermont Yankee 510 2,278Pilgrim 670 14,818James Fitzpatrick 825 3,490River Bend 966 687Indian Point 970 18,558Indian Point 3 980 80Waterford 3 1075 7,042Grand Gulf 1210 11,131Arkansas Nuclear 1&2 1694 11,728Nuclear totals 8,900 69,812
All small source totals 30,444 363,976
Small stationary combustion sources were initially calculated for all known equipment co-located at generating stations using parameters (such as max energy input/hour) developed in internal emissions compliance documents and assumed equipment capacity factors. These emissions totals were calculated in 2005 and are assumed to be conservative (high) estimates of emissions. These estimates were used in inventories 2000-2010, i.e. new emissions totals have not been calculated for each year.
In 2011, Entergy reported 2010 GHG emissions from small sources co-located at Fossil plants in compliance with the EPA Mandatory Reporting Rule. Where available, these updated values have been substituted for the older, 2005 calculations. Nuclear and Thermal estimates continue to rely on the 2005 calculations.
Small combustion sources at all generation stations
All small stat cbn totals 3/12/2012
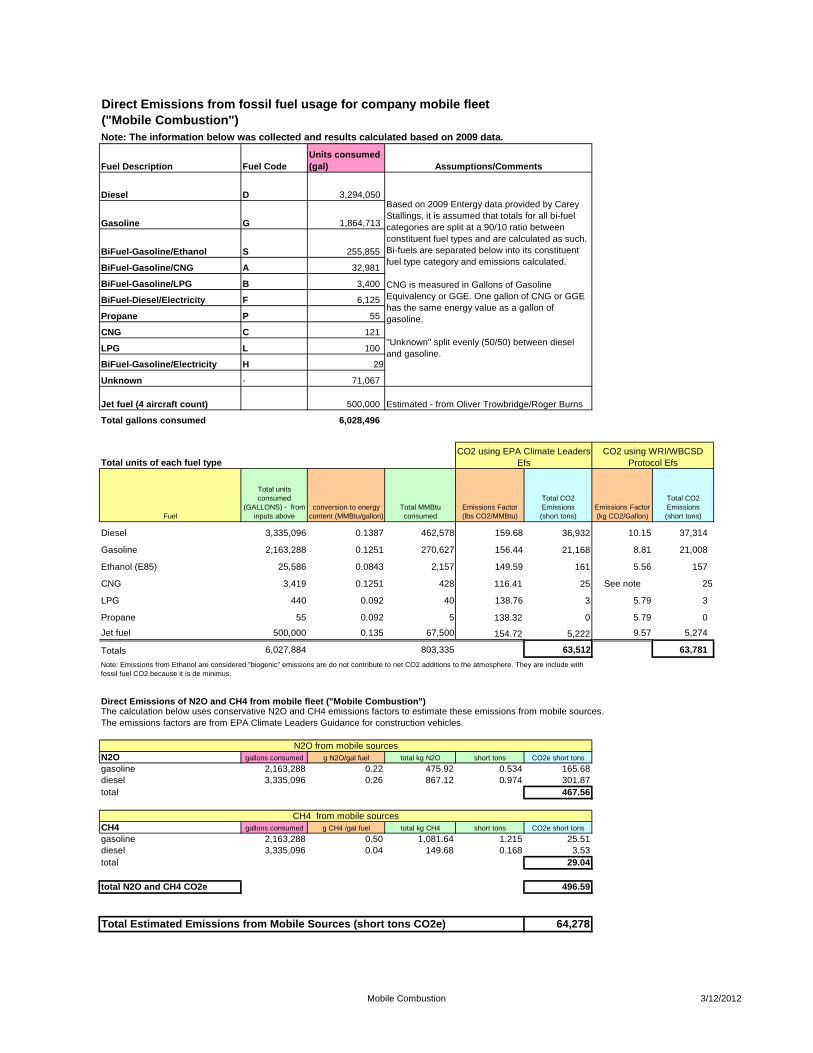
Fuel Description Fuel CodeUnits consumed (gal)
Diesel D 3,294,050
Gasoline G 1,864,713
BiFuel-Gasoline/Ethanol S 255,855
BiFuel-Gasoline/CNG A 32,981
BiFuel-Gasoline/LPG B 3,400
BiFuel-Diesel/Electricity F 6,125
Propane P 55
CNG C 121
LPG L 100
BiFuel-Gasoline/Electricity H 29
Unknown - 71,067
Jet fuel (4 aircraft count) 500,000
Total gallons consumed 6,028,496
Total units of each fuel type
Fuel
Total units consumed
(GALLONS) - from inputs above
conversion to energy content (MMBtu/gallon)
Total MMBtu consumed
Emissions Factor (lbs CO2/MMBtu)
Total CO2 Emissions (short tons)
Emissions Factor (kg CO2/Gallon)
Total CO2 Emissions (short tons)
Diesel 3,335,096 0.1387 462,578 159.68 36,932 10.15 37,314
Gasoline 2,163,288 0.1251 270,627 156.44 21,168 8.81 21,008
Ethanol (E85) 25,586 0.0843 2,157 149.59 161 5.56 157
CNG 3,419 0.1251 428 116.41 25 See note 25
LPG 440 0.092 40 138.76 3 5.79 3
Propane 55 0.092 5 138.32 0 5.79 0
Jet fuel 500,000 0.135 67,500 154.72 5,222 9.57 5,274
Totals 6,027,884 803,335 63,512 63,781
Direct Emissions of N2O and CH4 from mobile fleet ("Mobile Combustion")
N2O gallons consumed g N2O/gal fuel total kg N2O short tons CO2e short tonsgasoline 2,163,288 0.22 475.92 0.534 165.68diesel 3,335,096 0.26 867.12 0.974 301.87total 467.56
CH4 gallons consumed g CH4 /gal fuel total kg CH4 short tons CO2e short tonsgasoline 2,163,288 0.50 1,081.64 1.215 25.51diesel 3,335,096 0.04 149.68 0.168 3.53total 29.04
total N2O and CH4 CO2e 496.59
64,278
Direct Emissions from fossil fuel usage for company mobile fleet ("Mobile Combustion")Note: The information below was collected and results calculated based on 2009 data.
Assumptions/Comments
Based on 2009 Entergy data provided by Carey Stallings, it is assumed that totals for all bi-fuel categories are split at a 90/10 ratio between constituent fuel types and are calculated as such. Bi-fuels are separated below into its constituent fuel type category and emissions calculated.
CNG is measured in Gallons of Gasoline Equivalency or GGE. One gallon of CNG or GGE has the same energy value as a gallon of gasoline.
"Unknown" split evenly (50/50) between diesel and gasoline.
N2O from mobile sources
CH4 from mobile sources
Total Estimated Emissions from Mobile Sources (short tons CO2e)
Estimated - from Oliver Trowbridge/Roger Burns
CO2 using EPA Climate Leaders Efs
Note: Emissions from Ethanol are considered "biogenic" emissions are do not contribute to net CO2 additions to the atmosphere. They are include with fossil fuel CO2 because it is de minimus.
The calculation below uses conservative N2O and CH4 emissions factors to estimate these emissions from mobile sources. The emissions factors are from EPA Climate Leaders Guidance for construction vehicles.
CO2 using WRI/WBCSD Protocol Efs
Mobile Combustion 3/12/2012
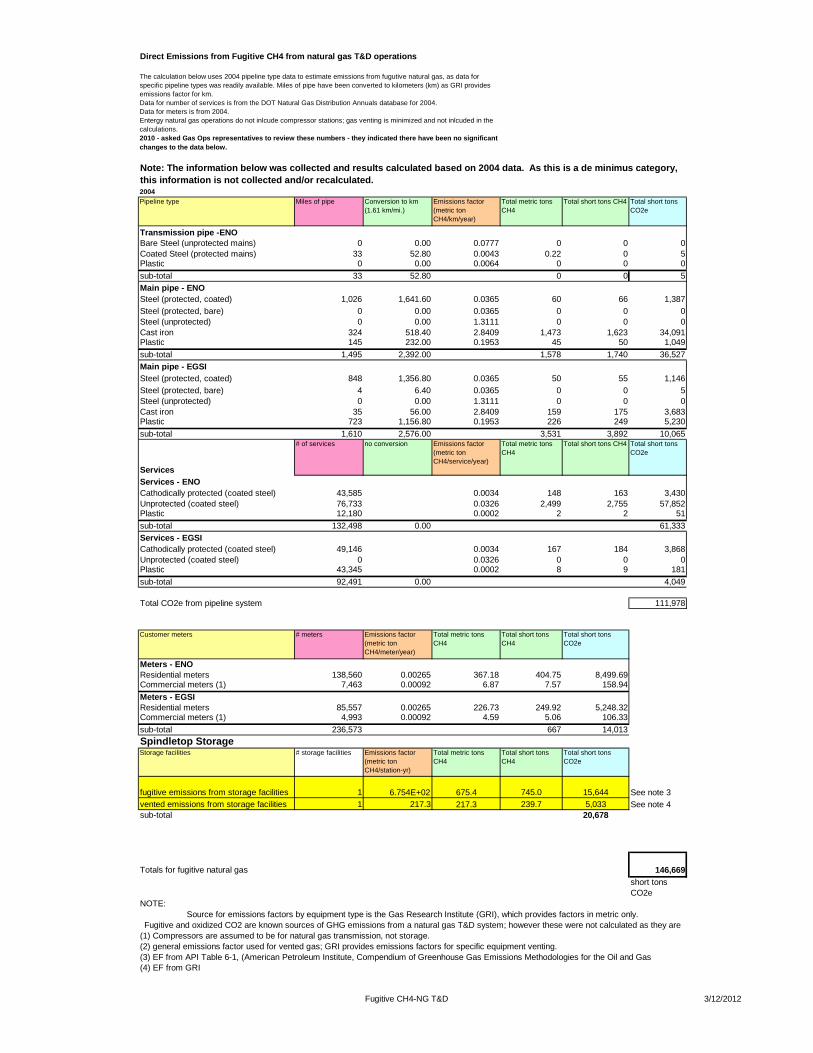
2004Pipeline type Miles of pipe Conversion to km
(1.61 km/mi.)Emissions factor (metric ton CH4/km/year)
Total metric tons CH4
Total short tons CH4 Total short tons CO2e
Transmission pipe -ENOBare Steel (unprotected mains) 0 0.00 0.0777 0 0 0Coated Steel (protected mains) 33 52.80 0.0043 0.22 0 5Plastic 0 0.00 0.0064 0 0 0sub-total 33 52.80 0 0 5Main pipe - ENOSteel (protected, coated) 1,026 1,641.60 0.0365 60 66 1,387Steel (protected, bare) 0 0.00 0.0365 0 0 0Steel (unprotected) 0 0.00 1.3111 0 0 0Cast iron 324 518.40 2.8409 1,473 1,623 34,091Plastic 145 232.00 0.1953 45 50 1,049sub-total 1,495 2,392.00 1,578 1,740 36,527Main pipe - EGSISteel (protected, coated) 848 1,356.80 0.0365 50 55 1,146Steel (protected, bare) 4 6.40 0.0365 0 0 5Steel (unprotected) 0 0.00 1.3111 0 0 0Cast iron 35 56.00 2.8409 159 175 3,683Plastic 723 1,156.80 0.1953 226 249 5,230sub-total 1,610 2,576.00 3,531 3,892 10,065
Services
# of services no conversion Emissions factor (metric ton CH4/service/year)
Total metric tons CH4
Total short tons CH4 Total short tons CO2e
Services - ENOCathodically protected (coated steel) 43,585 0.0034 148 163 3,430Unprotected (coated steel) 76,733 0.0326 2,499 2,755 57,852Plastic 12,180 0.0002 2 2 51sub-total 132,498 0.00 61,333Services - EGSICathodically protected (coated steel) 49,146 0.0034 167 184 3,868Unprotected (coated steel) 0 0.0326 0 0 0Plastic 43,345 0.0002 8 9 181sub-total 92,491 0.00 4,049
Total CO2e from pipeline system 111,978
Customer meters # meters Emissions factor (metric ton CH4/meter/year)
Total metric tons CH4
Total short tons CH4
Total short tons CO2e
Meters - ENOResidential meters 138,560 0.00265 367.18 404.75 8,499.69Commercial meters (1) 7,463 0.00092 6.87 7.57 158.94Meters - EGSIResidential meters 85,557 0.00265 226.73 249.92 5,248.32Commercial meters (1) 4,993 0.00092 4.59 5.06 106.33sub-total 236,573 667 14,013Spindletop StorageStorage facilities # storage facilities Emissions factor
(metric ton CH4/station-yr)
Total metric tons CH4
Total short tons CH4
Total short tons CO2e
fugitive emissions from storage facilities 1 6.754E+02 675.4 745.0 15,644 See note 3vented emissions from storage facilities 1 217.3 217.3 239.7 5,033 See note 4sub-total 20,678
Totals for fugitive natural gas 146,669short tons CO2e
NOTE:
(4) EF from GRI
Direct Emissions from Fugitive CH4 from natural gas T&D operations
The calculation below uses 2004 pipeline type data to estimate emissions from fugutive natural gas, as data for specific pipeline types was readily available. Miles of pipe have been converted to kilometers (km) as GRI provides emissions factor for km.Data for number of services is from the DOT Natural Gas Distribution Annuals database for 2004.Data for meters is from 2004.Entergy natural gas operations do not inlcude compressor stations; gas venting is minimized and not inlcuded in the calculations.2010 - asked Gas Ops representatives to review these numbers - they indicated there have been no significant changes to the data below.
Fugitive and oxidized CO2 are known sources of GHG emissions from a natural gas T&D system; however these were not calculated as they are
Note: The information below was collected and results calculated based on 2004 data. As this is a de minimus category, this information is not collected and/or recalculated.
(3) EF from API Table 6-1, (American Petroleum Institute, Compendium of Greenhouse Gas Emissions Methodologies for the Oil and Gas
Source for emissions factors by equipment type is the Gas Research Institute (GRI), which provides factors in metric only.
(1) Compressors are assumed to be for natural gas transmission, not storage.(2) general emissions factor used for vented gas; GRI provides emissions factors for specific equipment venting.
Fugitive CH4-NG T&D 3/12/2012
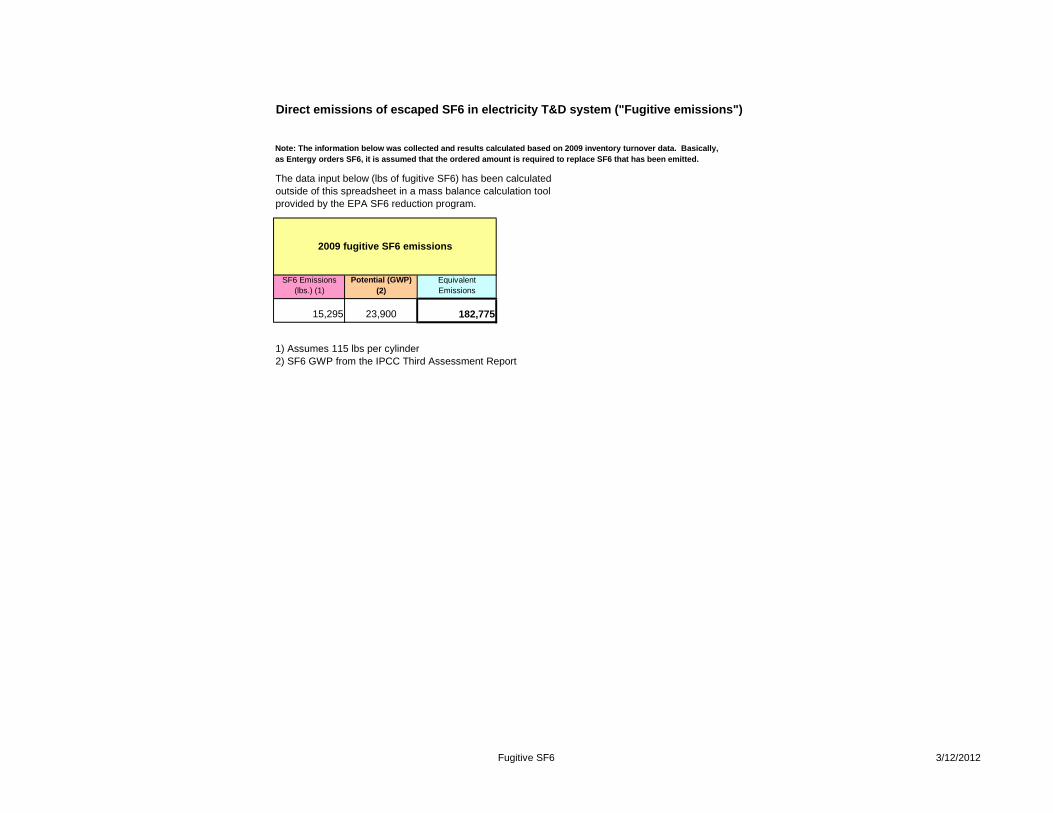
SF6 Emissions (lbs.) (1)
Potential (GWP) (2)
Equivalent Emissions
15,295 23,900 182,775
2) SF6 GWP from the IPCC Third Assessment Report
The data input below (lbs of fugitive SF6) has been calculated outside of this spreadsheet in a mass balance calculation tool provided by the EPA SF6 reduction program.
2009 fugitive SF6 emissions
Direct emissions of escaped SF6 in electricity T&D system ("Fugitive emissions")
1) Assumes 115 lbs per cylinder
Note: The information below was collected and results calculated based on 2009 inventory turnover data. Basically, as Entergy orders SF6, it is assumed that the ordered amount is required to replace SF6 that has been emitted.
Fugitive SF6 3/12/2012
2004
square footage air-conditioned
EF: fugitive HFCs (short tons CO2e/sq ft) *
Facility fugitive HFC (short tons CO2e)
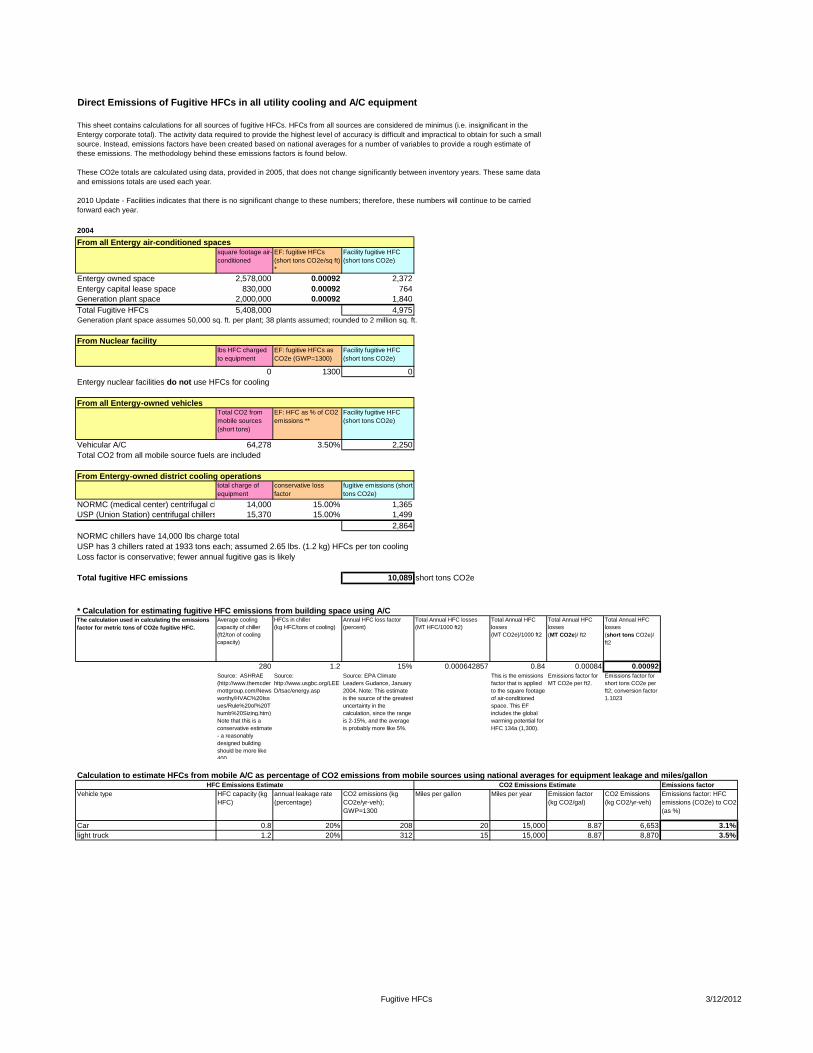
Entergy owned space 2,578,000 0.00092 2,372Entergy capital lease space 830,000 0.00092 764Generation plant space 2,000,000 0.00092 1,840Total Fugitive HFCs 5,408,000 4,975Generation plant space assumes 50,000 sq. ft. per plant; 38 plants assumed; rounded to 2 million sq. ft.
lbs HFC charged to equipment
EF: fugitive HFCs as CO2e (GWP=1300)
Facility fugitive HFC (short tons CO2e)
0 1300 0Entergy nuclear facilities do not use HFCs for cooling
Total CO2 from mobile sources (short tons)
EF: HFC as % of CO2 emissions **
Facility fugitive HFC (short tons CO2e)
Vehicular A/C 64,278 3.50% 2,250Total CO2 from all mobile source fuels are included
total charge of equipment
conservative loss factor
fugitive emissions (short tons CO2e)
NORMC (medical center) centrifugal chiller 14,000 15.00% 1,365USP (Union Station) centrifugal chillers (3) 15,370 15.00% 1,499
2,864NORMC chillers have 14,000 lbs charge totalUSP has 3 chillers rated at 1933 tons each; assumed 2.65 lbs. (1.2 kg) HFCs per ton cooling Loss factor is conservative; fewer annual fugitive gas is likely
Total fugitive HFC emissions 10,089 short tons CO2e
* Calculation for estimating fugitive HFC emissions from building space using A/C The calculation used in calculating the emissions factor for metric tons of CO2e fugitive HFC.
Average cooling capacity of chiller (ft2/ton of cooling capacity)
HFCs in chiller (kg HFC/tons of cooling)
Annual HFC loss factor (percent)
Total Annual HFC losses (MT HFC/1000 ft2)
Total Annual HFC losses (MT CO2e)/1000 ft2
Total Annual HFC losses (MT CO2e)/ ft2
Total Annual HFC losses (short tons CO2e)/ ft2
280 1.2 15% 0.000642857 0.84 0.00084 0.00092Source: ASHRAE (http://www.themcdermottgroup.com/Newsworthy/HVAC%20Issues/Rule%20of%20Thumb%20Sizing.htm) Note that this is a conservative estimate - a reasonably designed building should be more like 400.
Source: http://www.usgbc.org/LEED/tsac/energy.asp
Source: EPA Climate Leaders Gudance, January 2004. Note: This estimate is the source of the greatest uncertainty in the calculation, since the range is 2-15%, and the average is probably more like 5%.
This is the emissions factor that is applied to the square footage of air-conditioned space. This EF includes the global warming potential for HFC 134a (1,300).
Emissions factor for MT CO2e per ft2.
Emissions factor for short tons CO2e per ft2; conversion factor 1.1023
Calculation to estimate HFCs from mobile A/C as percentage of CO2 emissions from mobile sources using national averages for equipment leakage and miles/gallonEmissions factor
Vehicle type HFC capacity (kg HFC)
annual leakage rate (percentage)
CO2 emissions (kg CO2e/yr-veh); GWP=1300
Miles per gallon Miles per year Emission factor (kg CO2/gal)
CO2 Emissions (kg CO2/yr-veh)
Emissions factor: HFC emissions (CO2e) to CO2 (as %)
Car 0.8 20% 208 20 15,000 8.87 6,653 3.1%light truck 1.2 20% 312 15 15,000 8.87 8,870 3.5%
HFC Emissions Estimate CO2 Emissions Estimate
Direct Emissions of Fugitive HFCs in all utility cooling and A/C equipment
From all Entergy air-conditioned spaces
From Nuclear facility
From all Entergy-owned vehicles
This sheet contains calculations for all sources of fugitive HFCs. HFCs from all sources are considered de minimus (i.e. insignificant in the Entergy corporate total). The activity data required to provide the highest level of accuracy is difficult and impractical to obtain for such a small source. Instead, emissions factors have been created based on national averages for a number of variables to provide a rough estimate of these emissions. The methodology behind these emissions factors is found below.
These CO2e totals are calculated using data, provided in 2005, that does not change significantly between inventory years. These same data and emissions totals are used each year.
2010 Update - Facilities indicates that there is no significant change to these numbers; therefore, these numbers will continue to be carried forward each year.
From Entergy-owned district cooling operations
Fugitive HFCs 3/12/2012
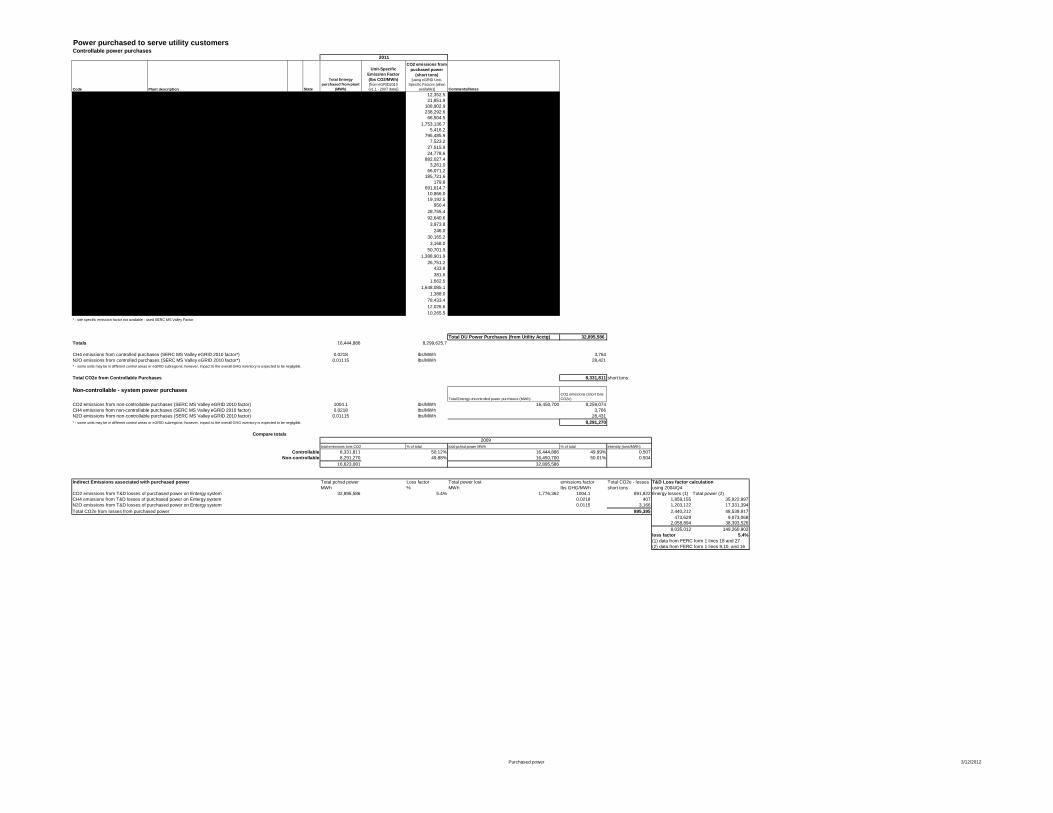
Controllable power purchases
Code Plant description State
Total Entergy purchased from plant
(MWh)
Unit-Specific Emission Factor (lbs CO2/MWh) [from eGRID2010(v1.1 - 2007 data)]
CO2 emissions from puchased power
(short tons)[using eGRID Unit-
Specific Factors (when available)] Comments/Notes
24514 1,007.79 12,352.5 71925 607.63 21,851.9
145263 1,499.39 108,902.9 467956 1,018.44 238,292.6 90676 1,466.86 66,504.5
1585559 2,211.38 1,753,136.7 13946 776.74 5,416.2
2253533 705.99 795,485.9 16316 922.19 7,523.2 42863 1,283.90 27,515.9 34499 1,436.48 24,778.6
1901085 927.92 882,027.4 7600 858.15 3,261.0
188961 699.31 66,071.2 476747 779.12 185,721.6
590 609.43 179.8 1686351 820.25 691,614.7
62164 349.59 10,866.0 42491 903.37 19,192.5 1893 1,004.10 950.4
25155 2,286.26 28,755.4 171851 1,078.15 92,640.6
3593 2,211.95 3,973.8 304 1,618.70 246.0
37271 1,618.70 30,165.2 1995 3,175.92 3,168.0
117341 864.18 50,701.9 3113013 892.32 1,388,901.9
88022 607.83 26,751.2 864 1,004.10 433.8 760 1,004.10 381.6
3040 1,093.74 1,662.5 3603632 914.68 1,648,085.1
3754 739.46 1,388.0 115256 1,361.03 78,433.4 10660 2,256.39 12,026.6 33443 613.91 10,265.5
Total DU Power Purchases (from Utility Acctg) 32,895,586 Totals 16,444,886 8,299,625.7
CH4 emissions from controlled purchases (SERC MS Valley eGRID 2010 factor*) 0.0218 lbs/MWh 3,764N2O emissions from controlled purchases (SERC MS Valley eGRID 2010 factor*) 0.01115 lbs/MWh 28,421
Total CO2e from Controllable Purchases 8,331,811 short tons
Non-controllable - system power purchases Total Entergy uncontrolled power purchases (MWh)
CO2 emissions (short tons CO2e)
CO2 emissions from non-controllable purchases (SERC MS Valley eGRID 2010 factor) 1004.1 lbs/MWh 16,450,700 8,259,074CH4 emissions from non-controllable purchases (SERC MS Valley eGRID 2010 factor) 0.0218 lbs/MWh 3,766N2O emissions from non-controllable purchases (SERC MS Valley eGRID 2010 factor) 0.01115 lbs/MWh 28,431
8,291,270
Compare totals
total emissions tons CO2 % of total total pchsd power MWh % of total intensity (tons/MWh)Controllable 8,331,811 50.12% 16,444,886 49.99% 0.507
Non-controllable 8,291,270 49.88% 16,450,700 50.01% 0.50416,623,081 32,895,586
Indirect Emissions associated with purchased power Total pchsd power Loss factor Total power lost emissions factor Total CO2e - losses T&D Loss factor calculation MWh % MWh lbs GHG/MWh short tons using 2004/Q4
CO2 emissions from T&D losses of purchased power on Entergy system 32,895,586 5.4% 1,776,362 1004.1 891,822 Energy losses (1) Total power (2)CH4 emissions from T&D losses of purchased power on Entergy system 0.0218 407 1,859,155 35,922,997N2O emissions from T&D losses of purchased power on Entergy system 0.0115 3,166 1,203,122 17,331,394Total CO2e from losses from purchased power 895,395 2,440,212 48,539,917
473,629 9,073,0682,058,894 38,393,5268,035,012 149,260,902
loss factor 5.4%(1) data from FERC form 1 lines 18 and 27(2) data from FERC form 1 lines 9,10, and 16
2009
2011
Power purchased to serve utility customers
* - site specific emission factor not available - used SERC MS Valley Factor
* - some units may be in different control areas or eGRID subregions; however, impact to the overall GHG inventory is expected to be negligible.
* - some units may be in different control areas or eGRID subregions; however, impact to the overall GHG inventory is expected to be negligible.
Purchased power 3/12/2012
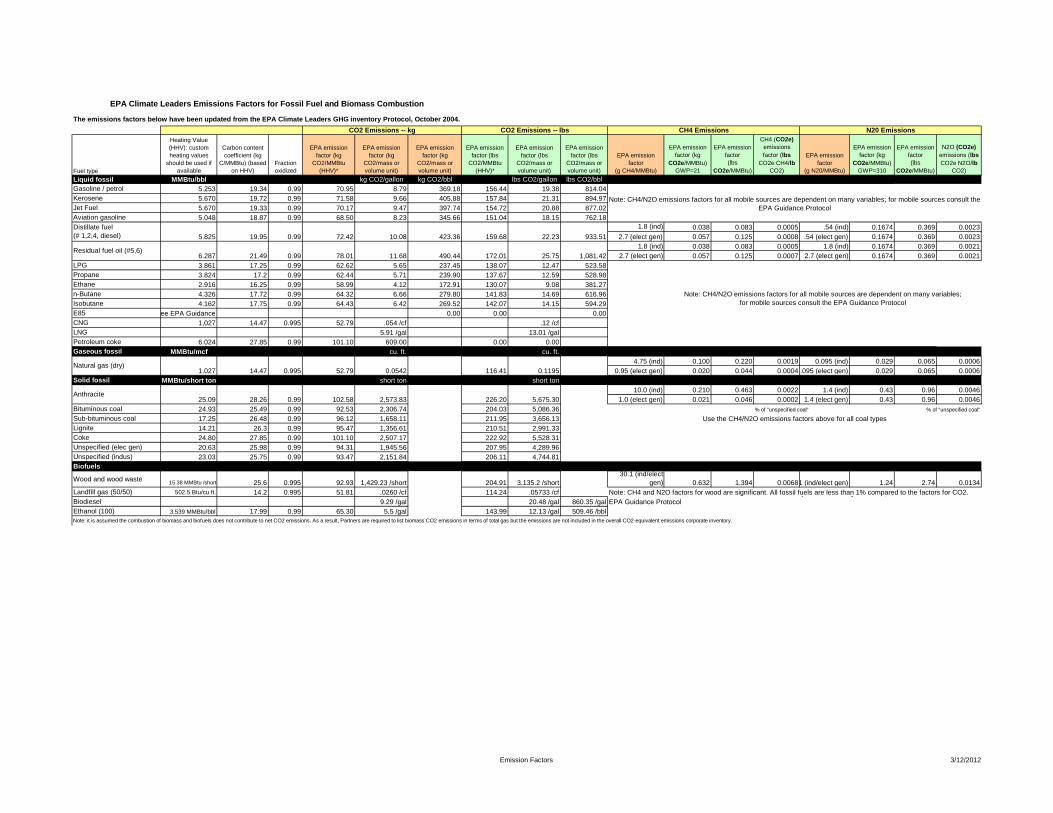
The emissions factors below have been updated from the EPA Climate Leaders GHG inventory Protocol, October 2004.
Fuel type
EPA Standard Heating Value (HHV): custom heating values
should be used if available
Carbon content coefficient (kg
C/MMBtu) (based on HHV)
Fraction oxidized
EPA emission factor (kg
CO2/MMBtu (HHV)*
EPA emission factor (kg
CO2/mass or volume unit)
EPA emission factor (kg
CO2/mass or volume unit)
EPA emission factor (lbs
CO2/MMBtu (HHV)*
EPA emission factor (lbs
CO2/mass or volume unit)
EPA emission factor (lbs
CO2/mass or volume unit)
EPA emission factor
(g CH4/MMBtu)
EPA emission factor (kg
CO2e/MMBtu) GWP=21
EPA emission factor (lbs
CO2e/MMBtu)
CH4 (CO2e) emissions factor (lbs
CO2e CH4/lb CO2)
EPA emission factor
(g N20/MMBtu)
EPA emission factor (kg
CO2e/MMBtu) GWP=310
EPA emission factor (lbs
CO2e/MMBtu)
N2O (CO2e) emissions (lbs CO2e N2O/lb
CO2)Liquid fossil MMBtu/bbl kg CO2/gallon kg CO2/bbl lbs CO2/gallon lbs CO2/bblGasoline / petrol 5.253 19.34 0.99 70.95 8.79 369.18 156.44 19.38 814.04Kerosene 5.670 19.72 0.99 71.58 9.66 405.88 157.84 21.31 894.97Jet Fuel 5.670 19.33 0.99 70.17 9.47 397.74 154.72 20.88 877.02Aviation gasoline 5.048 18.87 0.99 68.50 8.23 345.66 151.04 18.15 762.18
1.8 (ind) 0.038 0.083 0.0005 .54 (ind) 0.1674 0.369 0.00232.7 (elect gen) 0.057 0.125 0.0008 .54 (elect gen) 0.1674 0.369 0.0023
1.8 (ind) 0.038 0.083 0.0005 1.8 (ind) 0.1674 0.369 0.00212.7 (elect gen) 0.057 0.125 0.0007 2.7 (elect gen) 0.1674 0.369 0.0021
LPG 3.861 17.25 0.99 62.62 5.65 237.45 138.07 12.47 523.58Propane 3.824 17.2 0.99 62.44 5.71 239.90 137.67 12.59 528.98Ethane 2.916 16.25 0.99 58.99 4.12 172.91 130.07 9.08 381.27n-Butane 4.326 17.72 0.99 64.32 6.66 279.80 141.83 14.69 616.96Isobutane 4.162 17.75 0.99 64.43 6.42 269.52 142.07 14.15 594.29E85 see EPA Guidance 0.00 0.00 0.00CNG 1,027 14.47 0.995 52.79 .054 /cf .12 /cfLNG 5.91 /gal 13.01 /galPetroleum coke 6.024 27.85 0.99 101.10 609.00 0.00 0.00Gaseous fossil MMBtu/mcf cu. ft. cu. ft.
4.75 (ind) 0.100 0.220 0.0019 0.095 (ind) 0.029 0.065 0.00060.95 (elect gen) 0.020 0.044 0.00040.095 (elect gen) 0.029 0.065 0.0006
Solid fossil MMBtu/short ton short ton short ton10.0 (ind) 0.210 0.463 0.0022 1.4 (ind) 0.43 0.96 0.0046
1.0 (elect gen) 0.021 0.046 0.0002 1.4 (elect gen) 0.43 0.96 0.0046Bituminous coal 24.93 25.49 0.99 92.53 2,306.74 204.03 5,086.36 % of "unspecified coal" % of "unspecified coal"
Sub-bituminous coal 17.25 26.48 0.99 96.12 1,658.11 211.95 3,656.13Lignite 14.21 26.3 0.99 95.47 1,356.61 210.51 2,991.33Coke 24.80 27.85 0.99 101.10 2,507.17 222.92 5,528.31Unspecified (elec gen) 20.63 25.98 0.99 94.31 1,945.56 207.95 4,289.96Unspecified (indus) 23.03 25.75 0.99 93.47 2,151.84 206.11 4,744.81Biofuels
Wood and wood waste 15.38 MMBtu /short 25.6 0.995 92.93 1,429.23 /short 204.91 3,135.2 /short30.1 (ind/elect
gen) 0.632 1.394 0.00684.01 (ind/elect gen) 1.24 2.74 0.0134Landfill gas (50/50) 502.5 Btu/cu ft. 14.2 0.995 51.81 .0260 /cf 114.24 .05733 /cfBiodiesel 9.29 /gal 20.48 /gal 860.35 /galEthanol (100) 3.539 MMBtu/bbl 17.99 0.99 65.30 5.5 /gal 143.99 12.13 /gal 509.46 /bbl
52.79
Note: CH4 and N2O factors for wood are significant. All fossil fuels are less than 1% compared to the factors for CO2.Note: CH4/N2O emissions factors for all mobile sources are dependent on many variables; for mobile sources consult the EPA Guidance Protocol
Note: CH4/N2O emissions factors for all mobile sources are dependent on many variables; for mobile sources consult the EPA Guidance Protocol
Use the CH4/N2O emissions factors above for all coal types
0.1195
2,573.83
116.41
CO2 Emissions -- lbsCO2 Emissions -- kg
0.99 72.42 159.68 933.51423.36Distillate fuel (# 1,2,4, diesel)
1,081.42
22.23
172.01Residual fuel oil (#5,6)
6.287 21.49
5.825
490.44
0.0542
10.08
11.6878.01
EPA Climate Leaders Emissions Factors for Fossil Fuel and Biomass Combustion
25.09 28.26 0.99 102.58Anthracite
14.47 0.995
19.95
0.99 25.75
CH4 Emissions
Note: it is assumed the combustion of biomass and biofuels does not contribute to net CO2 emissions. As a result, Partners are required to list biomass CO2 emissions in terms of total gas but the emissions are not included in the overall CO2-equivalent emissions corporate inventory.
Natural gas (dry)1.027
226.20 5,675.30
N20 Emissions
Note: CH4/N2O emissions factors for all mobile sources are dependent on many variables; for mobile sources consult the EPA Guidance Protocol
Emission Factors 3/12/2012
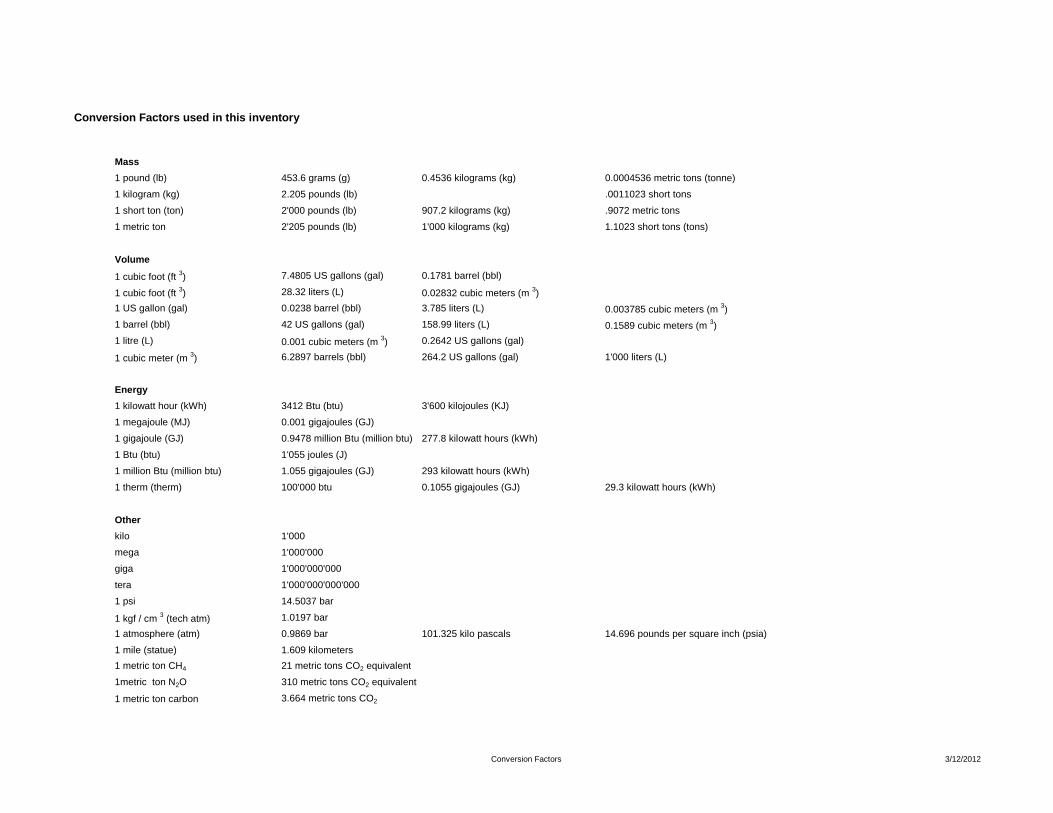
Mass1 pound (lb) 453.6 grams (g) 0.4536 kilograms (kg) 0.0004536 metric tons (tonne)
1 kilogram (kg) 2.205 pounds (lb) .0011023 short tons
1 short ton (ton) 2'000 pounds (lb) 907.2 kilograms (kg) .9072 metric tons
1 metric ton 2'205 pounds (lb) 1'000 kilograms (kg) 1.1023 short tons (tons)
Volume
1 cubic foot (ft 3) 7.4805 US gallons (gal) 0.1781 barrel (bbl)
1 cubic foot (ft 3) 28.32 liters (L) 0.02832 cubic meters (m 3)1 US gallon (gal) 0.0238 barrel (bbl) 3.785 liters (L) 0.003785 cubic meters (m 3)1 barrel (bbl) 42 US gallons (gal) 158.99 liters (L) 0.1589 cubic meters (m 3)1 litre (L) 0.001 cubic meters (m 3) 0.2642 US gallons (gal)
1 cubic meter (m 3) 6.2897 barrels (bbl) 264.2 US gallons (gal) 1'000 liters (L)
Energy1 kilowatt hour (kWh) 3412 Btu (btu) 3'600 kilojoules (KJ)
1 megajoule (MJ) 0.001 gigajoules (GJ)
1 gigajoule (GJ) 0.9478 million Btu (million btu) 277.8 kilowatt hours (kWh)
1 Btu (btu) 1'055 joules (J)
1 million Btu (million btu) 1.055 gigajoules (GJ) 293 kilowatt hours (kWh)
1 therm (therm) 100'000 btu 0.1055 gigajoules (GJ) 29.3 kilowatt hours (kWh)
Otherkilo 1'000
mega 1'000'000
giga 1'000'000'000
tera 1'000'000'000'000
1 psi 14.5037 bar
1 kgf / cm 3 (tech atm) 1.0197 bar
1 atmosphere (atm) 0.9869 bar 101.325 kilo pascals 14.696 pounds per square inch (psia)
1 mile (statue) 1.609 kilometers1 metric ton CH4 21 metric tons CO2 equivalent
1metric ton N2O 310 metric tons CO2 equivalent
1 metric ton carbon 3.664 metric tons CO2
Conversion Factors used in this inventory
Conversion Factors 3/12/2012
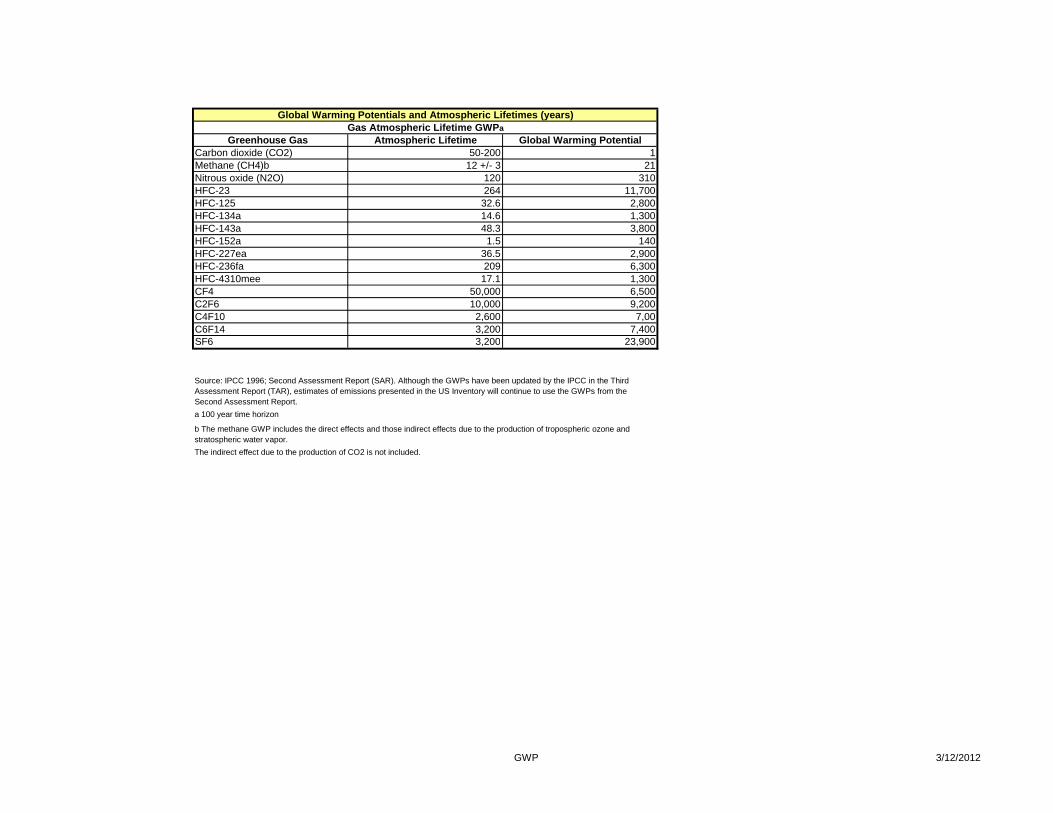
Greenhouse Gas Atmospheric Lifetime Global Warming PotentialCarbon dioxide (CO2) 50-200 1Methane (CH4)b 12 +/- 3 21Nitrous oxide (N2O) 120 310HFC-23 264 11,700HFC-125 32.6 2,800HFC-134a 14.6 1,300HFC-143a 48.3 3,800HFC-152a 1.5 140HFC-227ea 36.5 2,900HFC-236fa 209 6,300HFC-4310mee 17.1 1,300CF4 50,000 6,500C2F6 10,000 9,200C4F10 2,600 7,00C6F14 3,200 7,400SF6 3,200 23,900
a 100 year time horizon
Global Warming Potentials and Atmospheric Lifetimes (years)Gas Atmospheric Lifetime GWPa
Source: IPCC 1996; Second Assessment Report (SAR). Although the GWPs have been updated by the IPCC in the Third Assessment Report (TAR), estimates of emissions presented in the US Inventory will continue to use the GWPs from the Second Assessment Report.
b The methane GWP includes the direct effects and those indirect effects due to the production of tropospheric ozone and stratospheric water vapor. The indirect effect due to the production of CO2 is not included.
GWP 3/12/2012
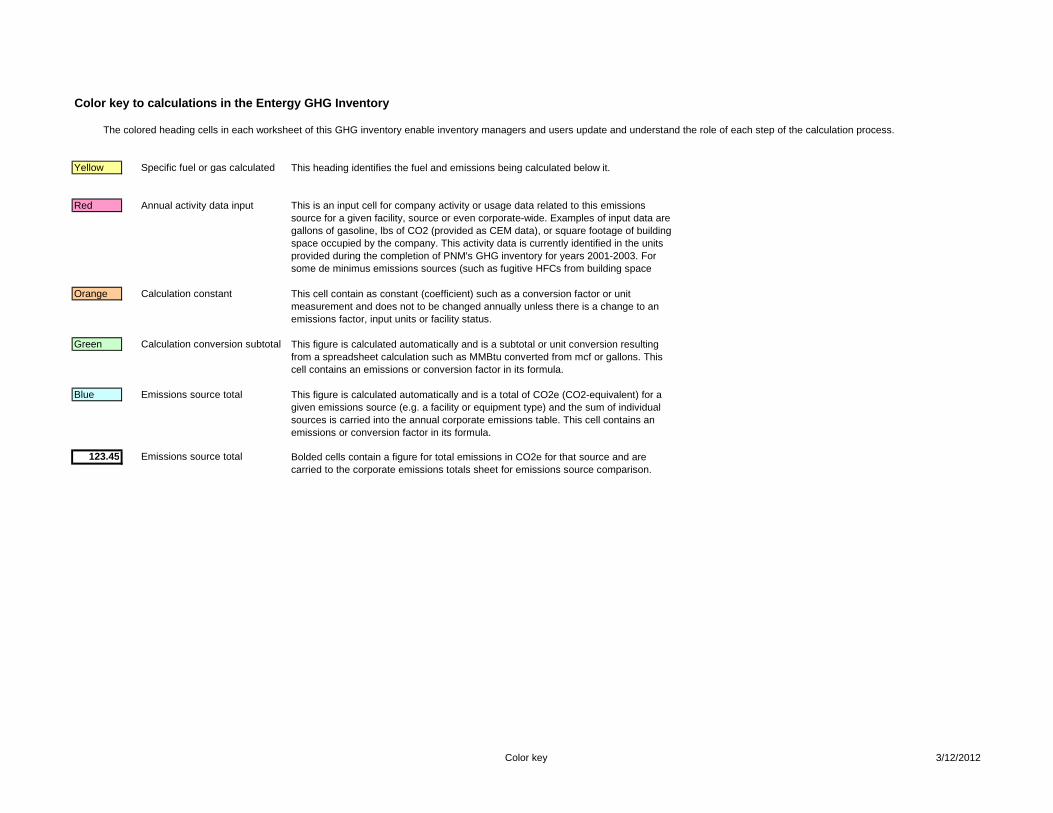
Yellow Specific fuel or gas calculated
Red Annual activity data input
Orange Calculation constant
Green Calculation conversion subtotal
Blue Emissions source total
123.45 Emissions source total
Color key to calculations in the Entergy GHG Inventory
The colored heading cells in each worksheet of this GHG inventory enable inventory managers and users update and understand the role of each step of the calculation process.
Bolded cells contain a figure for total emissions in CO2e for that source and are carried to the corporate emissions totals sheet for emissions source comparison.
This heading identifies the fuel and emissions being calculated below it.
This is an input cell for company activity or usage data related to this emissions source for a given facility, source or even corporate-wide. Examples of input data are gallons of gasoline, lbs of CO2 (provided as CEM data), or square footage of building space occupied by the company. This activity data is currently identified in the units provided during the completion of PNM's GHG inventory for years 2001-2003. For some de minimus emissions sources (such as fugitive HFCs from building space
This cell contain as constant (coefficient) such as a conversion factor or unit measurement and does not to be changed annually unless there is a change to an emissions factor, input units or facility status.
This figure is calculated automatically and is a subtotal or unit conversion resulting from a spreadsheet calculation such as MMBtu converted from mcf or gallons. This cell contains an emissions or conversion factor in its formula.
This figure is calculated automatically and is a total of CO2e (CO2-equivalent) for a given emissions source (e.g. a facility or equipment type) and the sum of individual sources is carried into the annual corporate emissions table. This cell contains an emissions or conversion factor in its formula.
Color key 3/12/2012
Attachment 2
Entergy Corporation General Emissions Source Checklist (completed in 2005 during initial inventory development phase)
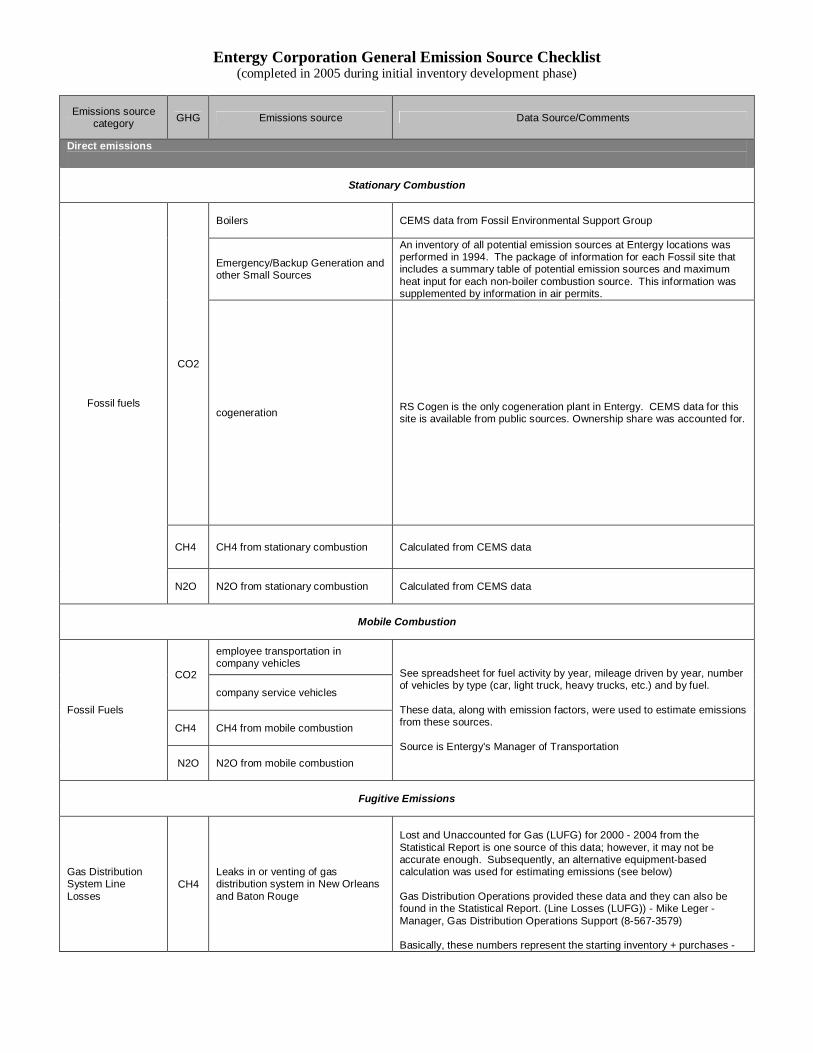
Entergy Corporation General Emission Source Checklist (completed in 2005 during initial inventory development phase)
Emissions source category GHG Emissions source Data Source/Comments
Direct emissions
Stationary Combustion
Boilers CEMS data from Fossil Environmental Support Group
Emergency/Backup Generation and other Small Sources
An inventory of all potential emission sources at Entergy locations was performed in 1994. The package of information for each Fossil site that includes a summary table of potential emission sources and maximum heat input for each non-boiler combustion source. This information was supplemented by information in air permits.
CO2
cogeneration RS Cogen is the only cogeneration plant in Entergy. CEMS data for this site is available from public sources. Ownership share was accounted for.
CH4 CH4 from stationary combustion Calculated from CEMS data
Fossil fuels
N2O N2O from stationary combustion Calculated from CEMS data
Mobile Combustion
employee transportation in company vehicles
CO2
company service vehicles
CH4 CH4 from mobile combustion
Fossil Fuels
N2O N2O from mobile combustion
See spreadsheet for fuel activity by year, mileage driven by year, number of vehicles by type (car, light truck, heavy trucks, etc.) and by fuel. These data, along with emission factors, were used to estimate emissions from these sources. Source is Entergy's Manager of Transportation
Fugitive Emissions
Gas Distribution System Line Losses
CH4 Leaks in or venting of gas distribution system in New Orleans and Baton Rouge
Lost and Unaccounted for Gas (LUFG) for 2000 - 2004 from the Statistical Report is one source of this data; however, it may not be accurate enough. Subsequently, an alternative equipment-based calculation was used for estimating emissions (see below) Gas Distribution Operations provided these data and they can also be found in the Statistical Report. (Line Losses (LUFG)) - Mike Leger - Manager, Gas Distribution Operations Support (8-567-3579) Basically, these numbers represent the starting inventory + purchases -
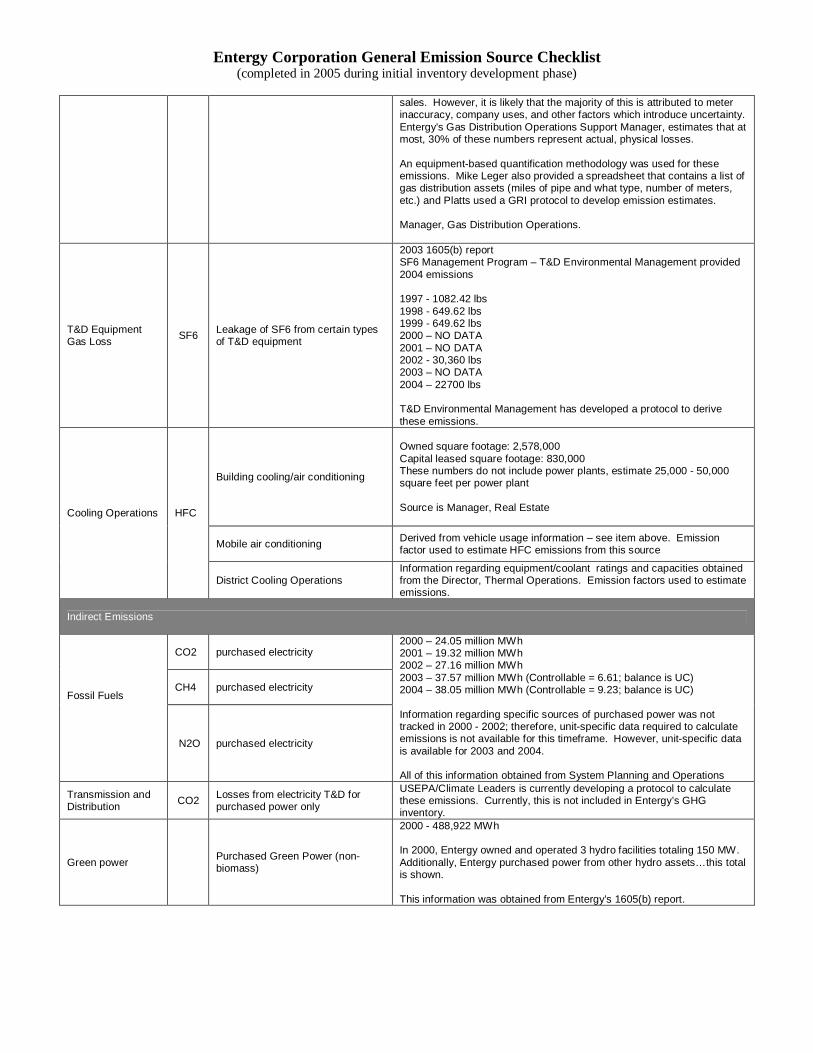
Entergy Corporation General Emission Source Checklist (completed in 2005 during initial inventory development phase)
sales. However, it is likely that the majority of this is attributed to meter inaccuracy, company uses, and other factors which introduce uncertainty. Entergy's Gas Distribution Operations Support Manager, estimates that at most, 30% of these numbers represent actual, physical losses. An equipment-based quantification methodology was used for these emissions. Mike Leger also provided a spreadsheet that contains a list of gas distribution assets (miles of pipe and what type, number of meters, etc.) and Platts used a GRI protocol to develop emission estimates. Manager, Gas Distribution Operations.
T&D Equipment Gas Loss SF6 Leakage of SF6 from certain types
of T&D equipment
2003 1605(b) report SF6 Management Program – T&D Environmental Management provided 2004 emissions 1997 - 1082.42 lbs 1998 - 649.62 lbs 1999 - 649.62 lbs 2000 – NO DATA 2001 – NO DATA 2002 - 30,360 lbs 2003 – NO DATA 2004 – 22700 lbs T&D Environmental Management has developed a protocol to derive these emissions.
Building cooling/air conditioning
Owned square footage: 2,578,000 Capital leased square footage: 830,000 These numbers do not include power plants, estimate 25,000 - 50,000 square feet per power plant Source is Manager, Real Estate
Mobile air conditioning Derived from vehicle usage information – see item above. Emission factor used to estimate HFC emissions from this source
Cooling Operations HFC
District Cooling Operations Information regarding equipment/coolant ratings and capacities obtained from the Director, Thermal Operations. Emission factors used to estimate emissions.
Indirect Emissions
CO2 purchased electricity
CH4 purchased electricity Fossil Fuels
N2O purchased electricity
2000 – 24.05 million MWh 2001 – 19.32 million MWh 2002 – 27.16 million MWh 2003 – 37.57 million MWh (Controllable = 6.61; balance is UC) 2004 – 38.05 million MWh (Controllable = 9.23; balance is UC) Information regarding specific sources of purchased power was not tracked in 2000 - 2002; therefore, unit-specific data required to calculate emissions is not available for this timeframe. However, unit-specific data is available for 2003 and 2004. All of this information obtained from System Planning and Operations
Transmission and Distribution CO2 Losses from electricity T&D for
purchased power only
USEPA/Climate Leaders is currently developing a protocol to calculate these emissions. Currently, this is not included in Entergy’s GHG inventory.
Green power Purchased Green Power (non-biomass)
2000 - 488,922 MWh In 2000, Entergy owned and operated 3 hydro facilities totaling 150 MW. Additionally, Entergy purchased power from other hydro assets…this total is shown. This information was obtained from Entergy's 1605(b) report.

Attachment 3
IMPRD Revision Log
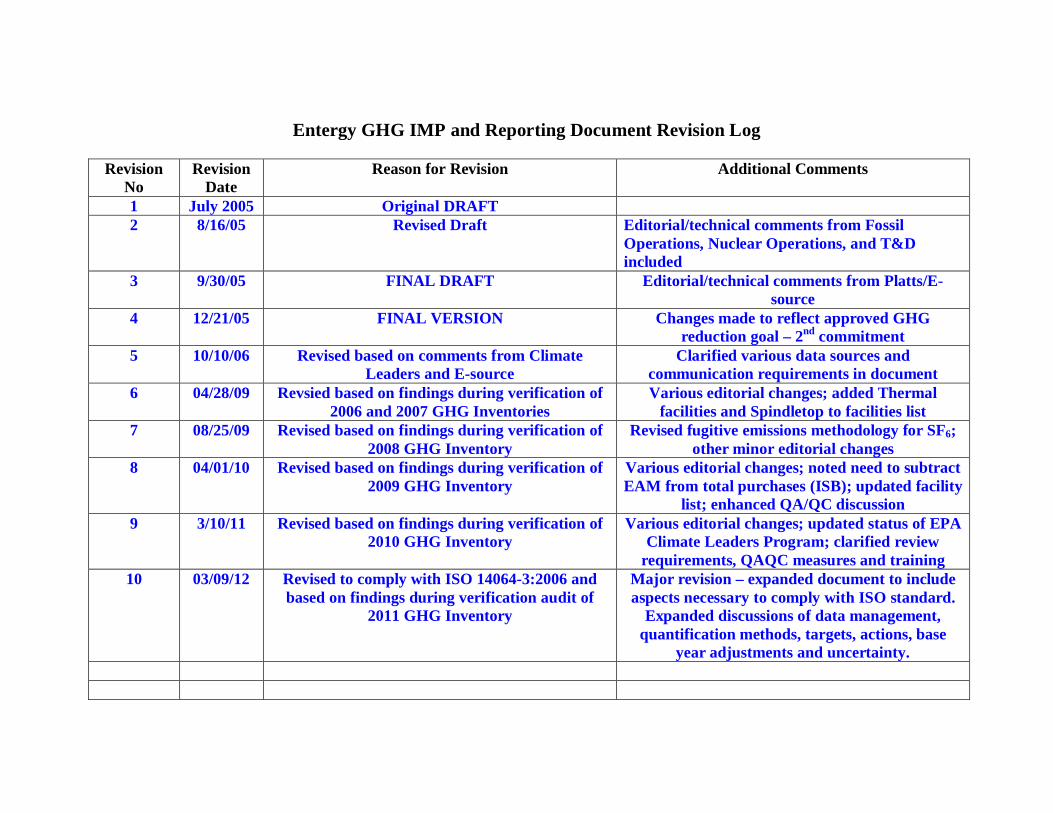
Entergy GHG IMP and Reporting Document Revision Log
Revision No
Revision Date
Reason for Revision Additional Comments
1 July 2005 Original DRAFT 2 8/16/05 Revised Draft Editorial/technical comments from Fossil
Operations, Nuclear Operations, and T&D included
3 9/30/05 FINAL DRAFT Editorial/technical comments from Platts/E-source
4 12/21/05 FINAL VERSION Changes made to reflect approved GHG reduction goal – 2nd commitment
5 10/10/06 Revised based on comments from Climate Leaders and E-source
Clarified various data sources and communication requirements in document
6 04/28/09 Revsied based on findings during verification of 2006 and 2007 GHG Inventories
Various editorial changes; added Thermal facilities and Spindletop to facilities list
7 08/25/09 Revised based on findings during verification of 2008 GHG Inventory
Revised fugitive emissions methodology for SF6; other minor editorial changes
8 04/01/10 Revised based on findings during verification of 2009 GHG Inventory
Various editorial changes; noted need to subtract EAM from total purchases (ISB); updated facility
list; enhanced QA/QC discussion 9 3/10/11 Revised based on findings during verification of
2010 GHG Inventory Various editorial changes; updated status of EPA
Climate Leaders Program; clarified review requirements, QAQC measures and training
10 03/09/12 Revised to comply with ISO 14064-3:2006 and based on findings during verification audit of
2011 GHG Inventory
Major revision – expanded document to include aspects necessary to comply with ISO standard.
Expanded discussions of data management, quantification methods, targets, actions, base
year adjustments and uncertainty.