Embed Size (px)
Citation preview

Center For Energy and Environmental Policy Research
Greener Plants, Grayer Skies? A Report from the Front Lines of China’s Energy Sector*
E.S. Steinfeld, R.K. Lester and E.A. Cunningham
Reprint Series Number 215*Reprinted from Energy Policy, Vol. 37, No. 5, pp. 1809–1824, 2009, with kind permission from Elsevier. All rights reserved.

The MIT Center for Energy and Environmental Policy Research (CEEPR) is a joint center of the Department of Economics, the MIT Energy Initiative, and the Alfred P. Sloan School of Management. The CEEPR encourages and supports policy research on topics of interest to the public and private sectors in the U.S. and internationally.
The views experessed herein are those of the authors and do not necessarily refl ect those of the Massachusetts Institute of Technology.

ARTICLE IN PRESS
Energy Policy 37 (2009) 1809–1824
Contents lists available at ScienceDirect
Energy Policy
0301-42
doi:10.1
$ Edw
Center’s
at MIT,
nuclear
candida
The a
School
Through
membe
Distelho
We are
of this p� Corr
E-m
journal homepage: www.elsevier.com/locate/enpol
Greener plants, grayer skies? A report from the front lines of China’senergy sector$
Edward S. Steinfeld a,�, Richard K. Lester b, Edward A. Cunningham c
a Department of Political Science, MIT E53-455, 30 Wadsworth Street, Cambridge, MA 02139, USAb MIT Industrial Performance Center, E38-104, 292 Main Street, Cambridge, MA 02139, USAc MIT Industrial Performance Center, E-38, 292 Main Street, Cambridge, MA 02139, USA
a r t i c l e i n f o
Article history:
Received 1 October 2008
Accepted 8 December 2008Available online 27 February 2009
Keywords:
Electric power
Environment
China
15/$ - see front matter & 2009 Elsevier Ltd. A
016/j.enpol.2008.12.018
ard Steinfeld and Richard Lester co-direct th
China Energy Group. Steinfeld is an associate
and Lester is director of the Industrial Perform
science and engineering at MIT. Edward
te in the MIT political science department.
uthors wish to thank Shell, the MIT Energy
of Management China Program for their
out this project, we have benefited greatly
rs of the MIT Industrial Performance Center’
rst, Valerie Karplus, Jonas Nahm, Kyoung Shin
also grateful to Janos Beer for his detailed com
aper.
esponding author.
ail address: [email protected] (E.S. Steinfeld).
a b s t r a c t
This article presents findings from the MIT China Energy Group’s first-of-its-kind, independent
nationwide survey of Chinese coal-fired power plants. It is well understood that developments in
China’s energy sector now have global environmental implications. It is also well understood that this
sector has in recent years experienced rapidly rising fuel costs. The MIT survey, by delving into
technology choice, pricing, fuel sourcing, and environmental cleanup at the firm level, provides insights
into how the Chinese power sector as a whole responds, and what the environmental implications are.
The findings suggest rapid uptake of advanced combustion technologies across the system, largely in
response to rising fuel costs. Environmental cleanup systems, particularly for sulfur dioxide, have also
spread rapidly, in large part due to regulatory enforcement. Yet, operationally, plants pollute
substantially. Price hikes encourage them to source low-grade fuel and idle cleanup systems. On the
whole, the Chinese system infrastructurally has a proven capacity for rapid technological upgrading in
the face of new market and regulatory pressures. Operationally, however, in part due to exposure to
market forces, and in part due to limited state capacity for monitoring operations, even the most
advanced power plants remain major polluters.
& 2009 Elsevier Ltd. All rights reserved.
1. Introduction
To a significant degree, our planet’s energy and environmentalfuture is today being written in China. Consequential energydecisions are now being made throughout this rapidly trans-forming nation. In no domain are these decisions more crucialand the linkages to the global environment more direct thanin electric power. China’s electric power sector is large, stillgrowing rapidly, and fueled primarily by coal. In 2007, installedgenerating capacity stood at 713 thousand megawatts, or 713gigawatts (GW), second only to the United States’ roughly
ll rights reserved.
e MIT Industrial Performance
professor of political science
ance Center and professor of
Cunningham is a doctoral
Initiative, and the MIT Sloan
generous financial support.
from discussions with other
s China Energy Group: Greg
, Lily Tong, and Hiram Samel.
ments on an earlier version
1075 GW.1 The sector has roughly doubled in size since 2000,and in 2006 alone, 102 GW of new generating capacity was added,an increment substantially larger than the United Kingdom’sentire electric power system. Roughly 80% of Chinese electricity isgenerated through coal combustion, as compared to 50% in theUnited States, the world’s second largest coal user.
This matters partly because the byproducts of coal combustionhave major environmental consequences. Atmospheric emissionsof sulfur oxides (SOx) and nitrogen oxides (NOx) have long beenrecognized as the primary drivers of acid precipitation. Otherharmful emissions include fine particulates, volatile organiccompounds, and toxic trace metals like mercury and arsenic.And now, carbon dioxide, because of its link to global warming,has become the most prominent item on the pollutant list. Coal isthe most abundant energy resource globally and the most carbon-intensive. Its combustion worldwide is the largest single driver ofanthropogenic climate change. In 2005, coal accounted for 42% ofglobal CO2 emissions. In that year, coal combustion accounted for
1 China figure from China Electricity Council, 2008; US figure from Energy
Information Agency (EIA), U.S. Department of Energy. Existing Capacity by Energy
Source (http://www.eia.doe.gov/cneaf/electricity/epa/epat2p2.html).

ARTICLE IN PRESS
E.S. Steinfeld et al. / Energy Policy 37 (2009) 1809–18241810
82% of China’s CO2 emissions, and 36% of America’s CO2
emissions.2
Despite much current attention to alternative energy technol-ogies such as wind and solar power, fuel cells, biomass, andnuclear power, the likelihood is that coal will remain the world’slargest source of electricity for decades to come. Thus the mostimportant questions for the earth’s environmental future, at leastover the coming decades, concern how coal will be utilized. Will itbe used cleanly or destructively? Will it be used efficiently orinefficiently? And will its pollutant byproducts be dealt witheffectively or effectively ignored? These questions matter wher-ever coal is being used, but they matter most where coal is beingused most extensively, China. And within China, coal is being usedmost extensively in the power sector.
It must be noted that this paper does not directly address anyefforts on China’s part to deal specifically with CO2 emissions.China—like other countries including the United States—has yetto embark on a serious effort here. What the paper does do,however, is to examine two sets of issues that will be of greatimportance should serious efforts at climate change mitigationultimately move forward. The first pertains to the efficiency withwhich fossil fuel-based energy production is being carried out.The second concerns the overall responsiveness of the system tochange and innovation. By examining how the Chinese system isresponding today to a variety of new economic and environmentalpressures—namely, rising fuel costs and growing concerns overair pollution—this paper aims to illuminate the system’s ability todeal in the future with the even greater regulatory, economic,technological, and operational innovations that will be necessaryto deal with carbon.
Many accounts of the China’s power sector today take apessimistic stance regarding the system’s ability to innovate andchange.3 They tend to argue first that while China’s energyinfrastructure is expanding rapidly, it is being built with retro-grade, antiquated, and inefficient technologies. Furthermore,these technologies are being deployed in small plants, whichneither capture minimum scale economies nor are subject toeffective regulatory supervision. They argue second that the mainfuel for that infrastructure, domestically sourced coal, is heavilysubsidized and of low quality. Because coal prices are controlledby the state, utility operators face few incentives to switch tocleaner alternative fuels or use technologies that burn coal moreefficiently. Finally, they argue on a third front that China hasneither the political will nor the governmental capacity to shiftfrom the environmentally destructive, resource intensive path it iscurrently on.4
The aim of this paper is to subject these assumptions toempirical analysis using survey data collected by our team ofresearchers in the MIT Industrial Performance Center’s ChinaEnergy Group during 2007 and early 2008. Our nationwide studyof coal-fired power plants in China was conducted in partnershipwith a domestic Chinese research firm, Beijing-based Horizon. Thesurvey—administered at the level of the plant and coveringmultiple areas of power plant infrastructure, investment, opera-
2 Energy Information Agency, World Carbon Dioxide Emissions from the
Consumption of Coal, 1980–2006 (http://www.eia.doe.gov/pub/international/iealf/
tableh4co2.xls); Energy Information Agency, World Carbon Dioxide Emissions
from the Consumption and Flaring of Fossil Fuels, 1980–2005 (http://www.eia.
doe.gov/pub/international/iealf/tableh1co2.xls).3 Berra, N., Lamech, R., Zhao, J., 2001. Fostering Competition in China’s Power
Markets. World Bank Discussion Paper No. 416. Zhang Chi. 2003. Reform of Chinese
Electric Power Market: Economics and Institutions. Stanford PESD Paper. Xu, S.,
Chen, W., 2006. The reform of electricity power sector in the PRC. Energy Policy 23,
2455–2465.4 World Bank, The Cost of Pollution in China: Economic Estimates of Physical
Damages, Conference Edition Report, February 2007.
tions, and environmental cleanup—encompassed 85 powerplants, many of which had multiple generating units. Two-hundred ninety-nine separate generating units were surveyed intotal. Senior specialists within each plant—plant managers, chiefengineers, senior environmental officers, and chief financialofficers—were called upon, via telephone or face-to-face inter-view, to answer portions of the survey corresponding to theirrespective areas of professional responsibility. To the best of ourknowledge, this survey—in terms of its nationwide scope, its focuson plant-level phenomena, and its independent, non-governmen-tal status—represents a first-of-its-kind effort in China.
As will be discussed in the main body of the paper, the surveyresults uncovered a reality far more complicated than anythingsuggested by the conventional wisdom. An important conclusionon the environmental front is that while Chinese coal-fired powerplants are performing poorly today, they are investing in the sortsof physical infrastructure necessary for better performance in thefuture. There is also evidence that governmental regulatory effortsare showing hints of real efficacy, at least with respect to theenforcement of technological standards. The real question iswhether societal pressure and political determination—gover-nance, in effect—will tilt the balance, transforming the potentialfor better environmental performance into actual reality.
2. Description of the survey and sampling technique
MIT’s 2007 China Power Survey covered 85 power plantsacross 14 Chinese provinces. The geographic distribution of therespondents is illustrated in Chart 1 and Table 1.
These plants encompass 299 separate generating units, thevast majority of which are coal-fired. The exceptions are 9 smallunits that burn oil, one that burns coke oven gas, and 13 that burncoal gangue, a solid waste product from the processing of coal.These ended up in the survey because they happen to be ancillaryunits of some of the coal-burning utilities that responded.Similarly, the survey also captured 7 units that are either plannedor currently under construction, and 35 units that have alreadybeen shut down. Among the closed units are two oil-burningfacilities.
The plants surveyed comprise a total combined generatingcapacity of 32.68 GW, though 2.2 GW of that total pertains to unitsno longer in operation, and 2.7 GW pertains to plants not yetcompleted. Power plants within China are categorized as ‘‘largesized’’ if total capacity equals exceeds 300 MW, ‘‘medium-sized’’ ifcapacity is below 300 MW but above 50 MW, and ‘‘small-sized’’ ifcapacity is below 50 MW. Of the 85 power plants in the survey, 24,or 28.2% of the total, are large scale, 18 (21.2% of the total) aremedium scale, and 43 (50.6% of the total) are small scale. Notsurprisingly given the relatively recent expansion of China’senergy sector, for over three-quarters of the plants surveyed,their first unit came on line after 1980.
The MIT survey captured a significant fraction of the ‘‘knownuniverse’’ of coal-fired power plants in China, at least in terms ofwhat Chinese governmental figures officially recognize. Industrialboilers or other ‘‘within the fence’’ forms of power generation bymajor industrial energy users are included neither in the MITsurvey nor in official state statistics on the electric power sector.5
5 Results of earlier MIT studies on the efficiency, emissions and health effects
of small industrial boilers in China are discussed in: Fang, J., Zeng, T., Shen, L.I.,
Yang, Oye, K.A., Sarofim, A.F., Beer, J.M., Coal utilization in industrial boilers in
China—a prospect for mitigating CO2 emissions. Applied Energy, 63(1), 35–52,
1999, and Fang, J., Li, G., Aunan, K., Vennemo, H., Seip, H.M., Oye, K.A., Beer, J.M.,
2002. A proposed industrial efficiency program in Shangxi:potential CO2-
mitigation, health benefits and associated costs. Applied Energy 71, 275–285.

ARTICLE IN PRESS
Chart 1. Location of power plants in 2007 MIT China energy survey.
Table 1Distribution of power plants by province in 2007 MIT china energy survey.
Province # of plants
Shandong 33
Heilongjiang 12
Jiangsu 7
Hebei 8
Henan 4
Hubei 4
Anhui 3
Guangdong 3
Inner Mongolia 3
Tianjin 2
Shaanxi 2
Yunnan 2
Shanxi 1
Beijing 1
Total 85
Table 2MIT survey sample as percent of national coal-fired total (Units).
Sample National total % Of total
Under 100MW 161 4508 3.57
100–199 26 480 5.42
200–299 20 245 8.16
300–399 30 534 5.62
500 0 8 0.00
600–699 12 213 5.63
700–800 0 8 0.00
900–1000 1 8 12.50
Total 250 6004 4.16
Sources: NBS (National Bureau of Statistics) (2007); China Electricity Council
(2008); Authors’ calculations.
E.S. Steinfeld et al. / Energy Policy 37 (2009) 1809–1824 1811
The 257 units in the survey that are currently in operationrepresent a total capacity of 27.8 GW, which amounts to 5% of allcoal-fired generating capacity and 4% of total generating capacitynationwide in China. In terms of the number of generating units inthe MIT sample versus the total number of units nationally, thedata issues become tricky. Table 2, based on a variety of Chinesegovernmental reports and our own calculations, presents what webelieve is an accurate summation of the total number of coal-firedgenerating units nationally. The table then compares the sizedistribution of units in our sample against the size distribution ofunits nationally.
Questions certainly remain about the size and composition ofthe total population of Chinese power plants. As in so manyaspects of China’s political economy, data, while often available,tend to be inconsistently reported, incomplete, and at timesextremely confusing. This is true not just for publicly available
data, but also for the internal data upon which policy decisions aremade. In energy, as in many other industrial sectors, theinformation appears to become more confused as it is aggregatedacross broader domains of the system. Producers at the micro-level report information selectively, if at all, and when thesereports are aggregated, data reported using entirely differentterms, standards, or units not infrequently are merged into singlecategories.
The way researchers in the central government’s StateElectricity Regulatory Commission (Dianjianhui or ‘‘SERC’’) copewith this is not very different from the strategy employed by theMIT research team. Both the MIT team and Chinese governmentalresearchers employ what may be termed ‘‘purposive stratifiedsampling.’’ In the MIT case, our sample was stratified in terms ofpower plant location (province) and size (generating capacity), yetit was ‘‘purposive’’ in that we relied on the personal networks ofour Chinese partners to identify plants willing to participate. Thereliance on network-based sampling was necessitated by thesensitivities in the Chinese context surrounding energy sectorperformance, particularly at the individual plant level. Put simply,

ARTICLE IN PRESS
0
0.02
0.04
0.06
0.08
0.1
0.12
0.14
US bituminouscoal units – 2005
Pre-1985 1985-1989 1990-1994 1995-1999 2000-2004 US units ofall types – 2005
Uni
t Cap
acity
(GW
)
Chart 2. Average size of generating units added by period.
E.S. Steinfeld et al. / Energy Policy 37 (2009) 1809–18241812
most Chinese utility operators are disinclined to reveal the sorts ofinformation we were seeking.
Interestingly, they tend to be no more inclined to reveal suchinformation to the Chinese government than to independentacademic researchers. In the Chinese government’s version ofpurposive sampling, SERC and National Bureau of Statisticsresearchers survey the power sector via partnerships with localenergy research institutes that have preexisting relationships withlocal power producers. Data from separate locally based surveyefforts are then aggregated into what is purported to be arepresentative sample. This sample is then compared to datasubmitted by those plants across the system that are willing toreport. As one governmental researcher noted, statisticians in theChinese system end up trying to understand the whole system by‘‘looking through a straw.’’6 Both the MIT survey and official stateefforts end up relying on samples that are at once small anddriven by network relationships. In sum, our purposive samplefollows much of the method employed by Chinese statisticalagencies, however there is a bias in this first round ofsurveying—one-fifth of the survey’s online generating capacityis located in Shandong province. A resulting sample bias may bethat our plants are slightly larger and more coastal than thenational average.
7 Indeed, for fouling ash coals, boiler availability is actually better for smaller
3. Capacity: Chinese power sector scaling up over time
The conventional wisdom about China’s power sector oftenbegins with the assertion that the Chinese are building coal-firedpower plants of inordinately small scale. Our survey results reveala more complex reality. If one looks at the size of new generatingunits in our sample added during various time periods in China(Chart 2), the story seems to be that average size rises in the early1990s, and then steadily declines (red bars in chart Forinterpretation of the references to colour in this figure, the readeris referred to the web version of this article.). For referencepurposes, the average size of US units added in 2005 are alsoincluded in the chart (blue bars).
6 Authors’ interview, August 9, 2007.
Chart 3 shows how the population of generating units in theMIT sample is distributed across size categories (red bars). Chart 4shows how the generating capacity in the sample is distributed byunit size. For comparison purposes, the charts also show thecorresponding unit size distributions for all coal-fired generatingunits built in the United States over the past 50 years.
The charts indicate that while many small-scale units populatethe system, the bulk of the system’s total generating capacity isaccounted for by large-scale units. Some of these units are amongthe largest in the world. As indicated above, questions remainabout the representativeness of the sample, and we have somereason to believe it is slightly biased toward larger plants. Thatsaid, the general picture from the data is that China is bothbuilding small and building big, and doing so in a fashion notdrastically different from how the United States built out capacityin the post-war era.
4. Technology: the mix is becoming more advanced over time
The question of unit size is important for several reasons.Outside observers and Chinese state regulators alike frequentlyuse scale as a proxy for other features they are more interested in,such as plant-level operational efficiency, technological sophisti-cation, and environmental ‘‘friendliness.’’ As will be discussed inthis section, it is not just that Chinese power plants are bigger—orat least more varied in size—than many people recognize, but alsothat scale turns out to be a poor proxy for the issues mentionedabove. That is, size does not relate to environmental impact oroperational efficiency in a simple, linear way.7
In general, the relationship between generating unit size andenvironmental impact is complicated by two sets of factors: thenature of the technology the unit uses to generate electricity, andthe manner by which that technology is operated by plantmanagers. In this section we consider only the physical equipmentfound in Chinese power plants. We shall see that even absent the
units because of the higher surface-to-volume ratio of the combustion chamber,
resulting in more effective cooling of the coal ash entering the convective pass of
the boiler. We are grateful to Janos Beer for pointing this out.

ARTICLE IN PRESS
0%
10%
20%
30%
40%
50%
60%
70%
Under 100MW
Unit Capacity (MW)
100-199.9 200-299.9 300-399.9 500 600-699.9 700-800 900-1000
Shar
e of
Tot
al U
nits
% of Sample % of US Population
Chart 3. Size distribution of MIT survey sample (1956–2007) vs. size distribution of American coal-fired power plants (1956–2006).
0%
5%
10%
15%
20%
25%
30%
35%
Under 100MW
100-199.9 200-299.9 300-399.9 500 600-699.9 700-800 900-1000MW
Unit Capacity (MW)
Shar
e of
Tot
al C
apac
ity
% of Sample (Capacity)% of US Population (Capacity)
Chart 4. Capacity-weighted size distribution of MIT Survey sample (1956–2006) vs. size distribution of American power plants (1956–2006).
E.S. Steinfeld et al. / Energy Policy 37 (2009) 1809–1824 1813
operational issues, the connections between technology, scale,and pollutant levels may still be very complicated, often involvinga multitude of choices and tradeoffs.
4.1. Scale and generating efficiency
As a first step in assessing environmental impact, we considerthe overall efficiency with which a generating unit converts coal
into electricity. The more efficient the plant, the less fuelburned—and the fewer pollutants emitted—per unit of energygenerated. Also lessened are the amount of limestone consumed;the size of front-end and flue-gas treatment equipment; wateruse; waste generated; and parasitic energy consumption. Parti-cularly in countries like China where the energy system isexpanding so rapidly and so much new infrastructure is beingbuilt, the efficiency characteristics of the new technologies being

ARTICLE IN PRESS
0
10
20
30
40
50
60
70
80
90
100
Small (below 50MW) Medium Large (300MW and above)Unit Capacity (MW)
# of
Uni
ts
1.4-3.9MPa/400-450C3.9-9.9MPa/450-540C9.9-13.8MPa/540C13.8-17.5MPa/540C17.5-22.19MPa/540C22.19+Mpa/540C
Chart 5. Steam conditions in MIT survey sample plants (data of first operation).
0
10
20
30
40
50
60
70
80
Pre 1985 1985-2001 2002 and LaterSteam Pressure and Temperature Over Time
# of
Uni
ts
1.4-3.9MPa/400-450C3.9-9.9MPa/450-540C9.9-13.8MPa/540C13.8-17.5MPa/540C17.5-22.19MPa/540C22.19+Mpa/540C
Chart 6. The evolution of electric power generation efficiency over time.
E.S. Steinfeld et al. / Energy Policy 37 (2009) 1809–18241814
installed will likely prove one of the biggest determinants of long-term environmental impact.
With respect to efficiency, our 2007 survey indicates someprogress in China. In recent years, a number of larger-scale unitshave come on line, and those units are usually associated withmore efficient performance (higher steam conditions). Theselarger units employ advanced pulverized coal combustion tech-nologies, for which efficiency increases with scale. An overallpicture is presented in Charts 5 and 6.
Chart 5, presenting a current snapshot of all the generatingunits in the sample, illustrates the frequency with which differentsteam conditions are encountered within the three size categoriesof units: small, medium, and large. In each category, we see avariety of performance levels representing a variety of differenttechnologies currently employed in Chinese plants. Smaller sizeunits (below 50 MW) tend to operate at low temperatures andpressures, whereas large-scale systems (above 300 MW) tendto be associated with higher temperature, higher pressure
ARTICLE IN PRESS
0
1
2
3
4
5
6
7
8
9
1.4-3.9MPa/400-450C 3.9-9.9MPa/450-540C 9.9-13.8MPa/540C 13.8-17.5MPa/540C 17.5-22.19MPa/540C 22.19+Mpa/540C
Steam Pressure and Temperature
Tota
l Cap
acity
(GW
)
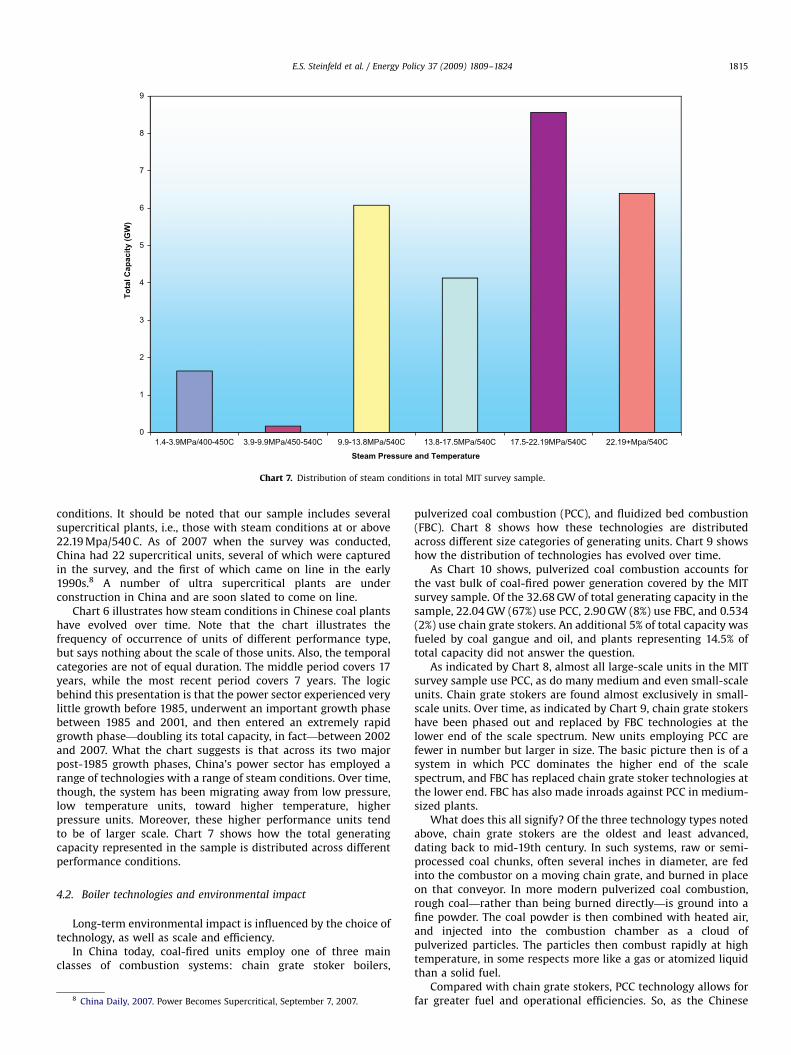
Chart 7. Distribution of steam conditions in total MIT survey sample.
E.S. Steinfeld et al. / Energy Policy 37 (2009) 1809–1824 1815
conditions. It should be noted that our sample includes severalsupercritical plants, i.e., those with steam conditions at or above22.19 Mpa/540 C. As of 2007 when the survey was conducted,China had 22 supercritical units, several of which were capturedin the survey, and the first of which came on line in the early1990s.8 A number of ultra supercritical plants are underconstruction in China and are soon slated to come on line.
Chart 6 illustrates how steam conditions in Chinese coal plantshave evolved over time. Note that the chart illustrates thefrequency of occurrence of units of different performance type,but says nothing about the scale of those units. Also, the temporalcategories are not of equal duration. The middle period covers 17years, while the most recent period covers 7 years. The logicbehind this presentation is that the power sector experienced verylittle growth before 1985, underwent an important growth phasebetween 1985 and 2001, and then entered an extremely rapidgrowth phase—doubling its total capacity, in fact—between 2002and 2007. What the chart suggests is that across its two majorpost-1985 growth phases, China’s power sector has employed arange of technologies with a range of steam conditions. Over time,though, the system has been migrating away from low pressure,low temperature units, toward higher temperature, higherpressure units. Moreover, these higher performance units tendto be of larger scale. Chart 7 shows how the total generatingcapacity represented in the sample is distributed across differentperformance conditions.
4.2. Boiler technologies and environmental impact
Long-term environmental impact is influenced by the choice oftechnology, as well as scale and efficiency.
In China today, coal-fired units employ one of three mainclasses of combustion systems: chain grate stoker boilers,
8 China Daily, 2007. Power Becomes Supercritical, September 7, 2007.
pulverized coal combustion (PCC), and fluidized bed combustion(FBC). Chart 8 shows how these technologies are distributedacross different size categories of generating units. Chart 9 showshow the distribution of technologies has evolved over time.
As Chart 10 shows, pulverized coal combustion accounts forthe vast bulk of coal-fired power generation covered by the MITsurvey sample. Of the 32.68 GW of total generating capacity in thesample, 22.04 GW (67%) use PCC, 2.90 GW (8%) use FBC, and 0.534(2%) use chain grate stokers. An additional 5% of total capacity wasfueled by coal gangue and oil, and plants representing 14.5% oftotal capacity did not answer the question.
As indicated by Chart 8, almost all large-scale units in the MITsurvey sample use PCC, as do many medium and even small-scaleunits. Chain grate stokers are found almost exclusively in small-scale units. Over time, as indicated by Chart 9, chain grate stokershave been phased out and replaced by FBC technologies at thelower end of the scale spectrum. New units employing PCC arefewer in number but larger in size. The basic picture then is of asystem in which PCC dominates the higher end of the scalespectrum, and FBC has replaced chain grate stoker technologies atthe lower end. FBC has also made inroads against PCC in medium-sized plants.
What does this all signify? Of the three technology types notedabove, chain grate stokers are the oldest and least advanced,dating back to mid-19th century. In such systems, raw or semi-processed coal chunks, often several inches in diameter, are fedinto the combustor on a moving chain grate, and burned in placeon that conveyor. In more modern pulverized coal combustion,rough coal—rather than being burned directly—is ground into afine powder. The coal powder is then combined with heated air,and injected into the combustion chamber as a cloud ofpulverized particles. The particles then combust rapidly at hightemperature, in some respects more like a gas or atomized liquidthan a solid fuel.
Compared with chain grate stokers, PCC technology allows forfar greater fuel and operational efficiencies. So, as the Chinese

ARTICLE IN PRESS
0
10
20
30
40
50
60
70
80
Small ( below 50MW)
Medium Large (300MW and above)
Unit Capacity (MW)
# of
Uni
ts
Chain GratePulverizedFluidized Bed
Chart 8. Distribution of technology types by unit size in MIT survey sample.
Chart 9. Distribution of technology types over time.
0
5
10
15
20
25
Chain Grate Fluidized Bed PulverizedBoiler Type
Tota
l Cap
acity
(GW
)
Chart 10. Distribution of sample’s total generating capacity across boiler types.
9 World Coal Institute, Fluidised Bed Combustion (http://www.worldcoal.org/
pages/content/index.asp?PageID=420).10 United States Department of Energy, Fluidized Bed Technology—An
Overview (http://www.fossil.energy.gov/programs/powersystems/combustion/
fluidizedbed_overview.html). See also, IEA Clean Coal Centre, Clean Coal
Technologies—Fluidised Bed Combustion, (http://www.iea-coal.org.uk/site/
ieacoal_old/clean-coal-technologies-pages/clean-coal-technologies-fluidised-bed-
combustion-fbc?).
E.S. Steinfeld et al. / Energy Policy 37 (2009) 1809–18241816
system has shifted away from chain grate stokers towards largerscale PCC, the average generating efficiency has risen, andenvironmental gains have also been realized as a result.
PCC produces a series of atmospheric pollutants: sulfur oxides(SOx) and nitrogen oxides (NOx) associated with acid rain, carbondioxide (CO2) associated with global warming, and particulatesand trace metals, including mercury, associated with humanhealth issues. In terms of CO2, it is only relatively recently thatpeople in advanced industrial nations, let alone China, have begunto understand this as an environmental threat. Solutions involvingcarbon capture and sequestration have yet to be demonstrated atscale. Mercury emissions from coal-fired power plants have alsoeluded effective remediation in many parts of the world, includingthe United States. With respect to SOx and NOx, on the other hand,a variety of proven cleanup technologies are now available topower producers.
Compared with PCC, fluidized bed combustion technologyoffers both advantages and disadvantages. FBC works by feedingmillimeter size crushed coal and limestone into a combustorcomprised of a bed of inert particles through which gas is blownupward.9 The fuel is then suspended in an airborne and turbulentstate, making it behave in a fashion somewhat akin to a bubblingliquid.10 This allows for efficient burning and heat transfer—onpar with many PCC systems—but at substantially lower tempera-tures. The SO2 that is produced as a by-product of combustion ismostly neutralized by the limestone in the fluidized bed. This mayobviate the need for expensive stack gas scrubbers or other costlyto operate post-combustion cleanup technologies (though toachieve very low SOx emissions in the absence of flue-gas cleanuprequires the use of low-sulfur coal). Because combustion takesplace at lower temperatures than in PCC, the production of NOx issomewhat reduced. On the other hand, nitrous oxide (N2O), apotent greenhouse gas, is produced at the lower temperaturescharacteristic of FBC, and this adds a significant increment tooverall GHG emissions relative to PCC.
Fluidized bed combustion is a well-established technology butits application to power generation at utility scale is relativelyrecent. The capacity limit on fluidized bed units has beengradually pushed upward, but technical risks associated withscale-up remain, and even today most fluidized bed units forpower generation deployed around the world are below 250 MWein capacity.
Regulatory efforts in China today focus on pressuring generat-ing companies to build larger-scale units. Often, scale require-ments are enforced by requiring the shut down of small units as aprecondition for approval to build new capacity. In practice, whatthis means is that pulverized coal technologies (well suited tolarge-scale units) end up favored in regulatory terms overfluidized bed combustion (as yet unfeasible technologically atlarge scale).
It should be noted that in China today, even with ongoingresearch efforts into larger scale FBC, debates are intensifying overwhether FBC technology on the whole should be encouraged bystate policy. Some experts on the technical side argue that understrict emissions standards—levels of sulfur dioxide stack gasemission concentrations below 200 mg/m3 (in the range ofcurrent US and EU standards, but lower than current Chineselevels)—absorption of SOx emissions in the fluidized bed wouldnot be adequate except for with very low-sulfur coal. To meetsuch standards, FBC units would have to add on post-combustion

ARTICLE IN PRESS
FGD Type by Plant
50 plants, 61%
17 plants, 21% 15 plants, 18%
No FGDFGD+CEMS on some unitsFGD+Plant monitors on some units
Chart 11. Occurrence of FGD systems in survey sample.
E.S. Steinfeld et al. / Energy Policy 37 (2009) 1809–1824 1817
flue-gas desulfurization (FGD) systems. Should Chinese environ-mental regulations strengthen in the near term, it is argued, thisretrofitting cost could become considerable for FBC plants.11
Still, many industry experts globally classify FBC as a ‘‘cleancoal’’ technology. That such systems are proliferating at the lowerend of the scale spectrum in China suggests that, at least ifoperated properly, even smaller plants can provide real leverageover the SOx and NOx problems. At the very least, the spread ofFBC systems raises questions about two of the simplifyingassumptions often used to analyze China’s power sector: the ideathat bigger is better, and the notion that China has too manysmall-scale plants.
4.3. Prevalence of stack gas scrubbers
The reality remains, though, that the bulk of China’s electricpower infrastructure burns pulverized coal, and that to addressSOx and NOx emissions, pulverized coal units have to employ post-combustion cleanup systems. Some sulfur can also be removedprior to combustion through coal washing. One of the goals of theMIT survey was to gain insight into the prevalence of at least onevariety of such technologies—flue-gas desulfurization systems—
across China’s power sector. Governmental regulations nowrequire most new plants to install and operate such systems,but observers have long questioned the extent of regulatoryenforcement in this area.12 MIT’s survey results speak to this issue,but some caveats are in order.
For the data to be most useful, they would need to be reportedat the generating unit, rather than plant level. A single plant, afterall, may operate several different units employing severaldifferent kinds of technologies. Some of the units, if employingboiler technologies like FBC, would not necessarily need post-combustion cleanup systems. Others that would require FGD,such as pulverized coal systems, might simply not have installedthem, thus falling out of compliance with state regulations.Unfortunately, our data were reported only at the plant level. Thuswe can only say whether a given plant has an FGD systeminstalled on at least one of its generating units. We can present arough sense of FGD penetration in the industry, but not the kind offine-grained, unit-level analysis contained in other parts of thestudy.
As indicated in Chart 11, 82 of the 85 power plants in oursample provided information about FGD. Of those 82 plants, 67reported purchasing and installing FGD systems on at least one oftheir generating units. It could be the case, of course, that FGD hasbeen installed on only one of the units of a multiple unit powerplant. It could also be the case that some plants operate only FBCboilers, which would not likely utilize FGD for SOx cleanup. Withinthe group of 67 plants with at least one FGD-equipped unit, 50plants reported also having continuous emissions monitoringsystems, while 17 plants reported having systems limited toperiodic testing. The presence of continuous emissions monitor-ing is important because such systems provide real time,verifiable data—presumably also accessible by third partyobservers—regarding the environmental performance of thegenerating unit.
FGD systems represent a fairly significant capital expenditurefor power plants. That roughly 80% of the plants surveyedreported installing at least one such system on a generating unitsuggests that environmental officials are achieving some regula-
11 Authors’ interviews, July, 2008.12 Stern, D., 2005. Beyond the Environmental Kuznets Curve: Diffusion of
sulfur-emissions-abating technology. The Journal of Environment & Development
14 (1), 101–124. For a recent discussion of advances in this regard, please refer to
Xu, Williams, Socolow, ‘‘China’s rapid deployment of SO2 scrubbers’’, draft, 2008.
tory traction. Recent national figures tell a similar story. By theend of 2007, according to some Chinese estimates, over 270 GW ofgenerating capacity had some form of FGD equipment.13 Inparticular, state regulations demand that all new power plantsas of January 1, 2004 must be equipped with FGD systems, and aseries of programs have been initiated to ensure retrofitting ofFGD systems on older plants by the end of the decade.14 The rulesare now on the books, and they seem to be having some effect, butas will be discussed later, regulatory traction is partial at best. Theshortfalls appear particularly serious on the operational side ofpower plants.
The broader message of this section is that many Chinesepower plants are investing in a range of modern systems. Thephenomenon is clearest with regard to coal combustion technol-ogies across a variety of scales and steam conditions. Moderntechnology acquisition is also apparent to some degree on theenvironmental cleanup side. The bottom line is that it is notgenerally correct to say that China today is building a second-rate,technologically obsolete electric power infrastructure.
5. Coal supply: the power plant perspective on fuel sourcing andpricing
Technology and capital equipment constitute one major pieceof the puzzle for how power systems impact the environment.Power plant operation constitutes the other. Coal access, pricing,and quality are obviously central to a host of operational issues.Indeed, because fuel costs are the single largest operating expenseof a coal-fired power plant, they can under certain circumstancesalso exert major influence on long-term technology acquisitionand investment decisions.
5.1. State and market channels of allocation
Over the last five to six years, Chinese power plants have facedrapidly changing conditions for fuel supply. Coal in China has inrecent years generally been available through two main channels:a national allocation system managed by the state, and an ad hocsystem of direct, market-like transactions between mines andpower plants. Until at least 2002, the state managed system,
13 China Electricity Council, Guojia Fagaiwei Fabu 2007 Nian Huodianchang
Yanqi Tuoliu Chanye Xinxi, March 19, 2008 (http://www.cec.org.cn/news/
deptnews.asp?id=2871).14 Andrew Minchener, Coal Supply Challenges for China, IEA Clean Coal Centre,
2007, 16.

ARTICLE IN PRESS
0
5
10
15
20
25
30
0% 10% 30% 33.33% 35% 50% 60% 65% 75% 80% 100%Share of Coal Supply Subsidized
# of
Pla
nts
Chart 12. Power plant access to subsidized coal.
Under 1 Year (butnot temporary),4 Plants, 16%
Temporary Contract, 3 Plants,
12%
Over 1 Year Contract, 1 Plant,
4%
1 Year Contract, 17 plants, 68%
Chart 13. Contract types for coal accessed through market channels.
E.S. Steinfeld et al. / Energy Policy 37 (2009) 1809–18241818
involving annual delivery contracts at state-set prices, accountedfor the bulk of coal delivered to power plants. Since 2002, whencoal demand began to surge in China, the market channel hasbecome far more important. Much of the new coal demand inChina has been met by smaller, locally owned mines, which werenever part of the state coal allocation system. Moreover, the larger,more state-oriented mines anchoring the state allocation systemhave proved increasingly unwilling to move output through statechannels in such a tight market. As a result, market transac-tions—direct interactions between producers and consumers atvariable prices—have come to account for an increasing share ofall coal delivered in China. Second and concomitantly, Chinesedomestic coal prices have been rising, effectively convergingtoward world market levels.
Just over half the plants in the survey sample (44 of 85 plants)responded to questions about coal allocation and pricing. Of theplants that responded, 55% (24 plants) reported that none oftheir fuel supply was subsidized, while 45% (20 plants) reportedthat at least some fraction of their supply came through statechannels at subsidized prices. Interestingly, as indicated byChart 12, only six plants reported receiving all of their fuelthrough subsidized channels. For many of the other plantsaccessing subsidized coal, these lower-priced fuels accounted foronly a fraction—and sometimes a very small fraction—of theplant’s total fuel supply.
For coal coming in through market channels, one-yearcontracts between mine and power plant appear to be the norm,but spot market transactions also take place. As indicated byChart 13, of the 25 plants that provided contracting information,17 (68%) reported the use of one-year contracts. Four plantsreported contracts of less than one year in duration, and threeplants reported that they were accessing fuel via ‘‘temporary’’contracts—that is, on spot markets.
In visits to power plants and mines in the past year, membersof our team witnessed the operation of these spot markets. Underthe strained supply conditions of the present, consumers enteringthese markets have to take what coal they can get, often withoutany clear information or assurances about the type and quality ofthe coal being offered. If the consumer delays by taking time totest the coal, the mine will likely just sell to someone else in theinterim.
5.2. Pricing in the Chinese coal market
Power plants are essentially price takers in what amounts to acomplex and chaotic seller’s market for coal. As illustrated byChart 14, plants across the sample reported a wide range ofmaximum prices for delivered coal paid in 2007. Spot contracts(red bars) can be found across the price spectrum running fromroughly 250 RMB per ton to just over 600 RMB per ton. Forcomparison purposes, the average price for delivered coal paid byUS power plants is included at the far right of the chart (blackbar).
In addition to coal prices varying across plants, individualplants themselves source coal at multiple price points through theyear. The survey responses permit us to measure that differentialfor each plant in the sample. Chart 15 categorizes thesedifferentials according to the magnitude of the price range, andthen shows how many plants in the sample fall into each category.Chart 16 shows similar information, but controls for the size of theplant, effectively showing how much generating capacity of thesample’s total falls into each of the price differential categories.What is clear is that a substantial portion of plants, particularly ifone controls for size, are experiencing considerable pricedifferentials.
A possible explanation for these price differentials betweenand within plants is that they simply reflect the different typesand qualities of coal available on the market. This may be true, butit is also true that coal quality standards are loosely specified and

ARTICLE IN PRESS
0
100
200
300
400
500
600
700
6 48 23 27 21 36 37 18 26 52 24 49 25 22 82 47 45 53 73 76 41 43 46 44 10 55 8 79 56 38 29 40 81 1U
SA
Plant #
RM
B
Chart 14. Most expensive coal price reported by power plants (RMB/MT), 2007. Note: Source for US 2007 delivered coal prices is Fred Freme, ‘‘US Coal Supply and Demand:
2007 Review’’, Energy Information Agency, US D.O.E. (http://tonto.eia.doe.gov/FTPROOT/features/feature07.pdf). For Chart 14, data from Freme were then converted from
short tons to metric tons, and from US Dollars to RMB at the December 31, 2007 interbank lending rate.
Chart 15. Coal price differentials experienced by individual plants.
E.S. Steinfeld et al. / Energy Policy 37 (2009) 1809–1824 1819
poorly enforced in China. Thus, information asymmetries existbetween coal suppliers and buyers in this market. Pricestechnically may differ across coal types, but buyers are ofteneither uncertain of what they are getting or facing situations ofscarcity in which they have to take whatever they can get,regardless of preferred type. Hence, we witness the situation ofsingle firms paying a variety of prices—i.e., experiencing sub-stantial price volatility—in their coal sourcing operations. Giventhe volatility of the current coal market and the fact that fuel costsare the single greatest operational expense in power generation,plants are disinclined to maintain large coal inventories. Further-more, given that electricity prices are set by the state and do notmove fluidly upward with rising coal prices, plants have to findways to reduce operational costs in the face of escalating fuel
expenses. One response is to purchase cheaper, lower grade coal,particularly on the margins to fill out narrow inventories. Minestoo may substitute lower grade coal to round out a shipment ofostensibly higher grade material.
In either case, plants end up burning a wide variety of coaltypes, sometimes to the detriment of their installed technology.This is a particularly serious problem for firms employing moreadvanced PCC and FGD technologies, systems that have lowtolerances for fluctuations in coal ash and sulfur content. Here, wecan see how rising coal prices can limit FGD use in two ways. First,with rising fuel expenses, plants may be inclined to cut costs bysimply not operating their FGD systems. Second, rising fuelexpenses encourage plants to source lower quality, cheaper coal,just as soaring demand encourages mines to round out shipments

ARTICLE IN PRESS
0
0.5
1
1.5
2
2.5
3
3.5
4
4.5
0-49 50-99 100-149 150-199 200-249 250-299 300-349RMB
Tota
l Cap
acity
Chart 16. Coal price differentials as distributed across total generating capacity of sample.
Truck, 28 Plants,37%
Train, 23 Plants, 29%
Truck Dominant, 7 Plants, 9%
Ocean Tanker, 3 Plants, 4%
Train Dominant, 11 Plants, 14%
Train and Truck Even, 1 Plant, 1%
Boat, 4 Plants, 5%
Boat and Truck, 1 Plant, 1%
Chart 17. Modes of coal transport for plants in the survey sample.
E.S. Steinfeld et al. / Energy Policy 37 (2009) 1809–18241820
with lower quality material. As this sub-standard coal runsthrough the plant that actually is running FGD, the cleanupsystem gets overtaxed and degraded.
Indeed, these factors help to explain why fluidized bedcombustion systems have an important market in China. Suchsystems can burn virtually any type of coal with no ill effect. It isnot surprising therefore that so many of these systems are beinginstalled in smaller scale units, and that the Chinese state hasbeen encouraging research into FBC applications at the high endof the size spectrum as well.
15 China Electricity and Coal Industry, 2004, China Coal Industry Publishing
House. Economic Information Daily, 24 February 2006. BP, Statistical Review of
World Energy, 2008.16 China Industrial Map Publishing Committee, 2007. Zhongguo Nengyuan
Chanye Ditu 2006–7, p. 83.
5.3. Coal transport
Because the prices reported in the survey are for delivered coal,some of the price variation experienced across firms may be dueto transport costs. Nonetheless, the survey uncovered a somewhatdifferent picture of coal market geography from what theconventional wisdom usually asserts. The conventional view isthat coal in China moves long distances, via rail, from majorsuppliers—mines in Central and Northwest China—to majorconsumers, the power plants along the East and Southeast Coast.Indeed, in 2005 over 58% of China’s total coal transported was
shipped by rail.15 The picture emerging from the survey, however,is that a substantial amount of steam coal—coal burned by powerplants—is still sourced locally, trucked in from relatively nearbymines. This result was found despite the overrepresentation in thesample of power plants in Shandong, a province that is not amajor mining center. In contrast to issues surrounding pricing,most of the plants in the sample—79 of 85—were able and willingto provide information about fuel transport. As illustrated byChart 17, 28 plants (37% of all that responded), reported that all oftheir fuel came in via truck. Slightly fewer plants, 23, reported thatall their fuel arrived via train. The remainder utilized a mix of trainand truck, as well as oceangoing collier barge. Recent nationaldata reveal considerable volatility in the share of coal transportedby rail and by truck. While ocean and river barges wereconsistently responsible for 17–18% of China’s transported coalbetween 2002 and 2005, coal shipped by rail dropped from 59.0%in 2002 to 52.7% in 2003 then rose again to 58.9% by 2005.16

ARTICLE IN PRESS
0
1
2
3
4
5
6
7
8
12 14 49 45 61 39 57 74 20 52 80 17 18 60 33 65 23 63 79 64 38 5 76 40 72 32 54
Plant #
%
Chart 18. Sulfur content of power plant fuel (weight percent).
E.S. Steinfeld et al. / Energy Policy 37 (2009) 1809–1824 1821
Three interesting points emerge from these data. First, as notedpreviously, a considerable portion of power plant fuel seems to besourced locally, thus reinforcing the idea that at least in thecurrent market, plants on the margin take what they can get, asopposed to relying exclusively on the larger state mines andhigher grade fuels found in the Northwest. Second, while it maybe true that the Chinese national railway system is overburdenedby long-distance coal transport, the road system is also playing akey role in fuel transport. That may have important ramificationsfor everything from diesel markets to environmental controls forvehicles. Third, there is an environmental ramification. That somuch coal is being sourced locally suggests that Chinese powerplants burn very little washed coal. It has long been asserted inthe literature that Chinese power plants do not wash their coal, apractice that matters since washing is a primary means oflowering sulfur and ash levels prior to combustion. The MITsurvey confirmed that plants themselves are certainly notwashing—none of the plants in the sample reported doing so.However, in recent years, the Chinese central government, as partof its environmental agenda, has pushed major investments insteam coal washing facilities in large state-owned mines,particularly in the Northwest.17 In addition to environmentalconcerns, the government policy was motivated by the desire tolessen the amount of mineral material that would have to beshipped along the national railway system. For the large minesthemselves, washing facilities may be appealing to the degree thatthey increase the attractiveness of China’s steam coal in globalexport markets. The key point, though, is that smaller, local coalmines have neither the resources nor incentive to invest inwashing facilities. That local mines are supplying such a largeportion of power plant fuel suggests that while some washed coalmay be reaching Chinese power plants, much of the coal burned isunwashed.
5.4. Coal quality: sulfur content
Coal on the Chinese market comes in a variety of types andquality grades. Coal quality in general is a complicated issueinvolving multiple dimensions. The MIT survey collected data
17 Minchener, p. 23.
along several of these dimensions, but for the sake of brevity thissection will focus on sulfur content, an important parameter bothfor plant-level pollutant emissions and for the integrity ofsensitive boiler and cleanup systems.
Roughly 90% of all coal currently mined in China falls into thelow to medium sulfur content classification (sulfur concentrationsat or below 2%).18 As indicated by Chart 18, most of the plants inthe survey sample reported using coal at or below the 2% level. Sixplants of the 80 that responded in total (8%) reported using coal ofconsiderably higher sulfur content, one as high as 7%. None-theless, the general point is that most Chinese power plants, atleast in self-reported data, seem to be accessing low-sulfur coal.Indeed, some recent observers have commented that theirtendency to do so—basically in response to governmentalpressures on the environmental front—has squeezed out othernon-power-related industrial consumers of coal from the low-sulfur market. In theory, at least, this could be a worst-of-all-worlds policy outcome. Power plants, in part because they arebetter monitored by the state, and in part because they seek tolower operating costs by avoiding the overtaxing of their FGDsystems, conceivably are willing to keep paying slightly higherprices for low-sulfur coal. Meanwhile, other industrial consumers,poorly monitored by the state and devoid of any cleanup systems,migrate over to the higher sulfur content end of the coal market.
The broader point is that while plants are burning a variety ofcoal types, there appears to be enough regulatory traction in thesystem to push them under most conditions to continue sourcinglow-sulfur coal. Of course, another possible explanation is thatplants are misreporting the quality of their fuel. We return to thissubject below.
5.5. The cross-cutting effects of coal marketization
For Chinese power plants, the marketization of coal creates ajumbled mix of new incentives, many of which are cross-cuttingand difficult to untangle. This is an important subject requiringmore research; however, we can already speculate about some ofthe incentive effects, several of which are borne out in the surveyresults.
18 Minchener, p. 11.

ARTICLE IN PRESS
E.S. Steinfeld et al. / Energy Policy 37 (2009) 1809–18241822
First, the price increases and volatility associated with market-ization make understandable the finding that many plants haveinvested in advanced power generation technologies. Moreefficient combustion translates into better fuel economy andlower operating costs over the life of the plant, a good way overthe long run to cope with rising fuel expenses. Second, to theextent they have been forced through regulatory pressure toinstall post-combustion cleanup systems, plants may attempt tocounter rising fuel costs by operating those cleanup systems lessfrequently, if at all. Flue-gas desulfurization systems are veryexpensive to operate. Under certain conditions they may accountfor upwards of a third of a power plant’s operating expenses.Third, particularly given the low fuel inventories maintained in avolatile price environment, power plants face pressures to accesscoal from a variety of different suppliers at a variety of differentprice points. As the number of suppliers increases—particularlywhen smaller, more locally controlled mines get involved—coalquality becomes less certain. It is highly probable that manypower producers today are running a wide variety of coal typesthrough their boilers, whether knowingly or not. As notedpreviously, this can have not only environmental ramifications,but also consequences for the integrity of the physical plant.
Fourth, power plants, in an effort to reduce overall costs bysaving on transport, may increasingly be sourcing coal from localsuppliers. Again, this can lead to a fuel supply of lower or at leastmore variable quality actually reaching the power plant. While itis true that some of this localization may be mitigated by centralgovernment efforts to close down smaller mines, this policy hasbeen unevenly enforced and results have been varied.19
In the end, what does this all mean for the environment? Thedevelopment of markets for coal—like the development ofmarkets for any commodity—solves certain problems and createsothers. The unleashing of fuel prices to reflect real market demandappears to be having a positive impact on long-term technologychoice and infrastructure quality. Yet, as will be discussed in thefollowing section, the impact on plant-level environmentalpractice appears far more ambiguous, and in some cases, evennegative.
6. Power plant environmental performance
Power plant environmental performance is a multi-dimen-sional issue involving a number of pollutants. Measuring thequantity of emissions of each type of pollutant is extremelychallenging. Determining whether emissions levels for a givenplant are within regulatory limits is also challenging, given all theregulatory changes that have occurred in China in recent years.The rules are complex, and have changed repeatedly, thusaffecting in all sorts of ways the manner and accuracy by whichplants report emissions data. As noted previously, continuousemissions monitoring systems have become more prevalent inChina, but even so, available emissions data are frequentlydismissed as unreliable by industry insiders and governmentregulators alike. That said, the MIT survey did collect informa-tion—self-reported by power plant respondents—on environ-mental performance. With all appropriate caveats in mind, we
19 Andrews-Speed, P., Ma, G., Shao, B., Liao, C., 2005. Economic responses to the
closure of small-scale coal mines in Chongqing, China. Resources Policy 30 (1),
39–54. Andrews-Speed, P., Yang, M., Shen, L., Cao, S., 2003. The Regulation of
China’s Township and Village Coal Mines: a study of complexity. Journal of Cleaner
Production 11, 185–196. Shen, L., Andrews-Speed, P., 2002. Economic analysis of
reform policies for the small coal mines in China. Resources Policy 27, 246–254.
Andrews-Speed, P., Zamora, A., Rogers, C.D., Shen, L., Cao, S., Yang, M., 2002. A
framework for policy formulation for small-scale mines: the case of coal in China.
Natural Resources Forum, 26, 43–52.
present results for one of the pollutants most emphasized inrecent regulatory efforts, sulfur dioxide.
Forty-seven of 85 plants in the sample provided informationabout SO2 emissions, as shown in Chart 19. These data refer toaverage annual pollutant concentrations in the smokestack gas. Aswith the figures presented earlier on FGD installation, the datahere were unfortunately reported at the plant rather thangenerating unit level. Emissions concentrations depend upon theparticular boiler and cleanup technologies in use, as well as themanner by which those technologies are operated. These are allfactors pertinent to the unit rather than the plant. Nonetheless,the plant-level data that we have can provide a general sense ofthe overall emissions story.
To clarify how these levels relate to regulatory compliance, aword is in order about the Chinese government’s currentemissions standards for SO2. The standards, adopted in 2003,delineate a range of emissions limits depending primarily onpower plant age.20 For the first category of plants—plants thatcame on line prior to January 1, 1997—average annual stack SO2
emissions are currently not permitted to exceed 2100 mg/m3. OnJanuary 1, 2010, the limit will drop to 1200 mg/m3. For the secondcategory of plants—those that came on line from the beginning of1997 through the end of 2003—the limits are 2100 mg/m3
through the end of 2009, and then 400 mg/m3 from there onout. Exempted from this category are plants whose environmentalimpact assessment report was approved prior to the promulgationof the rules in 2003. Also exempted is a particular set of mine-mouth power plants in Western China—located outside the twospecial restriction zones for acid rain control—that burn low-sulfur (o0.5%) coal. Their emissions limits are set at 1200 mg/m3,a level that will be maintained after 2009. A third category ofplants—those that have come on line since the beginning of2004—must abide by limits of 400 mg/m3, a restriction set tocontinue indefinitely. Exceptions exist in this category as well,however. Certain power plants burning coal waste are permittedto emit up to 800 mg/m3. Also, like their older counterparts, newmine-mouth plants in Western China are also permitted to emitup to 1200 mg/m3.
Chart 19 codes the respondent plants by color according to theregulatory category to which they belong. Blue pertains to plantsthat came on line prior to 1997, yellow to plants that came on linebetween 1997 and 2003, and green to plants that came on lineafter 2003. We are fairly certain that none of the exceptions notedin the regulations apply to any of the Category two and Categorythree plants. We cannot say the same for the older Category oneplants. We have left unclassified those plants whose regulatorycategory is indeterminate. These, colored red in the chart, areprimarily older plants that happen to have new units that came online after 2003. Presumably for such plants, some of the units fallunder one regulatory category while other units fall underanother. The chart also demarcates the legal emissions limits foreach category. For reference purposes, comparable emissionslimits in the European Union are included as well.
Several things are noteworthy about this chart. First, SO2
emissions levels in some Chinese plants appear to be very high, farbeyond the compliance limits that exist outside China. Second, anumber of plants in the sample—even with self-reporteddata—appear to be out of compliance with China’s own domesticlimits. At least one of the pre-1997 plants and three of theunclassified plants reported emissions beyond China’s legal limits.Perhaps most interesting, four out of the six plants fallingunder the strictest regulatory category reported non-compliant
20 Zhonghua Renmin Gongheguo Guojia Biaojun, GB 13223–2003, Emission
Standard of Air Pollutants for Thermal Power Plants, 12/30/2003.

ARTICLE IN PRESS
(Blue: Online Prior to 1997 Yellow: Online 1997-2003; Green: Online 2004 and Later; Red: Year Unknown)
0
500
1000
1500
2000
2500
3000
3500
4000
4500
17 65 15 55 31 14 40 56 29 47 7 10 18 24 27 26 82 42 67 63 35 25 66 71 20 78 22 23 75 49 16 33 19 39 46 45 85 64 38 43 62 79 80 61 81 3
Plant #
mg/
cubi
c m
eter
PRC Plants Online prior to 1997
PRC Plants Online 1997-2003
PRC Plants Online After 2003
EU (50-100MW)
EU (100+ MW)
Chart 19. Plant level sulfur dioxide emissions.
E.S. Steinfeld et al. / Energy Policy 37 (2009) 1809–1824 1823
emissions levels. These are China’s newest plants, required by lawto be equipped with environmental cleanup systems, and held toemissions limits that while relatively lax by European or Americanstandards are strict relative to what older plants in China face.Most of these new plants, however, seem unable to meet thestandards, in some cases by a large margin.
In some respects this is an extraordinary finding, not leastbecause it is based on data reported by plants themselves. It iswell known that aggregate Chinese emissions have consistentlyexceeded, often by a large margin, the annual SO2 emissionstargets established by the government. The data presented inChart 19 suggest why, in part. It is also usually assumed thatChinese power plants are massive emitters of SO2. This too isconfirmed by the survey results. Yet what is striking is thecontrast between these bleak performance data and the relativelypositive data about technology modernization presented earlier.The basic story seems to be that on the investment side, Chinesepower plants are pumping money into massive technologymodernization and upgrading efforts. They are in many casesinstalling state-of-the-art equipment. This is even true to someextent on the environmental cleanup side. Yet they do not appearto be operating that equipment. The FGD systems are going in, butthey are not, it would appear, being turned on. An alternativepossibility, as indicated earlier, is that plants may be burning sub-standard coal types that are overwhelming these systems evenwhen they are operated. In either case, the basic story is thatwhile market pressures seem to be driving substantial upgradingon the generation technology side, and regulatory pressures seemto be bringing about widespread installation of environmentalcleanup systems, neither of these forces appears to be drivingsound environmental practice at the plant level. Indeed, day-to-day environmental performance appears grim.
7. Conclusion
This study has attempted to add systematic data to anincreasingly public, vociferous, and global debate about China’s
energy future. Many people now understand that China’s energysector build-out has global ramifications for long-term environ-mental sustainability, geopolitics, worldwide resource availability,and global commodity pricing. Many constituencies around theworld are now voicing opinions about that build-out, and thoseopinions often inform policy decisions in a variety of countries.This is unquestionably the case in the United States as theAmerican government—and American society more broadly—
consider how, whether, and how aggressively to address globalwarming. Our aim in this study has been to inject real data intothis growing public debate. We have sought to test the emergentconventional wisdom about China against empirical findings fromthe field.
The data we have collected are by no means foolproof orcomplete. The findings presented in this paper represent the firststep in what we expect to be an ongoing, long-term program ofdata collection and analysis. Moreover, in this overview paper wehave been able to present only a fraction of our survey results,leaving out, for example, important findings about ownershipdiversification and investment sources in China’s energy sector.We also acknowledge that our tentative conclusions are based ona relatively small sample of power plants that also evinces ageographic bias towards coastal geographies such as Shandongprovince. At the same time, it must be emphasized thatsupposedly more comprehensive official analyses of the ‘‘entire’’sector are based on samples of a similar size. In this initial surveyeffort, we have effectively duplicated the scale and scope ofofficial data collection efforts. We intend in future iterations ofthis survey work to expand the size of the sample and correct forgeographic biases.
We have found, perhaps not surprisingly, that Chinese coal-fired power generation—the heart of the nation’s energysector—is far more complex than most observers understand,and more complex than we ourselves anticipated when embark-ing on this study. Several changes—almost revolutions in somecases—are occurring simultaneously. New energy infrastructure isbeing added at a torrid rate. Fuel allocation is shifting rapidlytoward a market footing, with prices responding accordingly, if

ARTICLE IN PRESS
E.S. Steinfeld et al. / Energy Policy 37 (2009) 1809–18241824
chaotically. Myriad new transactions are taking place betweencoal suppliers and consumers, often in the context of imperfectinformation and ambiguous product standards. Power plants, likemines, have increasingly come to be treated as commercialentities, autonomously pursuing and financing a range of long-term investment and day-to-day operational strategies. Mean-while, as the central state has increasingly removed itself fromdirect control over production—whether for mines or powerplants—it has become ever more focused on regulation, particu-larly in new areas like environmental management. As a result, allmanner of new rules have been put into play, even as the statescrambles to build the capacity needed to ensure that those rulesget enforced. Given the scope of change in the contemporaryenergy sector, regulators are scrambling simply to figure out whatis unfolding on the ground.
Meanwhile, Chinese policy makers, like many concernedoutsiders, are looking for points of leverage to achieve desiredchange. The MIT study, focusing on levers for influencing near-and long-term environmental practice, demonstrated the complexcombination of positive and negative outcomes produced byreform and marketization. On the environmental front, policiesdesigned to achieve change in one dimension frequently lead toundesired changes in others. Also worth remembering is thatChinese policy makers are seeking levers over a far broader arrayof issues, including energy security concerns, political concerns,national economic competitiveness concerns, economic growthand stability concerns. Most of these involve the energy sector,and many operate in contradictory directions. Energy securityconcerns, for example, push China toward greater use of coal, butconcerns—and doubts—about the magnitude and quality ofnational coal reserves push toward more efficient use of coal.Efficiency concerns motivate national efforts at technologicalupgrading, as well as efforts to marketize fuel supply. Yet, theprice hikes associated with marketization in some respectsdiscourage sustainable environmental practice at the plant level,thus countering another major concern of policy makers, clean airand a sound ecosystem. Environmental demands emerging fromacross society—demands that of course have political implica-tions—may encourage switching to alternative fuels such as gas,but those fuels must be imported from abroad, thus exacerbatingenergy security concerns. Meanwhile, Chinese policy makers seekto ensure and expand the flow of energy to a citizenry that byglobal standards—at least in per capita terms—consumes at verylow levels. China may conserve, but it is inconceivable that inoverall consumption terms it will solve its own—or the world’-s—energy problems by scaling back. The global economicrecession of late 2007, which is clearly casting its shadow overChina, may tamp down energy demand for a period of time.Nonetheless, particularly given China’s very low level of per capitaenergy use today, energy consumption in the nation, and byextension, Chinese coal-fired electric power generation willcontinue to expand substantially over the long run.
From this perspective, the issues explored in MIT’s ChinaEnergy Survey will become only more consequential over time.
Probably the largest issue, China’s future carbon emissions andhow to curb them, was not addressed directly in this study.Experience with the management of acid and particulate emis-sions can shed only partial light on the bigger, more costly, andtechnologically more complex problem of carbon dioxide emis-sions.
Taken as a whole, though, our study points to factors thatare as relevant for the control of carbon dioxide as for sulfur orother pollutants. It is critical that in any of these efforts, weeffectively distinguish between measures—whether market orregulatory—which address investment and physical infrastruc-ture from those which address operational issues. Stricturesenforcing technological standards—whether for energy produc-tion or environmental cleanup—are absolutely necessary, andit is to the Chinese government’s credit that much progresshas been achieved on this front. Yet such measures cannotsubstitute for the qualitatively different set of rules, economicincentives, and regulatory enforcement capabilities thatmust be brought to bear on the operations side. As our surveyresults demonstrate, progress on one side without comparableprogress on the other can lead to adverse environmentaloutcomes. This will likely prove as pertinent to future effortsagainst carbon emissions as it is today in the ongoing effortagainst sulfur.
References
Andrews-Speed, Philip, et al., 2002. A framework for policy formulation for small-scale mines: the case of coal in China. Natural Resources Forum 26.
Andrews-Speed, Philip, et al., 2003. The regulation of China’s townshipand village coal mines: a study of complexity. Journal of Cleaner Production11.
Andrews-Speed, Philip, et al., 2005. Economic responses to the closure of small-scale coal mines in Chongqing, China. Resources Policy 30 (1).
Berra, Nourredine., et al., 2001. Fostering Competition in China’s Power Markets.World Bank Discussion Paper No. 416, 2001.
China Daily, 2007. Power Becomes Supercritical. September 7.China Electricity Council, 2008. Guojia Fagaiwei Bu 2007 Nian Huodianchang Yanqi
Tuoliu Chanye Xinxi. 2008. /http://www.cec.org.cn/news/deptnews.asp?id=2871S.
China Industrial Map Publishing Committee, 2007. Zhongguo Nengyuan ChanyeDitu 2006–7. Social Sciences Academic Press, Beijing.
EIA, Existing Capacity by Energy Source, /http://www.eia.doe.gov/cneaf/electricity/epa/epat2p2.htmlS.
EIA, World Carbon Dioxide Emissions from the Consumption of Coal, 1980–2006,/http://www.eia.doe.gov/pub/international/iealf/tableh4co2.xlsS.
EIA, World Carbon Dioxide Emissions from the Consumption and Flaring ofFossil Fuels, 1980–2005, /http://www.eia.doe.gov/pub/international/iealf/tableh1co2.xlsS.
Freme, Fred, 2007. US Coal Supply and Demand: 2007 Review. EIA, Washington,DC. /http://tonto.eia.doe.gov/FTPROOT/features/feature07.pdfS.
Minchener, Andrew, 2007. Coal Supply Challenges for China. IEA, Washington, DC.MIT, 2007. Future of Coal. Cambridge, MA.NBS (National Bureau of Statistics), 2007. China Electric Power Yearbook. China
Electric Power Press, Beijing.Stern, David, 2005. Beyond the environmental Kuznets curve: diffusion of sulfur-
emissions-abating technology. The Journal of Environment & Development 14(1).
Xu, Shaofeng, Chen, Wenying, 2006. The reform of electricity power sector in thePRC. Energy Policy 23, 2455–2465.
Xu, Yuan et al., 2008. China’s rapid deployment of SO2 scrubbers, draft. USDepartment of Energy web site.

MIT CENTER FOR ENERGY AND ENVIRONMENTAL POLICY RESEARCH REPRINT SERIES
CEEPR Reprints are available free of charge (limited quantities.) Order online at [email protected]
204 Uncertainty in Environmental Economics, Robert Pindyck, Review of Environmental Economics and Policy, Vol. 1, No. 1, pp. 45-65, (2007)
205 Cooking Stoves, Indoor Air Pollution and Respiratory Health in Rural Orissa, Esther Dufl o, Michael Greenstone, Rema Hanna, Economic & Political Weekly, Vol. 43, No. 32, pp. 71-76, Special Issue, Aug 09 - 15, (2008)
206 The Diversity of Design of TSOs, Vincent Rious, Jean-Michel Glachant, Yannick Perez and Philippe Dessante, Energy Policy, Vol. 36, No. 9, pp. 3323– 3332, (2008)
207 Designing a U.S. Market for CO2, John Parsons, A. Denny Ellerman and Stephan Feilhauer, Journal of Applied Corporate Finance, Vol. 21, No. 1, pp. 79-86, (2009)
208 Infrastructure, Regulation, Investment and Security of Supply: A Case Study of the Restructured US Natural Gas Market, Christian von Hirschhausen, Utilities Policy, Vol. 16, No. 1, pp. 1-10, (2008)
209 A Review of the Monitoring of Market Power: The Possible Roles of Transmission System Operators in Monitoring for Market Power Issues in Congested Transmission Systems, Paul Twomey, Richard Green, Karsten Neuhoff and David Newbery, Journal of Energy Literature, Vol. 11, No. 2, pp. 3-54, (2005)
210 Does Hazardous Waste Matter? Evidence from the Housing Market and the Superfund Program, Michael Greenstone and Justin Gallagher, The Quarterly Journal of Economics, Vol. 123, No. 3, pp. 951-1003, (2008)
211 New Entrant and Closure Provisions: How do they Distort?, A. Denny Ellerman, The Energy Journal, Vol. 29, Special Edition, pp. 63-76, (2008)
212 Reserve Prices and Mineral Resource Theory, M.A. Adelman and G.C. Watkins, The Energy Journal, Vol. 29, Special Edition, pp. 1-16, (2008)
213 Energy Prices and the Adoption of Energy-Saving Technology, Joshua Linn, The Economic Journal, Vol. 118, No. 533, pp. 1986-2012, (2008)
214 World Oil: Market or Mayhem?, James L. Smith, Journal of Economic Perspectives, Vol. 23, No. 3, pp. 145–164, (2009)
215 Greener Plants, Grayer Skies? A Report from the Front Lines of China’s Energy Sector, E.S. Steinfeld, R.K. Lester andE.A. Cunningham, Energy Policy,Vol. 37, No. 5, pp. 1809–1824, (2009)

Massachusetts Institute of Technology
Center for Energy and Environmental Policy Research
400 Main Street (E19-411)
Cambridge, M
assachusetts 02142