Embed Size (px)
Citation preview

Greene County Public Schools Algebra I Pacing and Curriculum Guide
Course Outline Quarter 1 Quarter 2 Quarter 3 Quarter 4 A.1 Expressions A.7 Relations and Functions A.4e/A.5d Systems A.2c Factoring (cont.) A.4abdf Solving Equations A.6 Linear Equations A.2a Rules of Exponents A.4c Quadratics A.5 Solving Inequalities A.11 Line of Best Fit A.2b Polynomials A.11 Curve of Best Fit A.9 Standard Deviation A.8 Variation A.2c Factoring A.3 Radicals
A.10 BoxandWhisker Plots SOL Review
Big Ideas 1. Expressions 2. Equations &
Inequalities 3. Relations and Functions 4. Linear Equations 5. Systems
6. Polynomials 7. Factoring 8. Quadratics 9. Data Analysis 10. Radicals
1

Resources Text: Algebra I: Applications, Equations, Graphs , 2004, McDougal Littell
Virginia Department of Education Mathematics SOL Resources
http://www.doe.virginia.gov/testing/sol/standards_docs/mathematics/index.shtml DOE Enhanced Scope and Sequence Lesson Plans
http://www.doe.virginia.gov/testing/sol/scope_sequence/mathematics_2009/index.php HCPS Algebra I Online Module Homepage
http://teachers.henrico.k12.va.us/math/HCPSAlgebra1/modules.html VDOE Vertical Alignment Charts GCPS Math Instructional Strategies Guide GCPS SPBQ Review Document w/Strategies
Common Assessments Pre/Post Test
IA Benchmark Tests
Unit Tests/Quizzes
2

Common Unit Plans Algebra 1 Professional Learning Community – meets once a week to create common lesson plans
3
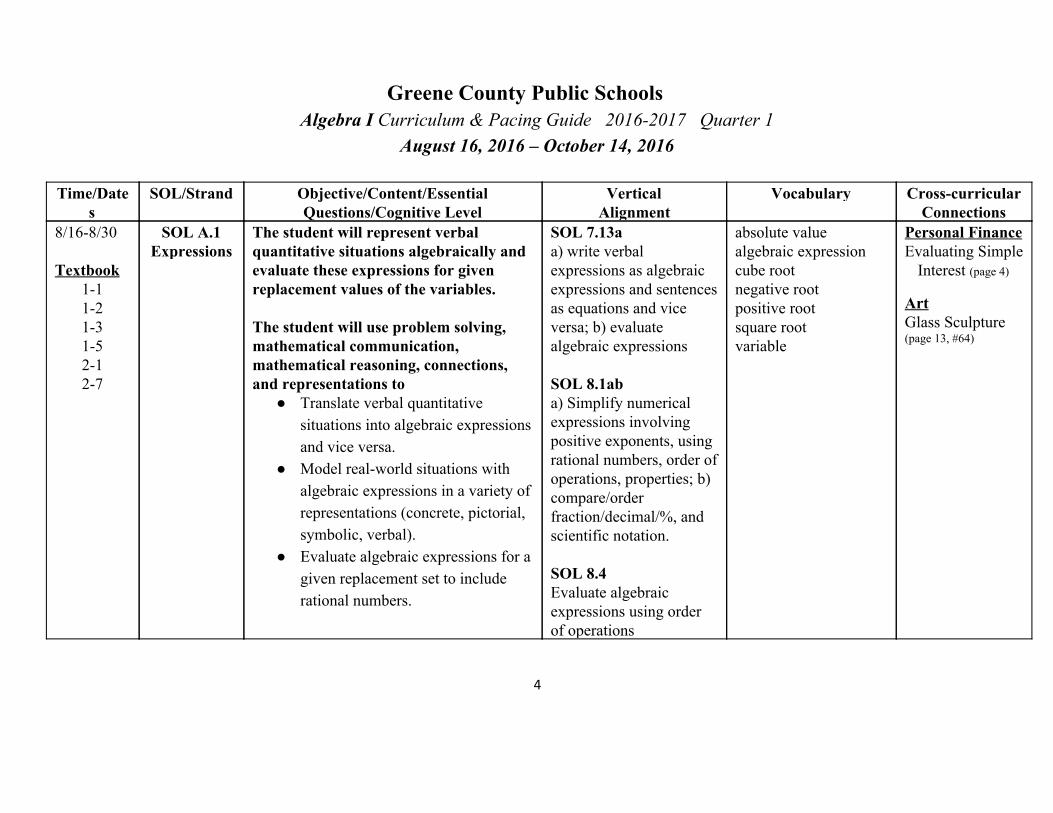
Greene County Public Schools Algebra I Curriculum & Pacing Guide 20162017 Quarter 1
August 16, 2016 – October 14, 2016
Time/Dates
SOL/Strand Objective/Content/Essential Questions/Cognitive Level
Vertical Alignment
Vocabulary Crosscurricular Connections
8/168/30 Textbook
11 12 13 15 21 27
SOL A.1 Expressions
The student will represent verbal quantitative situations algebraically and evaluate these expressions for given replacement values of the variables. The student will use problem solving, mathematical communication, mathematical reasoning, connections, and representations to
Translate verbal quantitative situations into algebraic expressions and vice versa.
Model realworld situations with algebraic expressions in a variety of representations (concrete, pictorial, symbolic, verbal).
Evaluate algebraic expressions for a given replacement set to include rational numbers.
SOL 7.13a a) write verbal expressions as algebraic expressions and sentences as equations and vice versa; b) evaluate algebraic expressions SOL 8.1ab a) Simplify numerical expressions involving positive exponents, using rational numbers, order of operations, properties; b) compare/order fraction/decimal/%, and scientific notation. SOL 8.4 Evaluate algebraic expressions using order of operations
absolute value algebraic expression cube root negative root positive root square root variable
Personal Finance Evaluating Simple Interest (page 4)
Art Glass Sculpture (page 13, #64)
4

Evaluate expressions that contain absolute value, square roots, and cube roots.
Blooms = Evaluate
5
8/319/28
Textbook 22 25 26 31 32 33 34 35 37 47
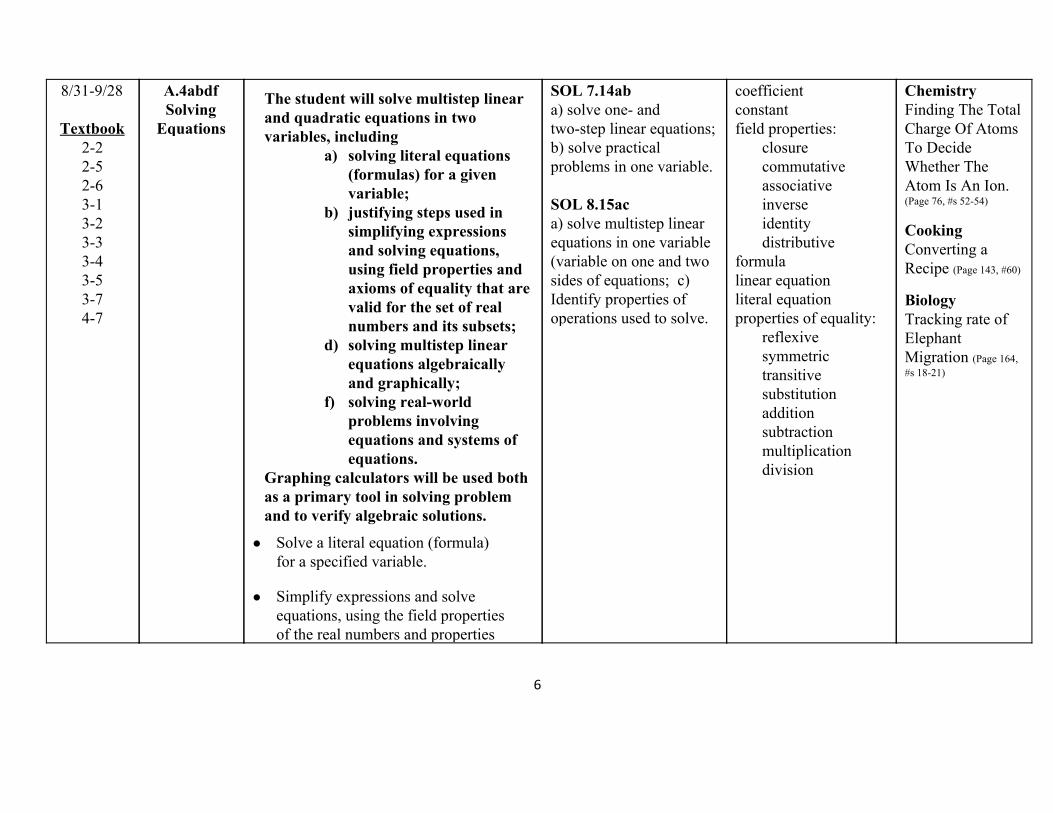
A.4abdf Solving Equations
The student will solve multistep linear and quadratic equations in two variables, including
a) solving literal equations (formulas) for a given variable;
b) justifying steps used in simplifying expressions and solving equations, using field properties and axioms of equality that are valid for the set of real numbers and its subsets;
d) solving multistep linear equations algebraically and graphically;
f) solving realworld problems involving equations and systems of equations.
Graphing calculators will be used both as a primary tool in solving problem and to verify algebraic solutions.
Solve a literal equation (formula) for a specified variable.
Simplify expressions and solve equations, using the field properties of the real numbers and properties
SOL 7.14ab a) solve one and twostep linear equations; b) solve practical problems in one variable. SOL 8.15ac a) solve multistep linear equations in one variable (variable on one and two sides of equations; c) Identify properties of operations used to solve.
coefficient constant field properties:
closure commutative associative inverse identity distributive
formula linear equation literal equation properties of equality:
reflexive symmetric transitive substitution addition subtraction multiplication division
Chemistry Finding The Total Charge Of Atoms To Decide Whether The Atom Is An Ion. (Page 76, #s 5254)
Cooking Converting a Recipe (Page 143, #60)
Biology Tracking rate of Elephant Migration (Page 164, #s 1821)
6

of equality to justify simplification and solution.
Solve multistep linear equations in one variable.
Confirm algebraic solutions to linear and quadratic equations, using a graphing calculator.
Determine if a linear equation in one variable has one, an infinite number, or no solutions. †
Blooms = Evaluate
7

9/2910/4
Textbook 6.1 6.2
SOL A.5abc Solving
Inequalities
The student will solve multistep linear inequalities in two variables, including
a) solving multistep linear inequalities algebraically and graphically;
b) justifying steps used in solving inequalities, using axioms of inequality and properties of order that are valid for the set of real numbers and its subsets;
c) solving realworld problems involving inequalities; and
The student will use problem solving, mathematical communication, mathematical reasoning, connections, and representations to
Solve multistep linear inequalities in
one variable.
Justify steps used in solving inequalities, using axioms of inequality and properties of order that are valid for the set of real numbers.
SOL 7.15ab a) solve onestep inequalities; b) graph solutions on number line SOL 8.15bc b) solve twostep linear inequalities and graph results on number line; c) identify properties of operations used to solve
inequality properties of inequality:
reflexive symmetric transitive substitution addition subtraction multiplication division
set builder notation
Film and Computer Animation Calculations involving # of Frames, # of artists and # of hours needed to work. (Page 344, #4042)
8

Solve realworld problems involving inequalities.
Blooms = Evaluate
9

10/510/14 SOL A.9 Statistics
The student, given a set of data, will interpret variation in realworld contexts and calculate and interpret mean absolute deviation, standard deviation, and zscores.
The student will use problem solving, mathematical communication, mathematical reasoning, connections, and representations to
Given data, including data in a
realworld context, calculate and interpret the mean absolute deviation of a data set.
Given data, including data in a realworld context, calculate variance and standard deviation of a data set and interpret the standard deviation.
Given data, including data in a realworld context, calculate and interpret zscores for a data set.
Explain ways in which standard deviation addresses dispersion by examining the formula for standard deviation.
SOL 5.16abcd a) describe mean/median/mode; b) describe mean as fair share; c) find the mean/median/mode/range; d) describe range as measure of variation. SOL 6.15ab a) describe mean as balance point; b) decide which measure of center is appropriate
dispersion mean mean absolute deviation standard deviation summation notation variance zscores
Biology Bell Curve to represent heights of gorillas in East Central Africa.
10

Compare and contrast mean absolute deviation and standard deviation in a realworld context.
Blooms = Evaluate
Greene County Public Schools Algebra I Curriculum & Pacing Guide 20162017 Quarter 2
October 17, 2016 – December 20, 2016
Time/Dates
SOL/Strand Objective/Content/Essential Questions/Cognitive Level
Vertical Alignment
Vocabulary Crosscurricular Connections
10/1710/24 Textbook
17 43 48
SOL A.7 Relations
and Functions
The student will investigate and analyze function (linear and quadratic) families and their characteristics both algebraically and graphically, including
a) determining whether a relation is a function;
b) domain and range; c) zeros of a function; d) x and y intercepts; e) finding the values of a
function for elements in its domain; and
f) making connections between and among
SOL 8.17 Identify domain, range, independent and dependent variables.
abscissa dependent variable domain family function function function notation independent variable input ordinate output range relation vertical line test xintercept y intercept
Biology Linear Function to represent butterfly migration. (Page 258, Example 4).
11

multiple representations of functions including concrete, verbal, numeric, graphic, and algebraic.
The student will use problem solving, mathematical communication, mathematical reasoning, connections, and representations to
Determine whether a relation,
represented by a set of ordered pairs, a table, or a graph is a function.
Identify the domain, range, zeros, and intercepts of a function presented algebraically or graphically.
For each x in the domain of f , find f ( x ).
Represent relations and functions using concrete, verbal, numeric, graphic, and algebraic forms. Given one representation, students will be able to represent the relation in another form.
zeros of a function
12

Detect patterns in data and represent arithmetic and geometric patterns algebraically.
Blooms = Analyze
13

10/2511/22 (Lin Eqs)
11/2811/29 (Line of Best Fit)
11/3012/5 (Lin Ineqs)
Textbook
4.4 4.6 5.1 5.2 5.5 5.6 6.5
SOL A.6 Linear
Equations
SOL A.11 Line of Best Fit
A.6 The student will graph linear equations and linear inequalities in two variables, including a) determining the slope of a
line when given an equation of the line, the graph of the line, or two points on the line. Slope will be described as rate of change and will be positive, negative, zero, or undefined; and
b) writing the equation of a line when given the graph of the line, two points on the line, or the slope and a point on the line.
The student will use problem solving, mathematical communication, mathematical reasoning, connections, and representations to
Graph linear equations and
inequalities in two variables, including those that arise from a variety of realworld situations.
SOL 7.15ab a) solve onestep inequalities; b) graph solutions on number line. SOL 8.15bc b) solve twostep linear inequalities and graph results on a number line; c) identify properties of operations used to solve.
horizontal line form HOY VUX linear inequality parallel pointslope form rate of change rise run slope slopeintercept form solution of a linear equality standard form vertical line form x intercept y intercept
Earth Science Snowfall Calculation modeled by linear equation. (Page 245, #s 5659) Geography Linear functions can approximate population change. (Page 274, Example 3; Page 283, #s 42 & 43)
Personal Finance Linear functions can model rental car cost comparisons. (Page 284, #51)
14

Use the parent function y = x and describe transformations defined by changes in the slope or y intercept.
Find the slope of the line, given the equation of a linear function.
Find the slope of a line, given the coordinates of two points on the line.
Find the slope of a line, given the graph of a line.
Recognize and describe a line with a slope that is positive, negative, zero, or undefined.
Use transformational graphing to investigate effects of changes in equation parameters on the graph of the equation.
Write an equation of a line when given the graph of a line.
Write an equation of a line when given two points on the line whose coordinates are integers.
15

Write an equation of a line when given the slope and a point on the line whose coordinates are integers.
Write an equation of a vertical line as x = a.
Write the equation of a horizontal line as y = c .
Blooms = Analyze
A.11 The student will collect and analyze data, determine the equation of the line of best fit in order to make predictions, and solve realworld problems, using mathematical models. Mathematical models will include linear functions.
The student will use problem solving, mathematical communication, mathematical reasoning, connections, and representations to
Write an equation for a curve of best
fit, given a set of no more than twenty data points in a table, a graph, or realworld situation.
16

Make predictions about unknown outcomes, using the equation of the curve of best fit.
Design experiments and collect data to address specific, realworld questions.
Evaluate the reasonableness of a mathematical model of a realworld situation.
Blooms = Create
17
12/612/20
Textbook 4.5 11.3
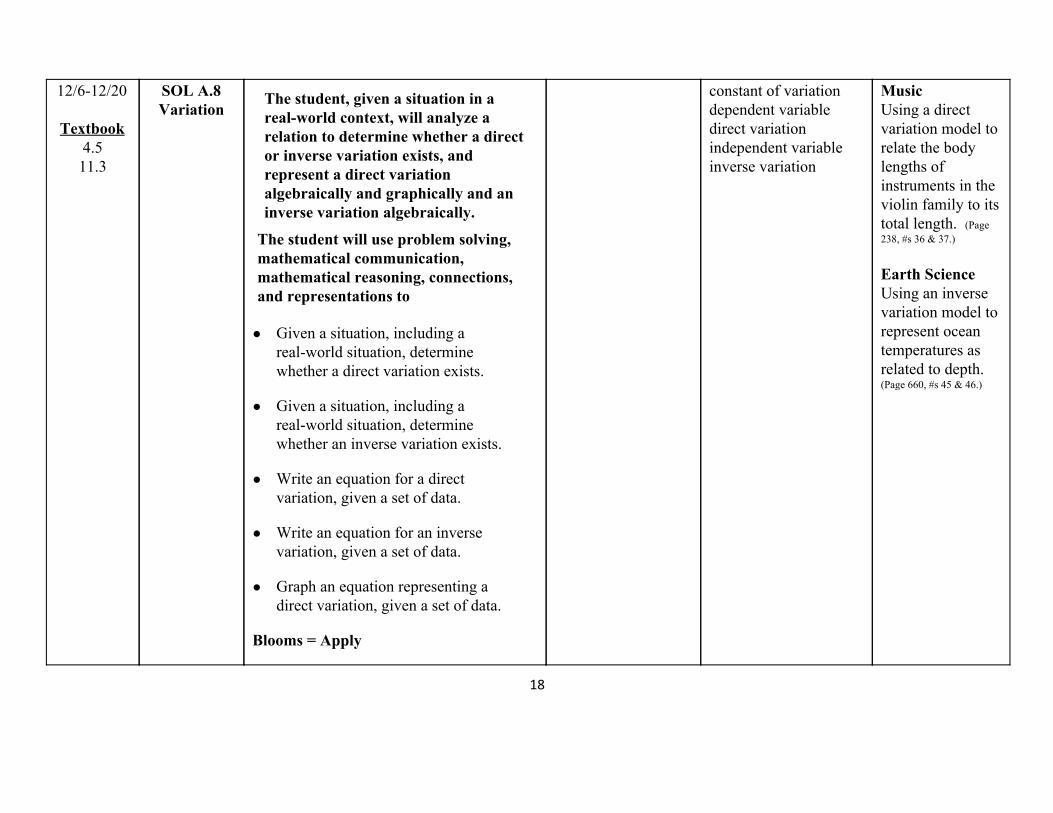
SOL A.8 Variation
The student, given a situation in a realworld context, will analyze a relation to determine whether a direct or inverse variation exists, and represent a direct variation algebraically and graphically and an inverse variation algebraically.
The student will use problem solving, mathematical communication, mathematical reasoning, connections, and representations to
Given a situation, including a
realworld situation, determine whether a direct variation exists.
Given a situation, including a realworld situation, determine whether an inverse variation exists.
Write an equation for a direct variation, given a set of data.
Write an equation for an inverse variation, given a set of data.
Graph an equation representing a direct variation, given a set of data.
Blooms = Apply
constant of variation dependent variable direct variation independent variable inverse variation
Music Using a direct variation model to relate the body lengths of instruments in the violin family to its total length. (Page 238, #s 36 & 37.)
Earth Science Using an inverse variation model to represent ocean temperatures as related to depth. (Page 660, #s 45 & 46.)
18

19
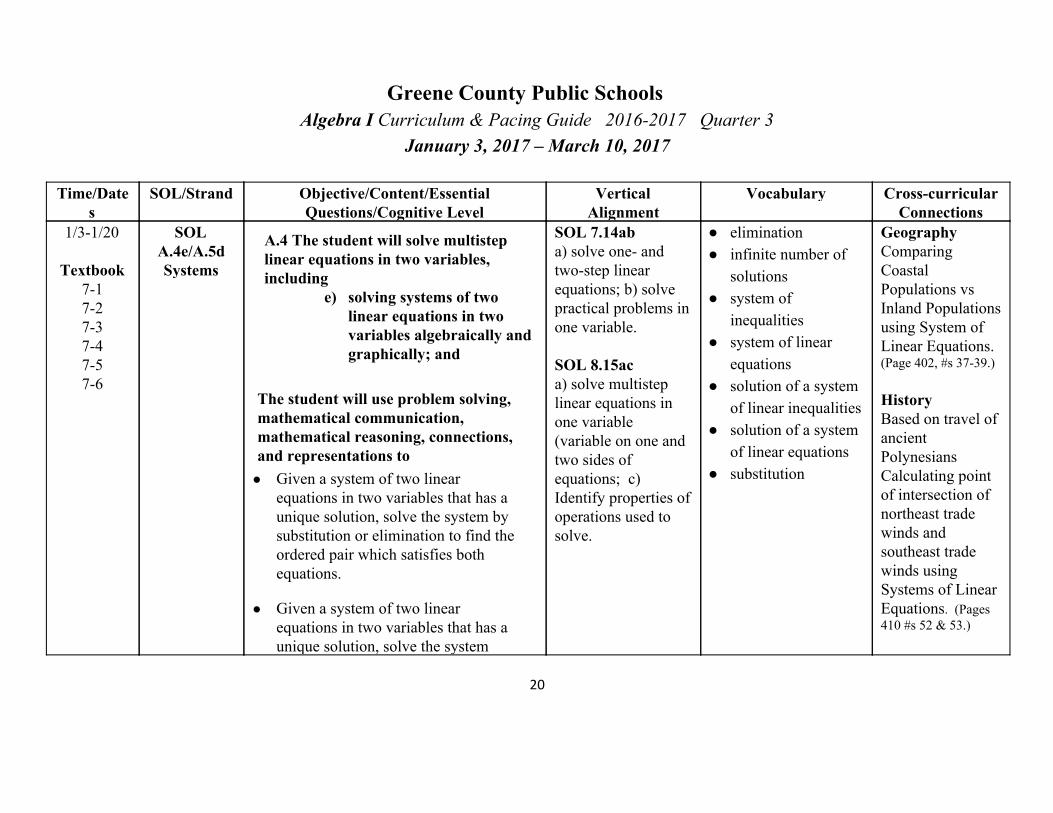
Greene County Public Schools Algebra I Curriculum & Pacing Guide 20162017 Quarter 3
January 3, 2017 – March 10, 2017
Time/Dates
SOL/Strand Objective/Content/Essential Questions/Cognitive Level
Vertical Alignment
Vocabulary Crosscurricular Connections
1/31/20
Textbook 71 72 73 74 75 76
SOL A.4e/A.5d Systems
A.4 The student will solve multistep linear equations in two variables, including
e) solving systems of two linear equations in two variables algebraically and graphically; and
The student will use problem solving, mathematical communication, mathematical reasoning, connections, and representations to Given a system of two linear
equations in two variables that has a unique solution, solve the system by substitution or elimination to find the ordered pair which satisfies both equations.
Given a system of two linear equations in two variables that has a unique solution, solve the system
SOL 7.14ab a) solve one and twostep linear equations; b) solve practical problems in one variable. SOL 8.15ac a) solve multistep linear equations in one variable (variable on one and two sides of equations; c) Identify properties of operations used to solve.
elimination infinite number of
solutions system of
inequalities system of linear
equations solution of a system
of linear inequalities solution of a system
of linear equations substitution
Geography Comparing Coastal Populations vs Inland Populations using System of Linear Equations. (Page 402, #s 3739.) History Based on travel of ancient Polynesians Calculating point of intersection of northeast trade winds and southeast trade winds using Systems of Linear Equations . (Pages 410 #s 52 & 53.)
20

graphically by identifying the point of intersection.
Determine whether a system of two linear equations has one solution, no solution, or infinite solutions.
Write a system of two linear equations that models a realworld situation.
Interpret and determine the reasonableness of the algebraic or graphical solution of a system of two linear equations that models a realworld situation.
A.5 The student will solve multistep linear inequalities in two variables, including
d) solving systems of inequalities.
The student will use problem solving, mathematical communication, mathematical reasoning, connections, and representations to Solve systems of linear inequalities
algebraically and graphically.
Blooms = Apply
History The first known system of linear equations appeared in a Chinese book about 2000 years ago. (Page 417, bottom of page.) Science Absolute Zero (Page 423, #s 5760) Culinary Arts Writing a system of linear inequalities showing the various numbers of roast beef and teriyaki chicken meals you could make. (Page 436, #s 34 and 35.)
21

22

1/232/3 Textbook
81 82 83 84
A.2a Rules of Exponents
The student will perform operations on polynomials, including
a) applying the laws of exponents to perform operations on expressions;
The student will use problem solving, mathematical communication, mathematical reasoning, connections, and representations to
Simplify monomial expressions and
ratios of monomial expressions in which the exponents are integers, using the laws of exponents.
Blooms = Apply
SOL 7.16abcde Apply properties with real numbers: a) commutative and associative properties for addition/mult; b) distributive property; c) add/mult identity properties; d) add/mult inverse properties; e) mult property of zero. SOL 8.15c c) Identify properties of operations used to solve equations.
exponential function monomial scientific notation
Building Trades Windmills: Using science, engineering, and math to solve technical problems in the development, construction, inspection, and maintenance of industrial machinery . (Page 454, #s 7779)
23
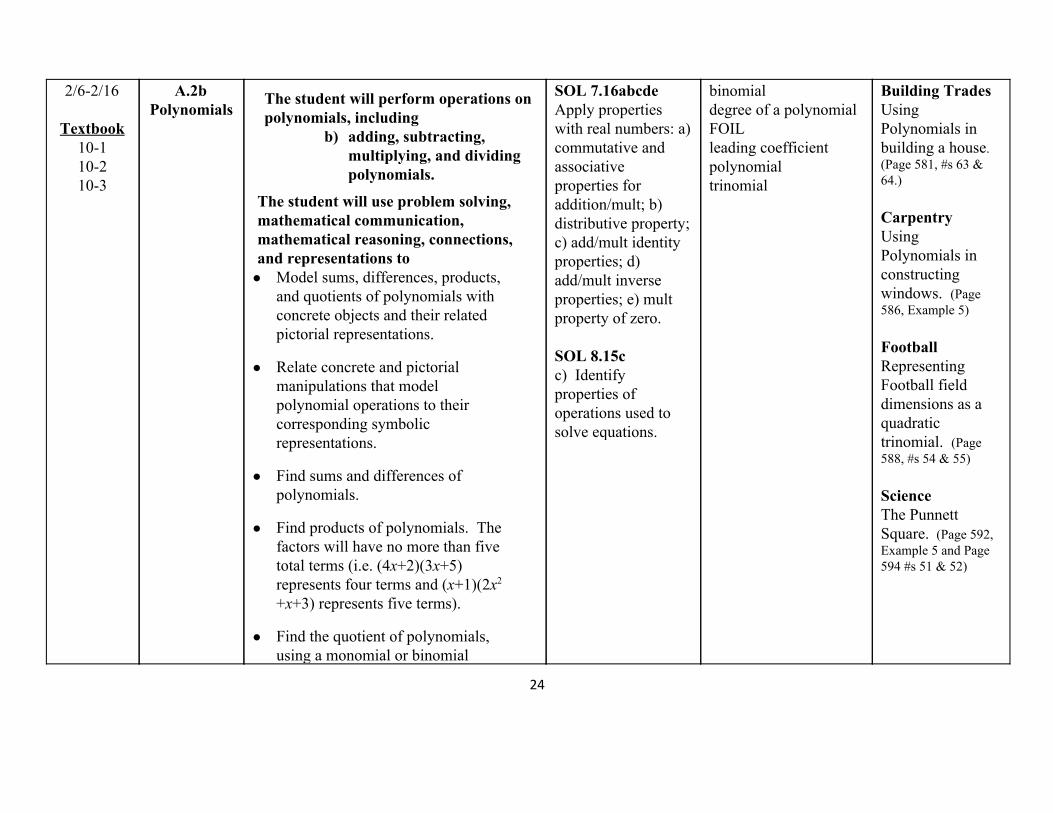
2/62/16 Textbook 101 102 103
A.2b Polynomials
The student will perform operations on polynomials, including
b) adding, subtracting, multiplying, and dividing polynomials.
The student will use problem solving, mathematical communication, mathematical reasoning, connections, and representations to Model sums, differences, products,
and quotients of polynomials with concrete objects and their related pictorial representations.
Relate concrete and pictorial manipulations that model polynomial operations to their corresponding symbolic representations.
Find sums and differences of polynomials.
Find products of polynomials. The factors will have no more than five total terms (i.e. (4 x +2)(3x +5) represents four terms and ( x +1)(2x 2
+x +3) represents five terms).
Find the quotient of polynomials, using a monomial or binomial
SOL 7.16abcde Apply properties with real numbers: a) commutative and associative properties for addition/mult; b) distributive property; c) add/mult identity properties; d) add/mult inverse properties; e) mult property of zero. SOL 8.15c c) Identify properties of operations used to solve equations.
binomial degree of a polynomial FOIL leading coefficient polynomial trinomial
Building Trades Using Polynomials in building a house. (Page 581, #s 63 & 64.) Carpentry Using Polynomials in constructing windows. (Page 586, Example 5) Football Representing Football field dimensions as a quadratic trinomial. (Page 588, #s 54 & 55) Science The Punnett Square. (Page 592, Example 5 and Page 594 #s 51 & 52)
24

divisor, or a completely factored divisor.
Blooms = Apply
25

2/223/10 Textbook 105 106 107 108
SOL A.2c Factoring
The student will perform operations on polynomials, including
c) factoring completely first and seconddegree binomials and trinomials in one or two variables. Graphing calculators will be used as a tool for factoring and for confirming algebraic factorizations.
The student will use problem solving, mathematical communication, mathematical reasoning, connections, and representations to Factor completely first and
seconddegree polynomials with integral coefficients.
Identify prime polynomials.
Use the x intercepts from the graphical representation of the polynomial to determine and confirm its factors.
Blooms = Apply
SOL 7.16abcde Apply properties with real numbers: a) commutative and associative properties for addition/mult; b) distributive property; c) add/mult identity properties; d) add/mult inverse properties; e) mult property of zero. SOL 8.15c c) Identify properties of operations used to solve equations.
binomial factor monomial polynomial prime polynomial trinomial x intercept
Landscape Design Quadratic Model of Rectangular Garden (Page 606, Example 7) World Geography Quadratic Model of Taj Mahal. (Page 608, #s 63 & 64) Personal Finance Saving Money for Trip to Europe. (Page 616, #s 77 & 48.) Earth Science Gravity varies depending on the mass of a planet. (Page 630, #s 51 54.)
26

Greene County Public Schools Algebra I Curriculum & Pacing Guide 20142015 Quarter 4
March 13, 2017 – May 26, 2017
Time/Dates
SOL/Strand Objective/Content/Essential Questions/Cognitive Level
Vertical Alignment
Vocabulary Crosscurricular Connections
Continue as needed
Textbook 105 106 107 108
SOL A.2c Factoring (continued)
The student will perform operations on polynomials, including c) factoring completely first and
seconddegree binomials and trinomials in one or two variables. Graphing calculators will be used as a tool for factoring and for confirming algebraic factorizations.
The student will use problem solving, mathematical communication, mathematical reasoning, connections, and representations to
Factor completely first and
seconddegree polynomials with integral coefficients.
Identify prime polynomials.
Use the x intercepts from the graphical representation of the
27

polynomial to determine and confirm its factors.
Blooms = Apply
28
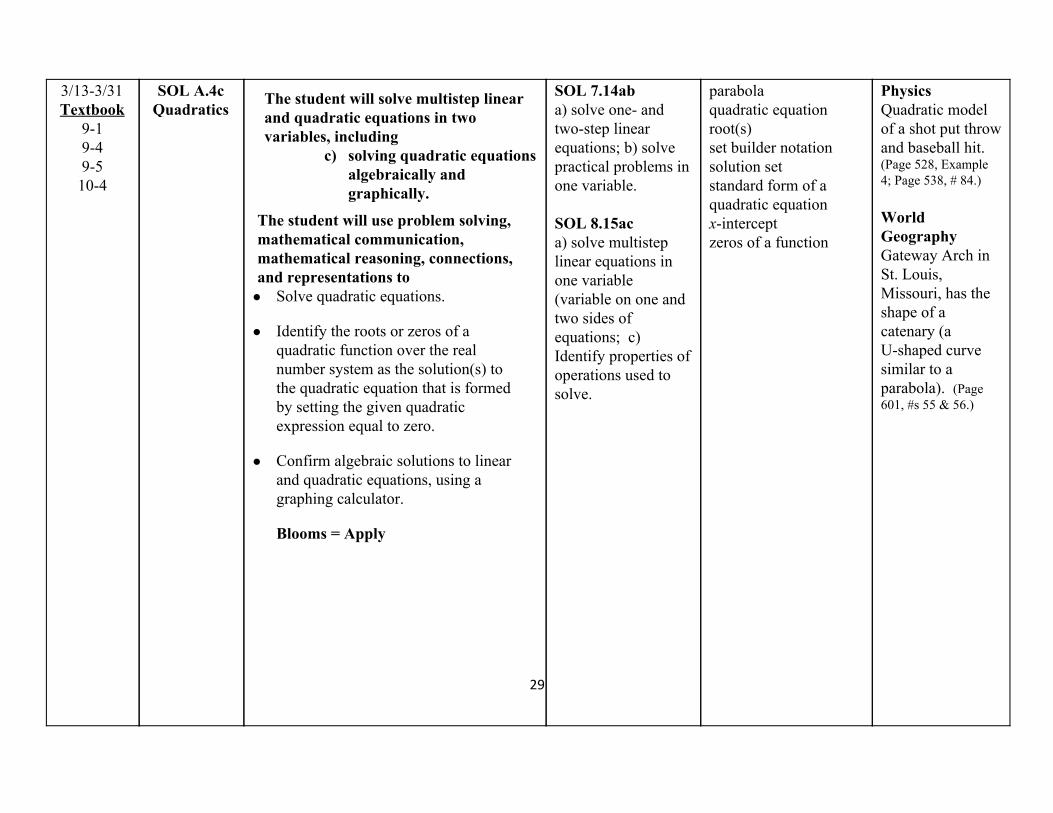
3/133/31 Textbook
91 94 95 104
SOL A.4c Quadratics
The student will solve multistep linear and quadratic equations in two variables, including
c) solving quadratic equations algebraically and graphically.
The student will use problem solving, mathematical communication, mathematical reasoning, connections, and representations to Solve quadratic equations.
Identify the roots or zeros of a quadratic function over the real number system as the solution(s) to the quadratic equation that is formed by setting the given quadratic expression equal to zero.
Confirm algebraic solutions to linear and quadratic equations, using a graphing calculator.
Blooms = Apply
SOL 7.14ab a) solve one and twostep linear equations; b) solve practical problems in one variable. SOL 8.15ac a) solve multistep linear equations in one variable (variable on one and two sides of equations; c) Identify properties of operations used to solve.
parabola quadratic equation root(s) set builder notation solution set standard form of a quadratic equation x intercept zeros of a function
Physics Quadratic model of a shot put throw and baseball hit. (Page 528, Example 4; Page 538, # 84.) World Geography Gateway Arch in St. Louis, Missouri, has the shape of a catenary (a Ushaped curve similar to a parabola). (Page 601, #s 55 & 56.)
29

4/104/14
Texbook 54 93
Technology 98
SOL A.11 Curve of Best Fit
The student will collect and analyze data, determine the equation of the curve of best fit in order to make predictions, and solve realworld problems, using mathematical models. Mathematical models will include linear and quadratic functions.
The student will use problem solving, mathematical communication, mathematical reasoning, connections, and representations to
Write an equation for a curve of best
fit, given a set of no more than twenty data points in a table, a graph, or realworld situation.
Make predictions about unknown outcomes, using the equation of the curve of best fit.
Design experiments and collect data to address specific, realworld questions.
Evaluate the reasonableness of a mathematical model of a realworld situation.
curve of best fit line of best fit negative correlation no correlation positive correlation scatter plot
Biology line of best fit age/size of pupils (p, 297 # 2527) Physics Mass vs distance in spring stretches. (Page 558, #20.)
30

Blooms = Create
31
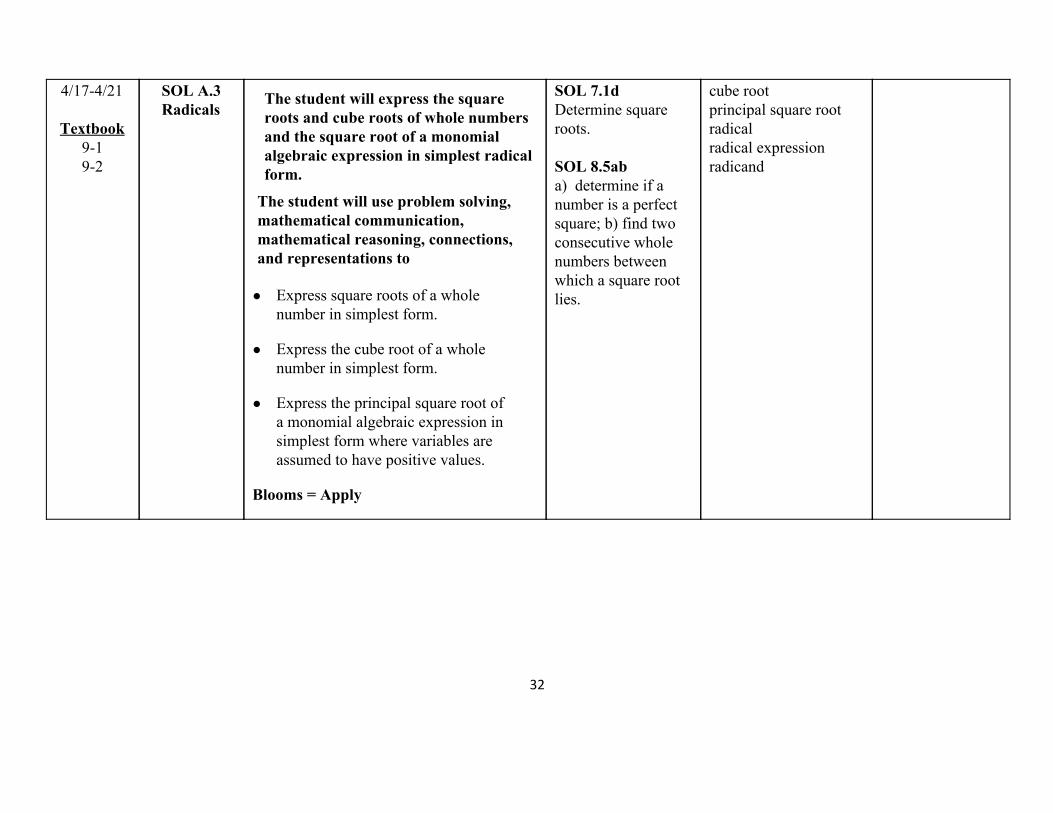
4/174/21
Textbook 91 92
SOL A.3 Radicals
The student will express the square roots and cube roots of whole numbers and the square root of a monomial algebraic expression in simplest radical form.
The student will use problem solving, mathematical communication, mathematical reasoning, connections, and representations to
Express square roots of a whole
number in simplest form.
Express the cube root of a whole number in simplest form.
Express the principal square root of a monomial algebraic expression in simplest form where variables are assumed to have positive values.
Blooms = Apply
SOL 7.1d Determine square roots. SOL 8.5ab a) determine if a number is a perfect square; b) find two consecutive whole numbers between which a square root lies.
cube root principal square root radical radical expression radicand
32
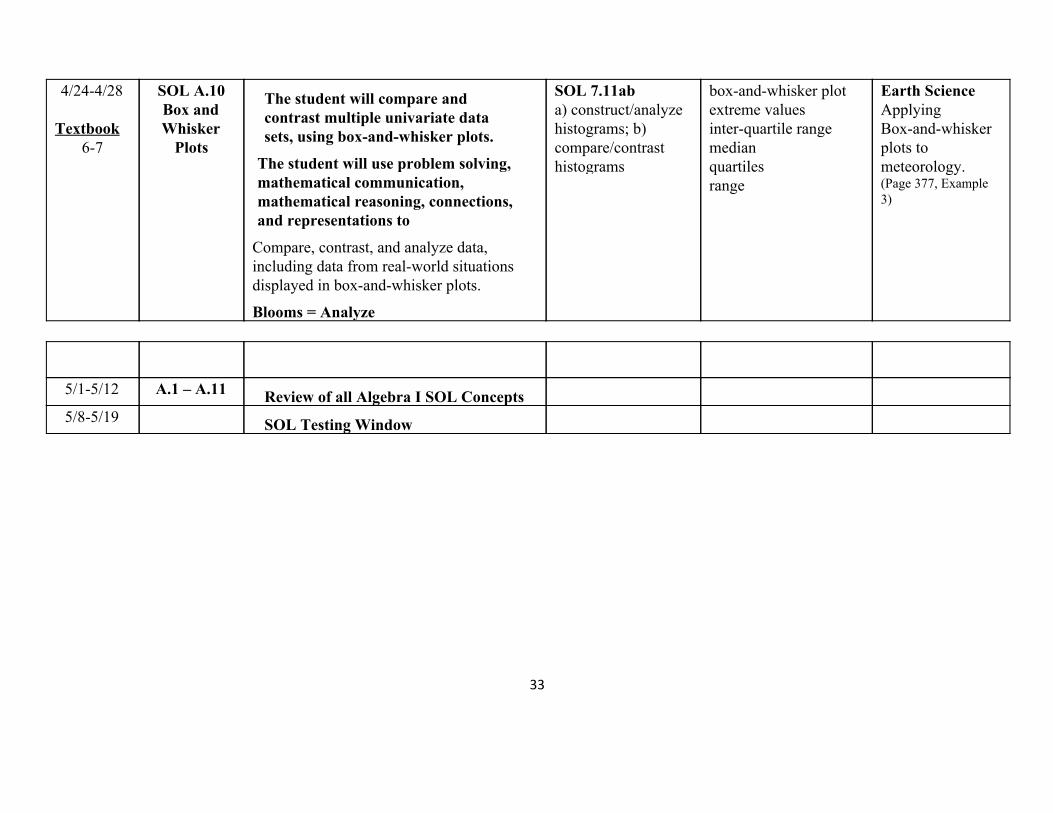
4/244/28
Textbook 67
SOL A.10 Box and Whisker Plots
The student will compare and contrast multiple univariate data sets, using boxandwhisker plots.
The student will use problem solving, mathematical communication, mathematical reasoning, connections, and representations to
Compare, contrast, and analyze data, including data from realworld situations displayed in boxandwhisker plots.
Blooms = Analyze
SOL 7.11ab a) construct/analyze histograms; b) compare/contrast histograms
boxandwhisker plot extreme values interquartile range median quartiles range
Earth Science Applying Boxandwhisker plots to meteorology. (Page 377, Example 3)
5/15/12 A.1 – A.11 Review of all Algebra I SOL Concepts
5/85/19 SOL Testing Window
33