Embed Size (px)
Citation preview
GREENBUG RESISTANCE LEVELS IN COMMERCIAL GRAIN SORGHUM HYBRIDS
IN THE SEEDLING STAGE
by
JAC FORBY MORGAN
B. S. , Kansas State University, 1975
A MASTER'S THESIS
submitted in partial fulfillment of the
requirements for the degree
MASTER OF SCIENCE
Department of Entomology
KANSAS STATE UNIVERSITYManhattan, Kansas
1978
Approved by:
Major Professor

Dotunni*\T~
2(,or
mrMotex
LIST OF TABLES
ii
TABLE OF CONTENTS
Page
i 1
1
LIST OF FIGURES v
ACKNOWLEDGMENTS vi
I NTRODUCT I ON]
MATER IALS AND METHODS 2
Tests for Nonpreference
Tolerance Test 1*
Tolerance Test 2
Tol erance Test 3
Tolerance Test k
Test for Rate of Devel opment
Field Test for Ant ibiosis/Nonpreference
RESULTS AND DISCUSSION 8
Tests for Nonpreference
Test for Rate of Development 9
Tolerance Test 1
Day two
Day four • '°
Day six '
Day eight '0
Tolerance Test 2 • • • ' 2
Tolerance Test 3 •13
Tolerance Test *f '3
Field Study]l+
SUMMARY lZf
REFERENCES CITED ] 5

Hi
LIST OF TABLES
Table Page
1. Results and Chi-square analysis of the first non-
preference test comparing E-59, E-59+ and E-59++ 17
2. Results and Chi-square analysis of second nonpreference
test comparing E-59, E-59+ and E-59++ 18
3. Results and analysis of the third nonpreference test 19
2k. Summary of analysis of variance, leaf area (cm ) of E-59,
E-59+ and E-59++, day 2, tolerance test 1 20
5. Summary of analysis of variance for functional plant loss
index (FPL I) greenbug number (GBN) ,greenbug/adul t/day (GBAD),
and dry weight/greenbug (GBDW) from tolerance test 1 21
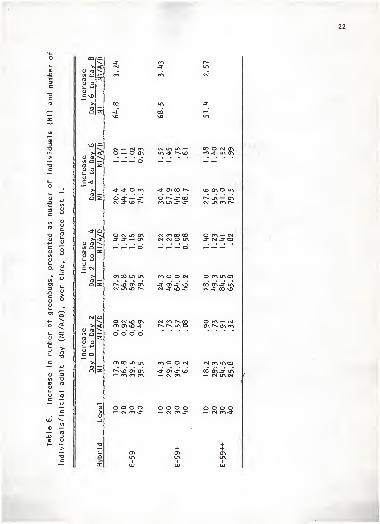
6. Increase in number of greenbugs, presented as number of
individuals (Nl) and number of individuals/initial adult
(Nl/A/D), over time, tolerance test 1 22
7. A comparison of the number of samples counted (N) andthe possible number (PN) that could have been counted
had the greenbug remained on the plants, tolerance test 1 23
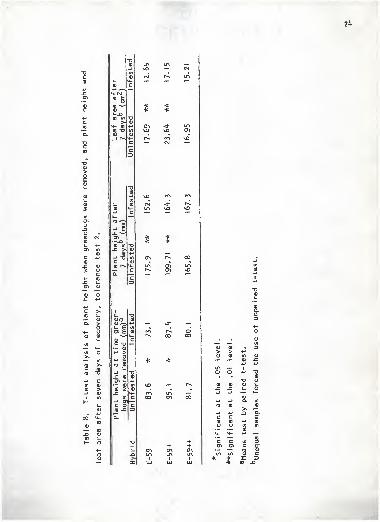
8. T-test analysis of plant height when greenbugs were removed,
and plant height and leaf area after seven days of recovery,
tolerance test 2 2k
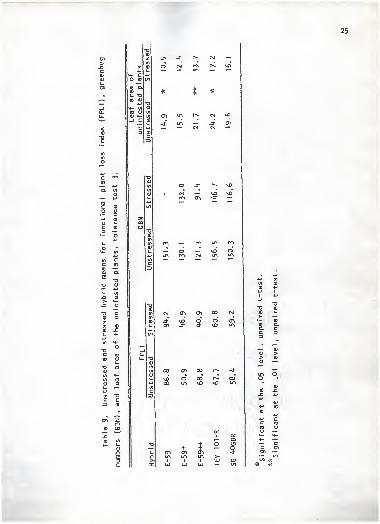
9. Unstressed and stressed hybrid means for functional plant
loss index (FPLI), greenbug numbers (GBN), and leaf areaof the uninvested plants, tolerance test 3 25
10. Analysis of variance and means for functional plant loss
index (FPLI) and greenbug numbers (GBN), from plants in
unstressed containers, tolerance test 3 26
11. Analysis of variance and means for functional plant loss
index (FPLI) of hybrids stressed by carbowax treatment(E-59, E-59++, TEY-101-R), tolerance test 3 27
12. Analysis of variance and means of functional plant loss
index (FPLI) and greenbug numbers (GBN), tolerancetest k 28

IV
Table Pa9e
13. Number of plants of each hybrid, of a possible 8 plants,
displaying secondary root development under infested
(6 greenbugs/plant on E-59, 12 greenbugs/plant on the
other four hybrids) and noninfested conditions,
tol erance test k 29
]k. Analysis of variance and means of field greenbug
counts made July 14 and July 22, 1977, Manhattan 30

LIST OF FIGURES
Figure Pa 9e
1. Relationship of average damage rating and % leaf
area loss to functional plant loss index (FPL I).
Tolerance test 1 32
2. Functional plant loss index (FPLI) hybrid means,
averaged over levels, for E-59, E-59+, and E-59++.
Tolerance test 1 3^
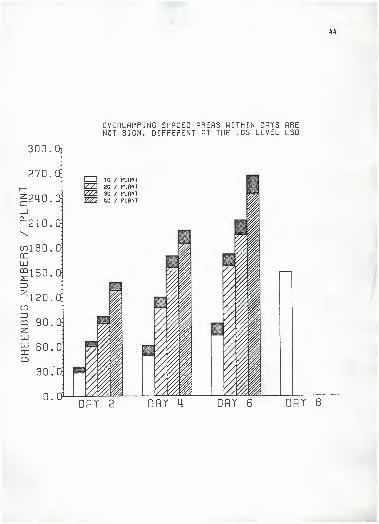
3. Mean greenbug numbers (GBN) , averaged over levels,
found on E-59, E-59+, and E-59++. Tolerance test 1 36
k. Mean greenbugs produced/adult/day (GBAD), averaged
over levels, on E-59, E-59+, and E-59++.
Tolerance test 1 38
5. Mean dry weight/individual /greenbug (GBDW), averaged
over levels, produced on E-59, E-59+, and E-59++.
Tolerance test 140
6. Mean functional plant loss index (FPLI), averaged
over hybrids, for E-59, E-59+, and E-59++.
Tolerance test 1^2
7. Mean number of greenbugs (GBN), averaged over levels,
found on E-59, E-59+, and E-59++. Tolerance test 1 kk
8. Mean greenbugs produced/adult/day (GBAD), averaged
over hybrids, on E-59, E-59+, and E-59-H-.
Tolerance test 1^
9. Mean dry weight/ individual greenbug (GBDW), averaged
over hybrids, produced on E-59, E-59+, and E-59++.
Tolerance test 1^8
10. Regression of the mean functional plant loss index
sustained by E-59, E-59+, and E-59++, over time.
Tolerance test 1 50

VI
ACKNOWLEDGMEOTS
I wish to express my appreciation to Dr. Gerald E. Wilde,
major professor, for his guidance, encouragement, and assistance
in the experimental work, as well as his critical review of the
manuscript.
I am indebted to Or. Tom L. Harvey, Department of Entomology,
and Dr. Richard L. Vanderl ip, Department of Agronomy, for their
advice and assistance as members of the supervisory committee; and
to Dr. Dallas E. Johnson, Department of Statistics, for his assistance
and guidance in the development of the statistical design and analysis
of the data.
Many thanks are given to Mrs. Helyn Marshall and Mrs. Cathy
Wilson for having typed this manuscript.
A special thanks goes to my wife, Linda, for her endless encourage-
ment, perseverance and understanding during my pursuit of this degree.
INTRODUCTION
Commercial grain sorghum hybrids resistant to the greenbug, Schizaphis
graminum (Rondani), first became available for extensive use in 1976. Their
presence marked the result of more than seven years of research directed at
developing high yielding grain sorghum hybrids resistant to this relatively
recent sorghum pest.
The greenbug first caused widespread damage on grain sorghum in 1968,
The appearance of a new biotype allowed this traditionally cool season
small grain pest to survive the high temperatures that characterize summer
in the Midwest. Harvey and Hackerott (1969) designated this new biotype
as biotype C. For an in-depth review of the biology and historical impor-
tance of the greenbug the reader is referred to Hunter (1909) and Wad ley
(1931). Sources of resistance have been reported by Hackerott et al. (1969),
and Wood (1971). Hackerott et al. (1969), Weibel (1972), Harvey and
Hackerott (1974), Johnson et al. (197*0 and Teetes et al. (1974b) demon-
strated seedling and mature plant resistance in F, hybrids. Teetes et al.
(1975b) demonstrated that greenbug resistance could be transferred to
agronomical ly improved sorghum hybrids. Walter and Wilde (1977) reported
that commercial greenbug resistant hybrids could yield as well as their
susceptible counterpart in the absence of greenbugs, and yielded signifi-
cantly better than the susceptible counterpart when infested with high
greenbug numbers.
Two sets of near-isogenic hybrids which contained susceptible, one
parent resistant, and two parent resistant hybrids were present in the
advanced growth stage field evaluations reported by Walter and Wilde (1977).
I
The purpose of this study was to evaluate the degree of resistance
displayed by seedlings of one of these isogenic sets.
MATERIALS AND METHODS
The near-isogenic hybrids tested were DeKalb E-59 (a susceptible
hybrid), E-59+ (a one parent resistant hybrid) and E-59++ (a two parent
resistant hybrid). The source of resistance for the E-59+ is believed
to be KS 30, and the sources of resistance for E-59++ are believed to
be KS 30 and SA- 7536-1. Two other one parent resistant hybrids, TEY-101-R
(source of resistance believed to be IS-809) and SG 40GBR (source of
resistance believed to be SA-7536-1) were included in several of the
tests.
Greenbugs used in the tests originated from a field population collected
the summer of 1976 at the Garden City Experiment Station. They were main-
tained on susceptible Excel 733 grain sorghum. Wilde (personal communica-
tion) determined them to be biotype D (Teetes et al. 1975a).
Tests were conducted in the winter of 1976-77 in a growth chamber
programmed for 16 hour day (ca. 1000 ft. c. ) , 8 hour night. Temperature
varied depending on the test. Seedlings were germinated in vermiculite
and held at a constant 26. 7i2°C. Four days after planting, seedlings of
uniform size were selected, transplanted into a modified Hogland's nutrient
solution and returned to the growth chamber. Respective tests were
initiated 2k hours later.
Schweissing, F. C. 197*+. Effects of certain environmental factors
on greenbug resistance in host plants. Ph.D. Dissertation, Kansas State
University, Manhattan.

Tests for Nonpreference
Three nonpreference tests were conducted, each at a different time.
Plants were supported by a foam collar in holes cut in the lid of a waxed
cardboard storage container filled with distilled water. Cellulose nitrate
film cages, ca. 12 cm in diameter and 18 cm tall with nylon mesh tops, were
secured around the containers. The first two tests, each with 8 replica-
tions, contained all three hybrids in a triangular pattern ca. 5 cm apart.
Thirty adult or 4th instar greenbugs (10/plant) were introduced between
the plants by a long stemmed glass funnel pushed through a hole in the top
of the cage. Schuster and Starks (1973) demonstrated a high positive
correlation between the preference of alate and apterous greenbug forms,
thus both were used in these tests. The third test involved the hybrids
in combination of two (E-59 vs E-59+, E-59 vs E-59++, E-59+ vs E-59++)
with 20 greenbugs being introduced between the plants. The E-59 vs E-59++
comparison had seven replications, the other two comparisons had eight.
Tests were conducted for 2k hours in a growth chamber under the conditions
described previously at a constant 26.7 C. At the end of the test the
number of greenbugs on each plant was recorded.
Tolerance Test 1
We measured the response of E-59, E-59+ and E-59++ when infested
with five levels of greenbugs over four time periods. The levels tested
were 0, 10, 20, 30, and kO greenbugs per plant left on the plants for 2,
k, 6, and 8 days.
The experimental design was initially a balanced, incomplete block.
Five plants of each of two of the hybrids were placed in each container

in the following hybrid combinations: E-59 and E-59+, E-59 and E-59++,
E-59+ and E-59++. There were three containers per time period. Each
plant was infested with one of the greenbug levels.
Replication three was modified by deleting the 40 greenbugs per plant
treatment on days six and eight and the 30 greenbugs per plant treatment
on day eight. Replication four was further modified by replacing the 30
and 40 greenbugs per plant treatments with 10 and 20 greenbugs per plant
treatments at all four time periods. These modifications thus created an
unbalanced design.
Five plants of each of two of the hybrids, which were germinated as
described earlier, were randomly arranged in the test containers. Glass
tube cages were placed over the plants and adult or fourth instar greenbugs
were introduced through the top of the cage. The cages were plugged with
foam stoppers, and the test containers were returned to the growth chamber.
The chamber temperature was adjusted to fluctuate between 26.7 C during
the light period and 15.6 C during the dark period. At the end of each
time period the following measurements were taken on the plants of that
time period: plant height from first node to tip of tallest leaf, plant
leaf area (measured with a Li cor area meter with belt attachment), and
number of greenbugs per plant (if 10 or more greenbugs were observed on
the cages, count for that plant was not made). A damage rating was also
made in which each leaf was given a rating of from to 10, being no
injury and 10 being a dead leaf. Damage ratings for each plant were
totaled and divided by the number of leaves present, thus providing an
average damage rating for the plant. Greenbugs were dried in an oven at
60 C for 48 hours and then placed in a desiccator. Weight was recorded
after the samples had reached a constant weight.

Tolerance was evaluated as functional plant loss index (FPLI) and was
calculated as follows:
Leaf area of control -leaf area of infested plant)(i_Average
FPLI = (1 - (1 Leaf area of control
damage rating)) x 100
On day two damage was not severe enough to warrant a damage rating, thus
FPLI for that time period reflects only the amount of stunting sustained,
and was calculated as follows:
. Leaf area of control - Leaf area of infested plant)x 100
FPLI = ( Leaf area of control
Greenbug response on the hybrids was evaluated as the following:
greenbug numbers (GBN) ;greenbugs produced/adult/day (GBAD) thus compensat-
ing for the different initial infestation levels; and dry weight/greenbug
(GBDW) calculated by dividing the dry weight of the greenbugs by GBN.
Tolerance Test 2
We measured the recovery potential of the three hybrids by infesting
them with a greenbug population large enough to stunt the plants yet cause
minimal visible tissue damage. The plants were germinated as described
previously, but were transplanted five days after planting.
The experimental design was completely randomized with two plants
of each of the three hybrids in each of seven containers. One plant of
each hybrid was infested with 30 greenbugs and covered with a glass tube
cage. The containers were placed in a growth chamber set at the fluctuat-
ing photophase and temperatures described previously. Two days later all

greenbugs were brushed from the infested plants, plant heights were
measured, and the containers were returned to the growth chamber without
replacing the cages. The plants were allowed to grow for seven days,
and plant heights and leaf areas were then measured.
Tolerance Test 3_____
—
We measured the influence of artificially induced moisture stress on
the expression of resistance by the seedlings of the three E-59 hybrids
and two other hybrids reputed to have different sources of resistance;
Coop SG 40GBR, believed to have SA-7536 as its original source of resist-
ance; TEY-101-R, believed to have IS-809 as its original source of resist-
ance. Moisture stress was induced by adding 150 ml of carbowax to 1500 ml
of nutrient solution, as suggested by Paulsen (personal communication).
Each of 7 replications was made up of one stressed and one nonstressed
container. Each container held 2 plants of each hybrid, one of which
was infested with 10 greenbugs. Plants were germinated in sand which
delayed emergence by one day. Thus they were transplanted and infested
one day later than the plants of tolerance test 1. Plants were stressed
at the time they were transplanted. After eight days in the growth
chamber, programmed at fluctuating light and temperature phases as
described earlier, greenbugs on each plant were counted, a damage rating
of individual leaves as described previously was made, and leaf area was
measured.
Tolerance Test k
To minimize the effects of crowding and plant deterioration on the
susceptible hybrid (E-59), we infested it with six greenbugs, and the

resistant hybrids (E-59+. E-59++, TEY-101-R, SG 40GBR) with 12 greenbugs
initially. The test was designed with an infested and uninfested plant
of each hybrid in each of eight containers. Plants were germinated in
vermiculite as described previously. They were transplanted five days
after planting and infested the following day. Growth chamber temperature
and photophase were similar to previous tests. After eight days, greenbug
numbers, damage rating as. described earlier, and plant leaf area were
recorded. The development of secondary roots was also noted.
Test for Rate of Development
To test the rate of development, three alate greenbugs were placed
on each of six seedlings of the three hybrids. The following day the
adults were removed, leaving from two to six first instar nymphs on each
plant. Plants were examined daily to determine when reproduction of
another generation began.
Field Test for Ant ibios is/Nonpreference
Greenbug counts were made in field plots of the following hybrids:
DeKalb E-59, E-59+, E-59++; Golden Acres TEY-101-R and Co-op SG-40GBR.
Plots were four rows wide by 9 meters long, and counts were made on
five plants chosen at random in each plot. Two replications were counted
on July 14, when plants were in growth stage 3 (Vanderlip 1972). Three
replications were counted eight days later on July 22.
RESULTS AND DISCUSSION
»
Tests for Nonpreference
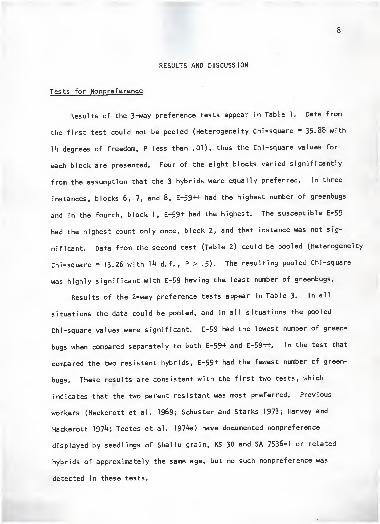
Results of the 3-way preference tests appear in Table 1. Data from
the first test could not be pooled (Heterogeneity Chi-square = 35.88 with
14 degrees of freedom, P less than .01), thus the Chi-square values for
each block are presented. Four of the eight blocks varied significantly
from the assumption that the 3 hybrids were equally preferred. In three
instances, blocks 6, 7, and 8, E-59++ had the highest number of greenbugs
and in the fourth, block 1, E-59+ had the highest. The susceptible E-59
had the highest count only once, block 2, and that instance was not sig-
nificant. Data from the second test (Table 2) could be pooled (Heterogeneity
Chi-square = 13.26 with \k d. f . , P > .5). The resulting pooled Chi-square
was highly significant with E-59 having the least number of greenbugs.
Results of the 2-way preference tests appear in Table 3. In all
situations the data could be pooled, and in all situations the pooled
Chi-square values were significant. E-59 had the lowest number of green-
bugs when compared separately to both E-59+ and E-59++. In the test that
compared the two resistant hybrids, E-59+ had the fewest number of green-
bugs. These results are consistent with the first two tests, which
indicates that the two parent resistant was most preferred. Previous
workers (Hackerott et al. 1969; Schuster and Starks 1973; Harvey and
Hackerott 197^; Teetes et al. 1974a) have documented nonpreference
displayed by seedlings of Shallu grain, KS 30 and SA 7536-1 or related
hybrids of approximately the same age, but no such nonpreference was
detected in these tests.

Test for Rate of Development
On uncrowded, vigorously growing plants of all three hybrids, new
reproducing adults developed in six days, indicating that developmental
time was not altered by the resistant hybrids.
Tolerance Test 1
No significant hybrid x level interaction was detected for any of
the variables at any of the time periods (Table 5), indicating that the
individual hybrids, or the response of the greenbugs on the hybrids, were
similar at all infestation levels. Graphs of functional plant loss index
over time and the factors used in its calculation appear in Fig. 1.
Graphs of the hybrid and level means at the four time periods for FPL1,
GBN, GBAD and GBDW appear in Figs. 2-9.
Day two . Analysis of leaf area (Table k) revealed no significant
differences between the control and plants infested with 10 greenbugs,
whereas plants of all other levels had significantly less leaf area than
the controls. Significant hybrid leaf area differences demonstrate the
need to calculate stunting as a percentage of the check plants. There
were no significant differences detected between tolerance (FPLI),
greenbug numbers (GBN), greenbugs/adul t/day (GBAD), or dry weight/green-
bug (GBDW) produced on each hybrid (Figs. 2-5). As one might expect,
there were highly significant level differences found for FPLI (Fig. 6)
and GBN (Fig. 7) and significant differences between levels with respect
Significant at the .05 level.
^Significant at the .01 level.

10
to GBDW (Fig. 8). Dry weight/individual greenbug was approximately the
same at levels 20, 30 and 40, but significantly heavier at level 10 (Fig. 9),
This could be due to less physical crowding and/or some physiological con-
dition of the plant. The functional plant loss index of level. 10 was also
significantly less than the other levels.
Day four . Tolerance was detected for the first time on day k with
E-59+ displaying significantly less FPLI than E-59 or E-59++, which were
not significantly different from each other. Highly significant level
differences for FPLI, GBN and GBDW can be attributed to initial infestation
levels. However, crowding and plant damage are beginning to reduce re-
productive rate as well as dry weight of the greenbugs at the upper levels.
Day six . Day six data showed significant level differences for all
categories, except GBAD, which was near significant with lighter and
fewer greenbugs per adult being produced at the upper infestation levels.
Tolerance was again displayed by the resistant hybrids but at this time
period E-59++ had significantly less FPLI than the susceptible but was
not significantly different from E-59+. E-59 had the highest FPLI but
was not significantly different from E-59+.
Day eight . GBAD and GBDW were not analyzed at this time period due
to the possibility of having new reproducing adults on the healthier
plants as indicated in the results of the developmental test. The sharp
increase in the number of greenbugs produced and the number of greenbugs
produced per adult per day, displayed in Table 6, clearly indicates that
there were new reproducing adults on the level 10 plants of all three
hybrids on day eight. Overall plant condition had caused the abandonment
Significant at the .10 level.
11
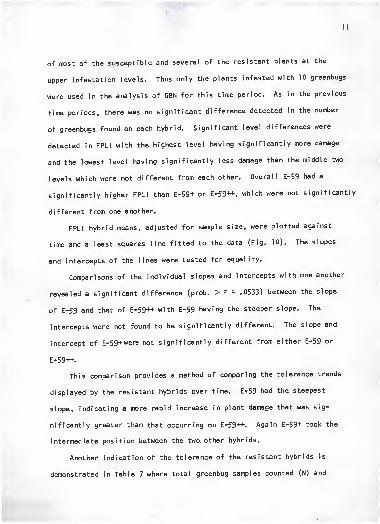
of most of the susceptible and several of the resistant plants at the
upper infestation levels. Thus only the plants infested with 10 greenbugs
were used in the analysis of GBN for this time period. As in the previous
time periods, there was no significant difference detected in the number
of greenbugs found on each hybrid. Significant level differences were
detected in FPLI with the highest level having significantly more damage
and the lowest level having significantly less damage than the middle two
levels which were not different from each other. Overall E-59 had a
significantly higher FPLI than E-59+ or E-59++, which were not significantly
different from one another.
FPLI hybrid means, adjusted for sample size, were plotted against
time and a least squares line fitted to the data (Fig. 10). The slopes
and intercepts of the lines were tested for equality.
Comparisons of the individual slopes and intercepts with one another
revealed a significant difference (prob. > F = .0533) between the slope
of E-59 and that of E-59++ with E-59 having the steeper slope. The
intercepts were not found to be significantly different. The slope and
intercept of E-59+were not significantly different from either E-59 or
E-59++.
This comparison provides a method of comparing the tolerance trends
displayed by the resistant hybrids over time. E*59 had the steepest
slope, indicating a more rapid increase in plant damage that was sig-
nificantly greater than that occurring on E-59++. Again E-59+ took the
intermediate position between the two.other hybrids.
Another indication of the tolerance of the resistant hybrids is
demonstrated in Table 7 where total greenbug samples counted (N) and

12
possible samples (PN) are compared for Day 6 and 8. The differences
between the two numbers are the plants that were not counted because
the greenbugs had or were abandoning them. This exodus began on the
susceptible as early as Day 6, level 20, and on the E-59+ on Day 6,
level 30. The E-59++ on the other hand, had no such abandonment on
Day 6. The most striking contrast was found at level 20, Day 8, where
only 2 of a possible 9 samples were counted for E-59 whereas 8 of 10
E-59+ and E-59++ were counted. No counts were possible for any of the
hybrids on Day 8, level kO.
Tolerance Test 2
After two days on the plants the greenbugs had caused only a trace
of visible feeding injury. Paired t-tests showed that the infested plants
of E-59 and E-59+ had been significantly stunted by the greenbugs but
no such stunting was detected for E-59++ (Table 8).
After being allowed to recover for seven days, the difference between
the uninfested and infested plant height and leaf area means of E-59 and
E-59+ were highly significant, indicating that neither hybrid had
recovered from the suppression of growth caused by the greenbug. Plant
height and leaf area means of the uninfested and infested E-59++ remained
not significantly different. The results suggest that greenbug damage
sustained in the seedling stage is due to more than leaf tissue destruction.
Harvey and Hackerott (1974) demonstrated more rapid recovery and more
secondary culms produced per plant on resistant hybrids exposed to
greenbug feeding in the seedling stage.

13
Tolerance Test 3
Unpaired t-tests performed on the leaf area of the stressed and
unstressed check plants showed that E-59, E-59++ and TEY-101-R were
significantly stunted by the carbowax treatment, whereas E-59+ and
SG 40GBR were not (Table 9).
Analysis of the unstressed plants of all five hybrids revealed
highly significant hybrid differences, with E-59 sustaining significantly
more damage than the other four hybrids (Table 10). No differences were
detected in the number of greenbugs found on the hybrids. Analysis of
the FPLI for the three hybrids stressed, E-59, E-59++ and TEY-101-R
(Table 11), showed that E-59 had sustained significantly more damage than
the other two hybrids. However, no significant differences could be de-
tected in the FPL! of the stressed and unstressed plants.
Tolerance Test k
No significant FPLI differences were detected between E-59 initially
infested with six greenbugs, and the four other hybrids infested with
twelve greenbugs (Table 12). Fewer greenbugs were found on the susceptible
hybrid, but numbers were not significantly lower than those on the resistant
hybrids. Crowding conditions on the resistant plants and the lack of
crowding on the susceptible plants may account for the nonsignificant
difference with respect to greenbug numbers. Table 13 shows that the
development of secondary roots was inhibited by greenbug feeding on all
five hybrids.

]k
Field Study
No significant differences were detected in the number of greenbugs
found on each hybrid either on July \k or July 22 (Table \k).
SUMMARY
The resistant hybrids displayed varying degrees of resistance to
greenbug feeding in the seedling stage. Preference tests indicated that
hybrids E-59+ and E-59++ were more preferred than E-59 at the growth
stage tested. Antibiosis and/or nonpreference were not demonstrated in
laboratory or field counts, nor did rate of development differ in a
laboratory test. However, antibiosis as measured by GBN, GBAD or GBDW
may have been masked by crowding.
Data indicate that greenbug damage sustained in the seedling stage
is due to more than leaf tissue destruction. Tolerance was displayed by
all of the resistant hybrids, but we were not able to detect significant
differences in tolerance levels between the three sources of resistance
in the commercial hybrids tested. In addition, the overall superior
tolerance of the two parent resistant hybrid, E-59++, suggests that
homozygous resistant hybrids are advantageous in the seedling stage.

15
REFERENCES CITED
Hackerott, H. L. , T. L. Harvey, and W. M. Ross. 1969. Greenbug
resistance in sorghum. Crop Sci. 9:656-8.
Harvey, T. L. and H. L. Hackerott. 1969. Recognition of a greenbug
biotype injurious to sorghum. J. Econ. Entomol. 62:776-9.
Harvey, T. L. and H. L. Hackerott. 1974. Effects of greenbugs on
resistant and susceptible sorghum seedlings in the field. J. Econ.
Entomol. 67:377-380.
Hunter, S. J. 1909. The green bug and its enemies. Bull. Univ. of Kans.
Vol. 9, No. 2. 163 p.
Johnson, J. W. , D. T. Rosenow and G. L. Teetes. 1974. Response of
greenbug resistant grain sorghum lines and hybrids to a natural
infestation of greenbugs. Crop Sci. 14:442-3.
Schuster, D. J. and K. J. Starks. 1973. Greenbugs: Components of
host plant resistance in sorghum. J. Econ. Entomol. 66:1131-4.
Teetes, G. L. , C. A. Schaefer, and J. W. Johnson. 1974a. Resistance
in sorghums to the greenbug: Laboratory determination of mechanisms
of resistance. J. Econ. Entomol. 67:393-6.
Teetes, G. L. , C. A. Schaefer, D. T. Rosenow. 1974b. Resistance in
sorghum to the greenbug: Field evaluation. Crop Sci. 1 4:706-8.
Teetes, G. L. , C. A. Schaefer, J. R. Gipson, R. C. Mclntyre, and
E. E. Latham. 1975a. Greenbug resistance to organophosphorous
insecticides on Texas High Plains. J. Econ. Entomol. 68:214-6.
Teetes, G. L. , J. W. Johnson, and D. T. Rosenow. 1975b. Response of
improved resistant sorghum hybrids to natural and artificial
greenbug populations. J. Econ. Entomol. 68:546-8.
Vanderlip, R. L. 1972. How a sorghum plant develops. Ks. Agr. Exp.
Sta. Contr. 1203.
Wadley, F. M. 1931. Ecology of Toxoptera graminum , especially as to
factors affecting importance in the northern United States. Ann.
Entomol. Soc. Amer. 24:325-95.
Walter, T. L. and G. E. Wilde. 1977. 1976 Kansas tests with greenbug-resistant grain sorghums. Ks. Agr. Exp. Stn. Prog. Rep. 307.

16
Weibel, D. E. , K. J. Starks, E. A. Wood, Jr., and R. D. Morrison. 1972.
Sorghum cultivars and progenies rated for resistance to greenbugs.
Crop Sci. 12:33^-6.
Wood, E. A. Jr. 1971. Designation and reaction of three biotypes
of the greenbug cultured on resistant and susceptible species
of sorghum. J. Econ. Entomol. 64:183-5.

17
Table I. Results and Chi-square analysis of the first nonpreference
test comparing E-59, E-59+ and E-59++.
Sura of repl icat ion
Chi -squares
PooledChi-square
Homogenei ty
Chi-square
Test for homog
-
enei ty between replications
38.44 2.56 35.88**
(16 d.f.) (2 d.f.) (14 d.f.)
Repl ication Hybrid 24
Greenbugs/planthr after infestation Chi-square
Individual repl
i
cat ion data and analysis
1
E-59+E-59++E-59
13
6
3
7.19*
2
E-59E-59++E-59+
13
9
7
1.93
3
E-59+E-59E-59++
13
8
5
3.77
4
E-59+E-59
E-59++
12
11
9
0.44
5
E-59++E-59+E-59
9
98
0.08
6
E-59++E-59
E-59+
14
10
3
6.89*
7
E-59++E-59+E-59
18
7
4
t ..1.
11.24
8
E-59++E-59E-59+
12
8
2
*6.91
a Chi-square analysis, 2 degrees of freedom.
Significant at the .05 level.
**Signif icant at the .01 level.

18
Table 2. Results and Chi-square analysis of second nonpreference test
comparing E-59, E-59+ and E-59++.
Sum. of replication Pooled Homogeneity
Chi -squares Chi-square Chi-square
Test for homogeneity between replications
26.50 - 13.24 = 13.26 P>. 5
(16 d.f.) (2 d.f.) (14 d.f.)
Pooled data
Hybrid Total
E-59 46 Pooled Chi-square = 13.24
E-59+ 66
E-59++ 88
**
"Significant at the .01 level.

(0DT)
ooO-
00o
g
XIo
1
cr\ o^loco
L.
f3
3ITin
vOCO
II
«u3C7in
I
JZ
irvoo
19
a;
0}
ucCO'_
CO
00i_Q.Coc
4->
o
in
01
>-
(0cCD
c(D
in
O
oa
eo
-3(0
"D + ++ + + +
!_ tT\ CT\ CT\ CTi en <j\
-O LA LTl LTV Lf\ LP. LP.
> 1 1 i
X LU UJ LU LU LU LU
aCO!_
ca>
<D
3
0)
X!
0)
co
oEO
4-> CO•— J_
co asc 3o olCo in
O I
E —O -CX <_>
oLP,
£>.CA u-CM .
vO
L~vO
COvO
LP.
CM
£~4-
O •
<y\ -o
•u<u
"oo0_
a)
s_
<0
3crin
l
-3o
o
— in
O (0
oE3(/> CL
CO sz1- "
+LTV
in
>
a-lp
i
LLl
Coin
TOQ
CO .o -u
vO —
CMa -co
++enLA
I
U1
>
CTvLP,
I
fD
QEOo
MD •
CM "O
r-» —
CM 4-LP. -
. T3LP.— r^
++CTvIA
I
UJ
in
>
+
lp,
LU
3oin
EOo
vOCO
CO
>CO
CO
>CO" "
LAo o
• •
CO-3
0)
-3
hj to
c cID
u o,*—
^
•— •—« 4- u-
vD **- •— •—
r^ . c c. "D CD eno •— •—
— CO to CO

20
Table 4. S ummary of analysis of2
variance, leaf area (cm ) of
E-59, E-59+ and E_5g++ fday 2, tolerance test 1.
Analysis of Variance
Source d.f. MS Prob > F
Hybrid 2 4.839 .0008
Level 4 4.437 .0001
Hybrid x level 8 .226 .9269
Error 89 .590
Sample No. Leaf areaHybrid
E-59
N (cm2 ) x
4.47 a37
E-59+ 39 4.52 a
E-59++ 39 5.16 b
Level Sample No.
N
Leaf area
(cm2 ) x
5.27 a23
10 29 4.87 a
30 17 4.68 ab
20 28 4.38 b
4o 18 4.36 b
Means followed by the same letter are not significantly different
at the .05 level, L.S.D. for unequal samples.

CDa
1
en=J
i<D
0)
L.
C7>
cb!Ll_—* •—X0} 4-1
D tn
c o•— u(/> VVI oo c— <0
!_
4J 0)c .—TO o^— +J
O.E— o
«J uE 4-o
•
—
•—*4J 3o Qc CDD oH- "—
'
s_ enO 3M- J3
C0) ID
o 0)
c u(D C71•— >,!_ 4J
(D JZ> co
u_ (U
O 3(/) >-•— L.
(/) D>»*— -om Cc <0(0
*u_ ^-vo o
<>- COL. o
E3
la
(D
3TJ<D^COD-QCH)
0)1_
en
pa la paJ- CONlavo r-.
LA LA —
LA CM PA —PA CM P-^ CAr-co paooo o — o
CM PAvO CAvO
rxoo *-3" PA LAO J" CTVIftOO
r» pa cm r-~
invo-J —— o o CMo o o oo o o oo o o o
CM PA vO —LA
J- — LA— O PAo o r>»
la o o
co -d- J- LA(Til^COO— PAvO —J- PA O O— vO -4" CM
vOPA
CM PAvO CT\vO
CM 00 LACM CM CMr-» PA —— o en
00 — COOvflNVOVD O00 O LA
r-» j- — ooO vO PA O— r--vo I
s*o — o o
CM PAvO Op^
vO CM 00— O LAvo o r~-
vO o o
J" O CA CAO CO — oo o o oo o o oo o o oo o o o
CM PAvO CAJ-
J" — CAO O LALA O —CA O LA
CM PAvO CMO LA PA LA
« % » •— r- j- oPAvO vO —
J- LAvOPAp>»
CM PAvO O
p«- cm coLA O LAo o r^o o oo
<d
o!_
3OCO
LA — l*»
00 PA —00 — CACO O vO
en r^ r-» ovO 00 P^COO CM PA LAO CM O O
CM PAvO CMLA
00 CA O— vO PANOO\CA O PA
vO vO CM r*»
O PA — CAo en cm —o o o oo o o oo o o oo o o o
CM PAvO VOPA
P^ — PACA O —— O LAvO O LA
21
CO 00 o —• • • •
O P>-vO CMJ- 00 1^ CAPAvO LAvO
vO
CM PAVO CMLA
$
CMCM
LALA
CM — LAJ- O —O O COO O LA
CA00 CA O LA 00 CM r^ N4- CA J"CA00 0O CA vO 00 CM vO — i
—
n» o% m , , • • | • • • • •
PA CM CA PA vO P^ CM 00 CM LA LA COP>. — 00 VO CA LA CA r^ LA •— P^-3"J" CO CM vO CA 1 J* i
—
PA CM PACM rA CM OO
CM PAVO LA CM PAVO CA CM PA vO J"vO vO r»»
_ _ ,
<0 <D
> > >0)
L. t) U
IJIU>a
L. <U L. OJ3 > JO L.
>. d) >~ i-IJILI
vO
>-
03Q
u t> OD > i L>. a) >. i_
i jxui
oo
Q
CACAO
PA00o
CM J-
0166 0001 9878
— O LAvO— 00 00 PA
937.5638.
30.212.
CM PA VO -?
>a)_i
X
Hybrid
Level
Hybrid
Error
22
0)
.aE
T3cID
ID
c
01
JD ME9C
V)
toOc(0s_
c »"
0}
in
o4-J
0)!_
*
a. En
•~
in+j
C >o
a>i.
**
a> /~\
zJ3E3c TO
-D
c•— 4-»
0v1) 3W a10 IDVi_ t-_
u IDc— u
C
v£>1—in
tt) <
—
^~ <0
-Q 3ro T3
T3C
00 Q
inic
a) o
u
«DQ
(D
vO
ID
in
TOa) ol. *>
uc J-
>IDQ
uc
ID
>•ID
CM Q
ID
ID
L.
-Q
J*CM
oo
--tvO
CM — CM fAO — O CTi
caJ-
<A
la
00
cm in la —
LA
CM*
LA
CO O CM <T\mj Lf\d\
J- J" O CA J- CTvOO P»«
3" vOo r^ca LTV 51?
O CM vO CTij- -a- — <j\
—' —!
—' o
CTlCO LA LAI % • •
CM LAVO P"~
o cm vo cnCT\ 0*\v£> J"
o o o o
moo LA LA
r-» vo cr\ a\
o o o o— cm ca j-
cm moo ooCM CM O LA
— — — o
CA O O CM
J" CA Jr \DCM J" vO --*
cm ca r^ooNSlAO
VO CTi O LA
r» LA — CT»NU\I«\N
O CA — CM-d- CM -3- CO
O CA LA 00
CO 0>-* LACM -3" CO MO
OM-No\ r*. en m
LA
CA O O CM
jf a". J- vd— CM CA
O O O O— CM m-3"
+
LA
UJ
CM CA LA 00
00* & -3* LA— CM LA CM
O O O O— CM CA J"
++CTiLA

23
Table 7. A comparison of the number of samples counted (N)
and the possible number (PN) that could have been counted had the
greenbug remained on the plants, tolerance test 1.
E--59 E-59+ E-59++
Level N PN N PN N PN
Day 6
10 9 9 10 10 8 8
20 8 10 10 10 10 10
30 3 6 5 6 6 6
ko 2 k 3 k 4 k
Day 8
10 7 10 10 10 10 10
20 2 9 8 10 8 10
30 1 k 3 k 3 *
ko k k o 4
2k
-oc
Cn
0)
c
c«
a)>
u
Iin
3JOC(0 CM
c0)
-E5
-C
BID
co
0)
(0
uc(0
0)
>ou
t/1
<d
c
>a)
i/t
L.
a)
L.
0)
w ,—
^
4-CMID E
O(D
"-^
9'-.Q(D i/>
>4- to
(D o<D
_l r^
-J3(D (A
<D*-< -oc(0 I
—
I
cOre
oi §
e -o.- (U4-> >
o•w EID <D
-C 0)
— <U
0J 2—
C 3ID -Q
ui—C
LA
1"*.
csl
LA
$ i
en
vD
CMLA
CA
LA
rAOO
*
CACM
J"
t t
caCA
00
vO —LACA
LACA
\£>
CO
LA
— -3" —O00
co
T3 ++ +
!_ CA CA CA-Q LA LA LA>- 1 1 1
ZC UI UI LU
in
O
8.c
. i flj
-— •— in
0) B . 3> > 4-1
<D 8 </> 0)
—
t <D -C4-< 4V
LA .1
O o 4-> TJa 0)D u
0) a> <D u-C JZ !_ o4-1 4-1
<0
4-
*-> 4-1 Q. (A
0J rc <D^ —4-J u -Q Q.c c E0! <D 4-1 ID
u O U) tfi
•— •
—
0)
4- M- 4-) .
—
— — <DC C l/t 3cn cn c cr•— •
—
s<D
to to c
%
25
3-QCa>
a)i_
Xa>Dc
in
l/>
O~"
4-> .
c caID^ •uQ. in
o— 4->
(DC a>
_o oc
4-> TOu uc 0)
3 p—<4- ow1_
••
<4- in4->
in cc fC
ID •—a) Q.E
-DD 0)•— 4-*
1_ in
-D 0)
> i*-
X c
o cV 3l/l
in Va) -Cu 4->
•M(0 '—
oT>c <D<0 0)
1_
u <D<uin u-tn <0
<u 0)i_ ^4Jin T3c C=> ID
. t v
<T> 2CQ
CD O— ^—
^
-Qto in
h- !_
CD
-OE9c
4- CO (D
ID Q0)
1- T>ID 0)
4J4- in
ID <D
<u
_l c
c3
T3(1)
l/> LTV •a- r<in • •
a) o rsi rr\
L. •— -~ •"
to
IN —1^ vD
CTi vD
j- la «— j- <r>^- t— CM CM •—
oo
NO*CO
CT\ 00
Ola
ooNO NO
ooIA
a:i cc
i
—
00.
TJ + o o+ + — o
u <T\ en en J-Q LA LA LA >->- 1 i 1 UJ taX UJ LU UJ h- «/>
4-> min 0)CD 4->
4-*
1 4->
4-1
oTJ <L>
0) L.l_ •—•— (0
ID D.Q. CC 33
^•» mm
_- 0)G >> 0)0) ^~—
V—LA oO »
<u0) .c-C 4-1
4-> cc ID
TO OU —•— >4-
4- •—•
—
cc U)o> •
—
•— toCO -j*
* K

26
Table 10. Analysis of variance and means for functional plant loss
index (FPLl) and greenbug numbers (GBN), from plants in unstressed con-
tainers, tolerance test 3.
FPLl GBN
Source d."F. Ms Prob > F d. f . Ms Prob > F
Repl ication 6 237.04 .4884 6 1554.07 .7855
Hybrid 4 1086.58 .0670 4 1434.20 .7497
Error 22 232.43 19 2984.81
Mean MeanHybrids FPLl GBN
E-59 86.8 a 151
E-59++ 68.8 b 121
TEY-101-R 67.7 be 157
SG 40GBR 58.4 be 150
E-59+ 50.9 c 130
Means followed by the same letter are not significantly different at
the .05 level, L.S.D. for unequal samples.

27
Table 11. Analysis of variance and means for functional plant loss
index (FPL I) of hybrids stressed by carbowax treatment (E-59, E-59++,
TEY-101-R), tolerance test 3.
Source d.f. Ms Prob > F
Repl icat ion 6
Stress 1
Repl ication x St ress 6
(error a)
Hybrid 2
Stress x Hybrid 2
Error b 20
137.,88
132.61
115, 77
2511,,50
281,,87
191.,56
3256
.0002
.2568
Hybrid
E-59
TEY-101--R
E-59++
Mean
FPL I
90.2 a
64.5 b
61.8 b
Means followed by the same letter are not significantly different
at the .05 level, L.S.D.

28
Table 12. Analysis of variance and means of functional plant loss
index (FPL 1 ) and greenbug numbers (GBN), tolerance test 4.
FPL1 GBN
Source dj^ Ms Prob > F d. f
.
Ms Prob > F
Analysis
Replication 7 2.787 .69*6 7 1554.07 .7855
Hybrid 4 5.592 .2884 4 1434.20 .7497
Error 19 4.149 19 56711.46
HybridsMeanFPLI
MeanGBN
E-59 83.7 106.2
E-59+ 72.0 153.6
E-59++ 59.2 144.0
SG 40GBR 78.1 166.8
TEY-101-R 71.0 157.6

29
Table 13. Number of plants of each hybrid, of a possible 8 plants,
displaying secondary root development under infested (6 greenbugs/plant
on E-59, 12 greenbugs/plant on the other four hybrids) and noninfested
conditions, tolerance test k.
No. of plants displaying secondary roots
Hybrid Not infested Infested
E-59 8 2
E-59+ 5 2
E-59++ 6 1
SG 40GBR 5 2
TEY-101-R 7

30
Table 14. Analysis of variance and means of field greenbug counts
made July 14 and July 22, 1977, Manhattan.
July 14 July 22
Source d.f. Ms Prob > F d.f. Ms Prob > F
Analysis
Block 1 5962. 32 2 10940.92
Hybrid 4 1568.07 .9760 4 80547.93 .3713
Error 44 14450.30 68 74252.59
Hybrids
MeanGreenbugsJuly 14
MeanGreenbugsJuly 22
E-59 180 540
E-59+ 184 414
E-59++ 174 467
SG 40GBR 153 549
TEY-101-R 164 v 386

ID —^—
DC XID V
X»en cc —(-> en
ID t/1
i- OPH
d)
O) M<5 cE (0ID —-D 0.
<U —Dl IDID C1- O0) _> 4J
ID U a
C —«4- DO M- 4J
in
Q. O <D— +J 4-1
.ci/> in <1J
C (0 uO O e•— ^— ID4-1 L.
ID ID 0)— <1> —0) l- OCC ID 1-
01

32
atn tc«nc UJ-i o
fii(rrLCDu. cc
UJ+ u. o+ CC ccCO UJ £Cin _j ujI >UJ X cc
III6 ' '
' 6 ' '' & ' '
' A ''
' 6 ' "5""
to
.>-rrCTQrJ
ao
oCO
O o oto
oin
oa-
o o'A'
'
"dp
d d
X3QNI 39HWbO lNbld
cccc
UJaCEz:(XaUJ
u. o+ cc ccCO u ccin
i
UJ
tntoc
cr—• UJ-J cc0_ cc
UJ>cc
II!cb"
,, 6' , '6 , ''A'''A' ,, 6' , '6'' , 6 ,, '6'
LO
srCEO
oo
oen
o o oto
oin
aen
oA 1
"dp
o o
X3QNI 33bWHQ INBld
o2
CC10 cctoO UJ_J o
cccc z:u cc^ DC Q
_l ccQ_ UJU, U. o
cc ccCO UJ ccin _i uj
i >UJ X cc
inA ,,, A ,,, A ,,, A' ,, A ,,, A ,,
'A ,,, A ,,, A ,,,A'
CD
>-
o
ao
oCO
oto
o oto
oLO
oCO
o oevi — o
X3QNI 30HWya iNHId
Fig. 2. Functional plant loss index (FPLI) hybrid
means, averaged over levels, for E-59, E-59+,
and E-59++. Tolerance test 1.

3*»
OVERLAPPING SHADED AREAS WITHIN DAYS ARENOT SIGN. DIFFERENT AT THE .05 LEVEL LSD
XLUQ21
CO
o_l
ex_JQ_
_J(X
I—O
100. On
90.0
80.0
70.0
60.
50.0
40.0
30.0
20.0
10. tf
0.0
+cn +in +
Si?
m
enin
COlo
LUcnLO
\LO
oJ cnLO
LU
COLO
LU
DAT 2 DAY 4 DRY 6 DAY 8

Fig. 3- Mean greenbug numbers (GBN), averaged overlevels, found on E-59, E-59+, and E-59++.Tolerance test 1.

36
OVERLAPPING SHADED AREAS WITHIN DAYS ARENOT SIGN. DIFFERENT AT THE .05 LEVEL LSD
cr-JQ_
200.
180. -I
160.
140.
cnl20.
LiJ
2100.
* 80.oQQ 60.
LUu HO.
20.
0.
CO
LU
+colo
i
LU
++COLO
I
LU
COLO
I
LU
COLO
I
UJ
++COLO
I
COLO
I
LU
+COLO
I
LU
++COLO
I
LU
COLO
I
LU
COLO
I
LU++COLO
I
LU
DAT 2 DAY 4 DAY 6 DAY 8

Fig. k. Mean greenbugs produced/adul t/day (GBAD),averaged over levels, on E-59, E-59+. andE-59++. Tolerance test 1.

OVERLAPPING SHADED AREAS WITHIN DATS ARENOT SIGN. DIFFERENT AT THE .05 LEVEL LSD
38
2. lOi
>"1. 90cro1.70\
1-1.50_i
q1.30cr
\l. 10
go. 90LU
gO. 70
Q.sty
COlo
i
LU
+COLO
I
LU
++COLO
I
LUCOLO
1
LU
+COLO
I
LU
DAY 2 DRY 4 DAY 6

Fig. 5. Mean dry weight/individual /greenbug (GBDW),
averaged over levels, produced on E-59,
E-59+, and E-59++. Tolerance test I.

ko
CE_lQ_
200.
180. ^
160.
140.
cnl20.enLxJ
2100.
* 80.CD
cd 60.
UJu 40.CD
20.1
0.
OVERLAPPING SHADED AREAS WITHIN DAYS ARENOT SIGN. DIFFERENT AT THE .05 LEVEL LSD
+ +05 O) +in
i
toi
05IT)
UJ UJ «
UJ
01lo
i
LU
+COLO
I
LU
++CDlO
I
LU
enLO
I
Lu
+enLO
i
++03m
i
LU
O)LO
I
LU
91LO
I
LU++00LD
I
LU
DRY 2 DAY 4 DRY 6 DRY 8

Fig. 6. Mean functional plant loss index (FPLI),
averaged over hybrids, for E-59, E-59+»and E-59++. Tolerance test 1.

42
100.0]
x£j 90. Oj
l-< 80.0-
COen 70. Oj
60.01
cr 50.
D
_i
°" 40. CH
cr
o30. l>
20. Q<_)
OVERLAPPING SHA0ED AREAS WITHIN DAYS ARENOT SIGN. DIFFERENT AT THE .05 LEVEL LSD
I I 10 / PLANTV /\ 20 / PLANTE22 30 / PLANTV//A 40 /* PLANT
Dflr a DAT 4 DAT 6 DAY 8

Fig. 7. Mean number of greenbugs (GBN) , averagedover levels, found on E-59, E-59+, andE-59++. Tolerance test 1.
hh
OVERLAPPING SHADED AREAS WITHIN DATS ARENOT SIGN. DIFFERENT AT THE .05 LEVEL LSD
<X_lQ_
300. Oi
270.0;
240.0:
210. Oi
co!80.0jazUJ
2150.03
120.0;
UJ
£ 60.
C
CD
I I 10 / PLANT
ZZj 20 / PLANT177/1 30 / PLANT
HO / PLANT
DAT 2 DRY 4 DAT 6 DRY 8

Fig. 8. Mean greenbugs produced/adul t/day (GBAD)
,
averaged over hybrids, on E-59, E-59+, andE-59++. Tolerance test I.
.

46
OVERLAPPING SHADED AREAS WITHIN OAYS ARENOT SIGN. DIFFERENT AT THE .05 LEVEL LSO
2. 10]
>-1.9(>cro
1.70J
H-1.501
al.30CE
O. 10]
^0.901LU
gO. 70;
0.50:
10 / PLANTV /\ 20 / PLANTV/A 30 / PLANTV//A HO / PLANT
DAT 2 DAT 4 DAT 6
Fig. 9. Mean dry weight/individual greenbug (GBDW),averaged over hybrids, produced on E-59,E-59+, and E-59++. Tolerance test I.

h8
zO.0235]UJ
^0.0220]CD
cr0.0205
2o. 019CH
°0.0175
^0.0160
£0.0145CD
^0.0130)
£0.011 SI
OVERLAPPING SHADED AREAS WITHIN DAYS ARENOT SIGN. DIFFERENT AT THE .05 LEVEL LSD
10 / PLANT
.0.Q10CH
ZZ] 20 / PLANT
EZ3 30 / PLANTV7ZA 40 / PLANT
CO DAY 2 DAT 4 DAT 6
Fig. 10. Regression of the mean functional plant loss
index sustained by E-59, E-59+, and E-59++,over time. Tolerance test 1.

50
XUJo
100.0]
90. 6
80. Ch
co 70. CHen
60. 0]
E-59 T = -12.75 12.16X
E-59 + T = -8.01 9.69X
E-59++ y = -3.60 + 8.76X
CH 50._lQ_
140. Oi
30.0-
lj 20.0--21
ZDll. io. cH
cr
o
0.V. ?. ^ 6^ 8.
DAT

GREENBUG RESISTANCE LEVELS IN COMMERCIAL GRAIN SORGHUM HYBRIDS
IN THE SEEDLING STAGE
by
JAC FORBY MORGAN
B. S. , Kansas State University, 1975
AN ABSTRACT OF A MASTER'S THESIS
submitted in partial fulfillment of the
requirements for the degree
MASTER OF SCIENCE
Department of Entomology
KANSAS STATE UNIVERSITYManhattan, Kansas
1978

The purpose of this study was to evaluate the relative greenbug
resistance displayed by commercially available grain sorghum hybrids
in the seedling stage. Three heterozygous resistant hybrids, E-59+,
TEY-101-R, and SG 40GBR, representing three prominent sources of
greenbug resistance, KS 30, IS-809, and SA-7536, respectively, and
a homozygous resistant hybrid, E-59++, representing both KS 30 and
SA-7536, were evaluated. The hybrid E-59 was the susceptible standard.
Preference tests indicated that hybrids E-59+ and E-59++ were more
preferred than E-59 at the growth stage tested. Antibiosis and/or
nonpreference were not detected in any of the tests. Tolerance was
displayed in varying degrees by the resistant hybrids but no significant
differences were detected among the three sources of resistance repre-
sented in the commercial hybrids tested. The overall superior tolerance
displayed by E-59++ suggests that homozygous resistant hybrids are more
resistant than heterozygous resistant hybrids in the seedling stage.
However, all are capable of being damaged by extremely high greenbug
numbers if infested at plant emergence.