Embed Size (px)
Citation preview

Prefatory Note
The attached document represents the most complete and accurate version available based on original copies culled from the files of the FOMC Secretariat at the Board of Governors of the Federal Reserve System. This electronic document was created through a comprehensive digitization process which included identifying the best-preserved paper copies, scanning those copies,1 and then making the scanned versions text-searchable.2 Though a stringent quality assurance process was employed, some imperfections may remain.
Please note that this document may contain occasional gaps in the text. These gaps are the result of a redaction process that removed information obtained on a confidential basis. All redacted passages are exempt from disclosure under applicable provisions of the Freedom of Information Act.
1 In some cases, original copies needed to be photocopied before being scanned into electronic format. All scanned images were deskewed (to remove the effects of printer- and scanner-introduced tilting) and lightly cleaned (to remove dark spots caused by staple holes, hole punches, and other blemishes caused after initial printing). 2 A two-step process was used. An advanced optimal character recognition computer program (OCR) first created electronic text from the document image. Where the OCR results were inconclusive, staff checked and corrected the text as necessary. Please note that the numbers and text in charts and tables were not reliably recognized by the OCR process and were not checked or corrected by staff.
Confidential (FR) Class II FOMC
July 2, 1980
RECENT DEVELOPMENTS
Prepared for the Federal Open Market Committee
By the staff of the Board of Governors of the Federal Reserve System

TABLE OF CONTENTS
Section Page
DOMESTIC NONFINANCIAL DEVELOPMENTS II
Employment and production.................................. 1Consumer spending.......... ................................ 5Business fixed investment............... .................. 9Inventory investment ....................................... 11Residential construction.................................. 15Federal government sector................................. 17State and local government sector.......................... 18Prices and wages.......................................... 19
TABLES:
Changes in employment....................................... 2Selected labor market indicators............................ 2Industrial production...................................... 4Capacity utilization rates .................................. 4Retail sales................................................ 6Auto sales.................................................. 6Personal income............................................. 7Business investment spending................................ 8Commerce survey of plant and equipment expenditures......... 12Error history of the May Commerce survey ................... 12Changes in manufacturing and trade inventories.............. 13New private housing activity............................... 14Recent changes in producer prices........................... 22Recent changes in consumer prices........................... 22Hourly earnings index....................................... 23
CHARTS:
Capital spending commitments............................... 10Manufacturers' newly approved capital appropriations........ 10Inventories relative to sales............................... 13Private housing starts..................................... 16
DOMESTIC FINANCIAL DEVELOPMENTS III
Monetary aggregates and bank credit......................... 3Business finance............................................. 9Government debt issues ..................................... 11Mortgage markets.............................................. 15Consumer credit............................................ 17

TABLE OF CONTENTS (Cont.)
Section Page
DOMESTIC FINANCIAL DEVELOPMENTS (Cont.) III
TABLES:
Selected financial market quotations....................... 2Monetary aggregates ........................................ 4Commercial bank credit and short- and intermediate-
term business credit .................................... 8Gross offerings of corporate securities.................... 10Government security offerings.............................. 12Interest rates and supply of mortgage funds at
selected S&Ls................................. ........ 14Secondary home mortgage market activity ................... 14Consumer installment credit................................ 18
CHART:
Consumer finance rates at commercial banks................. 20
APPENDIX A:
Money market mutual funds................................ A-1
INTERNATIONAL DEVELOPMENTS IV
Foreign exchange markets................................... 1U.S. international transactions............................ 6Foreign economic developments.............................. 11
TABLES:
U.S. merchandise trade..................................... 6Oil imports............... ..... ....... ........ ............. 7Net Eurodollar borrowing by U.S. commercial banks.......... 10U.S. international transactions.......................... 10aReal GNP and industrial production in major industrial
countries...... ........................................ 12Consumer and wholesale prices in major industrial
countries.............. ....................... ......... 13Trade and current-account balances of major industrial
countries.................. ............................ 14
CHARTS:
Weighted-average exchange value of U.S. dollar............. 2Three-month interest rates................................. 3

II-T-1
SELECTED DOMESTIC NONFINANCIAL DATA(Seasonally adjusted)
Latest Data Percent Change fromThree
Release Preceding Periods YearPeriod Date Data Period Earlier earlier
(At annual rate)
Civilian labor forceUnemployment rate (2) 1/Insured unemployment rate (Z) 1/
Nonfarm employment, payroll (mil.)ManufacturingNonmanufacturing
Private nonfarm:Average weekly hours (hr.) 1/Hourly earnings ($) 1/
Manufacturing:Average weekly hours (hr.) 1/Unit labor cost (1967-100)
Industrial production (1967-100)Consumer goodsBusiness equipmentDefense & space equipmentMaterials
Consumer prices all items (1967-100) MayAll items, excluding food & energy MayFood May
May 6-6-80May 6-6-80May 6-6-80May 6-6-80May 6-6-80May 6-6-80
May 6-6-80May 6-6-80
May 6-6-80May 6-30-80
May 6-13-80May 6-13-80May 6-13-80May 6-13-80May 6-13-80
6-24-806-24-806-24-80
105.17.84.3
90.320.370.0
35.16.57
39.4192.2
145.5142.7172.1
95.1147.6
244.7231.0249.2
8.37.03.7-2.4
-16.01.6
35.36.54
39.613.9
-25.0-20.7-14.5-12.5-30.9
3.4 2.76.0 5.83.1 2.8
-2.3 1.0-10.8 -3.5
.3 2.4
35.5 35.76.46 6.09
40.1 40.214.4 10.9
-17.9-15.6-8.4-3.8
-21.3
13.0 14.313.4 13.27.4 6.7
Producer prices: (1967-100)Finished goodsIntermediate materials, nonfoodCrude foodstuffs & feedstuffs
Personal income ($ bil.) 2/
6-6-80 240.4 3.06-6-80 277.2 1.76-6-80 235.1 29.3
8.74.4
-25.8
May 6-17-80 2070.0 1.7 2.8 9.4
(Not at annual rates)
Mfrs. new orders dur. goods ($ bil.) MayCapital goods industries May
Nondefense MayDefense May
Inventories to sales ratio: 1/Manufacturing and trade, total
ManufacturingTrade
Ratio: Mfrs.' durable goods inven-tories to unfilled orders 1/
Retail sales, total ($. bil.)GAF 3/
7-1-807-1-807-1-807-1-80
Apr. 7-1-80May 7-1-80Apr. 7-1-80
7-1-80
67.4 -6.625.4 -6.220.1 -9.15.3 6.7
1.51 1.441.71 1.691.34 1.29
.588 .582
May 6-10-80 73.7 -1.5May 6-10-80 16.5 1.0
-16.81.0
-6.243.4
-12.52.6
-4.745.0
1.38 1.441.54 1.491.24 1.34
.568 .549
-5.6 1.9-1.5 3.3
Auto sales, totalDomestic modelsForeign models
(mil. units.) 2/ May 6-4-80May 6-4-80May 6-4-80
Plant & Equipment expen. ($ bil.)4/All Industries
Capital Appropriations, Mfg.Housing starts, private (thous.) 2/Leading indicators (1967-100)
19801980-Q21980-Q31980-Q4
1980-Q1MayMay
6-10-806-10-806-10-806-10-80
194.63191.00195.54199.41
5-30-80 29,7896-17-80 9206-30-80 123.4
28.3-11.5-2.4
- 9.9
- 10.1- 9.0
- 6.7
- 36.0-30.8 -48.9-8.7 -12.5
-11.5-13.3-6.6
-31.1-32.2-28.1
-34.2-37.5-23.9
1/ Actual data used in lieu of percent changes for earlier periods.7/ At annual rate.3/ Excludes mail order houses.4/ Planned-Commerce May 1980 Survey.
II - T - I July 2, 1980

DOMESTIC NONFINANCIAL DEVELOPMENTS
Incoming information on the economy indicates that activity
contracted sharply in recent months. Advance estimates suggest that
real gross national product declined at about an 8-1/2 percent annual
rate in the second quarter--the second largest quarterly drop in the
postwar period, with all major components of private domestic final
demand falling considerably. Some involuntary stock accumulation has
occurred as a consequence of the unexpectedly severe drop in final sales.
The contraction of economic activity has led to a marked weakening in
the demand for labor and a rapid rise in the unemployment rate. At
the same time, more favorable market conditions for some commodities and
an easing in rates of increase of energy prices have reduced price
pressures somewhat, although rates of inflation at the consumer level
remain high.
Employment and Production
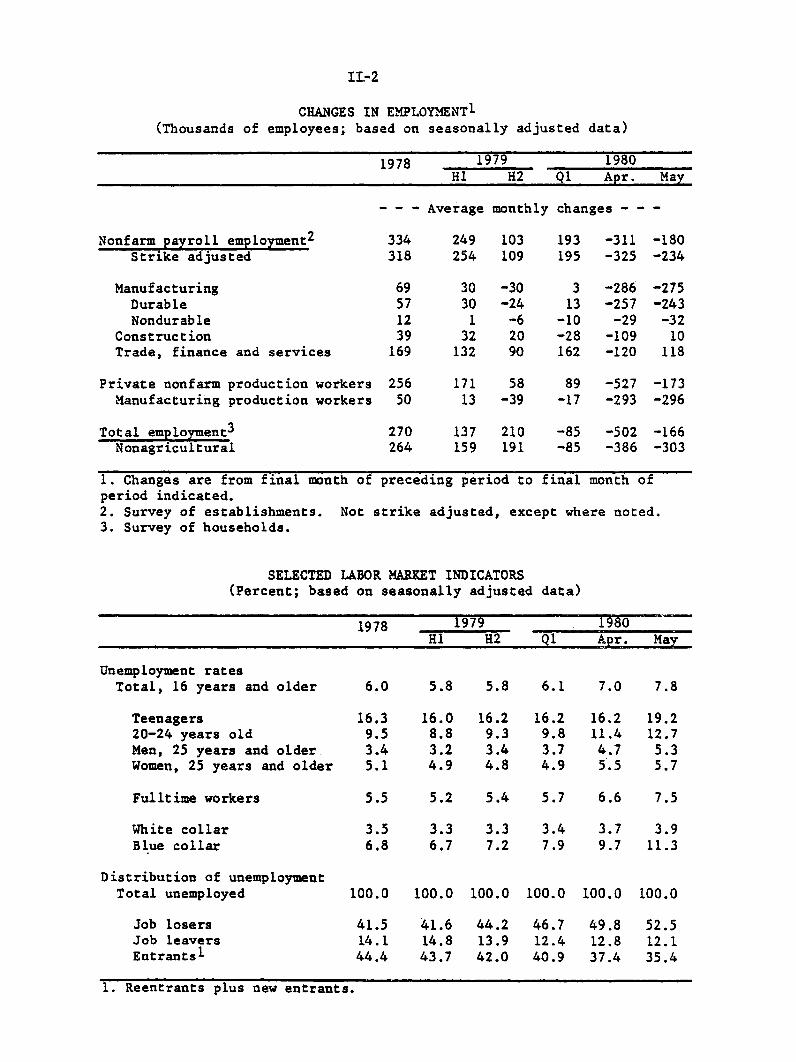
Labor demand continued to deteriorate in May as nonfarm pay-
roll employment fell 180,000 to a level 1/2 million below its peak in
February. Manufacturing employment dropped 275,000 following a similar
decrease in April. Factory job losses were widespread among durable
goods industries, with particularly large decreases in automotive and
construction-related industries. Employment at trade establishments
edged up in May but still remained somewhat below its peak in February.
The factory workweek fell 0.2 hour further in May; since January, the
average workweek has been shortened almost one hour.
Total employment, as measured by the household survey, con-
tinued to decline in May to a level nearly one million below its peak
II-1
II-2
CHANGES IN EMPLOYMENT 1(Thousands of employees; based on seasonally adjusted data)
1978 1979 1980HI H2 Ql Apr. May
- - - Average monthly changes - - -
Nonfarm payroll employment2
Strike adjusted
ManufacturingDurableNondurable
ConstructionTrade, finance and services
Private nonfarm production workersManufacturing production workers
249 103 193 -311 -180254 109 195 -325 -234
-30-24
-62090
171 5813 -39
313
-10-28162
-286-257
-29-109-120
-275-243
-3210
118
89 -527 -173-17 -293 -296
Total employment 3
Nonagricultural270264
137 210 -85 -502 -166159 191 -85 -386 -303
1. Changes are from final month of preceding period to final month ofperiod indicated.2. Survey of establishments. Not strike adjusted, except where noted.3. Survey of households.
SELECTED LABOR MARKET INDICATORS(Percent; based on seasonally adjusted data)
1978 1979 1980HI H2 Q1 Apr. May
Unemployment ratesTotal, 16 years and older 6.0 5.8 5.8 6.1 7.0 7.8
Teenagers 16.3 16.0 16.2 16.2 16.2 19.220-24 years old 9.5 8.8 9.3 9.8 11.4 12.7Men, 25 years and older 3.4 3.2 3.4 3.7 4.7 5.3Women, 25 years and older 5.1 4.9 4.8 4.9 5.5 5.7
Fulltime workers 5.5 5.2 5.4 5.7 6.6 7.5
White collar 3.5 3.3 3.3 3.4 3.7 3.9Blue collar 6.8 6.7 7.2 7.9 9.7 11.3
Distribution of unemploymentTotal unemployed 100.0 100.0 100.0 100.0 100.0 100.0
Job losers 41.5 41.6 44.2 46.7 49.8 52.5Job leavers 14.1 14.8 13.9 12.4 12.8 12.1Entrants 1 44.4 43.7 42.0 40.9 37.4 35.4
1. Reentrants plus new entrants.

II-3
in February. The unemployment rate again jumped 0.8 percentage point to
7.8 percent, with job losers accounting for about three quarters of the
increase in unemployment. Unemployment rate increases occurred for
nearly all labor force groups, with an especially large advance for
adult males. The rate for blue-collar workers rose substantially,
while that for white-collar workers edged up.
The index of industrial production declined 2.1 percent in
May, following a similar drop in April. The May index was 4.7 percent
below the January level and 5 percent below its most recent peak in
March 1979. Output reductions in April and May occurred in all major
market groupings, and particularly sizable decreases were recorded for
automotive products, home goods, construction supplies, and durable
goods materials. Weekly data on raw steel output suggest further large
production declines in this sector during June, and truck assemblies
were scheduled to be below May levels. However, despite the continued
weakness in sales, auto assemblies scheduled for June were about 5
percent higher than May's low 5.5 million unit annual rate.
Recent declines in industrial output have resulted in a
sizable increase in unutilized capacity. In May, capacity utilization
in manufacturing was 78.9 percent, down 2.0 percentage points from April.
The utilization rate for producers of industrial materials fell 2.3 per-
centage points to 80.2 percent. Both rates have declined around 8.0
percentage points from their most recent highs. Within manufacturing,
declines in operating rates were widespread.

II-4
INDUSTRIAL PRODUCTION(Percentage change from previous period;
based on seasonally adjusted data)
1979 1980 Jan. 1980to
Q4 Ql April May May 1980
---annual rate--- ----not annual rate---
Total -0.3 0.0 -2.0 -2.1 -4.7
Final products 0.5 1.0 -1.3 -1.5 -2.7Consumer goods -1.6 -2.2 -1.8 -1.7 -3.7
Durable -6.9 -15.5 -4.9 -4.9 -8.5Nondurable 0.8 3.2 -. 7 -. 5 -1.9
Business equipment 1.6 6.2 -. 9 -1.2 -1.7
Construction supplies -. 5 -4.9 -4.6 -4.2 -10.6
Materials -0.8 -1.0 -2.3 -2.6 -5.8Durable Goods -5.9 -2.7 -3.6 -3.6 -8.1Nondurable Goods 6.1 .3 -1.5 -1.7 -5.6Energy materials 2.5 1.5 .1 -1.5 .8
CAPACITY UTILIZATION RATES: MANUFACTURING AND MATERIALS(Percent, seasonally adjusted)
1975 1979-80 1979 1980Low High Q4 Ql April May
Manufacturing 69.0 87.1 84.6 83.7 80.9 78.9
Primary processing 68.2 89.0 86.4 84.8 80.9 77.8Advanced processing 69.4 86.2 83.6 83.1 80.8 79.5Motor vehicles & parts 51.3 92.3 71.2 65.5 57.1 53.3
Materials 69.4 88.3 86.3 85.4 82.5 80.2
Durable goods mats. 63.6 87.5 84.0 82.7 78.9 75.9Raw Steel 68.0 93.9 84.8 84.0 79.1 68.0
Nondurable goods mats. 67.2 91.0 90.4 89.6 -86.6 84.8
Energy materials 84.8 87.5 86.6 86.5 86.9 85.5
II-5
Consumer Spending
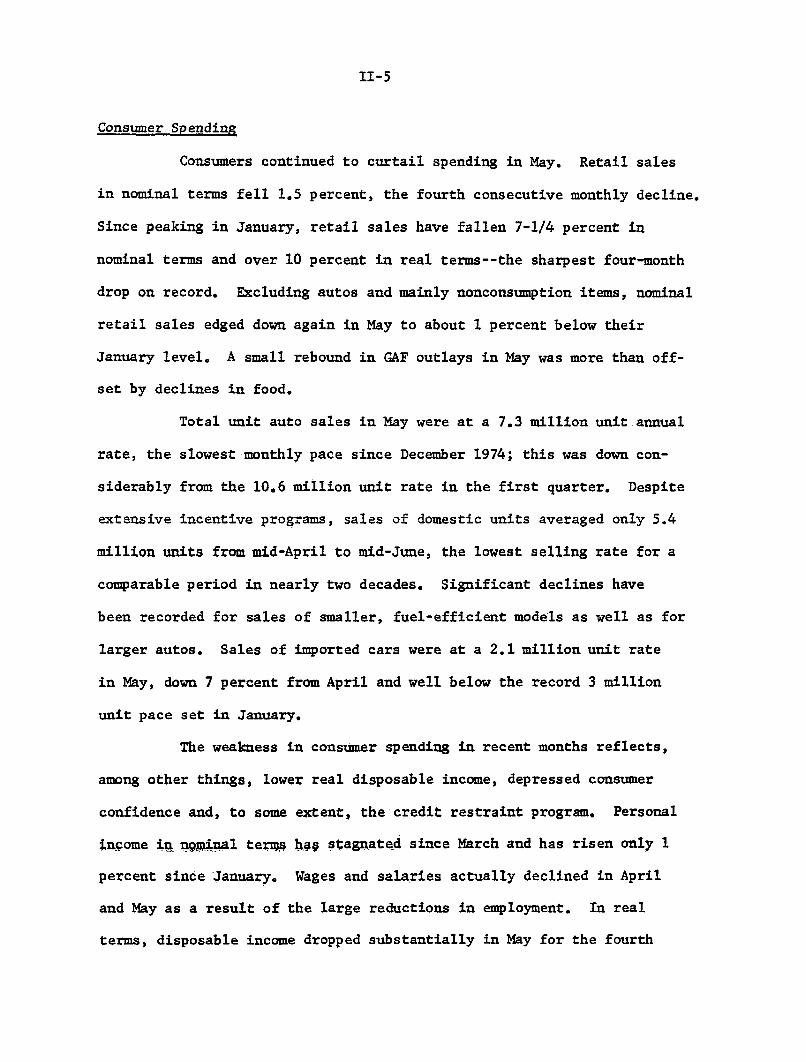
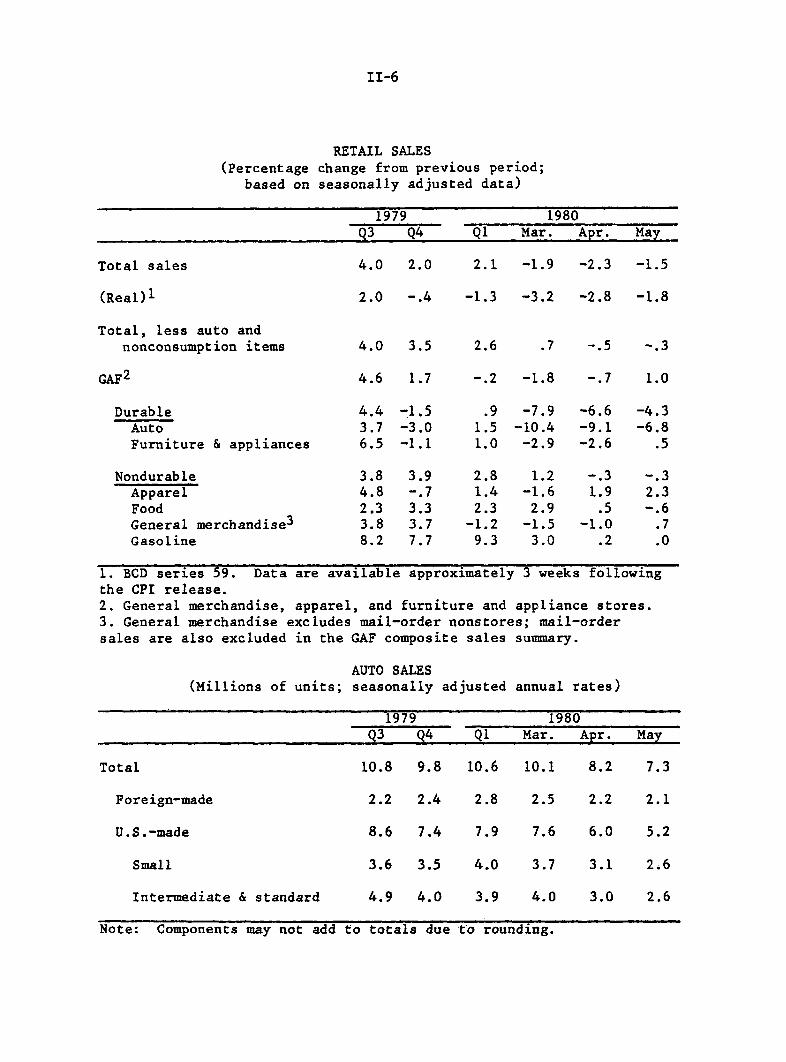
Consumers continued to curtail spending in May. Retail sales
in nominal terms fell 1.5 percent, the fourth consecutive monthly decline.
Since peaking in January, retail sales have fallen 7-1/4 percent in
nominal terms and over 10 percent in real terms--the sharpest four-month
drop on record. Excluding autos and mainly nonconsumption items, nominal
retail sales edged down again in May to about 1 percent below their
January level. A small rebound in GAF outlays in May was more than off-
set by declines in food.
Total unit auto sales in May were at a 7.3 million unit annual
rate, the slowest monthly pace since December 1974; this was down con-
siderably from the 10.6 million unit rate in the first quarter. Despite
extensive incentive programs, sales of domestic units averaged only 5.4
million units from mid-April to mid-June, the lowest selling rate for a
comparable period in nearly two decades. Significant declines have
been recorded for sales of smaller, fuel-efficient models as well as for
larger autos. Sales of imported cars were at a 2.1 million unit rate
in May, down 7 percent from April and well below the record 3 million
unit pace set in January.
The weakness in consumer spending in recent months reflects,
among other things, lower real disposable income, depressed consumer
confidence and, to some extent, the credit restraint program. Personal
income in nominal terms has stagnated since March and has risen only 1
percent since January. Wages and salaries actually declined in April
and May as a result of the large reductions in employment. In real
terms, disposable income dropped substantially in May for the fourth
II-6
RETAIL SALES(Percentage change from previous period;
based on seasonally adjusted data)
1979 1980Q3 Q4 Q1 Mar. Apr. May
Total sales 4.0 2.0 2.1 -1.9 -2.3 -1.5
(Real)1 2.0 -.4 -1.3 -3.2 -2.8 -1.8
Total, less auto andnonconsumption items 4.0 3.5 2.6 .7 -.5 -.3
GAF2 4.6 1.7 -.2 -1.8 -.7 1.0
Durable 4.4 -1.5 .9 -7.9 -6.6 -4.3Auto 3.7 -3.0 1.5 -10.4 -9.1 -6.8Furniture & appliances 6.5 -1.1 1.0 -2.9 -2.6 .5
Nondurable 3.8 3.9 2.8 1.2 -.3 -.3Apparel 4.8 -.7 1.4 -1.6 1.9 2.3Food 2.3 3.3 2.3 2.9 .5 -.6General merchandise 3 3.8 3.7 -1.2 -1.5 -1.0 .7Gasoline 8.2 7.7 9.3 3.0 .2 .0
1. BCD series 59. Data are available approximately 3 weeks followingthe CPI release.2. General merchandise, apparel, and furniture and appliance stores.3. General merchandise excludes mail-order nonstores; mail-ordersales are also excluded in the GAF composite sales summary.
AUTO SALES(Millions of units; seasonally adjusted annual rates)
1979 1980Q3 Q4 Ql Mar. Apr. May
Total 10.8 9.8 10.6 10.1 8.2 7.3
Foreign-made 2.2 2.4 2.8 2.5 2.2 2.1
U.S.-made 8.6 7.4 7.9 7.6 6.0 5.2
Small 3.6 3.5 4.0 3.7 3.1 2.6
Intermediate & standard 4.9 4.0 3.9 4.0 3.0 2.6
Note: Components may not add to totals due to rounding.

II-7
PERSONAL INCOME(Based on seasonally adjusted annual rate data)
Total personal incomeWage and salary
disbursementsPrivate
Nominal disposable personalincome
Real disposable personalincome
19801978 1979 QI Mar. Apr. May
- - Percentage change, at annual rates 1 - -
12.9 11.2 8.5 8.3 -1.7 1.7
12.8 10.114.1 10.8
12.0 t0.4
4.2
10.1 9.0 -6.2 -1.010.9 10.0 -8.8 -3.1
11.5 8.6 -1.4
.5 -2.7 -7.6 -8.8 n.a.
- - Changes in billions of dollars2 - -
Total personal income
Wage and salary disbursementsPrivateManufacturing
Other incomeTransfer payments
Less: Personal contributionsfor social insurance
Memorandum:Personal savings rate3
$17.8 $16.8 $13.9 $14.3
11.510.13.2
7.11.5
.8
4.9
9.7 10.48.4 9.12.0 2.7
8.1 4.3 3.32.9 2.4 2.6
.9 .8 -1.2
4.6 3.7 4.1
$-3.0 $ 3.1
9.8 -6.88.8 -7.82.1 -4.0
-1.1-2.7-3.7
2.9 5.81.4 3.6
-. 9 1.7
4.5 n.a.
I. Changes over periods longer than one quarter are measured from finalquarter of preceding period to final quarter of period indicated. Changesfor quarterly period are compounded rates of changes.2. Average monthly change.3. For months, rate equals the centered three-month moving average ofpersonal savings as a percentage of the centered three-month movingaverage of disposable personal income.

II-8
BUSINESS INVESTMENT SPENDING(Percentage change from preceding comparable period;based on seasonally adjusted data in current dollars)
1980 1980 Ql1979 to
Q1 Apr. May May 1980
Nondefense capital goodsshipments 4.6 1.4 6.0 -3.4 1.7 -1.1
Addenda: Ratio of unfilledorders to shipments(months) 6.42 6.59 6.42 6.67 6.52
Nonresidential construction 5.8 4.2 3.3 1.4 -.6

II-9
consecutive month, bringing the cumulative decline since the beginning
of the year to an estimated 3 percent. During 1979, real disposable
income rose by only 1/2 percent.
Consumer surveys taken in recent months by the Conference
Board and the University of Michigan Survey Research Center reveal very
pessimistic attitudes. Both measures of confidence declined further in
May, and responses to questions concerning market conditions and inten-
tions to buy major appliances, houses, and cars were at record lows.
The Conference Board survey for June, however, reported some improve-
ment in both confidence and buying plans from the depressed May readings.
Business Fixed Investment
Business capital spending weakened markedly in the spring.
Although shipments of nondefense capital goods rose in May, they re-
mained about 1-1/2 percent below the monthly average in the first
quarter. Sales of heavy-weight trucks, which had been on a plateau
since the fall of 1979, dropped sharply in April and May; the May
selling rate was about one-third below the first quarter pace, and
lower than in the 1973-75 recession. Finally, the value of nonresiden-
tial construction activity declined in May and now stands about 2-1/2
percent below the first quarter average.
Near-term commitments data suggest that investment spending
will continue to weaken in the coming months. New orders for nondefense
capital goods dropped about 9 percent in May after a 2 percent decline
in April. Since peaking in January, such bookings have dropped more
than 15 percent in nominal terms; the drop in May was primarily accounted
for by a sharp decline in orders for aircraft and parts, which are
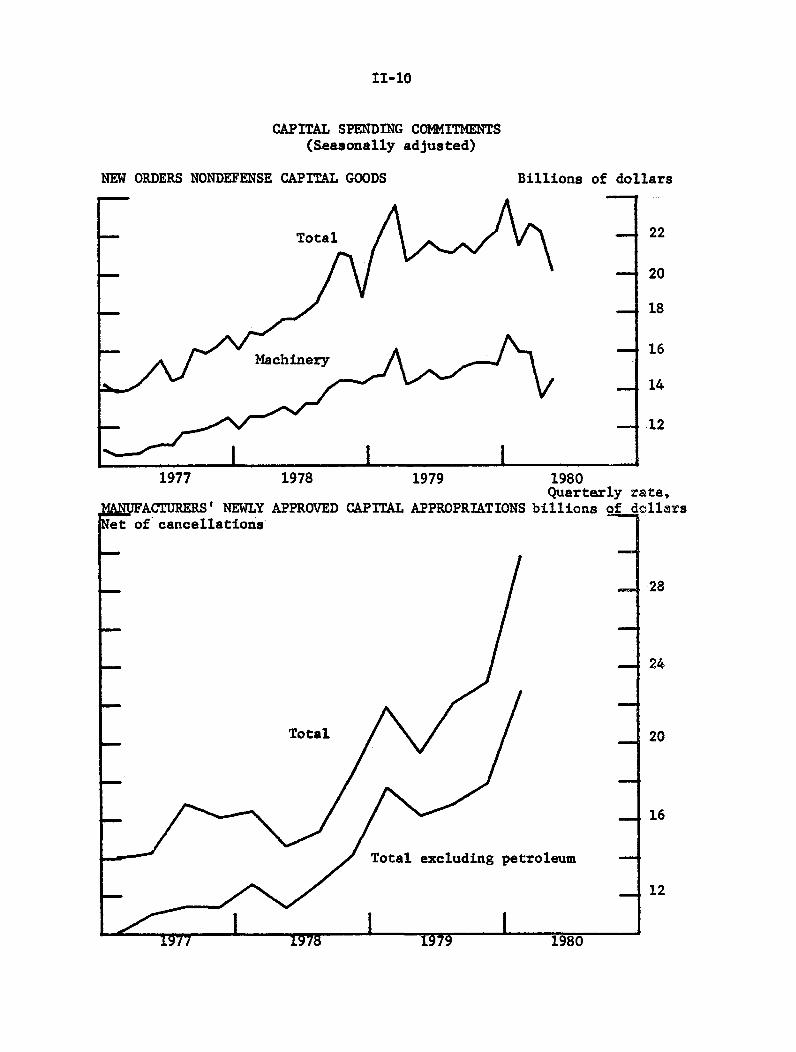
II-10
CAPITAL SPENDING COMMITMENTS(Seasonally adjusted)
NEW ORDERS NONDEFENSE CAPITAL GOODS Billions of dollars
22
20
18
16
14
12
1977 1978 1979
MANUFACTURERS' NEWLY APPROVED CAPITAL APPROPRIATIONSof cancellations
Total
petroleum

II-11
quite volatile. Machinery bookings rebounded in May following a very
large fall in April. Contracts for commercial and industrial building
and nonbuilding construction also fell further in May from the depressed
April level; such contracts have been trending down since early 1979.
Recent surveys of capital spending plans give differing
indications of the future course of outlays. Capital appropriations of
large manufacturers, net of cancellations, rose 28 percent in the first
quarter--one of the biggest increases on record. In contrast, the
Commerce Department May survey of plant and equipment spending, which
tends to be a much better indicator of actual spending, reported that
businesses expect to increase spending by 9.9 percent in 1980, down
from 11.1 percent in the February survey andwell below the 15 percent
spending gain recorded in 1979. The latest Commerce reading suggests
that there will be a significant slowing in the growth of nominal
capital outlays during the last three quarters of 1980 and a decline in
real terms.
Inventory Investment
The book value of manufacturers' inventories in May rose at a
$7 billion annual rate, but this followed an exceptionally large build-
up in April. The increase in total manufacturers' inventories was
accompanied by a 1-1/4 percent further decrease in shipments. As a
result, the stock-sales ratio for all manufacturers rose further, from
1.69 in April to 1.71 in May.
In April, the book value of total manufacturing and trade
inventories increased at a $70 billion annual rate, well above the
average pace during the first quarter. On a constant dollar basis,

II-12
COMMERCE SURVEY OF PLANT AND EQUIPMENT EXPENDITURES(Percent change from prior year)
1979 Planned for 1980February May
All Business 15.1 11.1 9.9
Manufacturing 16.7 14.3 13.5
Durables 20.7 16.8 12.8
Nondurables 13.1 12.0 14.1
Nonmanufacturing 13.9 8.6 7.0
Mining 16.4 11.5 11.1
Transportation 25.7 16.3 8.2
Utilities 10.5 3.5 1.1
Communications, Commercial 13.8 10.0 10.2and other
ERROR HISTORY OF THE MAY COMMERCE DEPARTMENT SURVEY(Percent change from prior year)
Year Anticipated Actual Errorl
1970 7.8 5.5 2.31971 2.7 1.9 0.81972 10.3 8.9 1.41973 13.2 1. 8 0.41974 12.2 12.7 -0.51975 1.6 0.3 1.31976 7.3 6.8 0.51977 12.3 12.7 -0.41978 11.2 13.3 -2.11979 12.7 15.1 -2.4
1. Anticipated minus actual percent change.

II-13
CHANGES IN MANUFACTURING AND TRADE INVENTORIES(Annual rate)
1976 1977 1978 1979 1980Q1 April May
Book Value Basis
Total 25.7 26.7 43.2 47.2 46.1 70.2 n.a.Manufacturing 12.0 10.1 18.1 29.9 41.1 48.2 7.0Wholesale 6.2 6.7 12.8 9.1 7.2 7.2 n.a.Retail 7.5 9.9 12.3 8.1 -2.1 14.8 n.a.
Constant Dollar Basis
Total 8.3 11.6 12.8 7.7 -1.8 17.5 n.a.Manufacturing 2.6 4.2 5.3 7.2 5.3 14.3 n.a.Wholesale 2.8 2.8 4.2 1.0 0.2 1.4 n.a.Retail 2.8 4.8 3.2 -0.5 -7.3 1.9 n.a.
Totals may not add due to rounding.
INVENTORIES RELATIVE TO SALES(1972 dollars)
Manufacturing and Trade
RatioS1.8
-1.7
S1.6
II-14
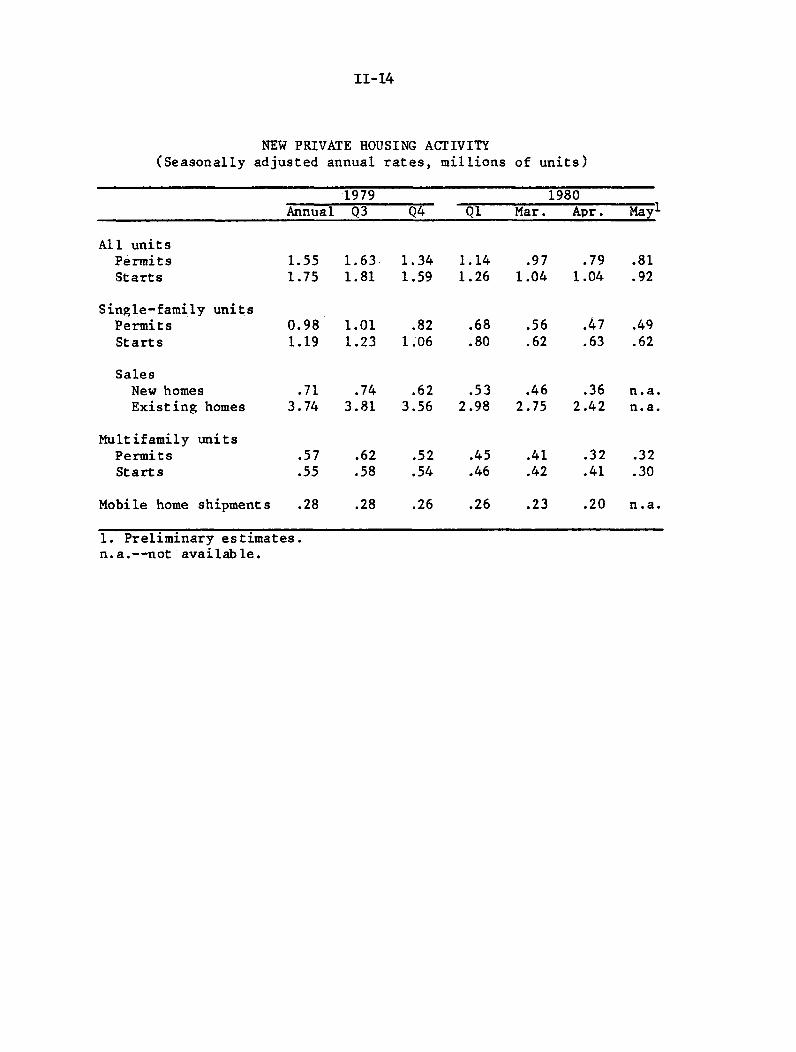
NEW PRIVATE HOUSING ACTIVITY(Seasonally adjusted annual rates, millions of units)
1979 1980Annual Q3 Q4 Q1 Mar. Apr. May 1
All unitsPermits 1.55 1.63 1.34 1.14 .97 .79 .81Starts 1.75 1.81 1.59 1.26 1.04 1.04 .92
Single-family unitsPermits 0.98 1.01 .82 .68 .56 .47 .49Starts 1.19 1.23 1.06 .80 .62 .63 .62
SalesNew homes .71 .74 .62 .53 .46 .36 n.a.Existing homes 3.74 3.81 3.56 2.98 2.75 2.42 n.a.
Multifamily unitsPermits .57 .62 .52 .45 .41 .32 .32Starts .55 .58 .54 .46 .42 .41 .30
Mobile home shipments .28 .28 .26 .26 .23 .20 n.a.
1. Preliminary estimates.n.a.--not available.

II-15
there was a large accumulation following a slight liquidation during
the first quarter as a whole. Most of the April increase on a constant
dollar basis was at manufacturing, although trade inventories also rose
following a substantial decline in the first quarter. The overall
advance in real stocks in April was accompanied by an unusually large
2-1/2 percent drop in the real value of shipments and sales. As a
result of these movements, the constant-dollar stock-sales ratio for
manufacturing and trade rose sharply to 1.7--a level corresponding to
that reached in late 1974. Increases in stocks relative to sales were
widespread across industries, with particularly sharp rises for auto-
motive products at the retail level and for durable goods at manufac-
turing.
Residential Construction
In May, residential construction activity continued to be
depressed by both real and financial constraints cumulated in prior
months. However, there are tentative indications that the cyclical
decline in housing activity may be near the bottom, although the
recovery is likely to be sluggish. Qualitative reports suggest some
improvement in buyer interest in new homes in May, and there are early
reports of a rise in building permits in June.
In May, total private housing starts fell 11-1/2 percent to a
seasonally adjusted annual rate of 920,000 units--one of the lowest
monthly rates of the postwar period. By May, housing starts had dropped
somewhat more than one-half since mid-1978, nearly matching the reduc-
tion that occurred during the 1973-75 period. The May decline was
concentrated in the multifamily sector, where starts fell nearly 25

II-16
PRIVATE HOUSING STARTS(Seasonally adjusted annual rate)TotalSingl
Millions of units2.4
2.0
1.6
1.2
.e-family
.8
Multifamily.4
I I111 1111 111111111111 I 0
1978 1979
5
1976 1977 1980

II-17
percent to a 304,000 unit rate. Single-family starts were at a depressed
616,000 unit pace, one of the lowest levels since the inception of the
series in 1959.
Sales of single-family houses fell 13 percent in April--the
seventh consecutive month of decline, as demand weakened in response to
tight financial conditions, sluggish personal income growth, and
probably somewhat diminished expectations of capital gains in response
to smaller house price increases. New-home sales dropped 21 percent in
April to their lowest level since 1966. Sales of existing houses, which
had fallen 12 percent in April, declined 5 percent further in May.
The average price of new houses sold in April was only 4 per-
cent higher than a year earlier, possibly reflecting purchases of lower
priced units as well as reduced demand pressures. The average price
of existing homes sold in May was 11 percent above a year earlier
compared with the almost 20 percent year-over-year rise posted last
summer.
Even though the declines in new-house sales through April
spurred some production cutbacks, inventories of unsold new units
remained high relative to the dwindling volume of sales. At the end
of April, builders had a 12 months' supply on hand--the largest stock-
to-sales ratio on record. In the multifamily sector, rental markets
have remained relatively tight by historical standards; hence, unlike
the 1974-75 period, no significant supply overhang exists.
Federal Government Sector
The federal deficit in the second quarter is now estimated by
the staff to have been nearly $45 billion (NIPA basis), up almost $22

II-18
billion from the previous period. The increase in the deficit was
primarily the result of a slowdown in receipts due to a fall-off in
corporate profits tax accruals and slower growth of withheld personal
taxes. While the rise of federal expenditures moderated somewhat from
the first quarter's rapid pace, spending for defense, unemployment
compensation, and public debt interest remained quite strong.
In response to upward pressures on the deficit, Congress
passed a revised budget resolution in mid-June that calls for a $47
billion unified deficit for fiscal year 1980, up from last fall's $30
billion estimate. For fiscal year 1981, Congress--after rejecting the
administration's oil import fee proposal--agreed to a resolution calling
for a $200 million surplus. The Congressional budget projection,
however, is based on economic assumptions that were formulated early
last spring before the severity of the current downturn was recognized.
Moreover, the Congressional estimates did not contain any provision for
a fiscal year 1981 tax reduction.
State and Local Government Sector
State and local government spending slowed this spring due to
further cutbacks in investment outlays that were only partly offset by
increases in payrolls. Investment outlays, as measured by the value of
construction put in place, fell 5 percent seasonally adjusted in May--
the fourth consecutive monthly decline--to a level nearly 20 percent
below the January peak. In contrast, preliminary data indicate that
May payroll employment increased by about 40,000 despite a 5,000 decrease
in CETA public service employment. The May hiring increase is the
largest monthly advance in nearly a year and brings the sector's

II-19
employment gain thus far this year to a 1.4 percent annual rate--about
the same as in 1979.
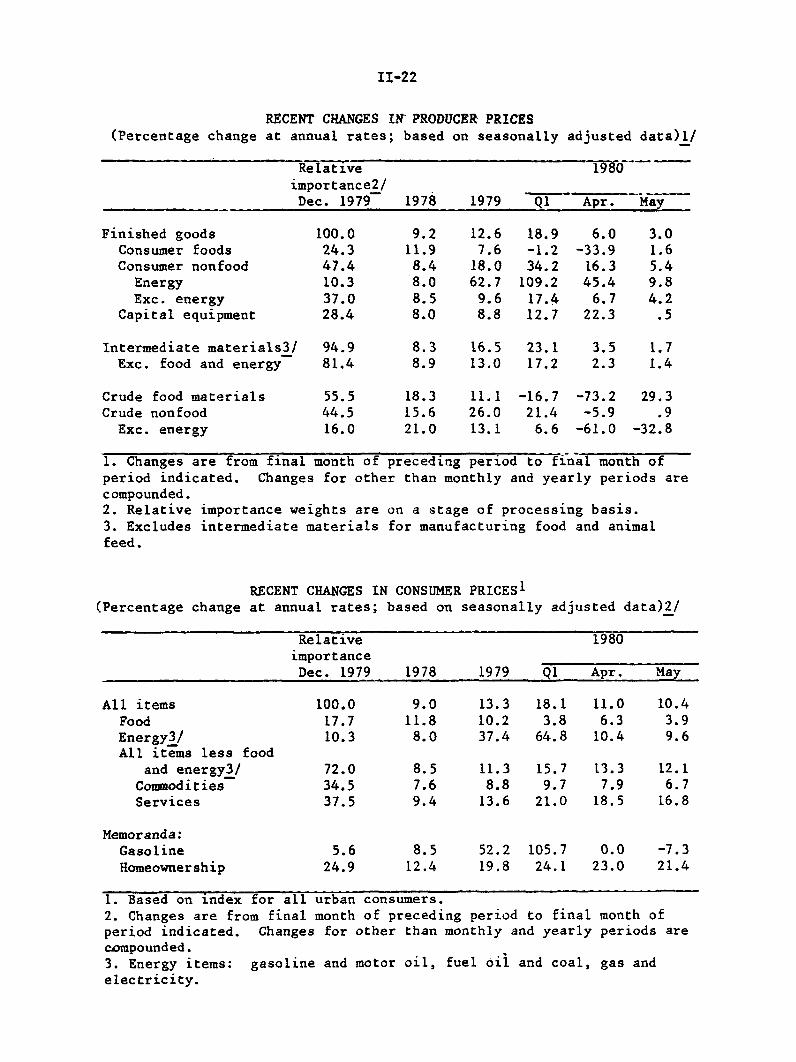
Prices and Wages
Favorable supply conditions in the food and energy areas con-
tributed to an easing in inflation during April and May. Consumer
prices rose at an annual rate of about 11 percent in those months, com-
pared with the 18 percent rate increase during the first quarter. In-
creases in producer prices of finished goods decelerated even more
sharply, increasing at only a 3-1/2 percent annual rate in May after
nearly a 19 percent rate rise over the first quarter.
At the consumer level, food prices rose at a moderate pace
over the first five months of the year, as declines in meat prices
offset much of the increase in other categories. However, livestock
prices have turned up in recent weeks, particularly for hogs, and
livestock supply prospects for the second half of the year appear less
favorable than in the first half.
Since March, there has been a striking slowdown in price in-
creases for gasoline and fuel oil and, as a result, for the energy
components of the aggregate indexes. Demand for gasoline continued to
fall during the spring, and inventories of petroleum products have
risen to record high levels. Consequently, consumer prices of petroleum
products have leveled off after climbing about 80 percent from the end
of 1978 through the first quarter of 1980.
However, the oil price increases recently announced by OPEC
and the continued decontrol of domestic crude oil suggest that the
current respite from energy inflation may be only temporary. Moreover,

II-20
excluding food and energy items, consumer prices continued to rise
rapidly in April and May. Homeownership costs rose sharply further,
reflecting large increases in house prices and the lagged effects of
increases in mortgage commitment rates that occurred in early 1980.
Moreover, recent FHLBB data indicate that the mortgage interest compo-
nent of the CPI will be still higher in June; but recent declines in
mortgage commitment rates should begin to have some effect after mid-
year.
At the producer level, prices of capital equipment in May
were unchanged, following a very large increase in April. Prices of
nonfood, nonenergy materials at the intermediate processing stage have
changed little in recent months and have come down sharply at the crude
processing level. Much of the slowing in intermediate materials reflects
declines in prices of nonferrous metals, in part a reversal of the
speculative bulge early this year. The downturn in overall economic
activity also appears to be a factor in some of these as well as other
markets, notably lumber. Price declines at the crude level in May were
dominated by reductions in scrap metal prices, also a result of weaker
business activity. Since the mid-May PPI pricing date, commodity market
data indicate further declines, particularly for scrap metal and lead.
Wages for nonfarm production workers as measured by the index
of average hourly earnings rose 7.4 percent at an annual rate in May.
Thus far in 1980, the index has risen at an 8.7 percent rate, somewhat
higher than last year's pace. Wage adjustments in the manufacturing
sector, where cost of living escalator clauses are the most prevalent,

II-21
have accelerated to a 10 percent annual rate. On average, however,
wage rate increases since early 1979 have continued to be moderate
relative to the rapid rise in consumer prices.
II-22
RECENT CHANGES IN PRODUCER PRICES(Percentage change at annual rates; based on seasonally adjusted data) 1/
Relativeimportance2/Dec. 1979
1980
1978 1979 Q1 Apr. May
Finished goodsConsumer foodsConsumer nonfoodEnergyExc. energy
Capital equipment
Intermediate materials3/Exc. food and energy
Crude food materialsCrude nonfood
Exc. energy
100.024.347.410.337.028.4
94.981.4
55.544.516.0
9.211.98.48.08.58.0
12.67.6
18.062.7
9.68.8
18.9-1.234.2
109.217.412.7
6.0-33.9
16.345.4
6.722.3
3.01.65.49.84.2
.5
8.3 16.5 23.1 3.5 1.78.9 13.0 17.2 2.3 1.4
18.315.621.0
11.126.013.1
-16.721.4
6.6
-73.2-5.9
-61.0
29.3.9
-32.8
1. Changes are from final month of preceding period to final month ofperiod indicated. Changes for other than monthly and yearly periods arecompounded.2. Relative importance weights are on a stage of processing basis.3. Excludes intermediate materials for manufacturing food and animalfeed.
RECENT CHANGES IN CONSUMER PRICES 1(Percentage change at annual rates; based on seasonally adjusted data)2/
Relative 1980importance
Dec. 1979 1978 1979 Q1 Apr. May
All items 100.0 9.0 13.3 18.1 11.0 10.4
Food 17.7 11.8 10.2 3.8 6.3 3.9Energy3/ 10.3 8.0 37.4 64.8 10.4 9.6All items less food
and energy3/ 72.0 8.5 11.3 15.7 13.3 12.1Commodities 34.5 7.6 8.8 9.7 7.9 6.7Services 37.5 9.4 13.6 21.0 18.5 16.8
Memoranda:Gasoline 5.6 8.5 52.2 105.7 0.0 -7.3Homeownership 24.9 12.4 19.8 24.1 23.0 21.4
1. Based on index for all urban consumers.2. Changes are from final month of preceding period to final month ofperiod indicated. Changes for other than monthly and yearly periods arecompounded.3. Energy items: gasoline and motor oil, fuel oil and coal, gas andelectricity.

II-23
HOURLY EARNINGS INDEX 1(Percent change at compound annual rates;
based on seasonally adjusted data)2
19803 3 -- 3 ~ ------
1978 19793 Q1 Apr. May
Total private nonfarm 8.4 8.1 9.7 5.4 7.4
Manufacturing 8.4 8.8 9.7 10.5 9.9Durable 8.5 8.6 10.5 10.0 9.4Nondurable 8.2 9.2 8.3 11.3 10.8
Contract construction 7.4 6.7 5.6 .6 2.6Transportation and
public utilities 7.4 9.1 7.8 5.6 6.4Total trade 9.5 7.6 12.1 2.2 7.3Services 7.6 7.7 9.5 2.9 8.6
1. Excludes the effect of interindustry shifts in employment and fluctua-tions in overtime pay in manufacturing.2. Changes for other than monthly and yearly periods are compounded.3. Changes are from final quarter of preceding period to final quarter ofperiod indicated, except monthly changes which are from preceding month.

III-T-1SELECTED DOMESTIC FINANCIAL DATA
Latest data Net Change fromIndicator Month Three Year
Period Level ago months ago ago
$ billions Percent at annual rates
Monetary and credit aggregates 1
Total reserves June 43.4 -0.7 0.9 6.3Nonborrowed reserves June 43.0 18.6 25.5 9.3Money supplyM-1A June 372.2 14.4 -1.0 3.6M-1B June 391.8 17.4 0.6 4.8M-2 June 1584.2 17.2 8.1 8.1M-3 June 1841.8 12.1 7.1 8.6
CB gross time and savings deposits June 691.7 -1.2 6.8 10.5Total thrift deposits (S&Ls + MSBs+ Credit Unions) June 681.8 9.0 6.8 5.7Bank credit June 1158.2 -5.6 -2.4 8.1
Net Change from:Latest data Three
Percent Month months YearPeriod or index ago ago ago
Market yields and stock pricesFederal funds wk. endg. 6/25/80 9.08 -.38 -8.70 -1.24Treasury bill (90 day) " " 6/25/80 7.12 -.55 -8.49 -1.73Commercial paper (90-119 day) " " 6/25/80 8.08 -.14 -8.73 -1.60New utility issue Aaa " " 6/27/80 10.88 -.64 -3.34 1.45Muncipal bonds (Bond Buyer) 1 day 1 day 6/26/80 7.76 .04 -1.68 1.64FNMA auction yield (FHA/VA) 6/30/80 12.28 -.31 -3.65 1.54Dividend price ratio (common stocks) wk. endg. 6/25/80 5.29 -.53 -1.02 -.23NYSE index (12/31/65-50) end of day 6/30/80 65.34 1.90 7.69 6.96
Net Change or Gross OfferingsLatest Year Year to date
Period data ago 1980 1979
Credit demandsBusiness loans at commercial banks1
Consumer instalment credit outstanding1
Mortgage debt outstanding (major holders)1 2
Corporate bonds (public offerings)Municipal long-term bonds (gross offerings)Federally sponsored agcy. (net borrowing)U.S. Treasury (net cash borrowing)
MayAprilAprilMayJuneMayMay
-3.1-2.0
3.86.7e5.8e1.7e5.4
3.4 7.6 19.94.1 3.1 14.47.9 24.4 33.72.0 16.4e 9.54.7 23.2e 21.31.1 14.1e 9.61.8 29.1 7.5
I/ Seasonally adjusted.T/ Includes comm'l banks, S&Ls, MSBs, life ins. cos, FNMA and GNMA.e - Estimated.

DOMESTIC FINANCIAL DEVELOPMENTS
The narrow monetary aggregates strengthened considerably in June,
but remain low relative to the FOMC's longer-run ranges for 1980. Open
market operations have been accommodative in the period since the
May 20 FOMC meeting, providing enough nonborrowed reserves to hold dis-
count window adjustment borrowing at frictional levels. The federal
funds rate has declined about 1-1/2 percentage points to a range of
8-1/2 to 9-1/2 percent, while the discount rate was lowered in two equal
steps from 13 to 11 percent.
Market interest rates generally fell substantially following the
May meeting and then retraced much of their decline. On balance, most
private short-term market interest rates have dropped roughly 1 percent-
age point while corporate bond yields have declined about 1/2 percentage
point. Yields on Treasury securities have shown much smaller declines.
Municipal bond yields, in contrast, increased about 30 basis points over
the intermeeting period. Administered rates such as bank prime rates and
home mortgage rates recently have fallen relatively sharply; still, they
remain at large spreads above yields on market instruments of comparable
maturity.
Business borrowing appears to have strengthened since April but
has remained below the first quarter pace. Such borrowing was heaviest
in the bond market, as corporations responded to the drop in yields by
moving to lengthen the maturity of their outstanding debt. Reflecting
also the relative rate structure for short-term borrowing, sharp de-
clines in business loans at banks were essentially offset by a surge
in the growth of commercial paper.
III-1

III-2
SELECTED FINANCIAL MARKET QUOTATIONS(Percent)
1979L 1 19801 Change from:FOMC Mar-Apr FOC Intermeeting Mar-Apr FOMC
Oct. 5 High May 20 Lowv** July 1 High May 20
Short-term rates
Federal fuds2
Treasury bills3-month6-month1-year
Comercial paper1-month3-month6-month
Large negotiable1-month3-mouth6-moanth
11.91 19.39 10.T1 8.99 9.46p -9.93 -1.25
CDa 3
10.7010.6310.28
11.7311.8611.84
12.0912.5012.80
16.0015.6414.58
18.0017.6917.25
17.8718.5918.47
8.298.318.38
9.719.629.38
9.849.839.80
6.186.607.00
7.987.787.59
7.967.907.66
8.047.987.96
8.858.508.38
8.638.658.84
-7.96-7.66-6.62
-9.15-9.19-8.87
-9.24-9.94-9.63
-.25-. 33-.42
-.86-1.12-1.00
-1.21-1.18-.96
Eurodollar deposit 2
1-month3-month
Bank prime rate
Intermediate- and long-term rates
U.S. Treasury(constant maturity)
3-year10-year30-year
Municipal 4(Bond Buyer)
Corporate AaaNew issue5
Recently offered6
Primary conventionalmortgagee 6
12.45 19.04 10.26 8.88 9.30 -9.74 -.9612.79 19.60 11.09 8.99 9.61 -9.99 -1.48
13.50 20.00 16.50 12.00 12.00 -8.00 -4.50
10.019.609.36
6.64
14.5313.65*12.85*
9.44
9.2310.2210.47
8.569.479.49
9.23p10.12p10.14p
-5.30-3.53-2.71
7.44 7.44 7.76 -1.68
10.22 14.22 11.43 10.53 10.88p -3.3410.25 14.12 11.65 10.79 11.03p -3.09
11.35 16.35 14.15 12.35 12.35
0-.10-. 33
.32
-.55-.62
-4.00 -1.80
FOMC Mar-Apr F Intermeting Mar-Apr FOMC
Oct. 5 Low May 20 ighs July 1 Lo May 20
Stock pricesDow-Jones Indaqaeri 897.61 759.13 832.51 881.91 872.27 113,14 39,76NYSE Composite 63.39 55.30 61.35 66.36 65.73 10.43 4.38AMEg Composte 235.15 215.69 259.73 297.60 297.60 81.91 37.87NASDAQ (OTC) 152.29 124.09 146.93 159.18 158.17 34.08 11:24
1. One-day quotea except as noted.2. Averages for statement week clodest to d3. Secondary market.4. One-day quotee for preceding Thursday.5. Averages for preceding week.1. One-day quotes for preceding Friday.*--Highs reached on February 26.**-Most lovw occurred on or around June 13.
ate showa.
III-3
Governments have been placing substantial demands on the credit
market. Municipal bond offerings continued sizable in May and June,
bolstered by heavy issuance of housing revenue bonds. With a runoff in
its nonmarketable debt and a need to increase its cash balance, Treasury
marketable borrowing also has been heavy on a seasonally adjusted
basis. In May and June, the Treasury raised large amounts of new money
both in the coupon sector and in the regular bill cycles to offset a
substantial volume of maturing cash management bills.
Household sector borrowing, in contrast, has continued very weak.
Reflecting declining real incomes, sharp increases in finance charges,
and less accommodative credit standards, consumer credit outstanding
contracted sharply in April and May; it appears to have weakened further
in June. Mortgage lending activity also declined further in May and
evidently remained sluggish in June, with the drop in mortgage rates
apparently eliciting only a little additional demand for loan commit-
ments to date.
Monetary Aggregates and Bank Credit
Following a sharp drop in April, M-lA grew at a 3/4 percent
annual rate in May and then expanded at a 14-1/2 percent annual rate
in June. The progressive strengthening of M-1A reflected a rebound in
the expansion of currency beginning in May and a resumption of growth
in demand deposits during June after three monthly declines. M-1B
grew, on balance, at roughly the same pace as M-1A over the May-June
period. Even with the recent resurgence, the contraction of the narrow
money stock measures for the second quarter as a whole was virtually
unprecedented, and although nominal GNP apparently was little changed,

III-4
MONETARY AGGREGATES(Based on seasonally adjusted data unless otherwise noted) 1
i_ g19n8 June '79Co
Q4 Qlp Q2 Apr. May- Junee June'80
-- Percentage change at annual rates ---
Money stock masures1i. -LA2. M-133. M-24. M-3
Selected coaponents5. Currency6. Demand deposits7. Other checkable deposits, NSA 2
8. M-2 minus M-1B (9+10+11+14)9. Overnight ePs and Eurodollars, NSA 3
10. Money market autual fund shares, ISA11. Commercial banks12. savings deposits13. small time deposits14. Thrift institutions15. savings deposits16. small time deposics17. Large time deposits18 at comercial banks, neet19. at thrift institutions20. Term RPs, NSA
MEMORANDA:21. Managed liabilities at comercial
banks (22+23)22. Large time deposits, gross23. ondeposit funds24. Net due to related foreign
institutions, NSA25. Other 5
26. U.S. government deposits atcomercial banks 6
8.52.9
12.67.8
-33.1120.0
8.6-16.5
32.13.7
-26.022.328.320.290.8
-16.0
8.33.4
29.37.6
-7.5149.9
6.9-19.329.1-0.4
-22.711.917.3
9.572.6
-33.2
-3.5-2.1
5.45.5
7.4-8.031.8
7.9-75.1
79.49.8
-22.633.9
3.7-28.6
20.110.0
6.831.3
-20.9
-17.7-14.1
-1.90.5
1.1-25.4
66.72.2
-209.84.0
14.1-43.3
54.41.9
-45.425.018.315.928.2-8.9
0.7-1.2
9.18.6
12.1-4.2
-37.912.088.795.0
5.6-7.514.1
7.0-21.5
19.86.72.4
34.4-4.5
-Average monthly change in billions of dollars-
-1.62.0
-3.6
8.0 n.a. -6.03.1 0.0 3.24.9 n.a. -9.2
-2.01.7
-3.7
-2.5 1.6 n.a. -6.0 -3.8-1.1 3.2 n.a. -3.1 0.1
-1.0 -0.2 0.3 1.1 0.8
1. Quarterly growth races are computed on a quarterly average basis.2. Consists of ATS aad. Ol balances at all institcuions, credit union share draft balances, anddemand deposits at mutual savings banks.3. Overnight and continuing contract IPs issued to the nonbank public by commercial banks,net of amounts held by'oney market mutual funds, plus overnight Eurodollar deposits issued byCaribbean branches of U.S. member banks to U7.. noObank customers.4. Net of laege denomination time deposits held by money market mutual funds and thriftinstitutions.5. Consists of borrowings from other than commercial banks in the form of federal funds purchased,securities sold under agreements to repurchase and'othei litilitiies'fbr orrbwed'mboey (includingborrowings from the Federal Reserve), loans sold to affiliates, loans RPs, and ocher minor itms.
6. Consists of Treasury demand deposits at comercial banks and Treasury-note balances.e--estimated. n.a.--not available p-prel iinary.
14.417.417.212.1
10.915.478.317.7
-16.5141.3
11.232.9-3.1
8.46.79.5
-25.6-29.5
-2.344.8
9.11.3
34.29.2
-26.4197.2
9.3-12.5
30.73.3
-18.617.316.810.061.0
-14.2
n. a.n.a.
-4.9 2.2n.a. n.a.
n.a. n.a.n.e. n.a.
-1.0 -0.1

III-5
the public's demand for cash balances was exceptionally weak in light
of the substantial decline in interest rates.
With its nontransactions component also showing a progressive
acceleration in May and June, the broader M-2 measure was considerably
stronger than the narrow aggregates over the past quarter. This
strength may be a reflection of the increase in personal saving that
has occurred in recent months. The pattern of asset growth also seems
consistent with a desire on the part of households to bolster their
liquidity in light of the prevailing economic uncertainties--or at least
to avoid longer-range financial commitments until the implications of
recent interest rate declines for investment alternatives are more fully
assessed.
Inflows to money market mutual funds were extraordinarily large
in May, running $2 billion and more per week, and they tapered down
only to $1-1/4 billion per week by late June. 1 Most of the growth was
recorded by the "first generation" funds, many of which reopened their
doors to new investors in early May. Such funds have continued to
report yields well in excess of the rates offered by money market
instruments or by money market certificates (MMCs) at banks and thrifts.
At depository institutions, savings accounts have strengthened as
inflows to consumer-type time deposits have slackened. Indeed, at com-
mercial banks, savings deposits are estimated to have registered growth
in excess of 30 percent at an annual rate in June, while small time
deposits contracted. The resumption of net inflows into saving deposits
1. See Appendix A.

III-6
may be attributable in part to the sharply decreased spread between
market yields and passbook rates. Moreover, it seems likely that there
also is an appreciable element of the liquidity preference noted above.
Within the small time deposits component, 2-1/2 year small saver
certificates (SSCs) have replaced MMCs as the area of growth. With an
upward sloping yield curve, many investors apparently are choosing to
lock in the higher yields that recently have been available on SSCs. 1
In May, SSCs expanded by $13.7 billion, while outstanding MMCs fell
$8.3 billion, registering their first monthly decline since they were
authorized. Although in June the regulatory ceilings on MMCs and SSCs
exceeded the yields on U.S. government securities of similar maturities,
institutions reportedly are still paying the ceiling rates, and the
pattern of strength in SSCs and weakness in MMCs evidently is continuing.
Total bank reserves declined slightly in May and June, continuing
the slowdown that began in April; however, nonborrowed reserves increased
at a 14-1/2 percent annual rate in May and at an 18-3/4 percent pace in
1. Recent DIDC actions established the nominal MMC ceiling at banks asthe higher of 7.75 percent or the 6-month bill yield plus 25 basispoints. At thrifts the MMC nominal ceiling is the higher of 7.75 percentor the bill yield plus 50 basis points up to an 8.50 percent bill yield;it is 9 percent when bills yield between 8.50 and 8.75 percent; and itis the bill yield plus 25 basis points when bill yields are 8.75 percent
or more. The SSC ceiling is the yield on 2-1/2 year government obliga-tions for thrifts and 25 basis points less for banks; the minimum ceil-ing on the 2-1/2 year account is 9-1/4 percent and 9-1/2 percent at
banks and thrifts, respectively. The "cap"-12 percent for thrifts and11-3/4 percent for banks-remains unchanged. For the last two weeks ofJune, (compounded) ceilings for MMCs and SSCs were 8.01 and 9.83 percent,
respectively, at commercial banks and 8.01 and 10.11 percent at thriftinstitutions.

III-7
June. Given the more ample provision of nonborrowed reserves and a fall-
off in the special assistance to First Pennsylvania Bank, total borrow-
ing at the discount window in recent weeks has fallen to as low as $300
million compared to about $2-1/2 billion per week in April.
Bank credit dropped for the second consecutive month in May.
Loans contracted at a 14-1/4 percent annual rate--the largest monthly
decline reported in 31 years--more than offsetting a rebound of invest-
ment holdings. Business and consumer loans fell sharply, and growth in
real estate lending remained near previous cyclical lows. Loans weakened
at both large and small banks. 1 Based on early reports, total loans are
estimated to have declined at an 11 to 12 percent annual rate in June.
Managed liabilities fell $2 billion in May, continuing the April
decline. The net reduction reflected lower net Eurodollar borrowings,
which more than offset increases in large time deposits. All components
of managed liabilities appear to have declined in June. The 7-1/2 per-
cent increase in the base for calculating marginal reserve requirements,
effective in late May, contributed to a $7-1/2 billion reduction in
liabilities subject to such requirements.
1. Through May, total loans at largely agricultural banks are estimatedto have fallen a little more than 1 percent (NSA) since the beginning ofthe year, compared with an increase of 4-1/4 percent over the same periodin 1979. Partly because of this reduced loan demand, the severe liquiditypressure that many midwestern agricultural bankers had expected to occurduring the spring planting season did not materialize. As of mid-June,while a total of 117 banks had established aggregate credit lines of $105million under the Federal Reserve's Temporary Seasonal Credit program,only four banks had borrowed a total of $1 million.

III-8
COMMERCIAL BANK CREDIT AND SHORT- AND INTERMEDIATE-TERM BUSINESS CREDIT(Percentage changes at annual rates, based on seasonally adjusted data) 1
1. Total loans and investmentsat banks2
2. Investments
3. Treasury securities
4. Other securities
5. Total loans2
6. Business loans
7. Security loans
8. Real estate loans
9. Consumer loans
1979
Q3 Q4 Q1
----- Comercial
15.8 3.4 11.5
8.5 3.5 7.3
1.7 -5.9 3.0
12.1 8.3 9.4
18.2 3.4 12.8
22.7 6.0 16.4
8.7 -88.5 -32.8
14.7 14.2 11.9
7.5 5.5 3.7
1o0 n ay. '79e to
Mar. Apr. May. M
Bank Credit -------
2.6 -4.3 -5.6
2.1
-3.8
4.9
2.7
5.9
-61.0
9.2
0.0
-4.5
-16.5
1.2
-4.2
-5.1
-21.4
2.4
-14.3
20.7
19.3
21.4
-14.3
-12.3
-43.6
2.4
-23.1p.e.
ay. '80«
8.1
6.9
0.6
10.1
8.5
11.6
-30.6
12.2
1.9j. e.
- Short- and Intermediate-Term Business Credit -
10. Total short- and inteimediate-term business credit (sum oflines 13,14 and 15)
11. Business loans net orbankers acceptances1
12. Comaercial paper issued bynonfinancial firas3
13. Sun of lines 11 & 12
14. Finance company loans tobusiness4
15. Total bankers acceptancesoutstanding4
27.4 6.4 22.0 15.6 0.3r n.a.
21.7 6.3 17.6 10.6 -4.9 -14.6
69.7
25.7
15.5
7.0
76.2
23.1
80 5 37.7
17.6 -0.4
119.7
0.0
9.4 4.0 -2.8 3.4 0.0 n;a.
74.9 4.6 54.1 19.7 4.8r n.a.
n.a.
11.6
68.9
16.3
n.a.
n.a.
1. Average of Wednesdays for domestic chartered banks and average of current and preced-ing ends of months for foreign-related institutions.2. Loans include outstanding amounts of loans reported as sold outright to a bank's ownforeign branches, unconsolidated nonbank affiliates of the bank, the bank's holdingcompany (if not a bank), and unconsolidated nonbank subsidiaries of the holding company.3. Average of Wednesdays.4. Based on average of current and preceding ends of months.e-estimated. n.a.-not available. p.e.-preliminary estimate. r-revised.

III-9
Business Finance
Business financing needs appear to have expanded recently, as the
slowing of economic activity has reduced profits and increased inventory
accumulation. To meet these needs, businesses apparently continued to
run down liquid asset holdings acquired in the first quarter. In addi-
tion, firms stepped up their external financing activity relative to
April. This borrowing was concentrated in commercial paper and bond
markets as the relatively high cost of bank credit induced businesses
to shift their credit demands elsewhere.
Reductions in the prime rate are continuing to lag those in
market interest rates. In May, the spread between the prime rate and
the rate on commercial paper widened to an unprecedented 7-1/4 percen-
tage points. More recently, this spread has narrowed to about 3 percen-
tage points but is still large by historical standards. Even with the
substantial portion of short-term loans made below prime-apparently con-
centrated in very short maturity credits at money center banks-the
average effective rate on business loans in early May was still well
above the commercial paper rate according to the Survey of Terms of
Bank Lending. Thus, net issues of commercial paper by nonfinancial
firms surged to a record $4.2 billion in May and continued to expand
rapidly in the first three weeks of June. At the same time, bank busi-
ness loans, net of bankers acceptances held, declined $3.5 billion in
May and apparently continued weak in June.
Businesses also have been borrowing heavily in the bond market.
Gross public corporate bond offerings totaled a record $7.5 billion
in May on a seasonally adjusted basis and $6.4 billion in June. New

III-10
GROSS OFFERINGS OF CORPORATE AND FOREIGN SECURITIES(Monthly totals or monthly averages; in millions of dollars)
1980
01 Q2 May p June p July
-------- Seasonally adjusted --------
Corporate securities--total 5,220 7,400 9,230 7,925 6,200
Publicly offered bonds 1,895 5,575 7,475 6,350 4,400
Privately placed bonds 1,740 860 840 800 800
Stocks 1,585 965 915 775 1,000
------ Not seasonally adjusted ------
Publicly offered bonds--total 1,954 5,850 6,700 7,000 5,000By quality 1
Aaa and Aa 1,020 3,225 3,800 4,000Less than Aa 934 2,625 2,900 3,000
By type of borrowerUtility 3 1,175 1,305 1,510 1,375Industrial 440 2,985 3,215 3,575Financial 339 1,560 1,975 2,050
Foreign securities--total4 233 360 179 500 400
p--preliminary, f--forecast.1. Bonds categorized according to Moody's bond ratings.2. Includes issues not rated by Moody's.3. Includes equipment trust certificates.4. Includes both publicly offered and privately placed issues.

III-ll
longer-term note and bond offerings by industrial corporations averaged
$3.4 billion per month over the May-June period compared with an average
of only $440 million per month during the first quarter. Moreover,
in sharp contrast to other recessionary periods, a relatively large
proportion of these issues has been sold by lower-rated concerns.
Despite the heavy volume of new offerings, corporate bond yields
have declined another 40 to 65 basis points on balance since the May FOMC
meeting. Such yields now have dropped about 3 percentage points from
their all-time peaks of late March. Furthermore, risk spreads on cor-
porate securities recently have narrowed somewhat, although they still
are much wider than those that prevailed over the first three quarters
of last year.
The major stock price indexes have advanced 5 to 15 percent since
the May FOMC meeting, as investors seem to have given more weight to
the decline in interest rates than to the prospects of lower earnings
associated with the contraction in economic activity. Gross offerings
of new equity issues tapered off in May and June from the heavy pace
recorded earlier this year. Nevertheless, such offerings remained
relatively large by historical standards, reflecting the improvement
in stock prices and efforts by businesses to strengthen balance sheets.
Government Debt Markets
Treasury financing operations have been hampered since late May
by Congressional delay in raising the debt ceiling. After extending
the $879 billion ceiling for five and then twenty-five days, the Con-
gress acted in late June to raise the debt ceiling to $925 billion
through February 1981. With the public debt fluctuating just under the

III-12
GOVERNMENT SECURITY OFFERINGS(Monthly totals or monthly averages, billions of dollars)
Qi A f/1980
Q1 Q2' May June- July-
---- -Seasonally adjusted------
State and local governmentsecurities, gross offerings
Total 4.71 6.60 6.30 6.20 7.30Long-term 2.73 4.80 4.20 4.70 4.30Short-term 1.98 1.80 2.10 1.50 3.00
U.S. government securities,net offerings
U.S. Treasury1 9.55 4.90 14.14 -0.73 5.59Sponsored agencies 3.06 1.83 -0.10 0.03 2.70
----- Not seasonally adjusted ---
State and local governmentsecurities, gross offerings
Total 4.34 7.85 6.70 7.60 6.50
Long-term 2.68 5.20 4.80 5.80 4.00Housing revenue bonds 0.85 1.47 1.07 L.62 1.50
Single-family 0.75 1.42 1.00 1.55 1.40Multi-family 0.10 0.05 0.07 0.07 0.10
Short-term 1.66 2.65 1.90 1.80 2.50
U.S. government securities,net offerings
U.S. Treasury1 10.82 1.01 12.34 -4.18 4.00Bills 7.91 -4.17 6.39 -10.97 1.70Coupons 2.91 5.18 5.95 6.79 2.30
Sponsored agencies 2.57 2.01 0.15 0.50 3.05
e--estimate. f-forecast.1. Marketable issues only.

III-13
$879 billion limit throughout much of June, the Treasury had to restruc-
ture or reschedule a number of its auctions. Even so, the Treasury
raised $2.8 billion of new cash in the market between the May FOMC meet-
ing and the end of June. Over this period, the Treasury sold $6.8 bil-
lion of new coupon issues and added about $5 billion to the regular bill
cycles while redeeming on a net basis $9 billion of cash management
bills. Marketable borrowing needs again were increased in May and June
by a paydown of nonmarketable debt; however, the runoff of savings bonds
appears to have slowed somewhat as market interest rates have fallen.
After borrowing heavily over the first four months of the year,
the three major federally sponsored credit agencies raised almost no new
money in the aggregate over May and June. The Federal Farm Credit Banks
raised $1 billion in May and another $500 million in June, but this bor-
rowing was offset by reductions at the two major housing credit agencies.
The weakness of demand for home mortgages and the increase in deposit
flows greatly reduced the demand for FHLB advances, and the sluggish
deliveries of mortgages under prior commitments reduced FNMA needs for
external financing. Accordingly, FNMA ran off $1.5 billion of debt over
the May-June period, and the FHLB system did no net borrowing during
these two months.
State and local governments continued to borrow heavily in the bond
market. Tax-exempt bond offerings totaled $4.2 billion (seasonally ad-
justed) in May, down about $1-1/2 billion from April but still substan-
tially above the depressed pace of the first quarter. The June volume
rebounded from May but did not match the near-term peak recorded in
April. Mortgage revenue bonds-predominantly to provide financing for

III-14INTEREST RATES AND SUPPLY OF MORTGAGE FUNDS AT SELECTED S&Ls
Conventional home mortgagesAverage rate on Basis point
new commitments change from Spreadl Percent of S&Ls 2
Period for 80% loans month or (basis with mortgage funds(percent) week earlier points) in short supply
1979--High 12.90 -- +174 88Low 10.38 -- +64 54
1980--Jan. 12.88 -2 +118 85Feb. 13.03 +15 -22 84Mar. 15.28 +225 +139 89Apr. 16.33 +105 +369 86
May 2 15.90 -35 +385 879 14.68 -122 +313 89
16 14.15 -53 +250 8523 13.38 -77 +178 8230 13.20 -18 +165 81
June 6 13.06 -14 +178 7713 12.85 -21 +200 7320 12.58 -27 +179 7027 12.35 -23 +132 76
1. Average mortgage rate minus average yield on recently offered Aaa utility bonds.2. Percent reporting supply of funds slightly or substantially below normal seasonalpatterns.
SECONDARY HOME MORTGAGE MARKET ACTIVITYFNMA auctions of forward purchase commitments Yields on GNMA-
Conventional Government-underwritten guaranteedmortgage-backed
Amount Yield Amount Yield securities forPeriod ($ millions) to 1 ($ millions) to 1 imediate2
Offered Accepted FNMA Offered Accepted FNMA delivery
1979--High 454 172 13.97 1,035 448 13.29 11.77Low 19 18 10.92 37 19 10.42 9.51
1980--May 5 11.0312 120 53 13.81 236 101 13.16 11.2619 11.7827 160 56 13.27 373 113 12.59 11.12
June 2 11.529 110 43 13.05 333 146 12.42 10.89
16 10.7923 60 33 12.81 269 120 12.28 10.7330 11.27
1. Average gross yield before deducting fee of 38 basis points for mortgage servicing.Data, based on 4-month FNMA purchase commitments, reflect the average accepted bidyield for home mortgages, assuming a prepayment period of 12 years for 30-year loanwithout special adjustment for FNMA commitment fees and related stock requirements.Mortgage amounts offered by bidders relate to total eligible bids received.2. Average net yields to investors assuming prepayment in 12 years on pools of 30-yearFHA-VA mortgages typically carrying the prevailing ceiling rate on such loans.

III-15
single-family housing--have been accounting for about one-quarter of the
tax-exempt volume in recent months. Municipal bond yields have increased
about 30 basis points since the May FOMC meeting, even as other long-
term yields generally have declined. The relatively poor performance of
the tax-exempt market may partially reflect a falloff in demand by prop-
erty/casualty insurance companies which are reported to be facing
increased underwriting losses.
Mortgage Markets
Average interest rates on new commitments for conventional home
mortgages at sampled S&Ls have fallen by 1-3/4 percentage points since
mid-May to a level of 12.35 percent. By late June, average rates in
all major regions of the country were close to this national figure,
although there have been scattered reports of rates of 12 percent or
less. Seventy-six percent of the reporting S&Ls indicated that the
supply of mortgage funds was below normal seasonal patterns and 32 per-
cent reported funds in substantially short supply-compared with recent
highs of 93 and 59 percent, respectively.
The sharp decline in mortgage interest rates is in part attributable
to the pickup in thrift institution deposit flows and the evident weak-
ness in loan demand. Despite earlier substantial rate declines, commit-
ment activity at S&Ls slowed somewhat further in May and net mortgage
lending turned negative on a seasonally adjusted basis. Mortgage com-
mitments outstanding declined by 7 percent to $19.2 billion. Adjusted
for the rise in home prices, the backlog of commitments outstanding was
below the level reached at the last cyclical trough in late 1974. A
special survey of large S&Ls conducted by the FHLBB indicated that about

III-16
three-fifths of respondent associations further liberalized their home
mortgage commitment policies during the first half of June (primarily
by cutting mortgage interest rates), and there was a modest decline from
May in the number of S&Ls reporting commitment activity substantially
below earlier volume. This survey revealed that about a fourth of the
S&Ls had begun offering the renegotiable rate mortgages authorized by the
FHLBB in April; three-fourths of S&Ls offering RRMs continued to offer
standard fixed-rate, level-payment mortgages.
Although rates on conventional home mortgages have fallen sharply
since late April, they remain quite high relative to yields on various
types of long-term fixed-income securities. Even so, there are few
indications that the major private diversified institutions that
invest in both conventional mortgages and bonds--mutual savings banks,
commercial banks, and life insurance companies-have so far channeled
enlarged amounts of funds into home loans. Many of these institutions
have been experiencing sluggish flows of lendable funds. Moreover,
risk differentials required by diversified investors may have widened
somewhat due partly to a rise in some mortgage delinquency rates since
mid-1979, and preferences for liquidity or marketability also may have
intensified since last fall given the increased volatility of market
interest rates.
In contrast to the last cyclical downturn, federal and related
agencies operating in the secondary mortgage markets have provided only
modest support to residential mortgage and housing activity. Rate-sub-
sidy programs which operate through the secondary market agencies have
not been enacted by the federal government in this downswing, and FNMA's

III-17
pricing of its purchase commitments has not been particularly aggressive
owing partly to earnings problems experienced by this agency during
recent quarters. Indeed, new commitments issued by FNMA have been
rather sluggish since last October, and commitments outstanding at the
end of April (latest data available) were down to $4.2 billion from
$8.2 billion six months earlier. On the other hand, market support
provided by state and local government agencies has been much larger
than in earlier periods; issues of mortgage revenue bonds amounted to
nearly $7 billion during the first half of this year.
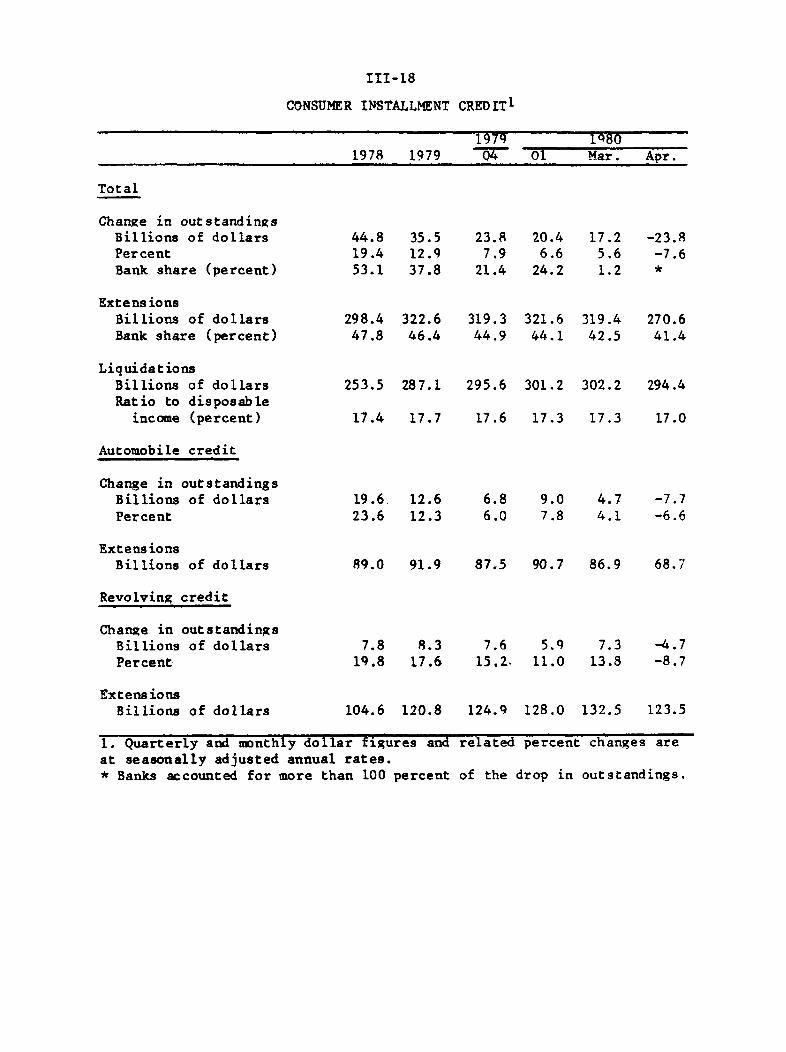
Consumer Credit
Consumer installment credit outstanding contracted at an 8 percent
annual rate in April, the first drop since May 1975 and the largest in
the postwar era. Substantial declines in most major types of closed-end
and revolving credit contributed to the falloff. By type of lender, the
contraction in consumer credit was heavily concentrated at commercial
banks and credit unions. Advance estimates for May indicate a decrease
of much the same magnitude as in April, and bank holdings of consumer
credit evidently declined further in June.
A special survey of consumer lenders conducted in mid-June by the
Federal Reserve Banks indicated that demand for consumer loans had con-
tinued to weaken since early May. Reduced demands were noted by a
majority of the respondent banks and finance companies; a preponderance
of commercial banks and retailers also reported declining credit card
usage. On the supply side of the market, more than half of the respon-
dents reported unchanged lending policies. Only for auto credit at com-
mercial banks were lending standards more accommodative on balance. At
III-18
CONSUMER INSTALLMENT CREDIT 1
1979 1801978 1979 *04 01 Mar. Apr.
Total
Change in outstandingsBillions of dollarsPercentBank share (percent)
ExtensionsBillions of dollarsBank share (percent)
LiquidationBillionsRatio to
income
of dollarsdisposable(percent)
44.819.453.1
35.512.937.8
23.87.9
21.4
20.46.6
24.2
17.25.61.2
-23.8-7.6*
298.4 322.6 319.3 321.6 319.4 270.647.8 46.4 44.9 44.1 42.5 41.4
253.5 287.1 295.6 301.2 302.2 294.4
17.4 17.7 17.6 17.3 17.3 17.0
Automobile credit
Change in outstandingsBillions of dollarsPercent
ExtensionsBillions of dollars
19.6 12.623.6 12.3
6.8 9.0 4.7 -7.76.0 7.8 4.1 -6.6
89.0 91.9 87.5 90.7 86.9 68.7
Revolving credit
Change in outstandingsBillions of dollarsPercent
ExtensionsBillions of dollars
7.8 8.319.8 17.6
7.6 5.9 7.3 -4.715.2- 11.0 13.8 -8.7
104.6 120.8 124.9 128.0 132.5
1. Quarterly and monthly dollar figures andat seasonally adjusted annual rates.* Banks accounted for more than 100 percent
related percent changes are
of the drop in outstandings.
123.5
III-19
the same time, more stringent credit card lending policies predominated
among the minority of banks and retailers reporting changes in policy.
The survey suggested that delinquency rates on consumer install-
ment credit have risen recently. Commercial banks and finance companies
both reported a higher proportion of delinquent automobile and personal
loans, and credit card issuers reported an increasing number of delinquent
accounts. Personal bankruptcy filings also have risen rapidly; during
April, the number of cases filed reached a new high seasonally adjusted.
However, part of the recent increase undoubtedly reflects the liberali-
zation in the federal bankruptcy law that took effect October 1, 1979.
Finance rates for selected types of consumer installment credit
at commercial banks were sharply higher in early May than in early Febru-
ary, according to the quarterly Federal Reserve series. (See chart on
page III-20.) There are indications, however, that some institutions
cut their rates after late April or early May. Two factors afforded
banks some latitude to raise such rates. First, statutory rate ceilings
on certain types of consumer loans have been boosted in at least 10
states since early February. Second, with the discount rate at 13 per-
cent from mid-February through late May, national banks in states with
legal rate ceilings below 14 percent could take advantage of the authority
provided by the National Banking Act to charge 1 percent more than the
Federal Reserve discount rate. Furthermore, as of March 31, this over-
ride was extended to all federally insured commercial banks, savings
banks, credit unions, and savings and loan associations by the Deposi-
tory Institutions Deregulation Act. Since late May, however, declines in
the discount rate have reduced the usefulness of the override authority.

III-20
CONSUMER FINANCE RATES AT COMMERCIAL BANKS
Annual percentage rate-- 19
1977 1978 1979 1980
Source: Quarterly Federal Reserve survey of "most common" financerates.
APPENDIX A*
MONEY MARKET MUTUAL FUNDS
Money market mutual funds (MMMFs) have grown rapidly in recentweeks, with total assets currently about $14 billion above their levelin mid-March (see table, upper panel). Total assets of MMMFs declinedmore than $1.0 billion over the four-week period following the March 14announcement requiring MMMFs and similar creditors to maintain a specialnon-interest bearing deposit equal to 15 percent of the increase intheir investment assets. This decline probably was in response both touncertainty among investors about the impact of the special deposit re-quirement and to decisions by the trustees of most MMMFs torestrict or suspend sales of shares to new depositors. A large numberof MMMF management companies responded to the Board's action byorganizing new "clone" money market funds that are similar to the"first generation" MMMFs except that all of their non-exempt assets aresubject to the special non-interest bearing deposit requirement. 1
On March 28, the Board announced several changes in the regula-tion applying to money market funds and similar entities. Among otheractions, the Board extended the exemption for bank-operated collectiveinvestment funds to bona fide personal trusts, pension, retirement, andother tax-exempt accounts invested in money market funds, exempted thetax-exempt assets of money market funds that allocate at least 80 per-cent of their assets to short-term tax-exempt obligations, and provideda minimum base ($100 million) for money market funds that were engagedin a continuous public offering on March 14. These Board actions,together with a wider availability of "clone" MMMFs, contributed to thebeginning of a resurgence in the growth in money market funds in mid-to late-April. Sales of MMMFs also were buoyed in May by the decisionof the trustees of several large funds whose covered credit totals werebelow their base levels to begin accepting deposits of new shareholders.More recently, on May 22 the Board announced modifications of its March14 credit restraint program, including a reduction, effective in theweek beginning June 16, from 15 to 7-1/2 percent in the special depositrequirement. Special deposits of money market funds and similarcreditors totaled $488 million for the 7-day period ending June 22
1. On April 22, 1980, the SEC promulgated additional rules (InvestmentCompany Act of 1940; Release No. 11137) designed to facilitate thecreation and issuance of by MMMFs of more than one class of shares.Under these rules, a MMMF can create three classes of stock: one ofwhich would be held primarily by existing shareholders, a second whichwould be held by exempt accounts, and a third to be offered to newshareholders.
* Prepared by Norman E. Mains, Economist, Capital Markets Section,Division of Research and Statistics.
A-1

A-2
(latest available data). Since assets of MMMFs were approximately $14billion above the mid-March total in this period, the amount of thespecial deposits suggests that approximately one-half of the increasein MMMF assets since March 14 has been in accounts that are exempt fromthe Board's special deposit requirement. In fact, almost one-half ofthe gain in MMMF assets since mid-March has been at funds that limittheir depositors to institutional investors.
In addition, the sharp decline in short-term interest rates hasnot had the unfavorable impact on MMMF sales that many had expected.One reason is that MMMF portfolio managers began lengthening the averagematurity of their portfolios. MMMF assets had an average remainingmaturity of less than 30 days in early April and by early May it hadincreased to 55 days. Since the yield curve became upward slopingduring this period, this strategy enabled the MMMFs to limit the declinein portfolio yields. Perhaps even more important, a sizable number ofMMMFs calculate their net yields to shareholders by "marking to market"all or a portion of the assets on a daily basis.2 As a result, thesharp decline in money market interest rates resulted in annualized netyields to shareholders that were, because of the capital gainsassociated with the rise in prices of the money market obligations,well in excess of returns available on alternative investments. Forexample, the 7-day net yield to shareholders of first-generation MMMFsexceeded the effective yields available on MMCs by 3-1/2 percentagepoints, on average, in the first four weeks of May, although morerecently the spread has narrowed to about 1-1/4 percentage points.MMMF portfolio managers also appear to have begun to reallocate theirinvestable funds away from lower yielding U.S. Treasury securities andbankers acceptances and toward higher yielding domestic and EurodollarCDs. They have remained large purchasers of commercial paper as well(see table, lower panel).
2. Approximately one-third of all MMMFs currently use a daily mark-to-market valuation method, while the remaining funds employ an amortizedcost (or straight-line accrual) method for either all or a portion oftheir assets. The SEC limits MMMFs using an amortized cost method forall of their assets to an average maturity (weighted by assets) of nomore than 60 days; MMMFs employing the combined scheme of bothamoritized cost for assets with terms to maturity of 60 days or lessand mark-to-market on all other assets are limited to or averagematurity of no more than 120 days.

A-3
ASSETS AND NET YIELDS OF MONEY MARKET MUTUAL FUNDS
Change in assets Average Memo: MMCPeriod First 7-day net yield effective yield(weekly) generation Clones to shareholders1 at thrifts
-Millions of dollars- ------ Percent-----
Mar. 19 519 -- 14.13 15.7426 -158 - 14.59 15.73
Apr. 2 -699 25 15.04 16.559 -75 65 15.56 15.57
16 -472 71 16.03 14.9523 204 139 16.32 14.2130 98 203 16.03 12.42
May 7 2,075 254 15.52 11.2414 1,955 229 13.61 9.8621 2,144 258 12.72 9.3328 1,275 361 11.99 9.33
June 4 1,614 304 10.73 8.2811 1,392 186 10.63 8.9818 1,180 281 9.79 8.0125 1,053 196 9.19 8.01
1. First generation funds only.
Type of obligationEnd of Total RPs & U.S. Euro Comm. MaturityPeriod assets other gov't. CDs CDs paper BAs (days)
SBillions of dollars -----
1977 4.0 0.4 0.7 1.7 0.2 1.0 0.1 751978 11.0 0.5 1.4 4.8 0.5 2.9 0.8 481979 45.2 2.2 5.6 13.7 4.4 14.5 4.8 34
1980-Q1 60.5 3.5 10.6 14.0 6.3 19.5 6.6 29April 60.7 2.9 9.3 13.9 5.4 20.6 8.6 38May 70.0 4.5 10.9 15.6 6.4 24.3 8.3 46June 25p 75.4 5.0 11.0 15.8 6.7 27.5 9.1 48
p - preliminary.

INTERNATIONAL DEVELOPMENTS
Foreign exchange markets
Selling pressure on the dollar moderated somewhat during the
seven week period since the last Greenbook, particularly since mid-
June. As shown in the top panel of the first chart, the dollar's
weighted-average value dropped until late May, after which it steadied
somewhat and has since oscillated within a fairly narrow range.
Between the last Greenbook and July 1 the dollar declined by a little
more than 2 percent, and its weighted-average value is presently about
10-1/4 percent below the highs touched in early April.
Foreign exchange trading conditions over the last seven week
period have been generally calm. The dollar's drift downwards has
been a result mainly of the continuing fall in interest rates in the
U.S. money market (see Chart 2) and on dollar instruments in the
Euromarkets. Interest rates on dollar assets, in fact, have fallen
well below the weighted-average of rates on assets in major foreign
currencies, but late in the period under review dollar interest rates
have firmed somewhat. The sharp rise in U.S. monetary aggregates
announced toward the end of June, in particular, reinforced market
views that dollar interest rates had passed through the trough.
In addition, economic data released since the last Greenbook
have tended to confirm that a sharp U.S. recession is in progress,
leading to expectations of a moderation of the inflation rate and
of improvement in the current account deficit. Market perceptions of
improvement in these fundamentals has at times provided support for
the dollar -- evidenced for instance in the strength of the forward
IV-1
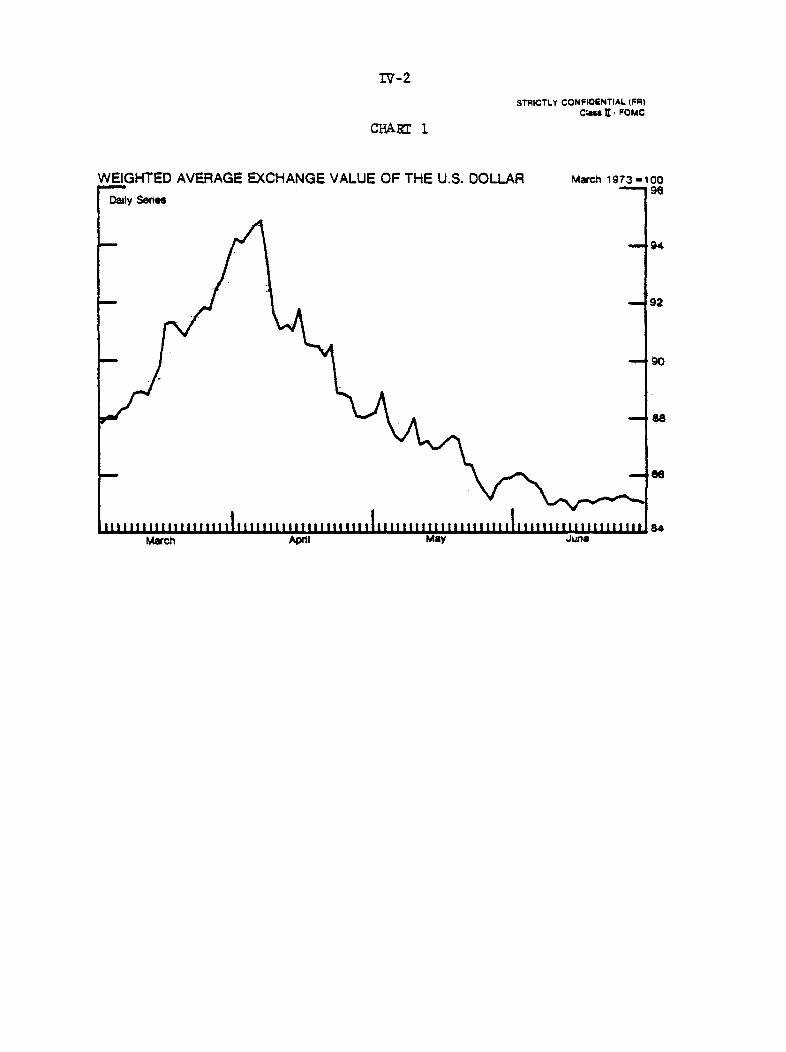
IV-2
STRICTLY CONFIDENTIAL (FR)Clas II FOMC
CHART 1
WEIGHTED AVERAGE EXCHANGE VALUE OF THE U.S. DOLLAR March 1973-100al - 96
Daily Senes
--94
- 92
S- 90
- 88
8s
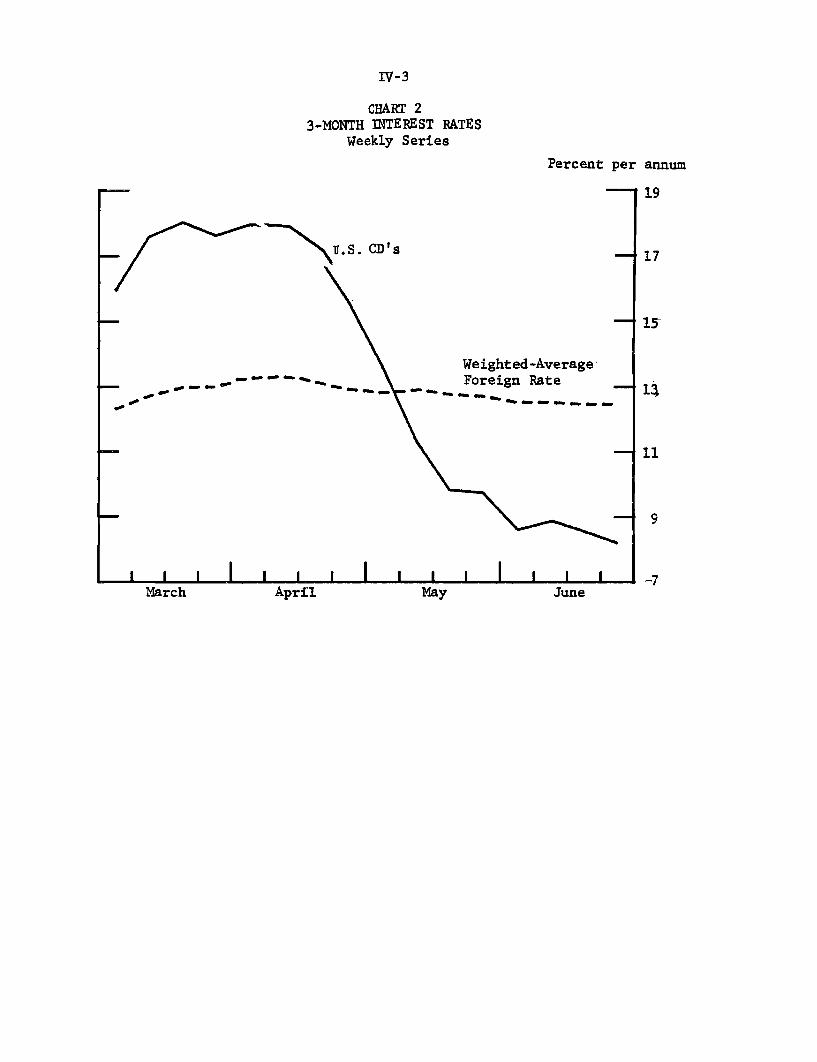
IV-3
CHART 23-MONTH INTEREST RATES
Weekly Series
Percent per annum
S. CD's
w 0 w - - a
Weighted-AverageForeign Rate
- -- ----
I 1 Ia A JI I I I I I I I I I
March April May June

IV-4
dollar -- even through the latter part of the period of falling interest
rates. However, the unexpectedly large May U.S. trade deficit, announced
in late June, led to a brief recurrence of selling pressure.
Against the principal foreign currencies, the dollar's largest
decline since the last Greenbook was against the Japanese yen -- by
3-3/4 percent -- although by the end of June the yen had eased back
somewhat on expectations of a softening in Japanese interest rates.
The pound sterling and Swiss franc each gained more than 2-1/2 percent
against the dollar during the period, with sterling benefitting
especially from high U.K. interest rates and, to some extent, the
new round of oil price increases which occurred in late May and early
June. Within the EMS arrangement, the French franc has held firmly
at the top of the narrow currency spread for the past several weeks,
rising not only against the dollar (by 2-1/2 percent), but also relative
to the German mark. The mark gained almost 1-3/4 percent against
the dollar since the last Greenbook, but its appeal has been somewhat
diminished by expectations of a large German current account deficit
this year.
Market attention has shifted toward the Italian lira recently.
Within the European Monetary System, the lira came under intensifying
downward pressure during most of June. The lira rose by only 1/4
percent against the dollar, and it sank slowly within the EMS arrange-
ment . By
the end of the period the lira was more than 4 percent below its central
rate with the French franc (the lira is permitted a 6 percent margin
of fluctuation). The major factors behind the lira's weakness are

IV-5
Italy's very high inflation rate and worsening current account position.
Late in the month the Bank of Italy tightened penalties on banks which
exceed their credit ceilings, and on July 2 the government decided on
selective restrictive measures.
For its part, the Desk provided net intervention support for
the dollar totalling $1,260 million during the past seven weeks,
of which the System's share came to $684.5 million, and the remainder
was financed by the Treasury. During the first two weeks of June,
Desk operations included sales of $115 million equivalent of Swiss
francs and $26.3 million of French francs, the former financed from
System balances and the latter by drawing on the System's swap line
with the Bank of France. Most of the German mark sales for System
account since the last Greenbook were financed by drawing on the
Bundesbank swap line, and System swap indebtedness to the Bundesbank
now stands at $877 million equivalent. Swap debt to the Bank of
France, stemming from the April and June operations, is presently
$100 million equivalent.
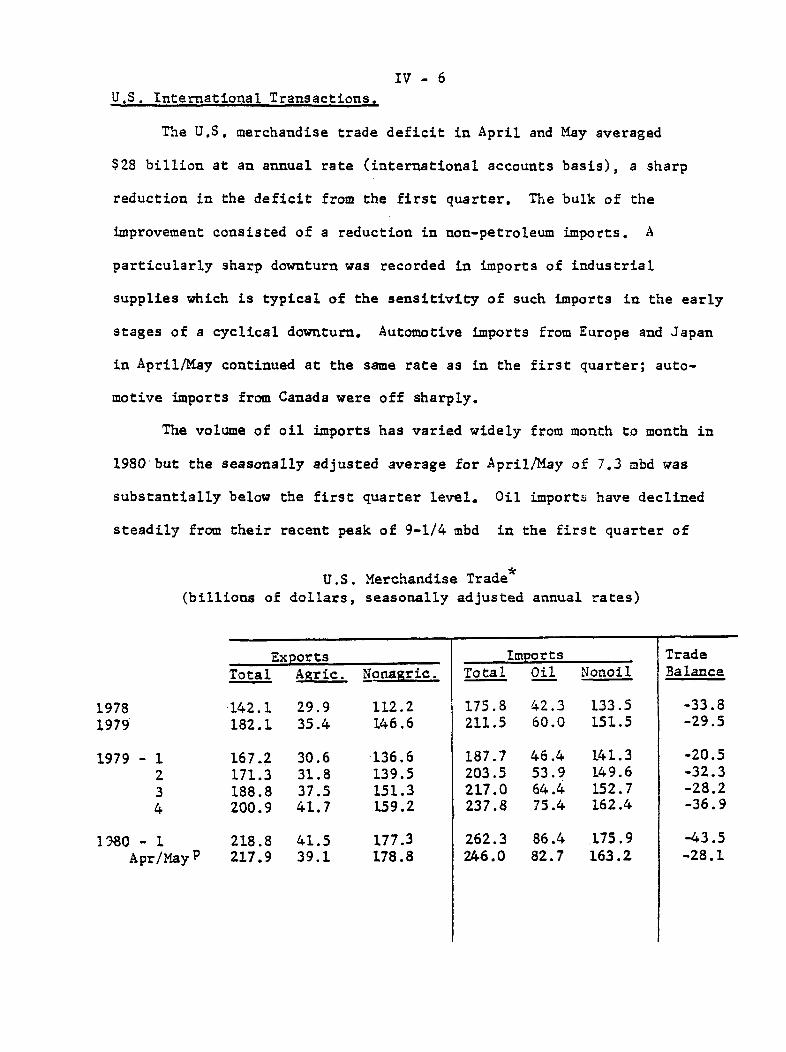
IV - 6U.S. International Transactions.
The U.S. merchandise trade deficit in April and May averaged
$28 billion at an annual rate (international accounts basis), a sharp
reduction in the deficit from the first quarter. The bulk of the
improvement consisted of a reduction in non-petroleum imports. A
particularly sharp downturn was recorded in imports of industrial
supplies which is typical of the sensitivity of such imports in the early
stages of a cyclical downturn. Automotive imports from Europe and Japan
in April/May continued at the same rate as in the first quarter; auto-
motive imports from Canada were off sharply.
The volume of oil imports has varied widely from month to month in
1980 but the seasonally adjusted average for April/May of 7.3 mbd was
substantially below the first quarter level. Oil imports have declined
steadily from their recent peak of 9-1/4 mbd in the first quarter of
U.S. Merchandise Trade*(billions of dollars, seasonally adjusted annual rates)
Exports Imports TradeTotal Agric. Nonagric. Total Oil Nonoil Balance
1978 142.1 29.9 112.2 175.8 42.3 133.5 -33.81979 182.1 35.4 146.6 211.5 60.0 151.5 -29.5
1979 - 1 167.2 30.6 -136.6 187.7 46.4 141.3 -20.52 171.3 31.8 139.5 203.5 53.9 149.6 -32.33 188.8 37.5 151.3 217.0 64.4 152.7 -28.24 200.9 41.7 159.2 237.8 75.4 162.4 -36.9
1380 - 1 218.8 41.5 177.3 262.3 86.4 175.9 -43.5
Apr/MayP 217.9 39.1 178.8 246.0 82.7 163.2 -28.1

IV - 7
1979. The downturn in U.S. economic activity, as well as an apparent
leveling off of stock building, could generate some further reductions
in coming months. The decline in volume in April/May was about offset
by a 10 per cent increase in the price of imported oil from the first
quarter average. Import prices will increase further in coming months
as the OPEC price hikes in mid-May and June of about 8 per cent are fully
reflected in U.S. import data.
Nonagricultural exports in April/May increased slightly following
strong growth in 1979 and the first quarter of 1980. Increases in
civilian aircraft, machinery, and industrial supplies (particularly
coal and chemicals) were partly offset by declines in automotive exports
(to Canada and other countries) and consumer goods. Exports of aircraft
continued to rise in both April and May averaging a $14 billion annual
rate as compared to a $12 billion annual rate in the first quarter and
Oil Imports(seasonally adjusted)
Volume Price Value(mil. bar./day) $/BBL (Bil. $, AR)
1980 - 1 8.47 28.06 86.4April-May 7.34 30.86 82.7
March 7.93 29.73 88.4April 6.45 30.59 72.0May 8.23 31.13 93.5
*/ International accounts basis (includes imports the U.S. VirginIslands).
IV - 8
a $10 billion annual rate in 1979. Moreover, strong orders over the
past year and a surge in new orders for aircraft exports in recent
months would imply continued strength for this category of exports.
Coal exports have been particularly strong as demand for steam coal to
fuel electric generating stations and industries in Europe and Japan
increased sharply. The downturn in auto exports and exports of consumer
goods may have been related to a leveling off of foreign economic
activity in the second quarter.
Agricultural exports averaged $39.1 billion at an annual rate on
an international accounts basis in April/May, down from $41.5 billion in
the first quarter. A drop in grain export volumes and unit values
accounted for the most of the decline.
In international financial transactions, an outflow of funds
through banks that has been under way since spring continues to charac-
terize developments in banking markets. As shown in the accompanying
table, banking offices in the United States reduced their net Eurodollar
borrowing by $10 billion and increased their claims on foreign banks by
$1 billion, on a daily average basis, between March and May; partial
data for June indicate further outflows. 1/ The bulk of the outflow was
through domestic chartered banks as these institutions became net lenders
to their branches for the first time since April 1979.
U.S. banking offices' net supply of funds to foreigners seems
primarily related to the slowdown in bank-credit demands in the United
States during the second quarter. At the same time foreign credit
demands have apparently remained relatively strong, both in foreign
industrialized countries and LDCs seeking to finance enlarged current-
1/ These data differ from those in the "U.S. International Transactions"table in that they are daily averages of outstandings, rather thandifferences of month-end outstandings.
IV - 9
account deficits. Funds raised by banks in the United States in excess
of bank-credit demands here have apparently been channeled to ultimate
borrowers abroad through placements at U.S. banking offices' foreign
affiliates and at other foreign banks.
Foreign official assets in the United States fell by $1.4 billion
in April,
. OPEC holdings increased, although at a slower rate
than in recent months. Partial data for May and June indicate an
increase in foreign official assets in this country.
Data for the first quarter of 1980 showed another large inflow
in unrecorded transactions probably representing net private capital
inflows. This trend over the fourth quarter of 1979 and the first
quarter of 1980 appears to have continued in April. Among other current
account developments in the first quarter, U.S. service receipts again
rose as direct investment receipts advanced from their high fourth
quarter rate. The increase was in part due to strong petroleum company
profits.
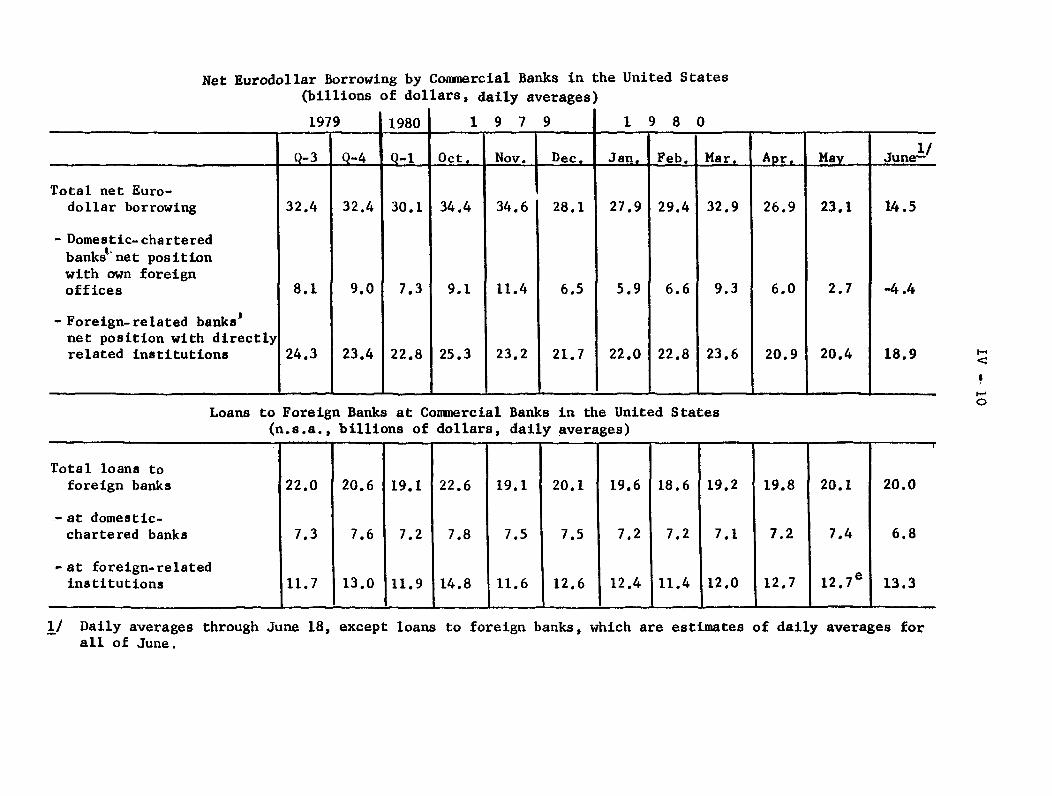
Net Eurodollar Borrowing by Commercial Banks in the United States(billions of dollars, daily averages)
1 9 7 9 1 9 8 0
____Q-3 Q-4 q -1 Oct. Nov. Dec. Jan, Feb. Mar. Apr, May June-
Total net Euro-dollar borrowing 32.4 32.4 30.1 34.4 34.6 28.1 27.9 29.4 32.9 26.9 23.1 14.5
- Domestic-chartered
banks 'net positionwith own foreignoffices 8.1 9.0 7.3 9.1 11.4 6.5 5.9 6.6 9.3 6.0 2.7 -4.4
- Foreign-related banks'net position with directlyrelated institutions 24.3 23.4 22.8 25.3 23.2 21.7 22.0 22.8 23.6 20.9 20.4 18.9
Loans to Foreign Banks at Commercial Banks in the United States(n.s.a., billions of dollars, daily averages)
Total loans toforeign banks 22.0 20.6 19.1 22.6 19.1 20.1 19.6 18.6 19.2 19.8 20.1 20.0
- at domestic-chartered banks 7.3 7.6 7.2 7.8 7.5 7.5 7.2 7.2 7.1 7.2 7.4 6.8
-at foreign-relatedinstitutions 11.7 13.0 11.9 14.8 11.6 12.6 12.4 11.4 12.0 12.7 12.7 e 13.3
of daily averages for
1979 I1980
1/ Daily averages through June 18, except loans to foreign banks, which are estimatesall of June.
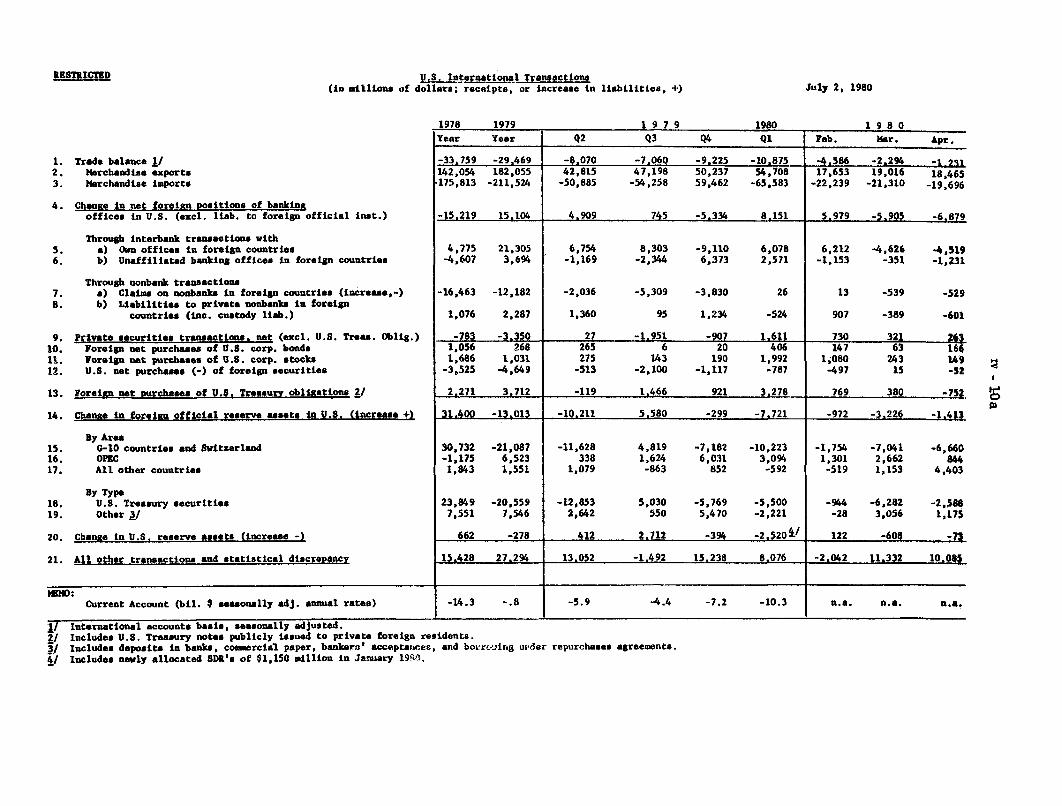
RESTRICTEDU.S. International Transactions
(in millions of dollars; receipts, or increase in liabilities, +)July 2, 1980
1. Trade balance 1/2. Merchandisa exports3. Merchandise imports
4. Change in net foreign positions of bankingoffices in U.S. (excl. liab. to foreign official inst.)
Through interbank transactions with5. a) Ovn offices in foreign countries6. b) Unaffiliated banking offices in foreign countries
Through nonbank transactions7. a) Claims on nonbanks in foreign countries (increase,-)8. b) Liabilities to private nonbanks in foreign
countries (inc. custody liab.)
9. Private securities transactions, net (excl. U.S. Treas. Obtig.)
10. Foreign net purchases of U.S. corp. bonds11. Foreign net purchases of U.S. corp. stocks12. U.S. net purchases (-) of foreign securities
13. Foreign net purchases of U.S. Treasury obligations 2/
14. Change in foreign official reserve assets in U.S. (increase +)
By Area15. G-10 countries and Switzerland16. OPEC17. All other countries
By Type18. U.S. Treasury securities19. Other I/
20. Change in U.S. reserve assets (increase -)
21. All other transactions and statistical discrepancy
1978 1979 1979 1980 1980
Year Year Q2 Q3 Q4 Q1 Feb. Mar. Apr.
-33.759 -29.469 -8.070 -7,060 -9.225 -10,875 -4.586 -2294 -1 2 1142,054 182,055 42,815 47,198 50,237 54,708 17,653 19,016 18,465175,813 -211,524 -50,885 -54,258 59,462 -65,583 -22,239 -21,310 -19,696
-15.219 15.104 4.909 745 -5.334 8.151 5.979 -5,905 -6,879
4,775 21,305 6,754 8,303 -9,110 6,078 6,212 -4,626 -4,519-4,607 3,694 -1,169 -2,344 6,373 2,571 -1,153 -351 -1,231
-16,463 -12,182 -2,036 -5,309 -3,830 26 13 -539 -529
1,076 2,287 1,360 95 1,234 -524 907 -389 -601
-783 -3.350 27 -1.951 -907 1.611 730 321 2631,056 268 265 6 20 406 147 63 1661,686 1,031 275 143 190 1,992 1;080 243 149-3,525 -4,649 -513 -2,100 -1,117 -787 -497 15 -52
2.271 3.712 -119 1,466 921 3.278 769 380 -752
31.400 -13013 -10.211 5,580 -299 -7,721 -972 -3,226 -1,413
30,732 -21,087 -11,628 4,819 -7,182 -10,223 -1,754 -7,041 -6,660-1,175 6,523 338 1,624 6,031 3,094 1,301 2,662 8441,843 1,551 1,079 -863 852 -592 -519 1,153 4,403
23,849 -20,559 -12,853 5,030 -5,769 -5,500 -944 -6,282 -2,5887,551 7,546 2,642 550 5,470 -2,221 -28 3,056 1,175
662 -278 412 2,712 -394 -2.520l 122 -608 -73
15.428 27.294 13.052 -1.492 15,238 8.076 -2.042 11.332 10,08&
Current Account (bil. $ seasonally adj. annual rates) -14.3 -. 8 -5.9 -4.4 -7.2 -10.3 n.a. n.a. n.4.
I/ International accounts basis, seasonally adjusced.2/ Includes U.S. Treasury notes publicly issued to private foreign residents.
SIncludes deposits in banks, comercial paper, bankera' acceptances, and boitrcwing urder4/ Includes newly allocated SDR's of $1,150 million in January 1980.
repurchases agreements.

IV-11
Foreign Economic Developments. Economic activity in several
major industrial countries has weakened in recent months. Real GNP in
the United Kingdom and Canada declined in the first quarter, while first-
quarter French industrial production figures suggest that the pace of
activity has slowed there as well. In Germany, where first-quarter
growth was quite strong, there are also signs that the economy may have
been slowing somewhat in recent months. The main-exception to this
trend is Japan, where the economy has continued to expand strongly.
Japanese GNP grew at a greater than 7 percent annual rate in the first
quarter, and economic activity does not appear to have slowed signifi-
cantly since then.
The general tendency toward weaker activity has not yet been
accompanied byany marked trend toward reduced rates of inflation in
most countries, but there have been some hopeful signs. In Japan, whole-
sale prices fell in May for the first time in more than a year and a
half largely because of appreciation of the yen, and in June the CPI
sustained its smallest increase since 1978. The rate of increase in
consumer prices in Italy has decelerated significantly in recent months,
and the rate of inflation in both wholesale and retail prices declined
sharply in the United Kingdom in May from high April rates produced
partly by tax increases. Some moderation in upward pressure on prices
has also been evident in Germany, Belgium, and France. Strong infla-
tionary pressures persist, however, in Canada, the Netherlands, and the
Scandinavian countries.

REAL GNP AND INDUSTRIAL PRODUCTION IN MAJOR INDUSTRIAL COUNTRIES(Percentage change from previous period, seasonally adjusted)
1979 1980 1979 19801977 1978 1979 Q1 Q2 Q3 Q4 Q1 Dec. Jan. Feb. Mar. Apr. May
Canada: GNPIP
France: GDPIP
Germany: GNPIP
Italy: GDPIP
Japan: GNPIP
United Kingdom:
United States:
2.44.0
3.02.0
2.62.6
1.91.1
5.44.2
GDP 1.7IP 3.7
GNP 5.3IP 5.9
3.45.3
3.51.9
3.52.3
2.61.9
6.06.2
2.73.7
4.45.8
0.8 -0.2 1.1 0.5 -0.51.4 -1.2 2.3 -1.0 -0.8
0.3 0.4 2.7 0.4 0.4-0.3 0.8 4.8 -2.9 1.5
0.6 2.1 0.9 0.6 1.80.0 3.1 1.6 0.5 1.6
1.4 -0.8 1.1 3.9 1.51.1 -2.6 1.4 8.4 3.1
1.5 1.7 1.7 1.1 1.81.8 2.4 2.0 2.6 4.1
-0.4 3.1 -2.1 0.5 -0.7-0.2 4.3 -1.8 -0.1 -2.2
0.3 -0.6 0.8 0.5 0.31.0 -0.2 0.2 -0.1 0.0
* GNP data are not published on monthly basis.
* * * * * *
-2.3 0.4 0.1 1.3 n.a. n.a.
* * *
0.7 0.0 0.7
* * *
-0.8 0.8 1.6
* * *
0.0 0.0 n.a.
0.0 -1.6 n.0.0 -1.6 n.a.
2.64.7
4.03.8
4.45.4
5.06.4
5.98.3
1.92.6
2.34.1
* * *
-0.2 1.2 5.7
* * *
-1.8 -0.5 -1.2
* * *
-3.5 1.8 -0.5
* * *
-1.2 -0.6 n.a.
* * * * * *
0.1 0.3 -0.2 -0.5 -2.0 -2.1
* * .* * * * H
-1.5 1.4 4.3 -0.6 1.8 n.a.
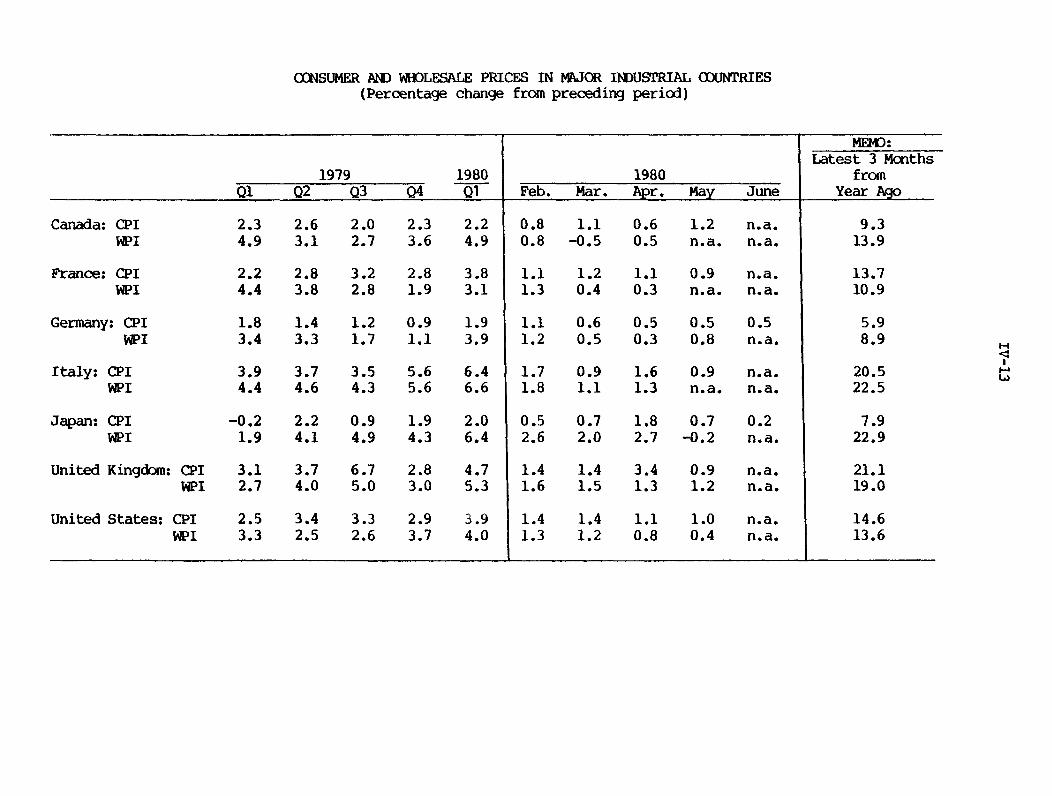
CONSUMER AND WHOLESALE PRICES IN MAJOR INDUSTRIAL COUNTRIES(Percentage change from preceding period)
MEMO:Latest 3 Months
1979 1980 1980 from
Q1 Q2 Q3 Q4 Q1 Feb. Mar. Apr. May June Year Ago
Canada: CPIWPI
France: CPIWPI
Germany: CPIWPI
Italy: CPIWPI
Japan: CPIWPI
United Kingdom: CPWP
United States: CPIWPI
2.3 2.64.9 3.1
2.0 2.3 2.22.7 3.6 4.9
2.2 2.8 3.2 2.8 3.84.4 3.8 2.8 1.9 3.1
1.8 1.4 1.2 0.9 1.93.4 3.3 1.7 1.1 3.9
3.9 3.7 3.5 5.6 6.44.4 4.6 4.3 5.6 6.6
-0.2 2.2 0.9 1.9 2.01.9 4.1 4.9 4.3 6.4
I 3.1 3.7 6.7 2.8 4.7I 2.7 4.0 5.0 3.0 5.3
2.5 3.4 3.3 2.9 3.93.3 2.5 2.6 3.7 4.0
0.8 1.1 0.6 1.20.8 -0.5 0.5 n.a.
n.a.n.a.
1.1 1.2 1.1 0.9 n.a.1.3 0.4 0.3 n.a. n.a.
1.1 0.6 0.5 0.5 0.51.2 0.5 0.3 0.8 n.a.
1.7 0.9 1.6 0.9 n.a.1.8 1.1 1.3 n.a. n.a.
0.5 0.7 1.8 0.7 0.22.6 2.0 2.7 -0.2 n.a.
1.4 1.4 3.4 0.9 n.a.1.6 1.5 1.3 1.2 n.a.
1.41.3
1.4 1.1 1.0 n.a.1.2 0.8 0.4 n.a.
9.313.9
13.710.9
5.98.9
20.522.5
7.922.9
21.119.0
14.613.6

TRADE AND CURRENT-ACCOUNT BALANCES OF MAJOR INDUSTRIAL COUNTRIES a(Billions of U.S. dollars; seasonally adjusted)
1978 1979 1980 19801978 1979 Q4 Q1 Q2 Q3 Q4 Q1 Mar. Apr. May
Canada: Trade 3.1 3.4 0.7 0.6 0.6 0.9 1.3 1.5 0.6 0.0 n.a.Current Account -4.6 -4.2 -1.5 -1.2 -1.3 -0.9 -0.8 -0.6 * * *
bFrance: Tradeb 0.7 -2.4 0.1 0.4 -0.4 -1.4 -1.3 -3.5 -1.4 -0.5 -1.7Current Account 3.7 1.2 1.3 0.5 0.7 0.1 -0.1 -2.5 * * *
Germany: Trade 20.6 12.1 5.8 4.4 4.0 2.4 1.4 1.9 0.7 1.8 n.a.Current Account 8.9 -5.8 4.8 1.4 -1.1 -4.2 -1.1 -2.8 -0.7 -1.0 n.a.
Italy: Trade -0.5 -5.3 0.1 -0.1 -0.4 -1.5 -3.3 -4.1 -1.1 -1.2 n.a.Current Account 6.4 5.2 1.7 1.1 2.1 3.9 -1.8 n.a. * * *
Japan: Trade 24.6 2.0 4.2 2.5 1.9 -1.0 -1.4 -1.9 -1.2 -0.7 0.1Current Account 16.5 -8.7 1.7 0.1 -0.7 -3.9 -4.2 -5.2 -2.4 -1.8 -1.0
United Kingdom: Trade -2.9 -6.9 -0.4 -3.2 -1.0 -1.1 -1.6 -1.6 -0.4 -0.6 0.0Current Account 1.8 -4.8 1.1 -2.4 -0.6 -0.2 -1.5 -0.9 -0.3 -0.5 n.a.
United States: Trade -33.8 -28.4 -6.8 -5.1 -8.1 -7.1 -9.2 -10.9 -2.3 -1.7 n.a.Current Account -14.3 -0.8 -0.8 1.4 -1.5 1.1 -1.8 -2.6. * * *
a The current account includes goods, services, and private and officialb French annual data are not seasonally adjusted.c Not seasonally adjusted.* Comparable monthly current account data are not published.
transfers.

IV-15
In general, the major industrial countries are still experiencing
large trade and current-account deficits, although in some cases the
deficits have narrowed somewhat in recent months. The Japanese current-
account deficit averaged more than $1-1/2 billion in the first five
months of the year, but was less than $1 billion in May. The U.K.
current-account moved into small surplus in May. In Germany
however, another large deficit ($1 billion in April) brought the four-
month cumulative deficit to more than $4 billion, compared to a $2 bil-
lion surplus in the corresponding period a year earlier.
Since the previous greenbook, three-month interest rates have de-
clined somewhat in the major industrial countries, with the exception
of Italy and the United Kingdom, but in the latter case short-term rates
are below levels reached earlier in the year.
Individual Country Notes. Recently released GNP statistics show
that the Japanese economy continued to expand strongly in the first
quarter. Led by real exports and private fixed capital formation, GNP
increased at a 7.2 percent annual rate to bring real growth in FY 1979
to 6.1 percent, slightly above the official fiscal-year target. This
strength appears to have continued in the second quarter. In the three
months ending in May, industrial production increased at a 6-1/2 percent
annual rate, and recent assessments by both the Japanese EPA and Bank of
Japan conclude that activity has remained strong. Although the recent
appreciation of the yen may exercise some limiting effect on the further
expansion of exports, surveys of investment intentions indicate that
private fixed capital formation is expected to continue to be an import-
and source of strength for at least the rest of this year. Accordingly,

IV-16
some private forecasters now foresee little or no slowdown in real
growth during 1980.
Although the inflation situation in Japan is still a serious con-
cern, there have been some favorable developments recently. The whole-
sale price index fell in May by 0.2 percent, following increases that
averaged 2.4 percent for the first four months of the year. Lower
dollar prices for some imported commodities, together with the effects
of appreciation of the yen during May, contributed to the decline. The
CPI increased by only 0.2 percent in June, after registering month-to-
month increases that averaged 1.0 percent between January and May.
Prospects for controlling inflation have been improved considerably by
the recent wage settlements in the moderate range of 6-1/2 - 7 percent,
as well as by continuing advances in productivity.
Monetary conditions in Japan still remain tight. Short-term
market rates declined by 50-100 basis points in June, but the discount
rate remains at 9 percent, and newly announced lending limits for the
third quarter will allow large city banks to expand credit to a level less
than 6 percent above that of the corresponding period last year.
The current-account deficit contracted by over $800 million in
May to a deficit of $960 million, largely on the basis of a strong surge
in exports, which expanded by almost 8 percent.
Real GNP in Germany expanded at almost a 7 percent annual rate
in the first quarter of this year. While part of this strength is
attributable to extra workdays, for which the above figure is not
adjusted, other first-quarter data on economic activity, such as in-
dustrial production, sales and orders, confirm the impression that
IV-17
activity was strong. Among the sources of strength were consumption
and, particularly ,exports of goods and services.
There have been some signs recently that activity may be slowing.
Industrial production in April fell by 1.6 percent, after having risen
steadily in the first quarter, while the volume of orders in April
dropped sharply, especially in the consumer and investment goods sector.
The drop in the overall orders volume index of 4.6 percent in April was
the largest such monthly drop since December 1974. Retail sales, which
had been weakening since January, fell a further one percent in real
terms in April. The rate of unemployment rose slightly to 3.7 percent
(s.a.) in May.
The rate of consumer price inflation was 0.5 p rcent in June,
about the same as in April and May; the annualized rate for the first six
months of this year is 7.5 percent. Wholesale and producers' prices have
risen much faster, however.
The German current-account deficit has continued to accumulate
at a $12 billion annual rate. After a $1 billion deficit in April, the
current-account deficit for the first four months of this year was $4.1
billion, compared with a surplus of $2.0 billion for the same period of
last year. Despite the declining current-account balance, real net
exports have risen very strongly so far this year. The German current-
account deficit is largely the result of higher import prices - espe-
cially the price of imported energy.
In the United Kingdom the output-based measure of real GNP fell by
0.7 percent (s.a.) in the first quarter of 1980. Part of this decline
reflected a strike in the nationalized sector of the steel industry
IV-18
during the quarter. Data since the end of the strike indicate, however,
that the United Kingdom is currently in a recession: in April industrial
production continued to decline, falling 0.6 percent; the volume of re-
tail sales fell by 0.3 percent (s.a.) in the same month; the unemploy-
ment rate continued to increase, rising to 6.3 percent in June; and new
construction orders fell 1.0 percent in the three months to April from
the previous three months.
The rate of retail price inflation fell dramatically from 3.4 per-
cent (n.s.a.) in April (which was extraordinarily high due primarily to
higher taxes associated with the March Budget and other government taxes
and fees) to 0.9 percent in May. The rate of increase in the wholesale
price index also declined somewhat, from 1.3 percent (n.s.a.) in April
to 1.2 percent in May.
The U.K. trade deficit (s.a.) declined sharply to $40 million in
May from nearly $600 million in April. With the surplus on services
running unchanged at about $110 million, the current account swung into
surplus for the first time this year. The smaller trade deficit re-
flected a 2.4 percent rise in export volume, a 4.9 percent fall in im-
port volume, and roughly unchanged unit values.
Real GNP in Canada fell 2.0 percent (s.a.a.r.) in the first
quarter. Marked inventory adjustments coupled with declining export
volumes and a sharp fall in residential construction were major con-
tributory factors to the negative first quarter GNP growth.
The rate of consumer price inflation accelerated in May to 1.2
percent after slowing to 0.6 percent in April. The average month-
to-month increase in the first five months of the year was about 0.9

IV- 19
percent. Prices increased most rapidly for non-food items, but prices
accelerated across every category of the index.
In the first quarter of 1980, the Canadian current-account
deficit (s.a.) was $584 million, compared with $761 million in the
fourth quarter 1979. A principal element in this lower deficit was a 10
percent rise in the merchandise trade surplus in the first quarter to
$1.5 billion as the rate of growth in the value of exports at 4.0 per-
cent was one percentage point above that for imports. Growth in the
value of trade was attributable entirely to price increases, however,
as the volume of exports and imports both declined. Reduction in
automobile and timber exports to the U.S. were major factors in the de-
crease in export volume.
French real GDP (s.a.) in the first quarter of 1980 continued to
grow at a 1.6 percent annual rate. Recent industrial production figures
and survey data indicate that relatively slow growth persisted in the
second quarter as well; in the three months ending in April, industrial
production was virtually flat. Since January, the unemployment rate
has increased by 0.1 percentage point each month to a level of 6.5 per-
cent in May.
Consumer and wholesale prices in France have continued their
strong upward trend. Following large increases early in the year, con-
sumer prices have continued to rise at month-to-month rates in the 12-15
percent range at an annual rate.
The current-account deficit for the first quarter was $2.5 billion,
which may be compared with the $1.2 billion surplus for all of 1979.

IV-20
In Italy, first quarter GDP (s.a.) grew by 1.5 percent, follow-
ing a 3.9 percent increase in the fourth quarter of 1979. Industrial
production grew at the healthy pace of 1.8 percent in April yielding a
cumulative increase of about 12-1/2 percent over its year-earlier level.
In March, capacity utilization reached its highest level since mid-1974.
The rate of increase in consumer prices decelerated in May to 0.9
percent, following a 1.6 percent increase in April. The average
annualized rate of inflation in the CPI for the first five months is
about 20 percent.
Italy's trade deficit through April was $5.3 billion (customs
basis, imports c.i.f.), up from a deficit of $3.7 billion in the
previous four months and a marked decline from a surplus of $0.3 billion
in the first four months of 1979. Rising import volumes due to buoyant
domestic demand, as well as higher oil prices, are partially responsible
for the larger deficit. There are also indications that exports are
weakening, possibly reflecting a loss of competitiveness as a result of
Italy's high rate of inflation relative to its trading partners.
Inflation in the Netherlands accelerated in the three months ending
in May to a 10.6 percent annual rate. The unemployment rate rose from
5.1 percent in April to 5.4 percent in May, suggesting the possible be-
ginning of a slowdown in real activity. In view of the continued
strength of the guilder within the EMS and the recent decline of domestic
money-market interest rates, the Netherlands Bank lowered its discount
rate from 10 percent to 9.5 percent on June 23.
In Belgium inflation continues to be rapid but has decreased
somewhat from the very high rates of January and February. In the three

IV-21
months ending in May, the consumer price index rose at an average
annual rate of 5.7 percent over the previous three months. In response
to lower short-term interest rates in the domestic money market and
abroad and to preliminary indications of an expected slowdown in
activity, the Belgian National Bank announced on June 25 a lowering of
its entire structure of discount rates by 1 to 1-1/2 percentage points.
In Switzerland preliminary data indicate that real economic
activity remains very strong. Unemployment at the end of May was at
its lowest level since April 1975 and constituted only 0.2 percent of
the labor force; at the end of May fewer than 6 thousand Swiss were un-
employed. The consumer price index in April and May was 4.2 percent
above its year-earlier level, which is approximately the rate of in-
crease for the first quarter of 1980 as well.
In the Scandinavian countries there is little evidence to suggest
an abatement of inflation. In Sweden and Norway, consumer prices in the
three months ending in May rose at average annual rates of 13.4 and
15.8 percent, respectively, while the corresponding figure for Danish
prices in the three-month period ending in April was 12 percent. In
all three countries, recent movements in wholesale prices do not suggest
any forthcoming let-up in these rates.