Embed Size (px)
Citation preview

Prefatory Note The attached document represents the most complete and accurate version available based on original copies culled from the files of the FOMC Secretariat at the Board of Governors of the Federal Reserve System. This electronic document was created through a comprehensive digitization process which included identifying the best-preserved paper copies, scanning those copies,1
and then making the scanned versions text-searchable.2
Though a stringent quality assurance process was employed, some imperfections may remain. Please note that some material may have been redacted from this document if that material was received on a confidential basis. Redacted material is indicated by occasional gaps in the text or by gray boxes around non-text content. All redacted passages are exempt from disclosure under applicable provisions of the Freedom of Information Act. 1 In some cases, original copies needed to be photocopied before being scanned into electronic format. All scanned images were deskewed (to remove the effects of printer- and scanner-introduced tilting) and lightly cleaned (to remove dark spots caused by staple holes, hole punches, and other blemishes caused after initial printing). 2 A two-step process was used. An advanced optical character recognition computer program (OCR) first created electronic text from the document image. Where the OCR results were inconclusive, staff checked and corrected the text as necessary. Please note that the numbers and text in charts and tables were not reliably recognized by the OCR process and were not checked or corrected by staff.
Content last modified 6/05/2009.

CONFIDENTIAL (FR)
June 16, 1976
CURRENT ECONOMIC AND FINANCIAL CONDITIONS
By the StaffBoard of Governors
of the Federal Reserve System

TABLE OF CONTENTS
Section Page
DOMESTIC NONFINANCIAL DEVELOPMENTS II
Industrial production... . ... ............................... 1Nonfarm payroll employment .................................... 3Unemployment rate.......... ... ............................. 3Retail sales ................................................. 3Consumer attitude surveys..................................... 5Book value of business
inventories ............................................... 7Commerce survey of anticipated
plant & equipment expenditures.............................. 7Capital appropriations...................................... 9New orders for nondefense
capital goods..... .............................. .......... 9Contracts for commercial and
industrial buildings...................................... 9Private housing starts....................................... 11Wholesale prices............... ... ........ ...... ..... 14Consumer price index........................................ 16Major materials capacity utilization ........................ 16Federal budget deficit...................................... 20State and local purchases................................... 21
TABLES:
Nonfarm payroll employment................................... 2Selected unemployment rates................................... 2Retail sales................................ . .. ............ 4Auto sales................................. ................ 4Business inventories........................................ 6Inventory ratios.............................................. 6Survey results of anticipatedplant & equipment expenditures.............................
Manufacturers' new capital appropriations..................... 8New orders received by manufacturers......................... 10Construction contracts for commercial
and industrial building ................................... 10New private housing units..................................... 12Home sales................................................ ..... 13Consumer prices................. ........................... 15Wholesale prices ............................................. 15Payroll employment: prerecession
peak and current levels................................... 17Industrial production: prerecession peaksand April levels........................................... 17
Average hourly earnings index................................. 19Federal sector accounts...................................... 22

TABLE OF CONTENTS Continued
Section Page
DOMESTIC FINANCIAL DEVELOPMENTS III
Monetary aggregates and bank credit.......................... 3Business credit.................................. ................ 7Other securities markets...................................... 11Mortgage market and consumer credit.......................... 12
TABLES:
Selected financial market quotations......................... 2Monetary aggregates .......................................... 4Commercial bank credit,..................................... 8Security offerings .......... ..... ...................... 10Interest rates and supply of funds forconventional home mortgages at selected S&L's................ 13
Secondary home mortgage market activity...................... 13Consumer instalment credit,................................... 16
INTERNATIONAL DEVELOPMENTS IV
International capital markets................................. 3Euro-bond ................................................ 3U.S. international transactions................................ 8U.S. merchandise trade........................................ 8Exports................. ..... ............ ......... ...... 9Agricultural exports........................................... 9Non-agricultural exports....................................... 9Imports........ ............................................... 9Non-fuel imports.... o ports.......................................... 10Bank-reported private capital transactions..................... 10Net private transactions in securities........................ 12U.S. liabilities to non-OPEC foreign
official institutions.............................. ..... 12Economic activity in major foreign countries................... 13U.K. incomes policy................................. 0 ........ 19
TABLES:
Borrowing in selected internationalfinancial markets . .......................................... 4
U.S. merchandise trade, BOP basis........ .................. 8
Bank-reported private capital transactions..................... 11Industrial production in major foreign countries............... 13-AProductivity gaps in major foreign countries................... 15-A
II - T - IJune 16, 1976
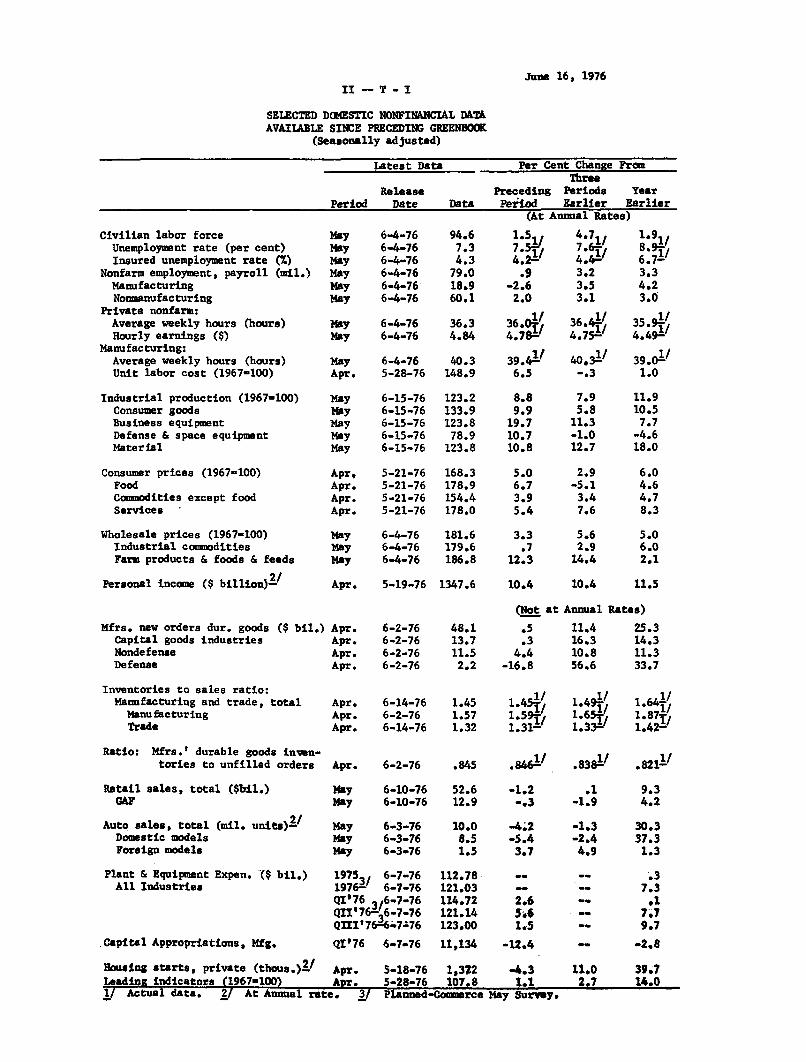
SELECTED DOMESTIC NONFINANCIAL DATAAVAILABLE SINCE PRECEDING GREENBOOK
(Seasonally adjusted)
Latest Data Per Cent Change FromThree
Release Preceding Periods YearPeriod Date Data Period Earlier Earlier
Civilian labor forceUnemployment rate (per cent)Insured unemployment rate (%)
Nonfarm employment, payroll (mil.)ManufacturingNonmanufacturing
Private nonfarm:Average weekly hours (hours)Hourly earnings ($)
Manufacturing:Average weekly hours (hours)Unit labor cost (1967=100)
Industrial production (1967=100)Consumer goodsBusiness equipmentDefense & space equipmentMaterial
Consumer prices (1967=100)FoodCommodities except foodServices
Wholesale prices (1967=100)Industrial commoditiesFarm products & foods & feeds
Personal income ($ billion)2/
Mfrs. new orders dur. goods ($ bil.)Capital goods industriesNondefenseDefense
Inventories to sales ratio:Manufacturing and trade, total
ManufacturingTrade
Ratio: Mfrs.' durable goods inven-tories to unfilled orders
Retail sales, total ($bil.)GAF
6-4-766-4-766-4-766-4-766-4-766-4-76
94.67.34.3
79.018.960.1
(At Annual Rates)
1.5 4.71 1.97.5 7:.6- 8.9 ,4.2- 4.4 6.7
.9 3.2 3.3-2.6 3.5 4.22.0 3.1 3.0
May 6-4-76 36.3 36.0/ 36.4May 6-4-76 4.84 4 . 7 8 / 4.754
35.914.4'/
May 6-4-76 40.3 39.4 -1 40.3 1 / 39.0 1/
Apr. 5-28-76 148.9 6.5 -. 3 1.0
MayMayMayMayMay
Apr,Apr.Apr.Apr.
6-15-766-15-766-15-766-15-766-15-76
5-21-765-21-765-21-765-21-76
May 6-4-76May 6-4-76May 6-4-76
123.2133.9123.8
78.9123.8
168.3178.9154.4178.0
181.6179.6186.8
Apr. 5-19-76 1347.6
Apr.Apr.Apr.Apr.
6-2-766-2-766-2-766-2-76
Apr. 6-14-76Apr. 6-2-76Apr. 6-14-76
48.113.711.52.2
8.89.9
19.710.710.8
5.06.73.95.4
3.3.7
12.3
10.4
.5
.34.4
-16.8
7.95.8
11.3-1.012.7
2.9-5.13.47.6
5.62.914.4
10.4 11.5
at Annual
11.416.310.856.6
Rates)
25.314.311.333.7
1.45 1 451 1.491 1.641.57 1.5 1 1.65- 1.87-/1.32 1.31- 1.3 1.42
Apr. 6-2-76 .845 .846
May 6-10-76 52.6 -1.2May 6-10-76 12.9 -. 3
1 .83/ .8211/
.1-1.9
Auto sales, totalDomestic modelsForeign models
Plant & EquipmentAll Industries
(mil. units) 2 /
Expen. ($ bil.)
May 6-3-76May 6-3-76May 6-3-76
19753, 6-7-761976-' 6-7-76QI'76 36-7-76QII'763 6-7-76QIII'7667-76
10.08.51.5
-4.2-5.43.7
-1.3 30.3-2.4 37.34.9 1.3
112.78121.03114.72121.14123.00
Capital Appropriations, Mfg.
Housing starts, private (thous.) 2 /Leading indicators (1967100)
/ Actual data. 2/ At Annual rate. 23
QI'76 6-7-76 11,134
Apr. 5-18-76 1,322Apr. 5-28-76 107.8
-12.4
-4.31.1
Planned-Commerce May Suryvy.
-2,8
11.0 39.72.7 14.0
11.910.57.7-4.618.0
6.04.64.78.3
II - 1
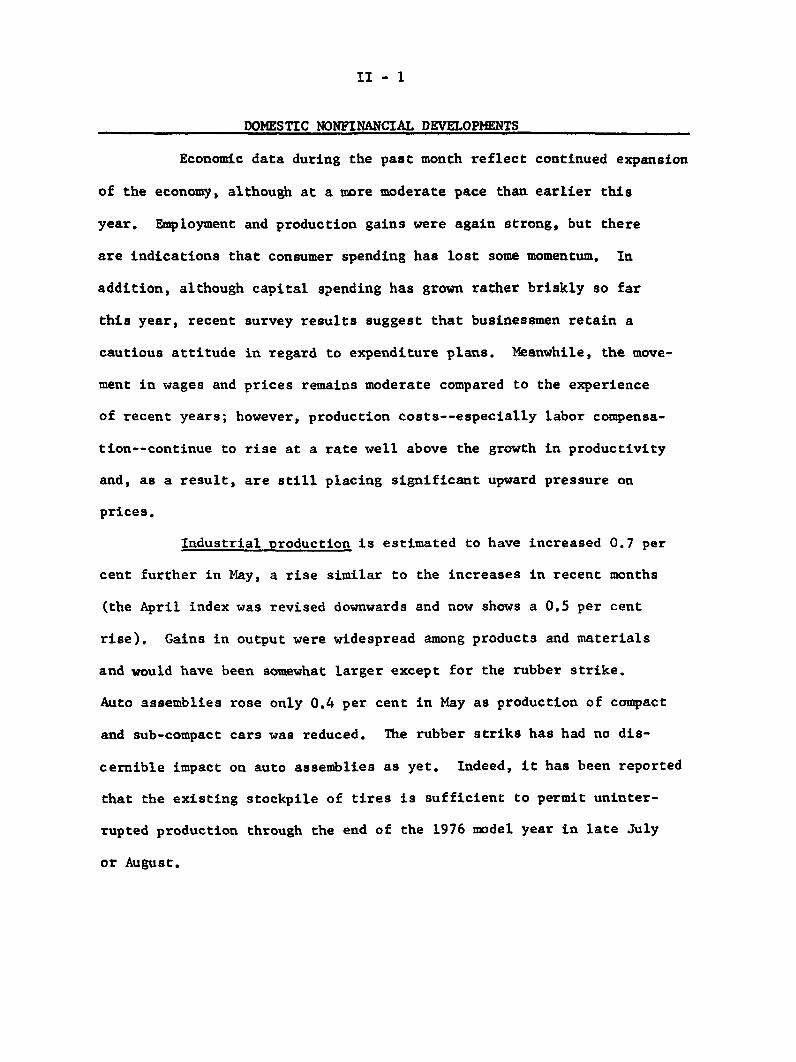
DOMESTIC NONFINANCIAL DEVELOPMENTS
Economic data during the past month reflect continued expansion
of the economy, although at a more moderate pace than earlier this
year. Employment and production gains were again strong, but there
are indications that consumer spending has lost some momentum. In
addition, although capital spending has grown rather briskly so far
this year, recent survey results suggest that businessmen retain a
cautious attitude in regard to expenditure plans. Meanwhile, the move-
ment in wages and prices remains moderate compared to the experience
of recent years; however, production costs--especially labor compensa-
tion--continue to rise at a rate well above the growth in productivity
and, as a result, are still placing significant upward pressure on
prices.
Industrial production is estimated to have increased 0.7 per
cent further in May, a rise similar to the increases in recent months
(the April index was revised downwards and now shows a 0.5 per cent
rise). Gains in output were widespread among products and materials
and would have been somewhat larger except for the rubber strike.
Auto assemblies rose only 0.4 per cent in May as production of compact
and sub-compact cars was reduced. The rubber striks has had no dis-
cernible impact on auto assemblies as yet. Indeed, it has been reported
that the existing stockpile of tires is sufficient to permit uninter-
rupted production through the end of the 1976 model year in late July
or August.
II - 2
NONFARM PAYROLL EMPLOYMENT(In thousands; seasonally adjusted)
Change From:Sept. 74 June 75 Mar. 76 Apr. 76
to to to toJune 75 May 76 Apr. 76 May 76
Nonfarm Total -2,487 2,656 312 57(Strike adjusted) (2,748) (149)
Construction - 510 10 26 10
Manufacturing -2,004 828 92 - 41(Strike adjusted) (848) ( 20)
Durable -1,416 501 59 32Nondurable - 588 327 33 - 73
Trade - 266 580 58 13Services and Finance 82 771 80 66State and local
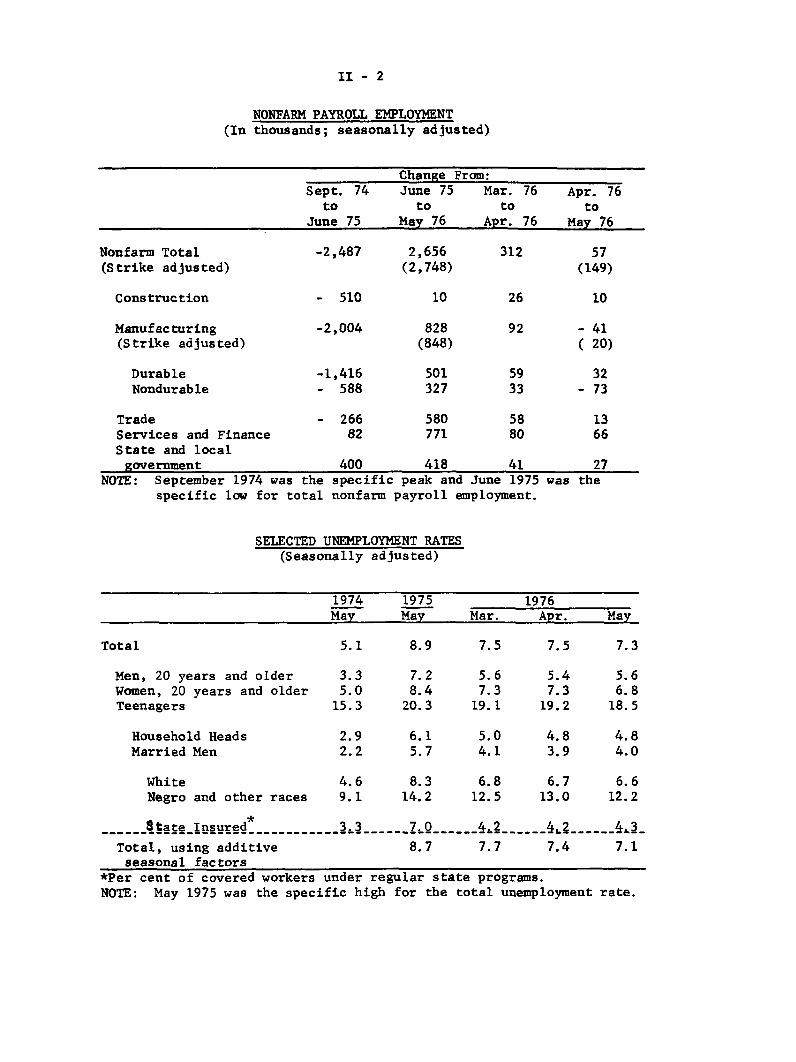
government 400 418 41 27NOTE: September 1974 was the specific peak and June 1975 was the
specific low for total nonfarm payroll employment.
SELECTED UNEMPLOYMENT RATES(Seasonally adjusted)
1974 1975 1976May May Mar. Apr. May
Total 5.1 8.9 7.5 7.5 7.3
Men, 20 years and older 3.3 7.2 5.6 5.4 5.6Women, 20 years and older 5.0 8.4 7.3 7.3 6.8Teenagers 15.3 20.3 19.1 19.2 18.5
Household Heads 2.9 6.1 5.0 4.8 4.8Married Men 2.2 5.7 4.1 3.9 4.0
White 4.6 8.3 6.8 6.7 6.6Negro and other races 9.1 14.2 12.5 13.0 12.2
------State Insured* _ 3 3 -..... 70_ .... _ 4,2 ..... 4. - .. 43_
Total, using additive 8.7 7.7 7.4 7.1seasonal factors
*Per cent of covered workers under regular state programs.NOTE: May 1975 was the specific high for the total unemployment rate.
II - 3
Output of other durable consumer goods showed strong gains.
Production of business equipment rose 1.6 per cent, but output of
construction products declined somewhat. Production of steel, aluminum,
and other nonferrous metals accelerated. Output of most nondurable
goods and nondurable materials increased moderately. But in recent
months, the main impetus behind overall production gains has begun
to shift to durables, while increases in total nondurables have
tailed off somewhat.
Paralleling the gain in production, jobs continued to
expand in May. Nonfarm payroll employment grew 150,000 (strike adjusted)
and is now 260,000 above its prerecession high. The average workweek
also rose sharply from the holiday-depressed April level but was only
slightly higher than in March. The unemployment rate fell 0.2 per-
centage points to 7.3 per cent, with improvement for women and youth.
Jobless rates for married men and persons covered by regular State
unemployment insurance programs were essentially unchanged from their
March and April levels.
The surge in consumer spending that has been a major source
of support for previous increases in production and employment has
lost some of its momentum in the past two months. Total retail sales
declined 1.2 per cent in May following a slight drop in April. The
advance estimate for the May level is only slightly above the first
quarter average.

II - 4
RETAIL SALES(Seasonally adjusted, percentage
change from previous period)
1975 1976III-IV IV-I I-M
Total sales
(Real*)
Total, less auto andnonconsumption items
GAF
Durable
Auto
Furniture andappliances
Nondurable
Apparel
Food
General merchandise
Gasoline
2.2
(1.0)
1.6
2.8
4.4
4.9
5.1
1.2
.7
1.0
2.7
-1.2
3.3
(3.0)
1.9
1.4
6.4
8.7
1.0
1.9
2.8
2.0
1.1
3.0
n.
ay Mar.
.3 1.4
a. (1.5)
.0
-1.3
1.0
1.1
2.1
-.1
-5.3
-1.6
-1.2
.1
2.0
2.1
.0
-1.8
2.4
2.1
.3
1.3
2.4
.8
*Deflated by an unpublished Bureau of Economic Affairs price measure.
AUTO SALES(millions of units; seasonally adjusted annual rates)
1975 1976 1976
III IV I Jan. Feb. Mar. Apr. May
Total auto sales 9.2 9.2 10.1 9.6 10.2 10.4 10.5 10.0
Imports 1.7 1.3 1.3 1.2 1.4 1.4 1.5 1.5
Domestic 7.5 7.9 8.7 8.4 8.7 8.9 9.0 8.5
Large 4.3 4.4 5.1 4.9 5.1 5.4 5.5 5.2
Small 3.2 3.6 3.5 3.5 3.6 3.5 3.4 3.2
-19761976
April
-.1
(-1.5)
-1.2
-3.6
2.7
4.0
-.1
-1.4
-7.2
-2.2
-3.6
-.1
May
-1.2
n.a.
-.3
-.3
-3.0
-3.9
-.3
-.4
1.0
-.2
-.7
-.4
II - 5
Sales o new domestic-type autos were at an 8.5 million unit
annual rate, off 500,000 from April and 200,000 below the first
quarter average. However, preliminary data for early June suggest
a pronounced rebound of auto sales. Retail sales excluding autos
and building materials fell by only 0.3 per cent last month, with losses
widespread by type of stores. The recent FTC ruling on Holder in Due
Course may be causing some selective reductions of availability of
consumer credit and, thereby, may be slightly curtailing sales for
some items.
The most recent consumer attitude surveys weakened after
improving for more than a year. The Conference Board survey--taken
in late March and early April--indicated increased concern about future
income and economic conditions. These attitudes were apparently
unrelated to actual developments at the time of the survey, since
appraisals of current economic conditions were little changed from
those reported in the February survey. Most questions in the Michigan
survey, which was taken more recently in late April and May, remained
at about the greatly improved first quarter level, although there was
a slight decline in the five questions used for the index of consumer
sentiment. Experience suggests that weakening of attitudes in these
two surveys is probably coincident with the recent decline in retail
sales, and does not necessarily have implications for future spending.
Moreover, the continued growth of employment and earnings in May and
real personal income gains of 0.5 per cent in April should support
further increases in consumption.
II - 6
BUSINESS INVENTORIES(Change at annual rates in seasonally
adjusted book values, $ billions)
1975 1976II III IV I Mar. Apr.
Manufacturing and trade -18.8 5.4 -1.3 19.5 19.9 10.7Manufacturing -12.5 -6.6 .6 6.3 9.9 .8
Durable -4.3 -8.6 -3.5 1.8 6.0 -. 8Nondurable -8.2 2.0 4.2 4.5 3.9 1.6
Trade, total -6.3 11.9 -1.9 13.2 10.0 9.9Wholesale -2.7 3.1 -2.0 5.1 1.1 3.1Retail -3.6 8.8 .1 8.0 8.9 6.8Auto -1.7 5.5 .3 -. 5 1.5 -. 4
INVENTORY RATIOS
1973 1974 1975 1976I I I I Mar. Apr.
Inventory to sales:Manufacturing and tradeManufacturing totalDurableNondurable
Trade, totalWholesaleRetail
1.471.601.911.23
1.34
1.201.42
1.491.632.051.18
1.351.101.52
1.661.922.501.32
1.421.261.57
1.481.632.09
1.15
1.331.19
1.42
1.451.592.021.14
1.311.181.41
1.451.572.001.13
1.321.181.42
.802 .699 .803 .846 .846 .845Inventories to unfilled ordersDurable manufacturing

I-7
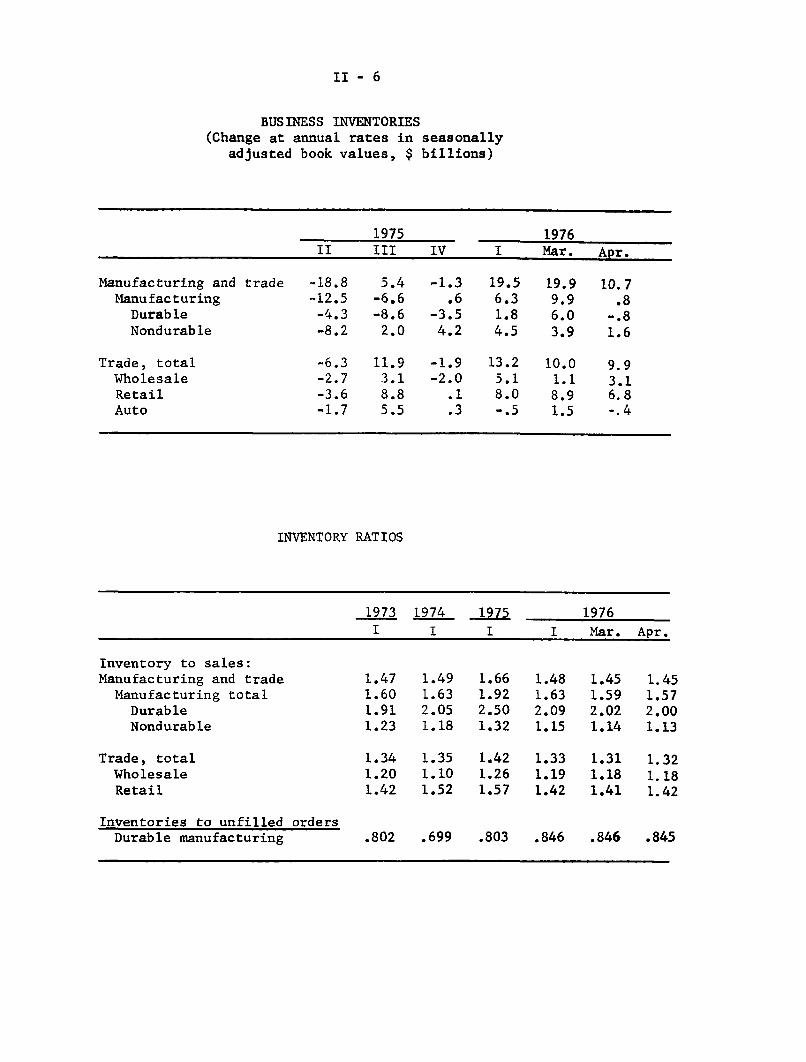
Inventory and investment data both indicate an underlying
cautibn in business attitudes. Book value of business inventories
rose at a $10.7 billion annual rate in April, about half the first
quarter rate of increase. At manufacturers, durable stocks were run
off slightly following a large March rate of increase, while nondurable
stocks rose at about half the average rate of the last two quarters.
The book value of trade inventories rose at about a $10 billion
annual rate in April, somewhat below the $13 billion first quarter
average rate of rise.
The slower rate of accumulation in April appears to be
signaling a transition, as soft-goods stocks adjust back to a more
"normal" rate of expansion after the extraordinarily large first
quarter rise. Hard goods, however, are probably only at the
beginning of their inventory build-up. Current inventory-sales
ratios on a book value basis are low by postwar standards and suggest
that stocks will be built-up as sales increase. For producers of
durable goods in April, the inventory-sales ratio had fallen below
the average level recorded in the expansion years of 1972 through
1974. The inventory-sales ratio for manufacturers of nondurable
goods declined further in April.
The May Commerce survey of anticipated plant and equipment
expenditures by business reported a 7.3 per cent increase for 1976.
These plans represent some improvement over the 6.5 per cent increase
reported in the February Commerce survey, but they are considerably
less optimistic than the McGraw-Hill spring survey that, on the basis
of a smaller and less representative sample, reported a 12.9 per cent
increase. The new Commerce survey indicates that nondurable manu-
facturers and utilities are planning the largest increases for the year.

II-8
Survey Results of Anticipated Plant and Equipment Expenditures1976
(Percent increase from 1975)
McGraw-Hill Commerce 1Oct. April Dec. Feb. May1975 1976 1975 1976 1976
All Business 8.8 12.9 5.5 6.5 7.3
Manufacturing 8.4 13.9 5.0 8.1 9.5
Durable 1.0 8.1 .8 5.0 4.1Nondurable 14.7 18.8 8.4 10.8 14.1
Nonmanufacturing 9.0 12.2 5.8 5.2 5.7
Mining 20.6 23.2 -4.1 2.3 .5Transportation -1.4 .4 -12.5 -17.7 -14.0Utilities 16.0 21.7 18.1 15.4 14.5Communications 7.0 9.0 13.1 6.5 8.6Commercial and Other 5.0 7.0 .8 3.4 3.3
1/The Commerce Department adjusts their survey results for systematic bias.Without bias adjustment the December survey showed a 7.3 per cent increase,the February survey showed a 9.0 per cent increase, and the May surveyshowed a 8.3 per cent increase.
Manufacturers' New Capital Appropriations 1/
(Per cent change from prior period based on seasonally
adjusted quarterly totals)
1975 1976
QI QII QIII QIV(r) QI(p)
Manufacturing -9.7 -3.3 -5.3 21.1 -12.4
Ex Petroleum -15.4 -14.7 -3.8 20.6 -1.3
Durable -27.4 -19.6 -4.2 16.5 10.2
Nondurables 9.2 8.2 -5.8 23.6 -23.7
Ex Petroleum 6.4 -8.6 -3.4 25.1 -12.9
1/Source is Conference Board Survey of 1000 largest manufacturing companiesas ranked by total assets.

II - 9
New capital appropriations of large manufacturing firms
declined 12.4 per cent in the first quarter. Excluding the volatile
petroleum industry, however, the total for manufacturing eased off
only 1.3 per cent after a whopping 20.6 per cent rise in the previous
quarter. Backlogs of unspent appropriations remain quite high rela-
tive to the current rate of spending; it would take 4.1 quarters to
work off existing backlogs.
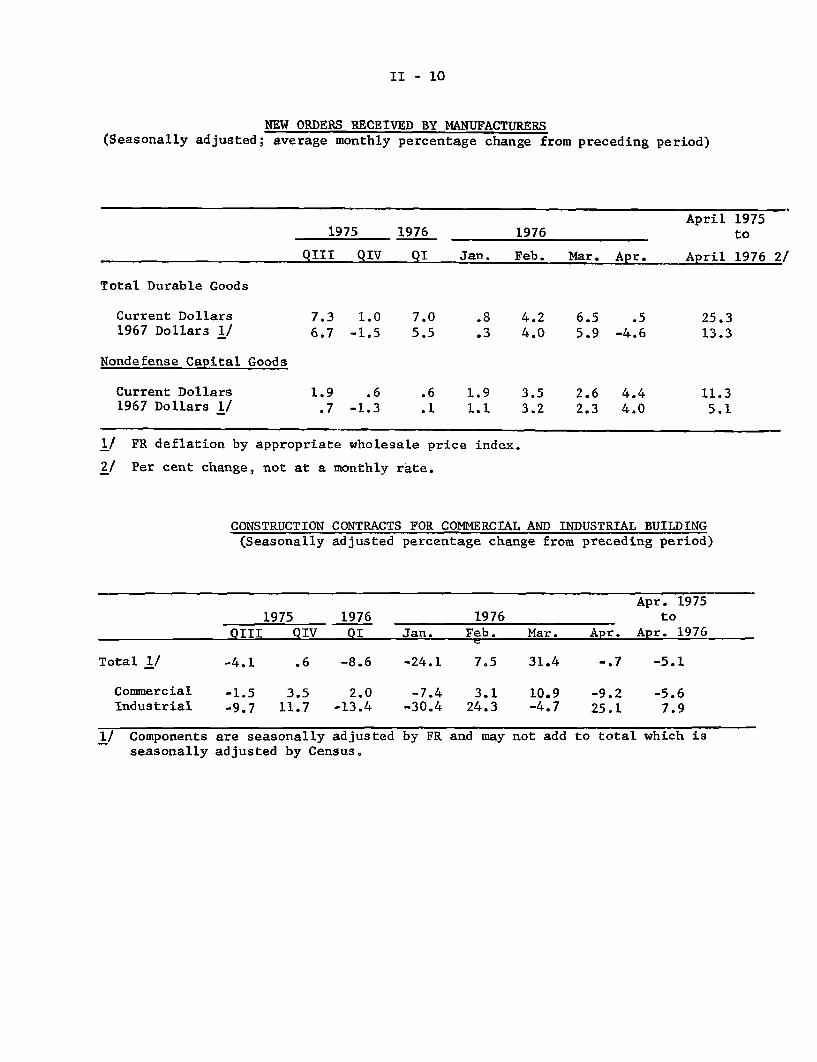
A more encouraging aspect of the available evidence about
business fixed investment is that new orders for nondefense capital
goods rose 4.4 per cent in April. This is the largest of four con-
secutive increases that have resulted in a total increase of 12.9 per
cent since December. In real terms, new orders are now 13 per cent
above their low of March 1975 but still one-fourth below their peak
of April 1974. So far, the rise in new orders has not resulted in
any build-up in unfilled orders, as shipments have kept pace with
incoming orders.
As is typical of the early stages of recovery in capital
spending, the prospects for nonresidential structures are weak rela-
tive to equipment. In April, the value of nonresidential construction
put in place decreased, and contracts for commercial and industrial
buildings (measured in square feet) edged off slightly following 2
months of gains. There has been no sustained advance in the latter
series, which was one third lower in April than the average monthly
rate in the peak year of 1973. But this series has not been a reliable
II - 10
NEW ORDERS RECEIVED BY MANUFACTURERS(Seasonally adjusted; average monthly percentage change from preceding period)
April 19751975 1976 1976 to
QIII QIV QI Jan. Feb. Mar. Apr. April 1976 2/
Total Durable Goods
Current Dollars 7.3 1.0 7.0 .8 4.2 6.5 .5 25.31967 Dollars 1/ 6.7 -1.5 5.5 .3 4.0 5.9 -4.6 13.3
Nondefense Capital Goods
Current Dollars 1.9 .6 .6 1.9 3.5 2.6 4.4 11.31967 Dollars 1/ .7 -1.3 .1 1.1 3.2 2.3 4.0 5.1
1/ FR deflation by appropriate wholesale price index.
2/ Per cent change, not at a monthly rate.
CONSTRUCTION CONTRACTS FOR COMMERCIAL AND INDUSTRIAL BUILDING(Seasonally adjusted percentage change from preceding period)
Apr. 19751975 1976 1976 to
QIII QIV QI Jan. Feb. Mar. Apr. Apr. 1976
Total 1/ -4.1 .6 -8.6 -24.1 7.5 31.4 -.7 -5.1
Commercial -1.5 3.5 2.0 -7.4 3.1 10.9 -9.2 -5.6Industrial -9.7 11.7 -13.4 -30.4 24.3 -4.7 25.1 7.9
1/ Components are seasonally adjusted by FR and may not add to total which is
seasonally adjusted by Census.
II - 11
leading indicator in recent quarters, largely because it does not cover
the nonbuilding construction components--public utilities, pipelines,
mining, and oil and gas drilling--which have recently been the source
of strength in nonresidential construction.
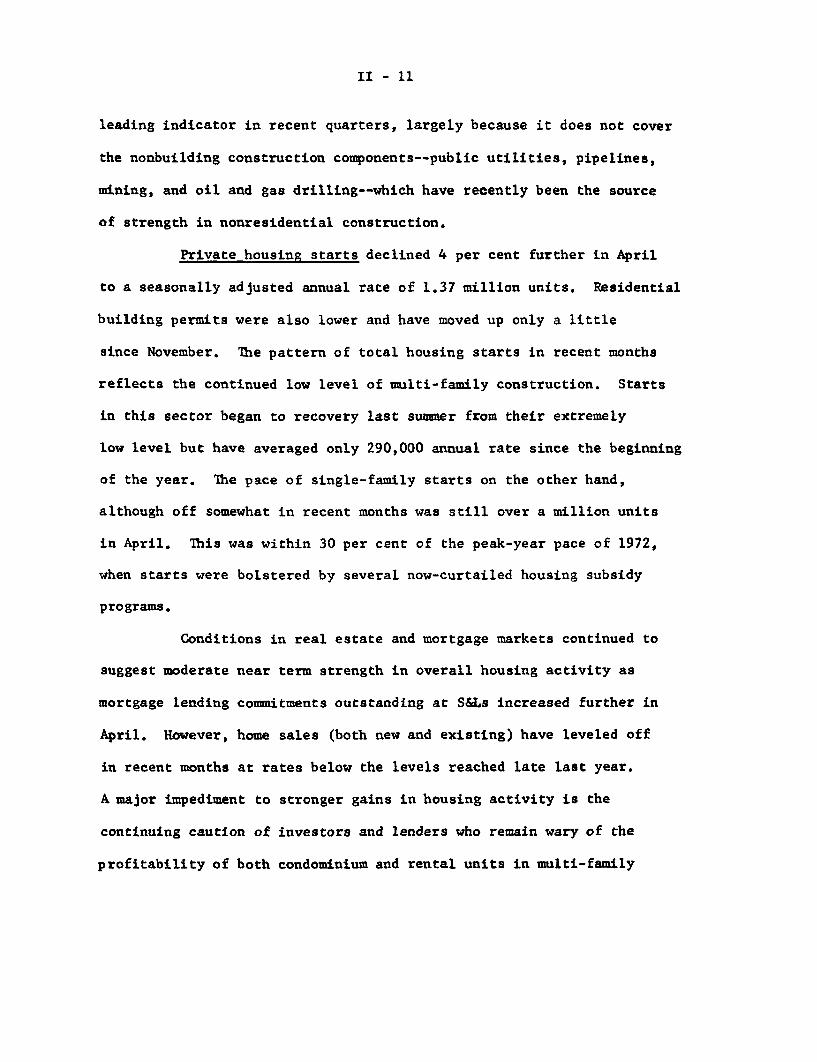
Private housing starts declined 4 per cent further in April
to a seasonally adjusted annual rate of 1.37 million units. Residential
building permits were also lower and have moved up only a little
since November. The pattern of total housing starts in recent months
reflects the continued low level of multi-family construction. Starts
in this sector began to recovery last summer from their extremely
low level but have averaged only 290,000 annual rate since the beginning
of the year. The pace of single-family starts on the other hand,
although off somewhat in recent months was still over a million units
in April. This was within 30 per cent of the peak-year pace of 1972,
when starts were bolstered by several now-curtailed housing subsidy
programs.
Conditions in real estate and mortgage markets continued to
suggest moderate near term strength in overall housing activity as
mortgage lending commitments outstanding at S&Ls increased further in
April. However, home sales (both new and existing) have leveled off
in recent months at rates below the levels reached late last year.
A major impediment to stronger gains in housing activity is the
continuing caution of investors and lenders who remain wary of the
profitability of both condominium and rental units in multi-family

II - 12
NEW PRIVATE HOUSING UNITS
(Seasonally adjusted annual rates, in millions of units)
1975
Permits
Starts
1-family2- or more-family
1/Under construction
1-family2- or more-family
Completions
1-family
2- or more-family
MEMO:
Mobile home shipments
QII
.90
1.05
.83
.22
1.05
.52
.53
1.24
.81
.43
.21
QIII
1.04
1.26
.95
.31
1.04
.53
.51
1.28
.91
.37
.23
1976
QIV
1.06
1.37
1.03.33
1.04
.56
.48
1.28
.91
.37
.23
QI
1.13
1.41
1.12.28
1.05
.59
.46
1.30
.97
.33
.27
Mar.(r)
1.13
1.43
1.12.31
1.05
.59
.46
1.39
1.02.37
.24
Apr. (p)
1.10
1.37
1.07.31
1.06
.6046
1.26
.98
.28
Per cent change inApr. from:
Month ago Year ago
-3 +32
-4 +40
-5 +38-3 +47
+1 -2
+1 +16-- -1q
-9-
-4"-24
+1
+25-39
1/ Seasonally adjusted, end of period.NOTE: -- indicates change of less than 1 per cent.
..

II - 13
HOME SALES
Median PricesNew Homes Sales and Stocks Sales Indexes of Unit Volume of Homes SoldHomes Homes Months' (1972=100, seasonally adjusted) New ExistingSold 1/ for sale 2/ supply New Existing homes homes(thousands of units) homes 3/ homes (thou. of dollars)
1975
QI 438 395 10.8 61 93 38.1 33.8QII 554 379 8.2 77 105 39.0 35.4QIII 564 384 8.2 79 111 38.8 36.1QIV 637 378 7.1 89 126 41.2 35.6
1976
QI (r) 611 389 7.6 85 121 42.8 36.6
1975
Oct. 610 389 7.7 85 122 40.7 35.4Nov. 660 381 6.9 92 126 41.1 35.7Dec. 641 378 7.1 89 131 42.1 35.8
1976
Jan. (r) 573 379 7.9 80 116 41.6 36.3Feb. (r) 677 385 6.8 94 122 42.9 36.2Mar. (r) 583 389 8.0 81 124 43.6 37.2Apr. (p) 613 393 7.7 85 124 44.1 37.7
1/ Seasonally adjusted annual rate.2/ Seasonally adjusted, end of period.3/ Converted to 1972 index for comparison with existing home sales, which are
not available on any other basis.

II-14
structures. In the case of condominiums, considerable overbuilding
in many areas along with publicity about earlier abuses by some
developers have sharply reduced the number of such starts. Con-
struction of rental units has been hampered by the failure of rents
to rise enough to cover higher development and operating costs.
However, there is evidence of some tightening in many local apartment
markets and the national vacancy rate for rental units of all types--
currently around 5-1/2 per cent--nearly matches the level prevailing
when the last multifamily building boom commenced in early 1970.
Other factors are apparently still hampering investor
interest in multifamily construction. The well-publicized multi-
family loan experience of some lenders, highlighted by the problems of
the REITs, apparently has limited activity by most groups of lenders.
Also, increased costs and more direct limitations associated with
environmental restrictions and "no growth" policies have probably
caused some multifamily developers and lenders to curtail plans until
more profitable conditions prevail.
The caution being exhibited by businessmen and consumers
likely stems in part from both the severity of the recent recession
and the fear of an acceleration of inflation. Of late, however, price
increases have continued to be relatively restrained. Wholesale prices
rose 0.3 per cent in May, after rising 0.8 per cent in April. The May
increase was principally the result of a 1.0 per cent rise in the farm

II-15
CONSUMER PRICES(Per cent changes at annual rates; based on seasonally adjusted data)1/
Relative
impor- Dec. 74 Dec. 75 Mar. 76tance to to to
Dec. 75 Dec. 75 Mar. 76 Apr. 76
All items 100.0 7.0 2.9 5.0
Food 24.7 6.5 - 7.9 6.7Commodities (nonfood) 38.7 6.2 2.9 3.9Services 36.6 8.1 10.6 5.4
Memo:
All items less foodand energy 2/3/ 68.1 6.7 7.7 6.6
Petroleum products 2/ 4.5 10.1 -15.7 -5.9Gas and electricity 2.7 14.2 6.4 2.6
1/ Not compounded for one-month changes.2/ Estimated series.3/ Energy items excluded: gasoline and motor oil, fuel oil and coal, and gas and
electricity.
WHOLESALE PRICES(Per cent changes at annual rates; based on seasonally adjusted data)1 /
Relativeimpor-tance
Dec. 75
Dec. 73to
Dec. 74
Dec. 74to
June 75
June 75
toOct. 75
Oct. 75to
Mar. 76
Mar. 76to
Mav 76
Apr. 76to
May 76
All commodities 100.0 20.9
Farm and food products 22.8
Industrial commoditiesExcluding fuels andrelated products andpower
Materials, crude andintermediate2/
Finished goods
Consumer nonfoodsProducer goods
Memo:Consumer foods
77.2
11.0
25.6
66.9 22.5
48.3 28.2
18.6 20.511.8 22.6
11.1 13.0
-5.6
3.0
2.6
2.0
3.88.7
11.7
16.9
9.9
6.6
8.4
11.38.6
10.6
0.0
-14.1 25.3
2.4
1.1
1.9
-0.4
2.5
-13.8 . 33.41/ Not compounded for one-month changes.2/ Estimated series.
12.3
0.7
-2.1
-1.3
0.00.7
12.4

I-16
and food products group where manufacturered animal feeds, sugar,
coffee and soybeans accounted for most of the rise. Industrial
prices edged up only 0.1 per cent as increases--mainly for machinery
and equipment; hides, skins and leather; crude petroleum and gas
fuels; and wastepaper and paper products--were only a little larger
than price declines, chiefly for textile products, apparel, lumber
and plywood. The May WPI, however, did not reflect the bulk of the
recently announced price increases for steel or the widespread
increases posted for gasoline; some of these will be reflected in the
June data and should result in larger increases in industrials over
the next several months.
The consumer price index which has also moderated signi-
ficantly from last year's pace, was up 0.4 per cent, seasonally
adjusted, in April. The CPI excluding food and energy prices rose 0.5
per cent, seasonally adjusted, in April and has been quite stable
around this rate for nearly a year. Both meat and gasoline prices
rose rapidly in April, but because of its timing the B.L.S. survey
did not pick up these increases in the April index; they will be
reflected in the May index, which is scheduled for release on June 22.
Even though the recovery has been underway for over a year,
capacity constraints do not appear to threaten a near-term worsening
of price developments. Major material capacity utilization now stands
at 82.6 per cent, considerably below the 93 per cent rate recorded in

II - 17
PAYROLL EMPLOYMENT: PRERECESSION PEAK AND CURRENT LEVELS(Seasonally adjusted, in thousands)
Per CentSelected Industry Prerecession Peak (date) May 1976 Difference
Total nonfarm 78,830 ( 9/1974) 78,999 0.2%
Goods-producing 25,115 (12/1973) 23,101 - 8.0
Contract construction 4,116 ( 2/1974) 3,402 -17.4Manufacturing 20,367 (12/1973) 18,928 - 7.1
Durable goods 12,097 (12,1973) 11,028 - 8.8
Primary metals 1,361 (12/1973) 1,180 -13.3
Fabricated metals 1,533 (12/1973) 1,388 - 9.5
Machinery ex. electrical 2,257 (10,1974) 2,058 - 8.8
Electrical equipment 2,083 (12/1973) 1,83.2 -12.0
Transportation equipment 1,910 ( 8/1973) 1.752 - 8.3
Nondurable goods 8,277 ( 1/1974) 7,900 - 4.6
Food 1,738 ( 3/1974) 1,701 - 2.1
Textiles 1,030 ( 3/1973) 973 - 5.5
Apparel 1,418 ( 4/1973) 1,314 - 7.3Printing 1,116 ( 9/1974) 1,077 - 3.5
Chemicals 1,067 ( 9/1974 1,026 - 3.8
Transportation and public utilities 4,721 ( 2/1974) 4,497 - 4.7
INDUSTRIAL PRODUCTION: PRERECESSION PEAKS AND APRIL LEVELS(Seasonally adjusted, 1967=100)
Per CentSector Prerecession Peak (date) April 1976 Difference
Total 127.5 (11/1973) 122.5 - 3.9%
Manufacturing 127.4 (11/1973) 121.5 - 4.6
Durable 124.3 (11/1973) 113.6 - 8.6
Nondurable 131.5 ( 2/1974) 132.9 1.1
Total final products 123.7 (11/1973) 121.9 - 1.5
Consumer goods 133.5 (11/1973) 133.5 0
Business equipment 132.5 ( 9/1974) 122.0 - 7.9
Materials 131.5 (11/1973) 122.7 - 6.7
II - 13
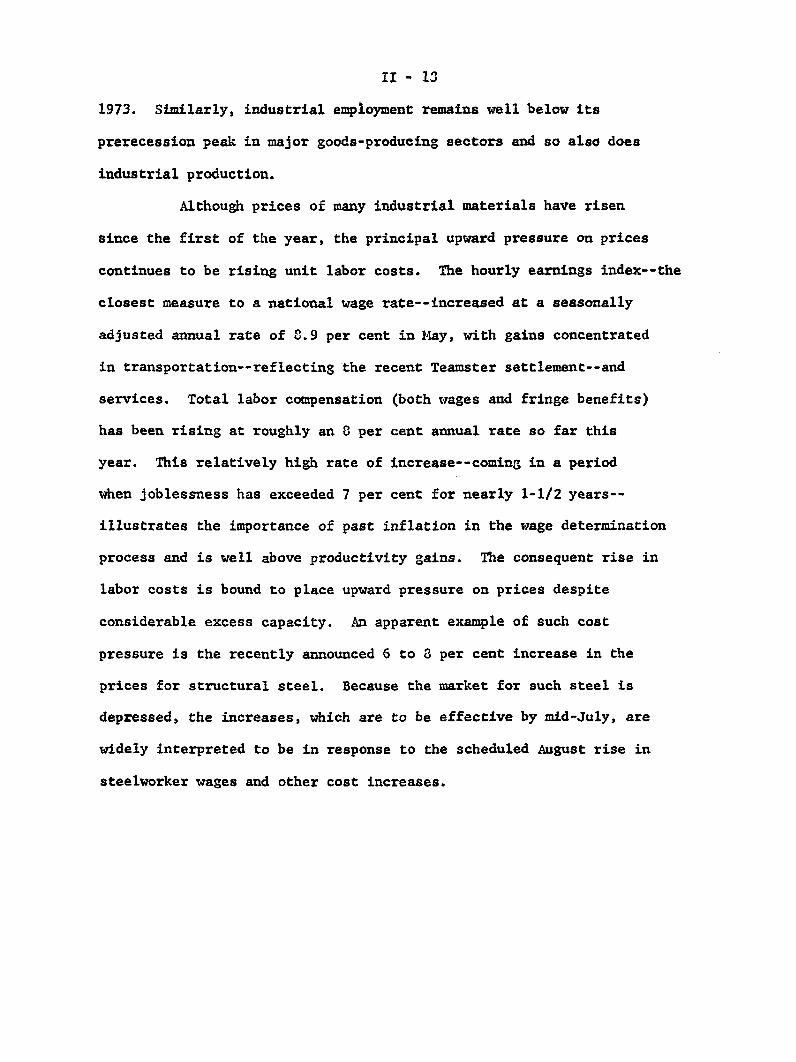
1973. Similarly, industrial employment remains well below its
prerecession peak in major goods-producing sectors and so also does
industrial production.
Although prices of many industrial materials have risen
since the first of the year, the principal upward pressure on prices
continues to be rising unit labor costs. The hourly earnings index--the
closest measure to a national wage rate--increased at a seasonally
adjusted annual rate of 8.9 per cent in May, with gains concentrated
in transportation--reflecting the recent Teamster settlement--and
services. Total labor compensation (both wages and fringe benefits)
has been rising at roughly an 8 per cent annual rate so far this
year. This relatively high rate of increase--coming in a period
when joblessness has exceeded 7 per cent for nearly 1-1/2 years--
illustrates the importance of past inflation in the wage determination
process and is well above productivity gains. The consequent rise in
labor costs is bound to place upward pressure on prices despite
considerable excess capacity. An apparent example of such cost
pressure is the recently announced 6 to 8 per cent increase in the
prices for structural steel. Because the market for such steel is
depressed, the increases, which are to be effective by mid-July, are
widely interpreted to be in response to the scheduled August rise in
steelworker wages and other cost increases.

II - 19
AVERAGE HOURLY EARNINGS INDEX*(Per cent change from preceding period, seasonally adjusted, compound annual rate)
Private Nonfarm
Construction
Manufacturing
Trade
Services
Trans. & PublicUtilities
1975 1976 May 75 to Dec. 75to1975
QIII QIV
8.6 8.3
6.6 4.4
8.6 8.3
8.7 6.4
7.3 10.6
12.9 11.7
1976QI April** May**
6.4 6.0 8.9
4.8 0.9 8.4
6.8 7.4 3.6
4.7 4.2 8.7
8.3 7.4 12.2
8.1 4.7 13.4
May 75 to Dec. 75 toMay 76 May
7.7 7.0
6.6 6.2
7.5 6.6
6.2 6.1
8.5 7.6
10.3 9.4
* Excludes the effects of interindustry shifts in employment andfluctuationsin overtime pay in manufacturing.
** Monthly change at an annual rate, not compounded.
II - 20
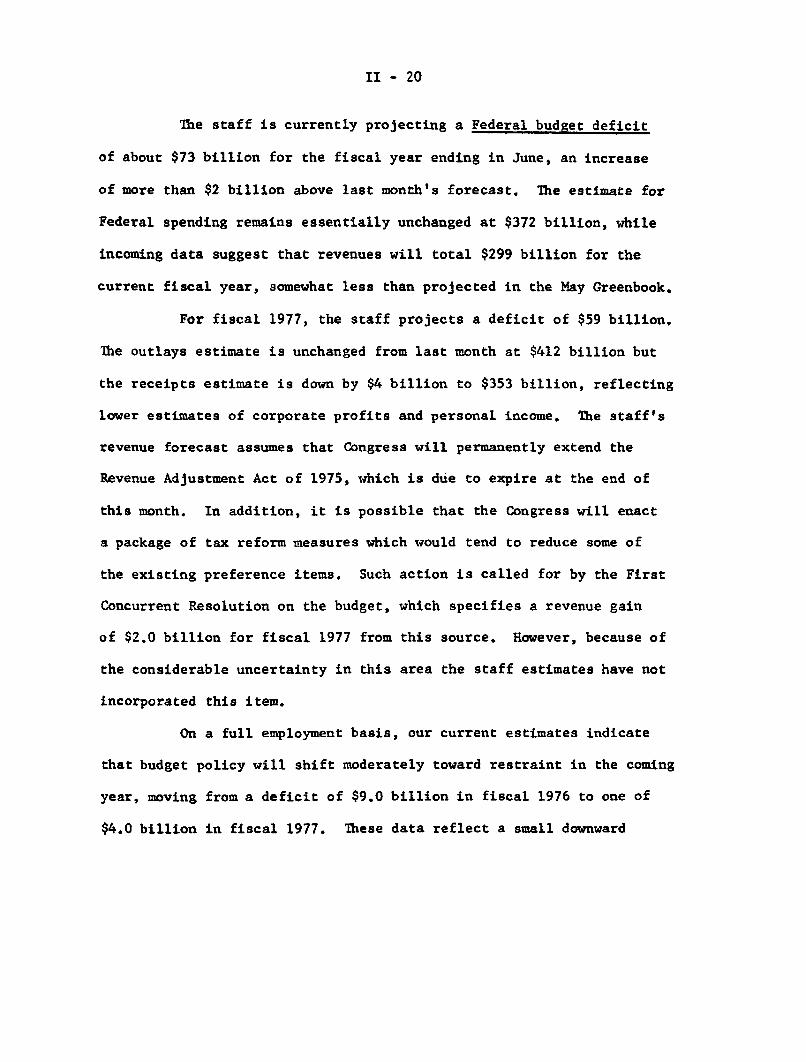
The staff is currently projecting a Federal budget deficit
of about $73 billion for the fiscal year ending in June, an increase
of more than $2 billion above last month's forecast. The estimate for
Federal spending remains essentially unchanged at $372 billion, while
incoming data suggest that revenues will total $299 billion for the
current fiscal year, somewhat less than projected in the May Greenbook.
For fiscal 1977, the staff projects a deficit of $59 billion.
The outlays estimate is unchanged from last month at $412 billion but
the receipts estimate is down by $4 billion to $353 billion, reflecting
lower estimates of corporate profits and personal income. The staff's
revenue forecast assumes that Congress will permanently extend the
Revenue Adjustment Act of 1975, which is due to expire at the end of
this month. In addition, it is possible that the Congress will enact
a package of tax reform measures which would tend to reduce some of
the existing preference items. Such action is called for by the First
Concurrent Resolution on the budget, which specifies a revenue gain
of $2.0 billion for fiscal 1977 from this source. However, because of
the considerable uncertainty in this area the staff estimates have not
incorporated this item.
On a full employment basis, our current estimates indicate
that budget policy will shift moderately toward restraint in the coming
year, moving from a deficit of $9.0 billion in fiscal 1976 to one of
$4.0 billion in fiscal 1977. These data reflect a small downward
II - 21
revision in the growth rate of potential GNP from 4 per cent to 3.75
per cent beginning with 1976, recently adopted by the Council of
Economic Advisers.
State and local purchases appear to be rebounding from the
low rate of growth experienced in the first quarter. Employment has
risen substantially since January and the value of construction put-
in-place, which increased by $0.7 billion in April, has risen by $4
billion from the low registered in February.

Federal Sector Accounts(billions of dollars)
I F.R.B. Estimates
Fiscal Fiscal Year 1976 / Fiscal Year 1977 e/ CY 19761/ Calendar quarters; unadjusted dataYear Admin. F.R. Admin. Cong. F.R. F.R. 1975 19761975* est.1/ Board est. 1/ est. 2/ Board Board IV* I* II III3/ IV
Unified budget receiptsUnified budget outlaysSurplus/deficit (-),unified budget 4/
Surplus/deficit (-), off-budget agencies
Means of financing combined deficits:Net borrowing from publicDecrease in cash operating balanceOther 5/
Cash operating balance, end of period
Memo: Sponsored agency borrowing
NIA BudgetReceiptsOutlays
Surplus/deficit (-)High Employment surplus/deficit (-)
(NIA basis) 8/9/
281.0324.6-43.6
-9.5
297.9372.2-74.3
-9.3
298.7371.5
-72.8-8.9
50.9 81.8 82.71.6 -2.3 -5.5.7 4.1 4.5
7.6 9.9 13.1
11.0
281.5328.7-47.2
351.5397.2-45.7-11.1
55.11.2
.5
362.5413.3
-50.8n.a.
n.a.n.a.n.a.
4.8 n.a.
3.1 10.8
307.4378.7-71.3
306.6/376.7-70.1'
364.7404.5-39.8
n.a.
352.9412.0
-59.1-11.1
65.64.1.5
314.8386.3-71.6-12.5
81.5-1.64.2
4.7 10.2
67.293.7
-26.6-2.6
66.989.6
-22.7-3.8
92.397.4-5.1-1.6
81.5100.5-19.1-4.5
74.198.8
-24.7-2.7
25.9 24.1 9.3 19.4 28.72.1 .5 -5.0 4.3 -1.41.2 1.8 2.4 -.1 .1
8.5 8.0 13.1
n.a. 2.6 1.8 .3 .3 .8 1.2n.a. 2.6 1.8 .3 .3 .8 1.2 1
n.a. n.e. 327.1n.a. n.e. 392.9n.a. n.e. -65.8
5.6 n.a. -8.9 n.a. n.a. -4.1
Seasonally adjusted, annual rates302.1 312.2 321.6 332.2 342.4374.2 381.3 387.6 396.5 406.2-72.1 -69.1 -66.0 -64.3 -63.8
-7.8 -11.7 -7.0 -5.2
e--Estimated n.e.--Not Estimated n.a.--Not Available p--Preliminary
Treasury statement, May 28, 1976.First Concurrent Resolution on the Budget, April 29, 1976.Effective in CY 1976, the fiscal year for the U.S. Government changes from July 1 - June 30 to October 1 - September 30. Hence, 1976 QIIIrepresents a transition quarter.Includes Federal Financing Bank, Postal Service, Export-Import Bank, Rural Electrification and Telephone revolving fund, Housing for theElderly or Handicapped Fund and Pension Benefit Guaranty Corporation.
Checks issued less checks paid, accrued items and other transactions.Includes Federal Home Loan Banks, Federal National Mortgage Association, Federal Land Banks, Federal Intermediate Credit Banks and Banks forCooperatives.Quarterly average exceeds fiscal year total by $.7 billion for FY 1976 due to spreading of wage base effect over calendar year.Estimated by F.R.B. staff.The high employment budget estimates now fully incorporates taxes on inventory profits beginning 1973.
"Actual- -
8.8 10.2

III-T-1SELECTED DOMESTIC FINANCIAL DATA
(Dollar amounts in billions)
Ind r Latest data Net change fromPeriod Level Month Three Year
ago months ago ago
Monetary and credit aggregatesTotal reservesNonborrowed reservesMoney supply
MlM2M3
Time and savings deposits(Less CDs)
CDs (dollar change in billions)Savings flows (S&Ls + MSBs 1 CreditBank credit (end of month)-
MayMay
MayMayMay
MayMay
Unions) MayMay
SAAR (per cent)34.15 4.4 1.134.03 1.9 .7
303.1697.0
1151.0
393.868.2
454.0741.9
5.68.8
10.4
11.1-3.212.8
5.2
8.910.912.1
12.5-7.213.9
5.9
Market yields and stock pricesFederal funds wk. encTreasury bill (90 day)
Commercial paper (90-119 day) "w utility issue Aaa "
unicipal bonds (Bond Buyer) 1 dayFNMA auction yield (FRA/VA)Dividends/price ratio (Common
stocks) wk. endNYSE index (12/31/65=50) end of c
Per erntaa r
ig.
g.lay
6/9/766/9/766/9/766/11/766/10/766/14/76
6/9/766/14/76
5.445.465.888.726.869.14
3.865.47
.424.424.63-. 10
.03.02
.09
.26
index points.57
4.384.63
.09-.12
.08
.15
.94
Credit demands
Business loans at commercialbanks 1/
Consumer instalment credit outstandingMortgage debt outst. (major holders)Corporate bonds (public offerings)Municipal long-term bonds (gross
offerings)Federally sponsored Agcy. (net borrowing)U.S. Treasury (net cash borrowing)
Net change orCurrent month
1976 1975
MayAprilMarchMay
MayMayJune
Total of above credits
.31.44.22.2e
34.5e-.73.9
-1.8-.22.53.8
29.0-1.5
.6
45.8 32.4
gross offeringsYear to date
1976 1975
-3.95.4
11.911.9e
14.2e.4
33.4
73.3
-4.5-1.0
7.917.4
12.2-1.136.1
67.0
e - Estimated1/ Data revised to reflect seasonal factor adjustment and benchmark to December 31,
1975, Call Report.
- -
-0.1
5.410.012.3
13.8-16.9
15.95.2
.29.31
4.33-. 23
.06.80
-. 216.08
U.c n a

III - 1
DOMESTIC FINANCIAL DEVELOPMENTS
Recent financial data suggest that some of the credit market
developments normally associated with a cyclical upswing in economic
activity may now be emerging. Further growth in outlays for inventories
and fixed capital apparently is generating an enlarged demand for external
funds in the business sector; in addition to continuing their high
volume of capital market financing, firms have, of late, become modest
net borrowers of short-term funds both at commercial banks and in the
commercial paper market. Perhaps with an eye to a prospective strength-
ening in business loan demands, as well as to the potential impace of
higher market rates of interest on savings and small denomination time
deposits, money market banks have begun to expand their CD liabilities.
And thrift institutions, although experiencing no significant reduction
to date in their deposit inflows, nonetheless have dipped modestly
into their ample stores of liquid assets to meet takedowns of mortgage
commitments.
These developments have left their imprint on market rates
of interest. With the Federal funds rate rising from 5-1/4 to 5-1/2
per cent immediately after the last FOMC meeting, most other short-term
yields also have increased further since mid-May. Yields on commercial
paper and CD's have posted the largest gains, advancing generally 1/4
to 1/2 of a percentage point, while yields on Treasury bills maturing
in over 3 months have risen no more than 1/8 of a point. Since money
market rates turned upward in mid-April, the spreads between Treasury
and private yields have widened, on balance, by 1/8 to 1/4 of a per-

III-2
SELECTED FINANCIAL MARKET QUOTATIONS(One day quotes--in per cent)
May '75 Apr.'76 May '761FOMC FOMC FOMC
May 20 Apr. 20 May 18 May 25 Je Ju1 June 8 June 15
Short-term
Federal funds / 5.13 4.78 5.28 5.50 5.54 5.44 5.48
Treasury bills3-month 5.11 4.73 5.28 5.46 5.55 5.45 56-month .37 5 73 5.84 5.90 5.77 741-year 5.70 5.62 6.03 6.17 6.27 6.15 6
Commercial paper1-month 5.25 4.75 5.25 5.50 5.63 5.63 5,753-month 5.50 5.00 5.50 5.75 5.88 5.88 6.00
21Large neg. CD's-3-months 5.60 5.05 5.63 5.95 5.95 5.90 5.856-months 6.10 5.45 6.15 6.50 6.55 6.38 6.25
Federal agencies1-year 6.44 5.84 6.65 6.83 6.81 n.a. n.a.
Bank prime rate 7.25 6.75 6.75 6.75 7.00 7.25 7.25
Long-term
Corporate 1!New AAA utility3/ 9.54 8.42 8.82 8.82 8.95 8.83 8.72pRecently offered- 9.61 8.44 8.78 8.83 8.84 8.80 8.79p
Municipal(Bond Buyer) - 6.88 6.54 6.83 6.91 7.03 6.89 6.86
U.S. Treasury(20-year constantmaturity) 8.14 7.82 8.13 8.14 8.10 8.07 8.02p
Stock pricesDow-Jones 830.49 1003.46 989.45 971.69 973.13 959.97 985.92N.i.S.E. 4/.d0 54.76 53.92 52.98 53.16 52.62 54.04AMEX 87.37 103.07 104.43 102.88 102.91 101.46 103.23Keefe Bank Stock 528 564 589 591 583 581 589/ Weekly average.2/ Highest quoted new issues.3/ One day quotes for preceding Friday.4/ One day quotes for preceding Thursday.5/ Average for first 6 days of statement week ending June 16.
n.a.--not available.p--preliminary.
III - 3
centage point; simultaneously, the spread between market yields and
commercial bank loan rates has diminished somewhat, despite the recent
increase from 6-3/4 to 7-1/4 per cent in the prime rate at most major
banks.
In long-term credit markets, the general level of interest
rates has changed little since the last Committee meeting. Earlier,
when the money markets first began to firm and market expectations
shifted, long rates had risen only slightly less than short rates, but
since late May, long rates have edged down. Credit market participants
recently have drawn encouragement from incoming data suggesting a
moderation in the pace of economic expansion and in the rise of indus-
trial prices, and they have become more sanguine about the near-term
outlook for System policy in light of the stabilization of the funds
rate and the return of growth in the monetary aggregates to a relatively
moderate pace.
Monetary Aggregates and Bank Credit
Since rising strongly in early April, M1 has fluctuated from
week-to-week within a rather narrow range, growing only modestly on
balance. On a monthly average basis, it rose at a 5-1/2 per cent annual
rate in May, as compared with 15 per cent in April.1/ In contrast to the
persistent weakness in money demand noted throughout most of 1975, the
8 per cent growth rate of M1 since January is more nearly in line with
1/ Preliminary data from the Demand Deposit Ownership Survey indicatethat the household sector accounted for much of the surge in M1during April. Gross demand deposits of households are estimatedto have risen at about a 19 per cent seasonally adjusted annualrate in that month.

III-4
1/MONETARY AGGREGATES-
(Seasonally adjusted changes)
Twelve
1975 1976 monthsending
HI HII QIV QI Apr. May p May 1976Per cent at annual rates
M1 (currency plus demanddeposits)
M2 (M plus time depositsat commercial banksother than large CDs)
M3 (M2 plus deposits atthrift institutions)
Adjusted bank credit proxy
Total time and savings de-posits at commercial banks
a. Other than large CD's
Savings depositsTime deposits
4.0 4.7 2.3 2.6 14.9
8.0 8.3 6.4 10.1 14.9 8.8 10.0
10.2 11.5 9.4 11.4 14.9 9.8 12.3
4.7 3.7 6.0 2.3
8.3 7.3 9.7 7.8
3.0 -3.9
1.0
11.3 11.4 9.8 15.9 14.9 11.1 13.8
15.7 17.0 14.4 28.3 22.1 17.7 23.38.3 7.4 6.6 6.7 9.1 5.6 6.9
Deposits at nonbank thriftinstitutions:
a. Savings and loanassociations
b. Mutual savings banksc. Credit unions
15.19.319.0
18.211.918.6
15.69.4
17.6
15.09.1
16,8
14.310.512.8
13.910.7n.a.
17.611.32/18.6-
Billions of dollars(Based on seasonally adjusted monthly data,not annualized)
Memoranda:
a. Total U.S. Governmentdeposits
b. Negotiable CD'sc. Nondeposit sources
of funds
0.1 0.3 0.2 1.1 -3.8 0.2 -0.1-1.0 -0.2 1.3 -3.2 -1.8 -3.2 -1.4
-0.2 0.2 0.5 -0.1 -0.7
1/ Half-year and quarterly growth rates are based on quarterly average data.2/ Twelve months ending April 1976.

III - 5
the average relationship among changes in money, income, and interest
rates that prevailed before mid-1974.
Although the data thus far available for early June are con-
sistent with the staff's expectation of further moderate expansion in
M1, a recent statutory change in New York State has injected a new element
of uncertainty into the outlook for this aggregate. Effective June 1,
mutual savings banks and State-chartered savings and loan associations
in that State were permitted to offer regular checking accounts to
consumers. Given the major share of MSB's in the New York market for
consumer time and savings deposits, the possibility exists that a
significant volume of demand deposits will be transferred from commercial
banks to MSB's--thereby imparting a downward bias to M1 as it is
currently measured.1/
Growth in the broader money stock measures--M2 and M3 --also
slackened in May. The moderation in M1 expansion accounted for most of
this deceleration, but slower growth of time and savings deposits
(excluding CD's) contributed as well. Inflows to savings and small
denomination time deposits may have been reduced somewhat by an unusu-
ally early reduction in the volume of tax refunds as well as by the
initial effects of higher market rates of interest.
Market yields, even on Treasury securities, now stand above
Regulation Q ceiling rates in all maturity categories. As yet, the
1/ A survey by the New York State savings bank association indicatedthat inflows to the new accounts at 28 MSB's amounted to $11 millionduring the first 4 days of June. It is impossible, on the basis ofavailable information, to make any blow-up of these data, but theydo suggest that the demand deposit flows in New York could have asmall, but noticeable, impact on the June growth rate of M1.

III - 6
differentials are not sufficient to stimulate significant disintermedia-
tion by potential holders of longer-dated time deposits. However, with
3-month Treasury bills bearing coupon equivalent yields in excess of
5-1/2 per cent, commercial banks appear to be experiencing a reversal
of the inflows of interest-sensitive funds to passbook accounts that
occurred earlier this year when money market yields declined. Growth
in savings deposits at commercial banks slowed from a 22 per cent annual
rate in April to an 18 per cent rate in May, and a marked further
1/diminution has been discernible in recent weeks.-
Perhaps reflecting in part their higher rate ceilings, deposits
at thrift institutions rose only slightly less rapidly in May than they
did in April. Furthermore, sample data for the first 5 days of June
indicate fairly substantial deposit gains at New York City MSB's,
although these inflows may have been bolstered by the $273 million of
Citicorp floating rate notes redeemed by investors on June 1.
The volume of large negotiable CD's outstanding at weekly
reporting banks continued to decline in the first half of May, as in-
flows of other deposits apparently were more than adequate to finance
the desired expansion of asset portfolios. Since mid-May, however, the
money market banks have become more aggressive bidders for CD funds--
especially, according to market reports, in maturities of 6 months
1/ Savings deposits at all commercial banks are estimated to havedeclined slightly on a seasonally adjusted basis in the week endedJune 2--the first weekly decline since late 1974. Unadjusted datafor weekly reporting banks show outflows since mid-May from savingsaccounts of individuals and of State and local governments.Business savings accounts registered a modest outflow for the firsttime in the week ended June 2.

III - 7
or more--and through June 2 had raised their outstandings by $1 billion
(seasonally adjusted).
Total bank credit expanded at a 5 per cent annual rate in May
(last-Wednesday-of-month basis), about the same increase as in April.
As in previous months, net acquisitions of Treasury securities accounted
for the bulk of asset growth; despite some strength in real estate
loans, total loans were essentially unchanged during the month.
Business Credit
Business short-term credit outstanding rose at a 3 per cent
annual rate in May after remaining unchanged in April. Despite the still
considerable cost advantage of open market financing, nonfinancial
firms as a group divided their short-term borrowing fairly evenly between
banks and the commercial paper market. At large banks, borrowing by
the trade, mining and utility sectors picked up, and borrowing by manu-
facturing concerns exhibited less weakness than in earlier months of
the year.
Although increased needs for working capital have led to
some firming in business demands for short-term financing, businesses
continue to seek funds primarily in the longer-term markets. The
desire for balance sheet restructuring appears to remain the major--but
perhaps no longer completely dominant--motivation in most industries.
Gross issues of publicly offered corporate bonds totaled $2.2 billion
during May, somewhat below the average monthly volume to date this year.

III-8
COMMERCIAL BANK CREDIT(Seasonally adjusted changes at annual percentage rates)1/-
1975 1976H1 H2 QIV Q1 Mar. Apr. May
2/Total loans and investments 2/ 4.2 4.5 4.6 5.5 6.9 5.4 5.2
U.S. Treasury securities 83.7 22.1 14.1 44.3 54.0 24.5 40.0
Other securities 4.1 2.9 .8 -4.1 -10.0 5.9 --
Total loans 2/ -3.8 2.3 4.3 2.1 3.8 1.9 .5
Business loans2/ -6.9 -1.7 -- -7.4 -17.6 -6.2 2.1Real estate loans 2.2 4.3 7.0 8.9 8.8 6.9 8.6Consumer loans -6.2 5.0 5.6 3.7 4.1 11.0 n.a.
MEMO: Business loans plusnonfinancial commercialpaper 3/ -7.1 -3.5 -3.4 -5.3 -17.2 -- 3.2
1/ Last Wednesday-of-month series except forto the last business day of the month.
June and December, which are adjusted
2/ Includes outstanding amounts of loans reported as sold outright by banks totheir own foreign branches, nonconsolidated nonbank affiliates of the bankholding companies (if not a bank), and nonconsolidated nonbank subsidiariesof holding companies.
3/ Nonfinancial commercial paper is measured from end-of-month to end-of-month.p- Preliminary.n.a.-Not available.
NOTE: DATA REVISED TO REFLECT REVISIONS IN SEASONAL FACTORS AND BENCHMARKINGTO THE DECEMBER 31, 1975, CALL REPORT. A DESCRIPTION OF THE REVISIONWILL BE AVAILABLE IN THE GREENBOOK SUPPLEMENT.

III - 9
While the increase in interest rates caused several firms to postpone
offerings previously slated for the month, other firms accelerated the
timing or enlarged the size of their issues rather than risk a further
advance in rates. Most of the postponed issues have been rescheduled
for June, and the domestic bond calendar this month currently stands at
$3.0 billion--the second largest monthly volume of 1976. In addition,
a scheduled $750 million World Bank issue has boosted the projected
volume of foreign offerings to about $1 billion.
The projected average monthly volume of public bond offerings
during the first half of 1976, at about $2.5 billion, is only 10 per cent
less than the average for all of last year. The quality composition of
offerings has not changed significantly--firms rated Aaa or Aa have
continued to account for somewhat more than half of the dollar volume.
However, borrowing by both utility and industrial firms has diminished
noticeably, and offerings by financial firms have risen sharply.
In the private placement market, staff estimates indicate that
the pace of financing thus far in 1976 is ahead of the record of 1975.
Assets of life insurance companies--the principal lenders in this
market--increased by a record amount of almost $8 billion (excluding
capital gains on equities) during the first 3 months of 1976. Because
commercial and multifamily mortgage lending activity has been light, an
unusually large share of these funds flowed into corporate debt obliga-
tions. This further improved the cost and availability of long-term
financing for the smaller and lower-rated firms that traditionally are
heavily dependent on the private market.

III-10
SECURITY OFFERINGS
(Monthly totals or monthly averages, in millions of dollars)
1975 1976Year QIV Q1e Aprile/ May Junef Julyf
Corporate securities--Total
Publicly offered bondsBy quuality1/
Aaa and AaLess than Aa2/
By type of borrowerUtilityIndustrialOther
Privately placed bonds
Stocks
By type of issuerManufacturingUtility and transp.Other
By type of issuePreferredCommon
3/Foreign securities--
State and local governmentsecuritiesLong-termShort-term
Gross offerings
4.476 -361 ,14 4,300 4,400 5,500 a,300
2,717 1,939 2,430 2,400 2,200 3,000 2,200
1,422 776
1,295 1,163
9251,432
360
1,470960
783 630780 1,200376 600
852 1,378
1,100 1,2001,300 1,000
700850850
900
530845825
900 1,000
907 1,044 1,198 1,000 1,300 1,500 1,200
123598186
288619
158664221
413631
323750125
260938
350450200
200 300800 1,000
350 1,040
2,544 2,252 2,7812,420 2,216 1,678
2,354 3,4532,453 2,316
2,900 2,2002,000 1,600
Net offerings
U.S. TreasurySponsored Federalagencies
7,564 8,048 7,897 -1,650
390 416 -395
3,970 2,300 8,000
-867 478
e/ Estimated.f/ Forecast.I/ Bonds categorized according to Moody's bond ratings.2/ Includes issues not rated by Moody's.3/ Includes only publicly offered issues of marketable securities.

III - 11
Firms also continue to tap the equity markets at a record
pace. New stock offerings--including both common and preferred--
increased to $1.3 billion in May. An unprecedented volume of
offerings by manufacturing concerns accounted for one-half of this
total. The equity calendar for June, which includes a $550 million
AT&T common stock issue, currently is estimated at $1.5 billion--a
level exceeded only once this year.
Other Securities Markets
State and local governmental units sold a record $3-1/2
billion of new long-term debt obligations during May, and they likely
will market just under $3 billion of such issues in June. The massive
volume of long-term financings during the current quarter appears to
reflect, to a significant degree, a continuation of financial
restructuring efforts by States and municipalities. During the first
quarter, these units made sizable net repayments of short-term debt,
and although the gross volume of short-term issues has risen during
the second quarter, the level is substantially less than seasonal.
Nearly half of the short-term State and local borrowing
this quarter is accounted for by the three-stage New York State note
financing. The final part of this operation was completed on June 15,
but not without some last minute worries. Several developments in
late May and early June have raised additional doubts about the
financial future of New York City. These included Moody's downgrading
of certain MAC bonds from A to B; the inability of City University of

III - 12
New York to meet its payroll; and expressions of concern by the
Emergency Financial Control Board and the Treasury about the adequacy
of the City's budgetary restraints for the next two fiscal years.
In the Treasury securities market, the Federal Government
has raised $3 billion, net, in two note auctions and has redeemed
$0.6 billion, net, in regular bill auctions since the May Committee
meeting. Because of unexpected strength in its cash balance, the
Treasury was able to meet its seasonal financing need prior to the
June 15 tax date through the issuance of only $2 billion of nine-day
cash management bills--roughly half the amount projected earlier by
the Department. Treasury borrowing will pick up seasonally in the
third quarter: the Board staff projects that $18 to $20 billion in
new money will be raised, as compared with $23.5 billion in the same
period last year.
Mortgage Market and Consumer Credit
All indications are that the demand for residential mortgage
credit remains firm, albeit with considerable geographic variation.
There have been reports in recent weeks of one-fourth percentage
point increases in mortgage loan rates in some locales, and indeed,
the average rate on new commitments did edge upward by five basis
points in early June. Yields in the secondary market have fluctuated
narrowly of late, after having risen 30 to 40 basis points from their
April lows.

III-13INTEREST RATES AND SUPPLY OF FUNDS FOR
CONVENTIONAL HOME MORTGAGESAT SELECTED S&Ls
End of period
1975-- HighLow
1976-- HighLow
1976
May 7142128
June 411
Average rate onnew commitmentsfor 80% loans
(Per cent)9.598.80
9.108.70
Basis pointchange fromprevious
week
Per cent ofS&Ls with funds
in short supply
667
8.758.758.788.78
8.788.83
1n.a.
SECONDARY HOME MORTGAGE MARKET ACTIVITY
1975-- High 100 51 10.92 643 366 9.95 9.10Low 10 9 8.96 25 18 8.78 7.99
1976-- HighLow
1976
May 3
9.31 6349.00 58
9.09 483
9.24 634
9.31 350June 17
14 77 70 9.301/ Average gross yields before deducting
147fee of 38
9.208.83
8.94
9.13
9.20
99 9.14basis points for
8.448.00
8.168.168.448.44
8.448.398.34
mortgage servicing.Data reflect the average accepted bid yield for home mortgages, assuming a prepaymentperiod of 12 years for 30-year loans, without special adjustment for FNMA commitmentfees and FNMA stock purchase and holding requirements on 4-month commitments. Mortgageamounts offered by bidders relate to total bids received.
2/ Average net yields to investors assuming prepayment in 12 years on pools of 30-yearFHA/VA mortgages carrying the coupon rate 50 basis points below the prevailing ceilingrate on such loans.

III - 14
During April, the most recent month for which data are
available, net acquisitions of mortgages by all savings and loan
associations were $3.7 billion (seasonally adjusted) and the volume
of loan commitments outstanding rose to a three-year high of $19.8
billion (also seasonally adjusted).1 / Despite strong deposit gains,
these institutions experienced a decline in their aggregate liquidity
ratio from 10.65 per cent at the end of February to 10.43 per cent
at the end of April. The sharp falloff during May in net repayments
of FHLB advances (to $121 million versus over $500 million per month,
on average, during the first four months of 1976), suggests that
S&L's may have found it necessary to dip further into their liquid
assets in order to accomodate takedowns of commitments.
Extensions and repayments of consumer instalment loans both
fell off considerably in April, leaving the growth rate of outstanding
credit a little above the average pace of the first quarter. Auto
credit, registering its largest increase in more than three years,
led the advance. Commercial banks accounted for nearly 40 per cent
of the gain in total credit, well above the average of the preceding
six months.
A new F.T.C. rule limiting the application of the holder-
in-due-course doctrine in consumer credit transactions went into
1/ It should be noted that, although these figures are very substantialin nominal terms, they remain well below previous peaks afterallowance for inflation.

III - 15
effect for sellers of goods on May 14. A proposed rule for creditors
was previously published by the Board for comment, but final issuance
must await further action by the F.T.C. The Board staff has conducted
an informal telephone survey of financial and retail firms in order
to assess the economic impact of these developments.
Partly because of the prevailing uncertainty about the
scope and intent of the seller rule, as well as about the nature of
the creditor rule that the Board ultimately will issue, the responses
of those contacted varied considerably. The general impression
conveyed, however, was that the aggregate effect on the cost and
availability of consumer credit and on product markets--though
adverse--probably will be limited. Some changes in financing
arrangements likely will occur. For example, there may be some shift
from indirect to direct financing of retail transactions, as indirect
lenders terminate financing for any dealers that appear unlikely to
stand behind the goods they sell--although cutbacks by some lenders
probably will be offset in part by the captive finance companies.
At the same time, it is reported that direct lenders have tightened
their credit standards and have become more cautious with respect to
the financing of certain types of expenditures, especially those on
mobile homes, used cars, and home improvements. In general, finance
rates will tend to drift upward in response to the increased costs
associated with the new rule, and the prices of some goods may rise
as discounters and marginal firms disappear and as new firms find
entry more difficult.

III-16
CONSUMER INSTALMENT CREDIT
1975 19761974 1975 QIV QI Mar. Apr.
Total
Change in outstandings$ Billion (SAAR)
Per cent
Bank share (%)BankExtensions
Billion (SAAR)Bank share (%)
Liquidations ($ billions, SAAR)
9.56.5
29.0
16b.l43.6
156.3
3.62.3
-1.8
166.944.0
163.1
10.16.4
33.7
180.044.3
169.9
15.910.0
31,6
193.442.9
177.5
18.211.337.9
195.843.5
177.7
17.210.
39.
189..42.
172..
Automobile Credit
Change in outstandings$ Billion (SAAR)
Per centExtensions, $ billion (SAAR)New-car finance rate (%, APR)
Finance companiesBanks (36-month loan)
New-car loans over 36 mos. (%)Finance companiesCommercial banks 1/
0.91.8
43.3
1.42.7
46.7
12.61 13.1210.97 11.36
8.48.8
23.7
14.0
5.310.251.3
13.1711.24
24.817.0
7.113.353.7
7.914.954.4
8.515.853.;
13.15 13.13 13.1311.17 11.13 11.,8
29.320.0
30.8 32.-
1/ Series was cegun in May 1974, with daca reported for the mid-month of eachquarter. 1974 figure is the average for May, August, and November.

June 16, 1976
U.S. International Transactions(In millions of dollars; seasonally adjusted)
1. Trade balance2. Merchandise exports3. Merchandise imports
4. Net service transactions5. Balance on goods and services 1/
6. Remittances and pensions7. Gov't grants and capital, net
8. Bank-reported private capital, net change9. Claims on foreigners (inc.-)
10. Short-term11. Long-term12. Liabilities to foreigners (inc.+)13. Long-term liabilities14. Short-term liabilities 2/15. to commercial banks abroad16. (of which liab. to branches) 3/17. to other private foreigners
18. to int'l regional organizations
19. Private transactions in securities, net20. U.S. purchases (-) of foreign securities21. of which: New bond issues
21. Foreign purch. (+) of U.S. corp. securities23. Stocks 4/24. Bonds (includes U.S. Govt. agencies)
25. U.S. direct investment abroad, (inc.-)26. Foreign direct investment in U.S., (inc.+)27. Nonbank-reported: liquid claims, (inc.-)
other claims. (inc.-)liabilities (inc.+)
30. Changes in liab. to foreign official agencies31. OPEC countries (inc.+) 3/32. of which: stocks33. Other countries (inc.+)
34. Changes in U.S. reserve assets (inc.-)35. Gold36. Special drawing rights37. Reserve position in the IMF38. Convertible currencies
Errors and omissions
Memo:Official settlements balance, S.A.
N.S.A.O/S bal. excluding OPEC, S.A.
N.S.A.
19 '5 1976YEAR 0-4 -1 Feb.* Mar.* Apr.*
9,045 2,165 -1,404 -227 -603 -450
107,184 27,689 27,002 8,777 9,285 9,279
98,139 25,524 28,406 9,004 9,888 9,729
7,363 1,97316.408 4.138
-1.763 -432
-4.546 -1.199
-9,855 -3,515 -2,592 -67 -2,059 3,049
(-13,099) (-4,799. -3,889 -2,573 95 -2, )-10,846 -3,902 -3,599 -2,474 359 -2,077-2,253 -897 -290 -99 -264 -237(3,244) (1,284) (1,297) (2,506)(-2,154) (5,363)
-355 91 166 -40 179 243,599 1,193 1,131 2,546 -2,333 5,339(-501) (-283) (805) (2,204)(-2,671) (4,715)
(231) (1,234) (-831) (531)(-2,278) (3,184)(1,823) (865) (231) (313) (173) (673)(2,277) (611) (95) (29) (165) (-49)
-3,898 -1,344 -1.528 -947 -591 -243(-6,328) (-2,361) (-2,508)(-1,201) (-974) (377)(-7,168) (-2,573) (-2,892)(-1,296)(-1,039) (-470)(2,430) (1,017) (980) (254) (383) (134)2,984 790 939 194 425 154-554 227 41 60 -42 -20
-5.760 -1,7651.934 1.008
-267 -113 271
-1.211 -529
379 -75
4.53915 2,9685/ 2,863 800 209 9045,677 1,780 1,500 219 1,058 372(1,469) (519 (531) (177) (157) (256)-1,138. 1,18&' 1,363 581 -849 532
-607' 89 -773 -39 -330 -521
-66 -21 -45 -- -- 14-466 -57 -237 -76 -55 -170-75 167 -491 37 -275 -365
4.648 770
4 4 - -- - 4.
-3,932
1,745
-3,057-2,437-1,277
-657
.2,090-1,006
-590494
121
1,179
*/ Not seasonally adjusted (except for merchandise trade data lines 1-3).1/ Differs from "net exports" in the GP account. The GNP basis excludes It.S. Government
interest payments for foreigners from service imports and special military exports to Israel.2/ Includes transactions in U.S. Treasury bonds and notes.3/ Not seasonally adjusted. p - preliminary.4/ Excludes OPEC transactions which are included in liabilities to foreign official agencies.5/ Excludes a $250 million increase in liabilities resulting from the revaluation of System
swap liabilities to Belgium and Switzerland.
Revised Data will be available in the Friday Supplement
IV - T - 1

INTERNATIONAL DEVELOPMENTS
In the past five weeks, market attention has focussed on the
continuing weakness of the pound sterling and the sharp fluctuations of
the Swiss franc. During this period the dollar has appreciated against all
major currencies except the Swiss franc and the Canadian dollar, perhaps
because of rising interest rates in the U.S. relative to those abroad. On
a trade-weighted basis the dollar has appreciated about 1 per cent.
The heavy selling pressure on the British pound, which began in
early March, continued during the period. From May 12 to June 4 the pound
declined a further 6-1/2 per cent to the $1.71 level, despite the fact that
the Bank of England
raised its Minimum Lending Rate from 10-1/2 to 11-1/2 per cent on
May 21. On June 7, the Bank of England announced that it had received a
$5.3 billion package of standby credits from the G-10 countries, Switzer-
land, and the Bank for International Settlements (including $1 billion
from their $3 billion swap line with the Federal Reserve and a $1 billion
swap arrangement with the U.S. Treasury). The pound recovered a sharp
3 per cent that day, but the following day the downward pressure resumed.
Early in the period the Swiss franc was very strong, rising
about 4 per cent through June 2. But then the Swiss National Bank took
a series of actions to reverse the trend. The BNS (a)

IV - 2
, (b) stated that it would intervene massively to extend
the Swiss franc's turnaround, (c) provided an exchange rate guarantee to
induce three Swiss banks to purchase $290 million equivalent of marks and
lend them to the German government, and (d) took further steps to discourage
the speculative purchase of Swiss francs. In an initial reaction to these
measures the Swiss franc fell back to its level of mid-May, but in recent
days it has begun to strengthen again.
Until about June 7 the Netherlands guilder was under downward
pressure within the European joint float. In response the Netherlands
central bank
tightened short term interest rates about 2-1/2 percentage points to the
6 per cent level, and, on June 1, increased the discount rate from 4 to
4-1/2 per cent. These actions caused a temporary abatement of the
selling pressure on the guilder, but in the last few days it has re-
emerged,
The Italian lira, after first falling about 25 per cent and
then recovering about 9 per cent earlier in the year, has been remarkably
stable during the last five weeks. The lira was unchanged on net,
The System purchased
$80 million equivalent of marks, $29 million equivalent of Belgian francs,

IV - 3
and $4 million equivalent of Netherland guilders - part of which were
used to make a $20 million equivalent repayment on the Belgian-franc
swap debt and the final $80 million equivalent repayment on the swap
debt to the Bundesbank.
Euro-dollar interest rates rose a full percentage point on
average during the last half of May, but have since declined about half
that amount.
On June 2 the IMF auctioned the first 780,000 ounces of the
25 million ounces of gold it plans to sell over the next four years.
All of the gold was sold at a common price of $126 per ounce. The free
market price of gold seemed little affected by the auction itself, but
over the last five weeks the price has declined about $3.00 per ounce
to its present level of about $125.00.
International capital markets. Borrowing in international
capital markets increased sharply in the first quarter of 1976 to over
$16 billion. Although Euro-currency bank loans declined, new issues of
Euro-bonds and foreign bonds reached record levels. All of the increase
in total borrowing over the fourth quarter of 1975 was taken up by
borrowers in developed countries and by international institutions;
borrowing by developing countries declined. In April and May international
borrowing decreased as the volume of bond issues contracted, at least
partly because of rising interest rates in U.S. financial markets.
Euro-bond issues of $4.7 billion in the first quarter (World
Bank data) were $2.2 billion (85 per cent) larger than the 1975 quarterly

IV - 4
Borrowing in Selected International Financial Markets(in millions of dollars)
1974Year
1/I. Publicized Euro-credits: total
Developed countriesFranceSouth AfricaUnited KingdomUnited StatesOthers
Oil-exporting countriesAlgeriaIndonesiaIranOthers
Other developing countriesBrazilMexicoPhilippinesOthers
Other countries and inter-national institutions
II. Euro-bonds: totalBy borrower:Developed countriesDeveloping countriesInt'l. inst. (mainly) and other
By currency: 2U.S. dollarGerman markOther
III. Foreign Bonds: totalBy borrower:Developed countriesDeveloping countriesInt'l. inst. (mainly) and other
By market country: 2/United States 3/SwitzerlandOther OECD countriesOPEC countries
1975Year 1st H
1976Q-3 Q-4 Q-1
28,532 20,575 8,538 4,835 7,203
17,2433,331
7245,7231,3546,111
789
368115306
8,9531,6051,478883
4,987
5,090506548603514
2,919
3,208500
1,608245855
9,2212,1202,158
2534,690
2,264377238253336
1,060
1,443100
1,0635
275
3,391723661110
1,897
1,36784
160318138667
770
220550
2,455738455
1,262
1,459451503240
1,192
99540054520
305
3,374659
1,042143
1,530
1,548 3,056 1,439 242 1,375
4,515 10,199 5,579 2,419 2,201
2,288113
2,114
3,079644788
8,071488
1,640
4,8072,8922,500
4,396349834
1,9792,3271,279
1,732139548
1,574399481
1,943
258
1,330240744
6,573 11,505 4,644 2,655 4,206
2,937817
2,813
2,373986642
2,572
6,895318
4,292
7,1683,372
779186
2,775194
1,675
3,3291,36981714
1,63046
979
1,266857352133
2,49078
1,638
2,5731,148
34838
6,310
1,6801642754586
777
752
106330316
2,171680367532592
1,708
4,736
3,036166
1,534
3,035951750
5,062
3,632
1,430
2,8921,437548185
1/ Credits of over one-year maturity. Data are based on completions of loanarrangements and not on drawdowns. 2/ 1975 quarterly and half-yearly data donot add to totals because of lack of revised figures for currency and marketbreakdowns. 3/ Balance of payments basis. Source: IBRD; Federal Reservefor bond issues in United States.

IV 5
average and were more than twice the level of the last year's fourth
quarter. Lower interest rates in the U.S. and Euro-dollar money markets
contributed to the higher volume of new issues as Euro-bond yields to
continuedto drop throughout the first quarter from their highs of last
September. In the secondary market, yields on straight dollar issues of
U.S. companies and European companies in the first quarter averaged 50 and
65 basis points, respectively, below the fourth quarter. On the demand
side for funds, large items in the first quarter were two public issues
in March by the European Community totaling $495 million equivalent, part
of the $1.3 billion EC package for relending to Italy ($1 billion) and
Ireland ($300 million), and about $550 million of World Bank private
placements. International institutions in general issued four times the
amount of bonds as the 1975 quarterly average; the comparable increase in
borrowings by issuers in developed countries was 50 per cent. Developing
countries continued to be a very minor element in the demand for funds in
the Euro-bond market.
Partial data indicate that new Euro-bond issues fell in both
April and May from the preceding month, and were well below the first
quarter monthly average. Yields continued to fall in April, but moved up
in May as U.S. bond yields rose. April issues included a $500 million EC
private placement for three years and seven months, much shorter than the
normal maturity.
New issues of foreign bonds came to $5.1 billion in the first
quarter, about 75 per cent more than the 1975 quarterly average. First

IV - 6
quarter volume was much higher in all markets, including the United States
($2.9 billion) and Switzerland ($1.4 billion). Long-term interest rates
in both countries averaged well below fourth-quarter levels. Flotations
in the United States exceeded the already high fourth-quarter amount, the
rise reflecting a further sharp increase in Canadian issues to $2.1 billion.
In April and May, on the other hand, there was a much smaller volume of
foreign bond issues, averaging perhaps $700 million a month, principally
because issues in the United States decreased sharply.
In contrast to international bond market developments, the $6.3
billion of publicized medium-term Euro-currency bank credits in the first
quarter represented a decrease of 13 per cent from the advanced level of
the preceding quarter, although it was still well above the quarterly
average for last year. The drop reflected principally a decline of about
one-third in loans arranged by non-oil developing countries; in particular,
credits to Mexico were only one-third their amount in the fourth quarter
(when they were exceptionally large) and were at about the same rate as
in last year's first half. Conversely, loans to the Philippines increased
sharply, and those to Brazil continued to be large. The oil-exporting
countries raised somewhat less than in the fourth quarter. However, Iran
began to borrow on a large scale, and is continuing to do so; in addition
to the $330 million of credits arranged in the first quarter, Iran has
since completed another $350 million and is negotiating for several
hundred million dollars of additional loans. Algeria has also recently
raised a new $430 million loan.

IV-7
Credits to borrowers in developed countries increased in the
first quarter, particularly to the United Kingdom where all the credits
were for North Sea oil exploration. French borrowings were again on a
reduced scale, but Electricité de France is now negotiating a standby for
upwards of $400 million to back issues of commercial paper in the United
States. Credits completed by international institutions in the first
quarter showed another substantial rise, reflecting loans of $600 million
to the International Investment Bank in Moscow for the Siberian gas
pipeline and $300 million to the EC as part of the $1.3 billion Italy-
Ireland package.
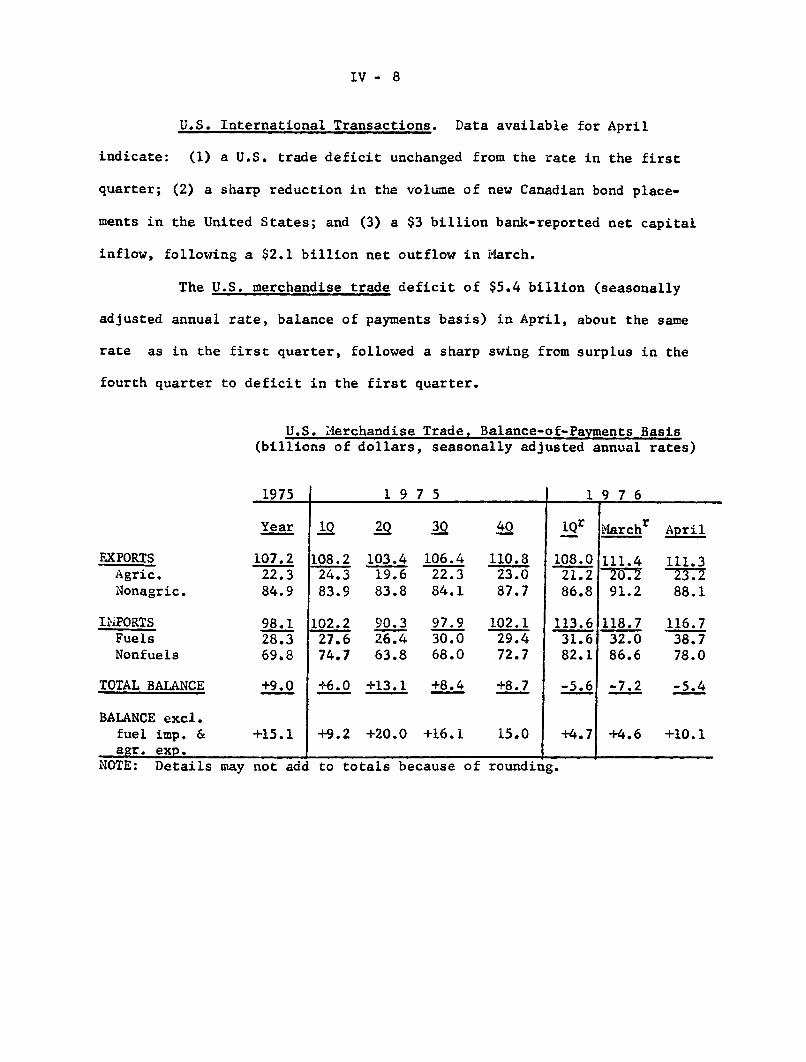
IV - 8
U.S. International Transactions. Data available for April
indicate: (1) a U.S. trade deficit unchanged from the rate in the first
quarter; (2) a sharp reduction in the volume of new Canadian bond place-
ments in the United States; and (3) a $3 billion bank-reported net capital
inflow, following a $2.1 billion net outflow in March.
The U.S. merchandise trade deficit of $5.4 billion (seasonally
adjusted annual rate, balance of payments basis) in April, about the same
rate as in the first quarter, followed a sharp swing from surplus in the
fourth quarter to deficit in the first quarter.
U.S. Merchandise Trade, Balance-of-Payments Basis(billions of dollars, seasonally adjusted annual rates)
1975
EXPORTSAgric.Nonagric.
IMPORTSFuelsNonfuels
TOTAL BALANCE
BALANCE excl.fuel imp. &agr. exp.
Year
107.222.384.9
98.128.369.8
+9.0
+15.1
1 9 7 5
1
108.224.383.9
102.227.674.7
+6.0
2Q
103.419.683.8
90.326.4
63.8
+13.1
3Q
106.422.384.1
97.930.068.0
+8.4
+9.2 +20.0 +16.1
4Q
110.823.087.7
102.129.472.7
+8.7
15.0
I 1 9 7 6
1Qr
108.021.286.8
113.631.682.1
-5.6
+4.7
NOTE: Details may not add to totals because of rounding.
Mar chr
111.420.291.2
118.732.086.6
-7.2
+4.6
April
111.323.288.1
116.738.778.0
-5.4
+10.1
--

IV - 9
Exports in April were $111.3 billion at an annual rate, a
level about 3 per cent above the rate of the first quarter but only
slightly above that of the fourth quarter of 1975.
Agricultural export volumes were unexpectedly strong in April,
owing to increased shipments of feed corn to the European Community and
the U.S.S.R. Recent increases in the spot prices of corn, wheat, and
soybeans--partially reflecting increased demand from a more buoyant
world economy--suggest that in the coming months prices of U.S.
agricultural exports will increase.
Non-agricultural exports were at an annual rate of $88.1
billion in April. These exports, which had fallen sharply in January-
February, have picked up in March-April to a rate slightly above that
of the fourth quarter of 1975. Both the decline and pickup were
diffused among the major commodity groups and the major trading areas.
Machinery exports in March-April at $30.6 billion (S.A.A.R.) were
only slightly above the fourth quarter rate, even though they were
4.2 per cent above the January-February level. However, new orders
for machinery exports have improved in March-April after little
change in the second half of 1975. The increase in new orders for
machinery exports reflects the expected improvement in investment
demand abroad.
Imports in April totaled $116.7 billion (S.A.A.R.), about
3 per cent above the first-quarter rate. Fuel imports in April jumped
to $38.7 billion at an annual rate, from a first-quarter rate of $31.6
IV - 10
billion. A small part of this increase was a rise in the price of
imported petroleum and petroleum products from an average of $12.00
per barrel in the first quarter to $12.19 per barrel in April; but
most of the increase came from an unusually sharp rise in the oil import
volume to 8.3 million barrels per day (mbd) in April from an average
of 6.7 mbd in the first quarter. It is not expected that fuel import
volumes will remain at April rates in the remainder of the quarter.
Non-fuel imports in April declined from the unexpectedly
high March level to about the January-February level. Half of the
increase in non-fuel imports during 1976 has been accounted for by a
steady rise in imports of industrial supplies associated with the
rebuilding of materials inventories by U.S. firms. Imports of auto-
mobiles from Canada and Japan have also contributed to the increase
in non-fuel imports. Car imports from Japan during the first four
months of 1976 have been at an annual rate of $4.9 billion, compared
with a $3.3 billion rate for the fourth quarter of 1975. This level
of imports has resulted in the rebuilding of inventories depleted in
the latter part of 1975. However, foreign car sales have increased
less than anticipated, suggesting that part of the inventory accumula-
tion was unintended.
Bank-reported private capital transactions recorded a $3
billion inflow during April, following a $2.1 billion outflow for
March. The apparent reversal in the direction of net capital movements
is a product of the timing of data collection rather than any shift

IV - 11
in the underlying incentive for banks to continue to export funds.
It reflects the fact that member banks reduce the cost of reserve
requirements by borrowing abroad on Friday for repayment Monday.
The balance-of-payments data are collected at the end of each month
for the outstanding foreign claims and liabilities of banks, and
hence weekend Eurodollar borrowings by member banks--an increase
in short-term liabilities to foreign banks--are only included in the
data for those months whose last business day falls on Friday; this
was the case for April, but not for March.
For MonthEnd
1975December
1976
JanuaryFebruaryMarchApril
Bank-Reported Private Capital Transactions(billions of dollars)
Reporting Day Net-Bank-Reported Change in Bank-Private Capital Reported Short-termTransactions Liabilities to
(-= outflow) Foreign Banks*(-= outflow)
Wednesday
FridayFridayWednesdayFriday
-3.0
-0.2-0.7-2.13.0
-2.6
1.42.2
-2.74.7
overseas branches of U.S. banks.*/ Including overseas branches of U.S. banks.
IV - 12
Net private transactions in securities in April showed an
outflow of $243 million. The volume of new foreign bond issues in the
U.S. market was substantially reduced in April ($470 million) compared
with the first-quarter monthly average of slightly under $1 billion.
A fall in new Canadian issues fully accounted for the decline. Pre-
liminary data show $0.5 billion of new foreign bond issues in May.
Activity in new Canadian issues for the rest of the year may be
restrained by the Bank of Canada's expression of concern that high
levels of external borrowing may, by exerting upward pressure on
the exchange rate, "prejudice a healthy expansion of the Canadian
economy." Foreign net purchases of U.S. stocks--excluding OPEC
purchases--fell to $154 million in April from the March level of
$425 million, as foreign investors reacted to the end of the rally
in U.S. stock prices.
U.S. liabilities to non-OPEC foreign official institutions
increased by $532 million in April.
. OPEC funds
in the United States, including $256 million in net purchases of
U.S. stocks, increased by about $400 million in April. The increase
in OPEC investments in the U.S. in the first quarter has now been
revised upward by $1.0 billion, reflecting a previously reported
transfer to Saudi Arabia by a U.S. company.

IV - 13
Economic Activity in Major Foreign Countries. Economic activity
in most foreign countries has continued to rebound strongly from its
recession low. By March/April 1976, the average weighted level of industrial
production in the six major foreign countries was more than 10 per cent
above its recession trough, and less than 5 per cent below its previous
peak. Production has been increasing in most major European countries
since the third quarter of 1975. In Japan a sharp acceleration in activity
occurred in the first quarter of 1976, after slower growth in the preceding
9 months. In Canada, where the recession was milder than elsewhere,
moderate growth in output is continuing. (See Table I). It is generally
agreed that the expansion will continue through the first half of 1977, --
though below current rates -- except possibly in Italy, where sustained
expansion appears unliely.
Forecasts for the rate of growth of real GNP in the OECD
countries in the coming year have been revised upward considerably from
the moderate rates forecast last December. Recent OECD forecasts show
that real GNP in the six major foreign industrial countries will average
about 4.7 per cent higher in 1976 than in 1975, up from a 3 per cent
growth forecast made in December. Latest official country forecasts as
well as FRB staff projections are in close agreement with those of the
OECD -- within about one-half percentage point -- except for Japan,
where our staff projection is for a rise of over 7 per cent in 1976
compared with 5.5 per cent by the OECD. Several factors contribute to
this more optimistic outlook abroad. Inventory liquidation is ending

Table IIndustrial Production in Major Foreign Countries
Percentage Change Over Previous Period (SAAR)1974 1975 _____ 1976
Q1 Q2 Q3 Q4 Q1 Q2 Q3 Q4 Q1
4.9 11.2 -16.1 -26.3 -34.1 13.0 8.2 3.3 25.3
0 -2.4 -8.2 -11.2 -10.4 -7.8 -1.2 21.1 8.7
9.1 0 3.3 -24.3 -13.0 -12.1 -4.9 16.5 24.0
-20.2 13.0 1.2 -12.6 -0.4 -19.7 -1.2 1.2 5.3
5.7 3.2 -10.0 -35.1 -3.7 -13.9 -9.8 24.8 15.2
6.6 -1.2 -2.4 -7.0 -11.2 -2.0 -1.2 4.5 10.8
Levels (1970=100)
Peal Trough Latest
131.9 105.9 125.2
(73Q4) (75Q1) (Apr.76)
113.7 102.7 110.0(74Q1) (75Q3) (Apr.76)
125.0 109.0 122.0(74Q3) (75Q3) (Apr.76)
110.7 995 101.0(73Q3) (75Q3) (Apr.76)
122.9 103.6 115.3(74Q2) (75Q3) (Apr.76)
127.3 119.6 124.9(74Q1) (75Q3) (Mar.76)
Sources: National Sources.
Japan
Germany
France
U. K.
Italy
Canada

IV - 14
earlier than expected; improved consumer confidence has resulted in a
lowering of saving rates in many countries from the high levels
prevailing in 1975; and intra-OECD trade has grown more rapidly than
expected, in line with the increased demand for industrial materials
and consumer goods. Japan has benefitted especially from a large increase
in exports to the United States.
Temporary factors, such as the impact of reflationary programs
undertaken in some countries last fall and the timing of inventory
adjustments, largely explain the higher projected first half 1976
growth rates relative to those of the second half. The projected lag
in the recovery of investment expenditure is explained by the very high
estimated margins of unused capacity compared with previous cycles.
Several major uncertainties cloud these projections. Substantial
speculative stock building in response to accelerating materials prices
would entail a more rapid surge in production during the coming months,
while increasing the risk of a subsequent reversal. Personal saving
rates, which are declining now, may rise again if inflation starts to
accelerate. Investment demand, on the other hand, may be stronger than
projected to the extent that estimates of capacity utilization overstate
the degree of current slack by not making full allowance for the impacts
of low investment and relative price shifts in recent years on reducing
the rate of capacity growth. On balance, it appears that the larger
chance of error in the growth projections is that demand will rise more
rapidly than expected.

IV - 15
One characteristic feature of the current expansion is the
unresponsiveness of unemployment rates to the improvement in output.
The OECD Secretariat forecasts that only Germany, of the major foreign
industrial countries, will succeed in achieving an average unemployment
rate for 1976 below its actual level in March 1976, and even for Germany
the forecast improvement is moderate. Two factors contribute to this
pessimism. First, labor-force participation rates in a number of
countries have been depressed below trend, so that a reversal of this
pattern, as activity expands, would lead to substantial increases in the
labor force. Second, in some countries there appears to be substantial
under-utilization of employed workers so that increases in production
will generate less than proportional increases in employment.
Table II presents a rough attempt to measure the extent to
which employed workers are underutilized in the major foreign countries
by computing a "productivity gap" -- the percentage shortfall of actual
production levels from the production levels that would be attainable if
the currently employed labor force were producing at its trend level of
output per worker. Two measures of attainable production are computed.
The first (column 1) is obtained by extrapolating the 1964-1973 trend
growth of labor productivity through to January 1976. The second (column 2)
is calculated on the arbitrary, and probably extreme, assumption that
trend productivity growth since 1973 has been 25 per cent below its
1964-1973 rate for all countries except Japan, and 50 per cent lower

Table IIProductivity Gaps in Major Foreign Countries
AttainableProduction(1970=100)Jan. 1976 a/-Ti--
AdjustedAttainableProduction(1970=100)Jan. 1976 b/
(-2-F-T-
ActualIndustrialProduction Index(1970=100)Jan. 1976
---3__---'-
Gap of Actual Production(per cent)
From AttainableProduction
( -=T T-.' i T
From AdjustedAttainableProduction
T .-T-lFrance c/
Germany
Italy
United Kingdom
Japan
Canada
129.4
110.7
133.0
110.0
143.3
124.2
122.0
104.6
124.7
106.2
126.4
120.7
117.0
105.3
102.0
115.7
122.0
-9.6
-4.9
-4.1
0.7
-13.1
-4.0
-8.5
-18.5
-7.3
-193.
-1.8
a/ Level of industrial production that would be attained if the currently employed labor forcewere producing at its historic trend ratio of output per worker.
b/ Attainable level of industrial production if trend productivity growth is assumed to have fallenbelow its 1964-1973 average by 25 per cent for all countries except Japan, and by 50 per cent forJapan.
c/ December employment and production data.
IV - 16
for Japan. Column 3 gives actual industrial production levels for
January 1976. The final columns compute the gap between actual and
attainable production. It can be seen that the productivity shortfalls
are very substantial for Italy and Japan, and moderate for France and
the United Kingdom. In Germany and, especially, Canada, productivity
does not appear to have fallen sharply below trend -- particularly if
the lower productivity growth trend is assumed -- suggesting that in these
countries under-employment of labor is not pervasive. Based on this
analysis, one would expect employment to increase more sharply in Canada
and Germany than in the other countries as activity continues to expand.
Despite continuing labor slack, and substantial though slowly
falling margins of underutilized capacity, rates of inflation, after some
slowing in 1975, remain high in many foreign countries. Although rates
of price rise have moderated in Germany and Canada, inflation rates have
increased in several countries since the end of 1975. Some of these
increases reflect the recent sharp run-up in raw materials prices, while
the depreciation of the British pound and Italian lira has strengthened
inflationary pressures in these two countries.
In Japan GNP increased by 3.5 per cent in the first quarter of
1976 over the fourth quarter of 1975. This strong growth -- probably
exaggerated by overly strong seasonal adjustment -- reflects especially
sharp increases in exports (9 per cent), residential construction (13 per
cent), and private consumption (4 per cent). These developments contrast
with the slower growth of last year, which was in large part sustained

IV - 17
by increases in government expenditures. Further gains in industrial
production occurred in April, though exports did not continue the rapid
growth of previous months. Private non-residential investment remains
weak, with little upturn expected until the end of this year or the
beginning of 1977.
In Germany the current expansion is broadly based. Private
consumption demand has been growing steadily, and the volume of exports
is recovering from the sharp fall of 1975. Imports, which remained
relatively strong in 1975, have also been growing, both to satisfy final
demand and for the rebuilding of inventories. New orders for machinery
and equipment, which rose sharply in mid-1975 in response to special
investment incentives, fell off as expected thereafter, but have continued
to grow steadily since the fourth quarter of 1975. This suggests that
investment demand may be stronger this year than earlier anticipated.
In France, the sharp recovery in industrial production (over
8 per cent in the past two quarters) is largely attributable to the
ending of the de-stocking process. The turn in the inventory cycle has
led to a rise in imports relative to exports, though exports have also
risen somewhat and recently export orders have begun to show renewed
strength. Consumer demand, which continued to grow throughout 1975, has
stabilized recently. The latest survey of investment intentions suggests
that there will be a further decline in investment in real terms in 1976,
though forecasters expect greater buoyancy to emerge as the recovery
proceeds, aided by a sharp increase in public investment.

IV - 18
The United Kingdom recently has shown some signs of recovery.
Industrial production has been rising slowly over the past two quarters,
and GDP, after a substantial recovery in the fourth quarter of 1975
(over 2 per cent on a quarterly basis), is estimated to have risen another
1 per cent in the first quarter of this year. Exports in particular
have been growing strongly and should continue to be a source of
strength in light of the improved competitive position of U.K. exports
due to the depreciation of sterling and rising incomes in other countries.
Consumer demand has also been growing moderately, although the decline
of real personal disposable income probably will inhibit further growth.
In Italy, the very rapid increase in industrial production over
the past two quarters (9.5 per cent) is not considered sustainable. The
deteriorating external situation and the sharp acceleration in the
inflation rate have forced the Italian government to adopt restrictive
policy measures which place prospects for any further recovery in serious
doubt.
In Canada, moderate expansion appears to be underway. Industrial
production which, on a quarterly basis, had been falling since the first
quarter of 1974, turned up in the fourth quarter of 1975 and grew strongly
in the first quarter of this year. Residential construction has been
very strong; inventory liquidation appears to be ending; personal con-
sumption continues to grow in line with real disposable income; and
manufacturing exports, particularly to the United States, are expected
to add strength to the upturn.
IV - 19
Prospects for the smaller European countries also have been
improving recently. Having lagged behind the major countries in
entering the recession, they appear to be benefitting from increases in
import demand by the major countries and are now entering the recovery
phase of the cycle, albeit at a more moderate rate than most of the
larger countries.
The U.K. Incomes Policy. The Trades Union Congress, at a
special conference held June 16, voted overwhelmingly (9.3 million to
.5 million) to support the next phase of the U.K. government's pay
policy. The policy involves limiting wage increases to an average of
4-1/2 per cent for the year beginning August 1 in return for some
reductionsin personal income taxation. (See the May Greenbook for
details on the U.K. incomes policy.)