Embed Size (px)
Citation preview
GREEN SUPPLY CHAIN MANAGEMENT ENABLERS AND BARRIERS IN
TEXTILE SUPPLY CHAINS WHAT FACTORS ENABLE OR AGGRAVATE THE IMPLEMENTATION OF A
GSCM STRATEGY FOR TEXTILE AND FASHION COMPANIES?
Year: 2016 Thesis id number: 2016.15.06
Thesis for Master, 30 ECTS
Textile Management
Kerstin Stremlau Joanne Tao
i
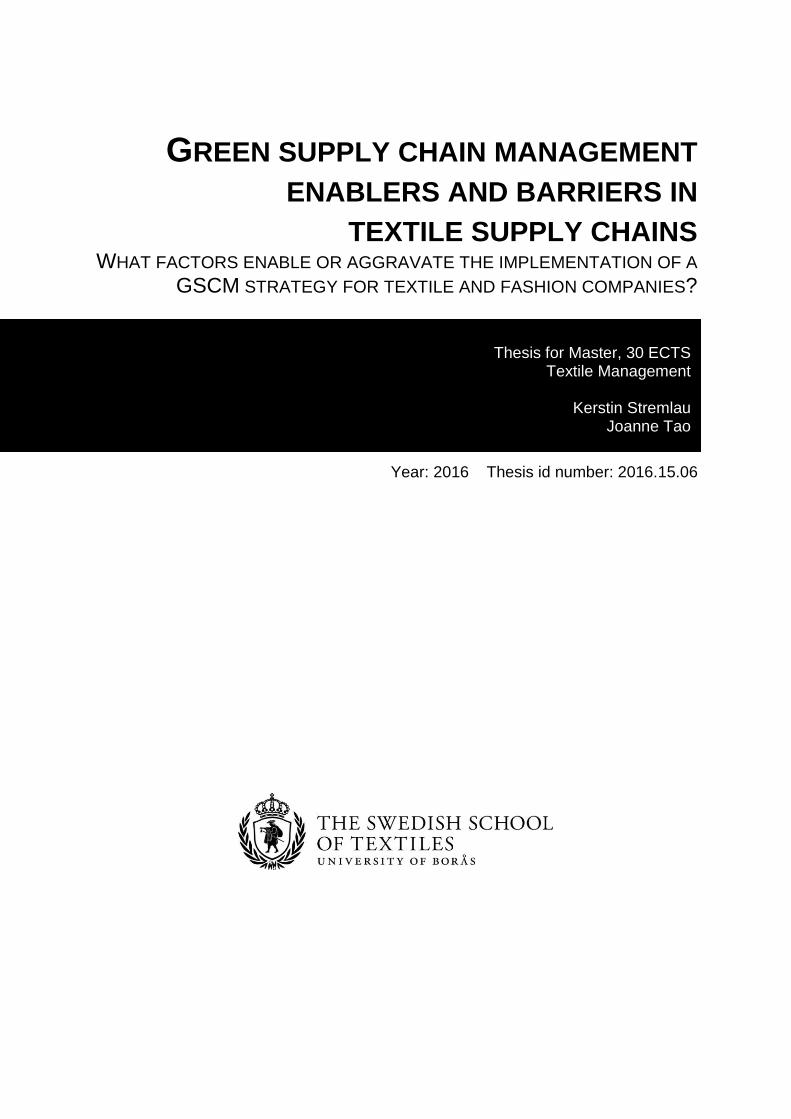
Title: Green Supply Chain Management Enablers and Barriers in Textile Supply Chains
Publication year: 2016
Author: Stremlau, Kerstin and Tao, Joanne
Supervisor: Mattila, Heikki
Abstract Purpose of this paper: The purpose of this paper is to provide an overview of the factors that
enable or aggravate the implementation of a GSCM strategy for textile and fashion
companies. Moreover, it shall be investigated how textile and fashion companies perceive
their incentives of implementing GSCM and what their organizational responses regarding the
perceived barriers and enablers look like.
Design/methodology/approach: The report combines a literature study on previous research
in the field of supply chain management, Green Supply Chain Management and the drivers
and barriers of implementing a GSCM strategy, with an empirical study consisting of an
online survey, a semi-structured interview and two case studies that are based on literature
review. In order to analyze the survey results, a method to calculate a company’s GSCM
incentive score has been developed.
Findings: The factors that have been identified as the strongest or most important ones by
many companies of the survey, as well as the interviewee and the case studies are supplier
collaboration, the lack of supplier commitment, customer demand for more sustainability,
customer desire for lower prices and top management commitment. Some companies also
perceived the alignment of their company’s strategy as strong GSCM enabler. However, the
calculation shows that the overall incentive score of most participants is in the neutral level;
meaning that they in total perceive neither significant incentives nor barriers to implement
GSCM. With mostly internal enablers and external barriers, more than half of the survey
participants can be categorized as Agenda Setters.
Research limitations: Due to the low response rate, the sample size of this study is very
small. Moreover, the results strongly depend on the personal opinion and experiences of the
interviewee and the individual situations of the companies. This means that the results of this
study give an indication, but are not generalizable. Therefore, another study with a different
sampling method and a larger sample size is needed.
Practical implications: The outcomes of this study show that GSCM concerns every aspect
of a supply chain. A company that wants to engage in GSCM needs to have good
relationships with and control over its suppliers in order to ensure that they fulfill the
sustainability requirements, and deal with pressure from NGOs. Additionally, the company
needs to balance customer demands for low prices and sustainability, expect some (one-time)
investments and sacrifice short-term profit in order to ensure sustainable production.
Originality/value: This report identifies the most important GSCM barriers and enablers for
textile companies. By evaluating how companies within the textile and fashion sector perceive
their incentives of implementing GSCM and investigating their organizational behavior
towards barriers and enablers of GSCM, this study indicates what the current situation in the
textile industry looks like; shows where improvements are necessary and gives insight for

ii
companies that aim to engage in green practices. The development of the so called GSCM
incentive score; a method to calculate a company’s perceived incentives to implement a
GSCM strategy, can be useful for future studies within this field.
Acknowledgments The authors would also like to thank Heikki Mattila for supervision and guidance, Jonas
Larsson for his support, and the opponent Giuliana Heger for her helpful feedback.
Keywords Sustainability, Supply Chain Management, Green Supply Chain Management (GSCM),
textile industry, GSCM enabler, GSCM barrier
iii
List of abbreviations
CR Corporate Responsibility
CSR Corporate Social Responsibility
EB External barriers
EE External enablers
GSC Green supply chain
GSCM Green Supply Chain Management
IB Internal barriers
IE Internal enablers
LR Literature review
NGO Nongovernmental organization
RQ Research question
SC Supply chain
SCM Supply chain management
SSCM Sustainable Supply Chain Management
iv
List of figures
Figure 1 Trend of earth overshoot day .................................................................................. - 1 -
Figure 2 A tier-structured supply chain ................................................................................. - 5 - Figure 3 Influencing factors on GSCM practices .................................................................. - 8 - Figure 4 Barriers and enablers of implementing GSCM ..................................................... - 10 - Figure 5 Data collection process ......................................................................................... - 17 - Figure 6 GSCM incentive score (level of perceived incentives of applying GSCM) ......... - 21 -
Figure 7 Typology of organizational responses to SSCM .................................................. - 22 - Figure 8 GSCM incentive score .......................................................................................... - 25 - Figure 9 Adoption of green practices .................................................................................. - 26 - Figure 10 Country of headquarter ....................................................................................... - 27 - Figure 11 Organization type ................................................................................................ - 27 -
Figure 12 Organizational response ...................................................................................... - 28 - Figure 13 Adoption of GSCM ............................................................................................. - 29 -
Figure 14 Country of headquarter ....................................................................................... - 29 -
Figure 15 Organization type ................................................................................................ - 30 - Figure 16 Number of stores and suppliers of H&M ............................................................ - 34 - Figure 17 Development of programs .................................................................................. - 35 - Figure 18 Nike’s system-change initiatives (Nike, Inc. 2013) ............................................ - 38 -
Figure 19 Nike’s performance score in a Chinese factory .................................................. - 40 -
List of tables
Table 1 Internal enablers and barriers ............................................................................ - 13 - Table 2 External enablers and barriers ................................................................................ - 15 -
Table 3 Trade Fairs ............................................................................................................ - 18 -
Table 4 Classification in ITMA, 2015 (ITMA, 2015) ........................................................ - 19 - Table 5 Survey answers and values for calculation ............................................................ - 20 - Table 6 Pairs of similar factors ........................................................................................... - 23 -
Table 7 Developed and developing countries ..................................................................... - 26 - Table 8 Breakdown of samples ........................................................................................... - 28 -
Table 9 Identified strong factors ......................................................................................... - 31 - Table 10 Number of collected contradicting samples ......................................................... - 31 -
Table 11 Overview of H&M’s sustainability efforts .......................................................... - 37 - Table 12 Comparison of internal enablers in LR and online survey ................................... - 44 - Table 13 Comparison of internal barriers in LR and online survey .................................... - 45 - Table 14 Comparison of external enablers in LR and online survey .................................. - 46 - Table 15 Comparison of external barriers in LR and online survey ................................... - 46 -
Table 16 Answering of RQs ................................................................................................ - 48 -
v
Table of contents
1 Introduction ............................................................................................................ - 1 - 1.1 Background ........................................................................................................... - 1 -
1.2 Problem background ............................................................................................. - 2 -
1.3 Research gap ......................................................................................................... - 2 -
1.4 Purpose and research questions ............................................................................. - 3 -
1.5 Delimitations ......................................................................................................... - 3 -
2 Literature Review ................................................................................................... - 4 - 2.1 Supply Chain Management ................................................................................... - 4 -
2.2 Supply Chain Management in textile and fashion industry .................................. - 5 -
2.3 Green Supply Chain Management ........................................................................ - 6 -
2.4 Green Supply Chain Management in textile and fashion industry ........................ - 8 -
2.5 Enablers and Barriers of adopting GSCM ............................................................. - 9 -
2.5.1 Internal enablers .............................................................................................. - 11 - 2.5.2 Internal barriers ............................................................................................... - 12 - 2.5.3 External enablers ............................................................................................. - 13 - 2.5.4 External barriers .............................................................................................. - 14 -
3 Methodology ........................................................................................................ - 16 - 3.1 Research strategy and design .............................................................................. - 16 -
3.1.1 Design of survey questionnaire ....................................................................... - 16 - 3.2 Data collection ..................................................................................................... - 17 -
3.2.1 Online survey .................................................................................................. - 17 - 3.2.2 Interview .......................................................................................................... - 19 - 3.2.3 Case study ....................................................................................................... - 19 -
3.3 Data analysis ....................................................................................................... - 19 -
3.3.1 Online survey .................................................................................................. - 19 - 3.3.2 Interview .......................................................................................................... - 23 - 3.3.3 Case study ....................................................................................................... - 24 -
3.4 Quality criteria and assessment of research ........................................................ - 24 -
4 Results .................................................................................................................. - 25 - 4.1 Online survey ...................................................................................................... - 25 -
4.1.1 Evaluation of GSCM incentives ...................................................................... - 25 - 4.1.2 Typology of companies ................................................................................... - 27 - 4.1.3 Identification of Strong Factors ....................................................................... - 30 - 4.1.4 Identification of Contradicting Factors ........................................................... - 31 -
4.2 Interview .............................................................................................................. - 31 -
4.3 Case studies ......................................................................................................... - 33 -
4.3.1 H&M ............................................................................................................... - 33 - 4.3.2 Nike ................................................................................................................. - 37 -
5 Analysis ................................................................................................................ - 44 - 5.1 Internal enablers .................................................................................................. - 44 -
5.2 Internal barriers ................................................................................................... - 45 -
5.3 External enablers ................................................................................................. - 45 -
5.4 External barriers .................................................................................................. - 46 -
6 Discussion ............................................................................................................ - 47 - 7 Conclusion ............................................................................................................ - 48 -

vi
7.1 Contribution ........................................................................................................ - 49 -
7.2 Future research suggestions ................................................................................ - 49 -
References .................................................................................................................... - 51 - Appendix I - Interview questions ......................................................................................... I Appendix II - Overview of survey answers ....................................................................... II
1
1 Introduction
This study identifies enablers and barriers of Green Supply Chain Management (GSCM) and
investigates how textile and fashion companies perceive their incentives of engaging in
GSCM and can be of interest for other researchers investigating the implementation of GSCM
in the textile (related) industry, as well as for (textile) companies that consider developing a
green supply chain.
1.1 Background
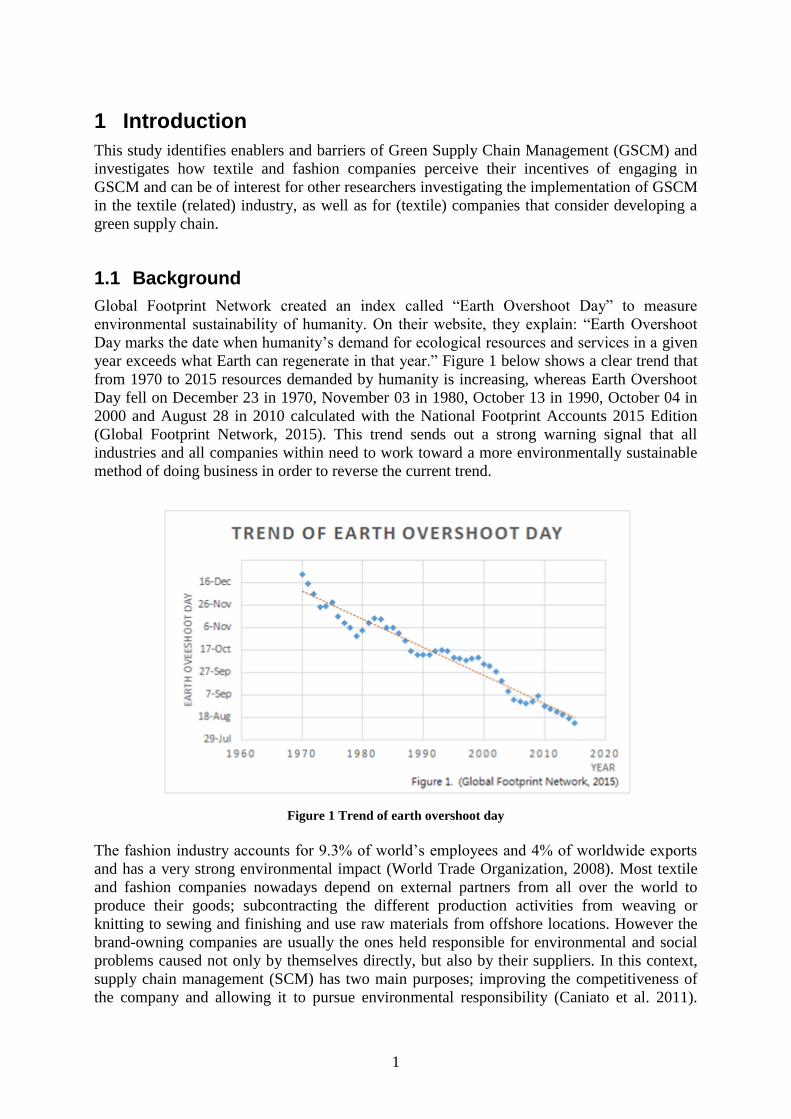
Global Footprint Network created an index called “Earth Overshoot Day” to measure
environmental sustainability of humanity. On their website, they explain: “Earth Overshoot
Day marks the date when humanity’s demand for ecological resources and services in a given
year exceeds what Earth can regenerate in that year.” Figure 1 below shows a clear trend that
from 1970 to 2015 resources demanded by humanity is increasing, whereas Earth Overshoot
Day fell on December 23 in 1970, November 03 in 1980, October 13 in 1990, October 04 in
2000 and August 28 in 2010 calculated with the National Footprint Accounts 2015 Edition
(Global Footprint Network, 2015). This trend sends out a strong warning signal that all
industries and all companies within need to work toward a more environmentally sustainable
method of doing business in order to reverse the current trend.
Figure 1 Trend of earth overshoot day
The fashion industry accounts for 9.3% of world’s employees and 4% of worldwide exports
and has a very strong environmental impact (World Trade Organization, 2008). Most textile
and fashion companies nowadays depend on external partners from all over the world to
produce their goods; subcontracting the different production activities from weaving or
knitting to sewing and finishing and use raw materials from offshore locations. However the
brand-owning companies are usually the ones held responsible for environmental and social
problems caused not only by themselves directly, but also by their suppliers. In this context,
supply chain management (SCM) has two main purposes; improving the competitiveness of
the company and allowing it to pursue environmental responsibility (Caniato et al. 2011).
2
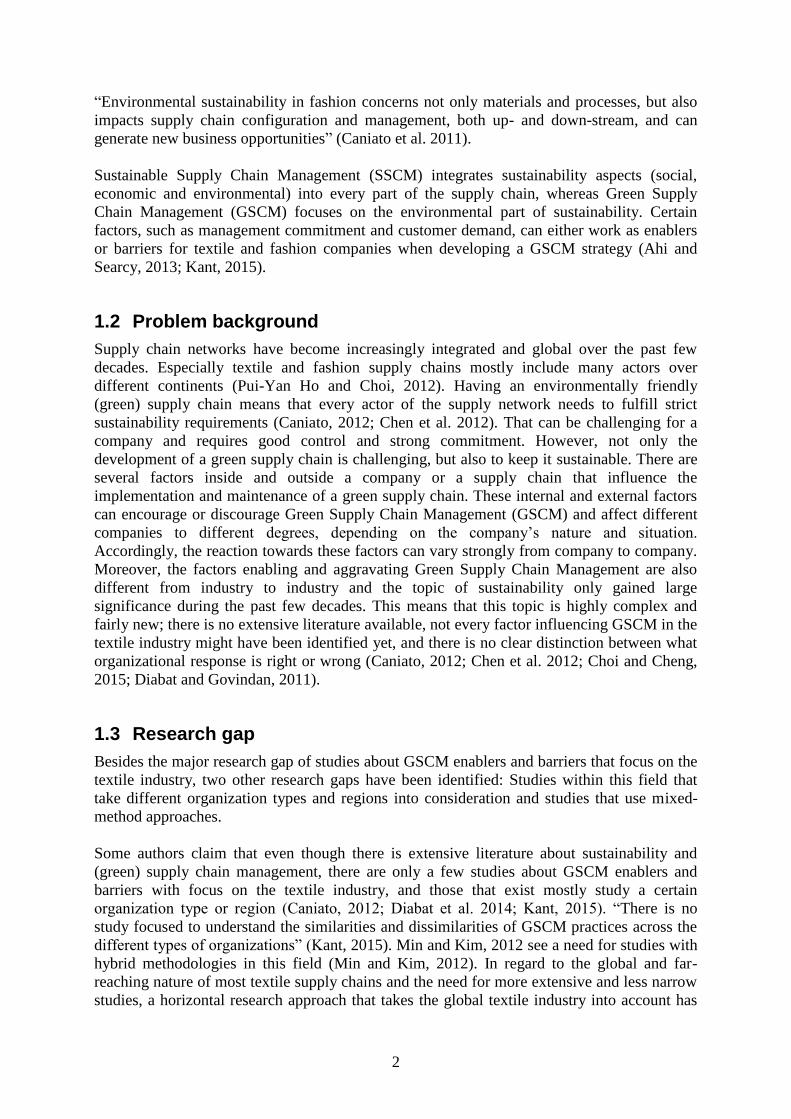
“Environmental sustainability in fashion concerns not only materials and processes, but also
impacts supply chain configuration and management, both up- and down-stream, and can
generate new business opportunities” (Caniato et al. 2011).
Sustainable Supply Chain Management (SSCM) integrates sustainability aspects (social,
economic and environmental) into every part of the supply chain, whereas Green Supply
Chain Management (GSCM) focuses on the environmental part of sustainability. Certain
factors, such as management commitment and customer demand, can either work as enablers
or barriers for textile and fashion companies when developing a GSCM strategy (Ahi and
Searcy, 2013; Kant, 2015).
1.2 Problem background
Supply chain networks have become increasingly integrated and global over the past few
decades. Especially textile and fashion supply chains mostly include many actors over
different continents (Pui-Yan Ho and Choi, 2012). Having an environmentally friendly
(green) supply chain means that every actor of the supply network needs to fulfill strict
sustainability requirements (Caniato, 2012; Chen et al. 2012). That can be challenging for a
company and requires good control and strong commitment. However, not only the
development of a green supply chain is challenging, but also to keep it sustainable. There are
several factors inside and outside a company or a supply chain that influence the
implementation and maintenance of a green supply chain. These internal and external factors
can encourage or discourage Green Supply Chain Management (GSCM) and affect different
companies to different degrees, depending on the company’s nature and situation.
Accordingly, the reaction towards these factors can vary strongly from company to company.
Moreover, the factors enabling and aggravating Green Supply Chain Management are also
different from industry to industry and the topic of sustainability only gained large
significance during the past few decades. This means that this topic is highly complex and
fairly new; there is no extensive literature available, not every factor influencing GSCM in the
textile industry might have been identified yet, and there is no clear distinction between what
organizational response is right or wrong (Caniato, 2012; Chen et al. 2012; Choi and Cheng,
2015; Diabat and Govindan, 2011).
1.3 Research gap
Besides the major research gap of studies about GSCM enablers and barriers that focus on the
textile industry, two other research gaps have been identified: Studies within this field that
take different organization types and regions into consideration and studies that use mixed-
method approaches.
Some authors claim that even though there is extensive literature about sustainability and
(green) supply chain management, there are only a few studies about GSCM enablers and
barriers with focus on the textile industry, and those that exist mostly study a certain
organization type or region (Caniato, 2012; Diabat et al. 2014; Kant, 2015). “There is no
study focused to understand the similarities and dissimilarities of GSCM practices across the
different types of organizations” (Kant, 2015). Min and Kim, 2012 see a need for studies with
hybrid methodologies in this field (Min and Kim, 2012). In regard to the global and far-
reaching nature of most textile supply chains and the need for more extensive and less narrow
studies, a horizontal research approach that takes the global textile industry into account has
3
been chosen for this study. In order to fill the research gap of a study about GSCM enablers
and barriers with a mixed-method or hybrid methodology, and giving the research more focus,
while keeping the broad approach, this study shall combine different empirical studies.
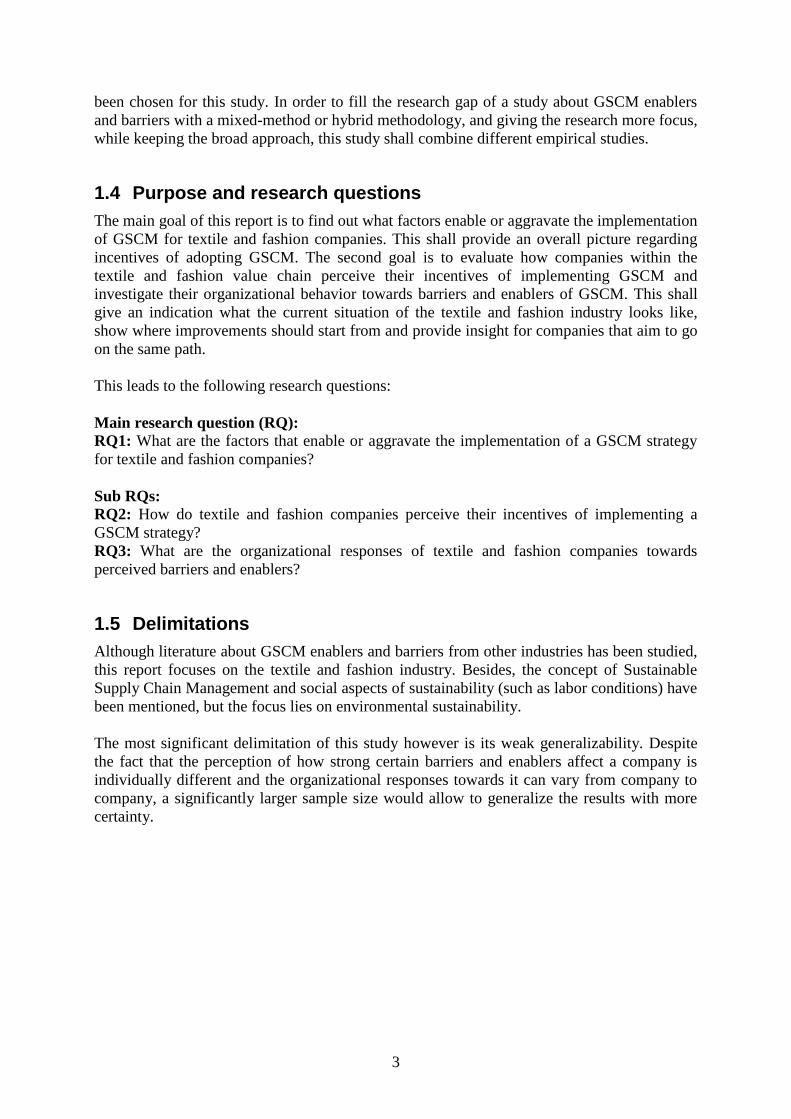
1.4 Purpose and research questions
The main goal of this report is to find out what factors enable or aggravate the implementation
of GSCM for textile and fashion companies. This shall provide an overall picture regarding
incentives of adopting GSCM. The second goal is to evaluate how companies within the
textile and fashion value chain perceive their incentives of implementing GSCM and
investigate their organizational behavior towards barriers and enablers of GSCM. This shall
give an indication what the current situation of the textile and fashion industry looks like,
show where improvements should start from and provide insight for companies that aim to go
on the same path.
This leads to the following research questions:
Main research question (RQ):
RQ1: What are the factors that enable or aggravate the implementation of a GSCM strategy
for textile and fashion companies?
Sub RQs:
RQ2: How do textile and fashion companies perceive their incentives of implementing a
GSCM strategy?
RQ3: What are the organizational responses of textile and fashion companies towards
perceived barriers and enablers?
1.5 Delimitations
Although literature about GSCM enablers and barriers from other industries has been studied,
this report focuses on the textile and fashion industry. Besides, the concept of Sustainable
Supply Chain Management and social aspects of sustainability (such as labor conditions) have
been mentioned, but the focus lies on environmental sustainability.
The most significant delimitation of this study however is its weak generalizability. Despite
the fact that the perception of how strong certain barriers and enablers affect a company is
individually different and the organizational responses towards it can vary from company to
company, a significantly larger sample size would allow to generalize the results with more
certainty.
4
2 Literature Review
The literature review provides the theoretical framework, consisting of two areas of research.
In the first section relevant literature on Supply Chain Management (SCM) and Green Supply
Chain Management (GSCM) in general and with focus on the textile and fashion industry are
summarized to demonstrate the similarities and differences between SCM and GSCM. Then,
the drivers and barriers of transforming SCM to GSCM that have been identified in literature
are presented.
A comparative study that analyzed definitions of Green Supply Chain Management (GSCM)
and Sustainable Supply Chain Management (SSCM) showed that the two concepts are largely
similar, with the exception that GSCM focuses on the environmental side of sustainability
(Ahi and Searcy, 2013). Since this study also concentrates on environmental aspects, the
concept of GSCM is in the focus. However, literature about both concepts; GSCM and
SSCM, as well as other similar programs, has been studied in order to gain a deeper
understanding of the topic.
2.1 Supply Chain Management
Effective in 2005, the Council of Logistics Management (CLM) changed its name to the
Council of Supply Chain Management Professionals (CSCMP) (Mhlnews.com, 2004).
According to the definitions by CSCMP, supply chain management includes all logistics
management activities. In addition, supply chain management also encompasses coordination
and collaboration with channel partners (CSCMP, 2013). As a matter of fact, the term “supply
chain management” has grown popularity over the term “logistics management” since the
1980s (Waters, 2011). This trend is in line with the interest of manufacturers and service
providers to collaborate with their suppliers integrating the purchasing and supply
management functions during the 1990s (Tan, 2001). However, back in 1958, Forrester had
pointed out that integrating activities has been a developing theme of logistics for decades. As
Waters (2011) pointed out, the pursuit of own individual benefits among supply chain
partners is one of the reasons integration of the supply chain is more of an ideal than reality.
Tan (2001) holds a similar stand, stating: “Technically, the value chain is too complex to
achieve a full integration of all business entities within it in order to reap the benefits offered
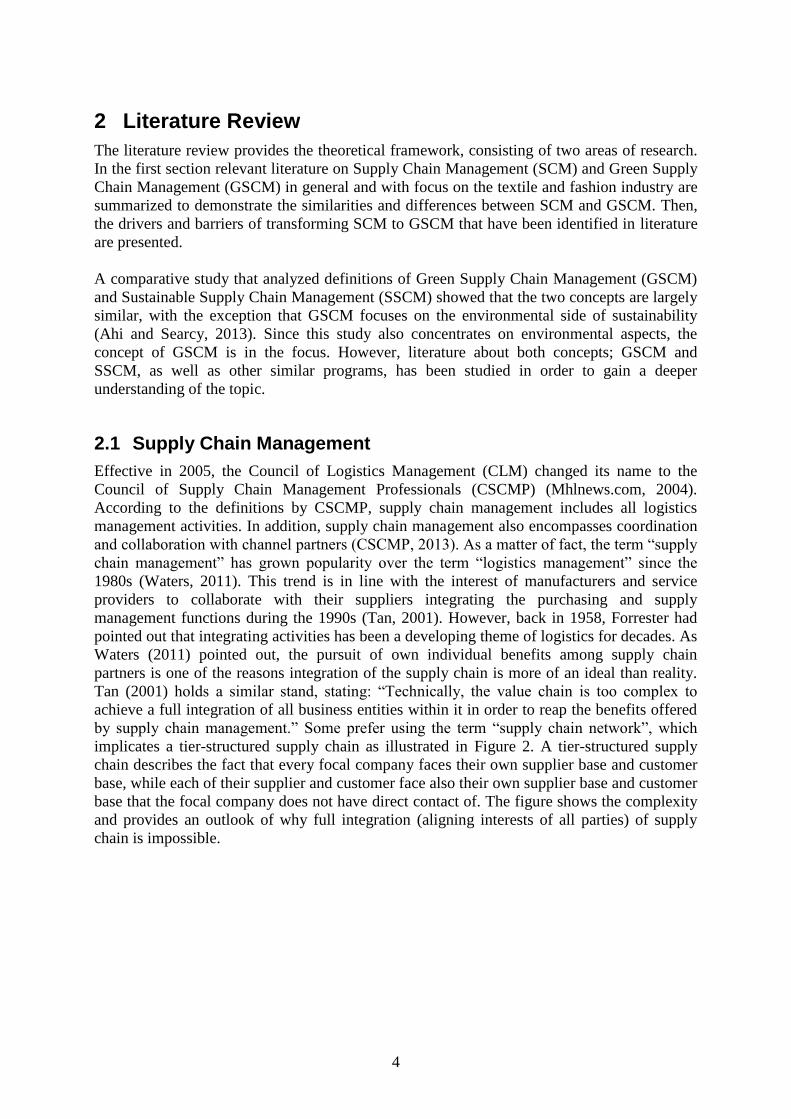
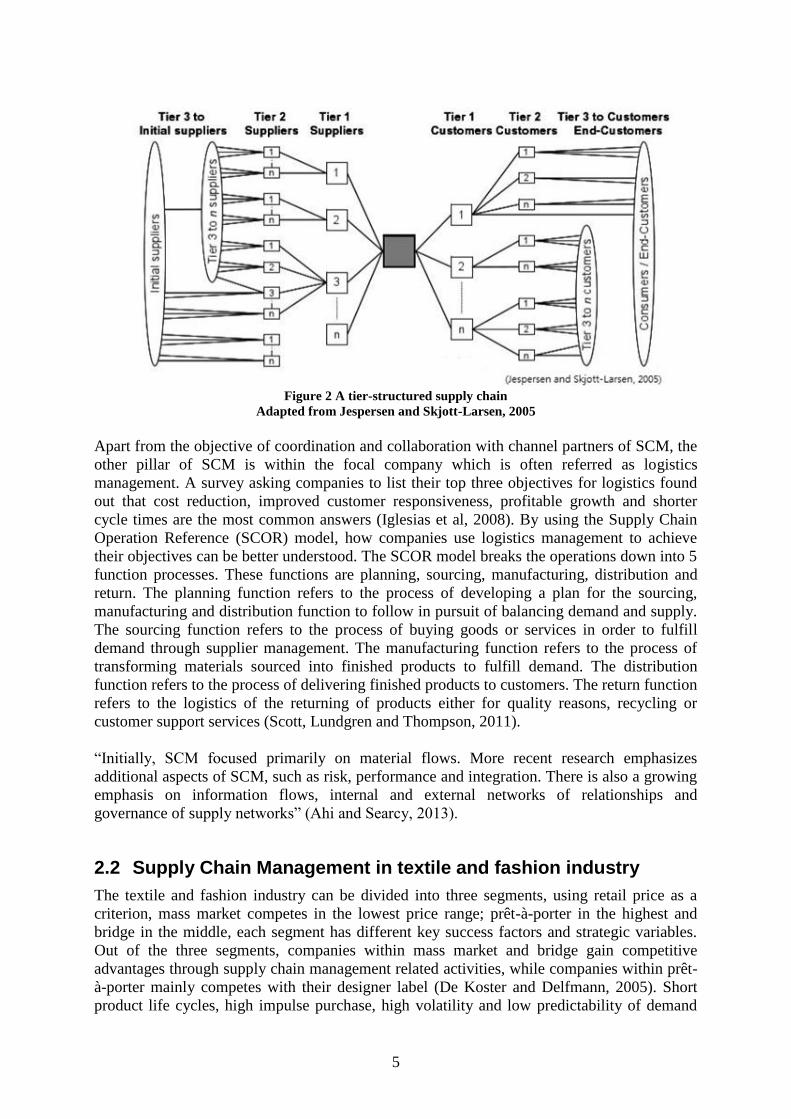
by supply chain management.” Some prefer using the term “supply chain network”, which
implicates a tier-structured supply chain as illustrated in Figure 2. A tier-structured supply
chain describes the fact that every focal company faces their own supplier base and customer
base, while each of their supplier and customer face also their own supplier base and customer
base that the focal company does not have direct contact of. The figure shows the complexity
and provides an outlook of why full integration (aligning interests of all parties) of supply
chain is impossible.
5
Figure 2 A tier-structured supply chain
Adapted from Jespersen and Skjott-Larsen, 2005
Apart from the objective of coordination and collaboration with channel partners of SCM, the
other pillar of SCM is within the focal company which is often referred as logistics
management. A survey asking companies to list their top three objectives for logistics found
out that cost reduction, improved customer responsiveness, profitable growth and shorter
cycle times are the most common answers (Iglesias et al, 2008). By using the Supply Chain
Operation Reference (SCOR) model, how companies use logistics management to achieve
their objectives can be better understood. The SCOR model breaks the operations down into 5
function processes. These functions are planning, sourcing, manufacturing, distribution and
return. The planning function refers to the process of developing a plan for the sourcing,
manufacturing and distribution function to follow in pursuit of balancing demand and supply.
The sourcing function refers to the process of buying goods or services in order to fulfill
demand through supplier management. The manufacturing function refers to the process of
transforming materials sourced into finished products to fulfill demand. The distribution
function refers to the process of delivering finished products to customers. The return function
refers to the logistics of the returning of products either for quality reasons, recycling or
customer support services (Scott, Lundgren and Thompson, 2011).
“Initially, SCM focused primarily on material flows. More recent research emphasizes
additional aspects of SCM, such as risk, performance and integration. There is also a growing
emphasis on information flows, internal and external networks of relationships and
governance of supply networks” (Ahi and Searcy, 2013).
2.2 Supply Chain Management in textile and fashion industry
The textile and fashion industry can be divided into three segments, using retail price as a
criterion, mass market competes in the lowest price range; prêt-à-porter in the highest and
bridge in the middle, each segment has different key success factors and strategic variables.
Out of the three segments, companies within mass market and bridge gain competitive
advantages through supply chain management related activities, while companies within prêt-
à-porter mainly competes with their designer label (De Koster and Delfmann, 2005). Short
product life cycles, high impulse purchase, high volatility and low predictability of demand
6
are the four characteristics typically found in the fashion industry (Christopher and Peck,
1997). Above listed characteristics combine with common strategies taken by fashion
companies create an environment that is challenging for supply chain management. Apparel
manufacturing, as a labor-intensive process, takes advantage of low labor cost in Far East
countries. Despite the cost reduction benefit, off-shore outsourcing leads to significantly
longer lead times. Average time for transforming raw materials into apparel displayed on
store shelves was estimated to be 66 weeks, with only 11 weeks take up with actual
production (Al‐Zubaidi and Tyler, 2004) another source estimated that lead time is 390 days,
with 37 days of actual production (Waters, 2011). Other strategies mentioned by Abernathy,
et al (1999) are products proliferation and increasing percentage of fashion garments. Both
strategies result in increasing number of SKUs, which further raise unpredictability of
demand. Consequently, along with the factor of longer lead times, carrying cost became
higher, stock-outs; mark downs were observed more often (Christopher and Peck, 1997).
Quick Response (QR) therefore became a widely used concept in clothing industry where the
aim is to replace the old practice of pre-ordering before start of season with frequent in-season
reordering of apparel by retailers (Al‐Zubaidi and Tyler, 2004). However, even with 100%
EDI (Electronic Data Interchange) linkage between retailers and suppliers among Fortune 500
companies in the textile and clothing industry (Gilbert and Reichert, 1997), researchers have
identified obstacles putting QR into practices, such as time required to develop deep trusting
partnerships within the value chain, difficulty and cost of assessing performance, cost and risk
of implementing QR practices and lack of knowledge to utilize POS data (Al‐Zubaidi and
Tyler, 2004). Emerging after QR strategy, Fast fashion is another strategy adopted by many
global retailers where the aim is “adapting merchandise assortments to current and emerging
trends as quickly and effectively as possible (Sull and Turconi, 2008).” Compared to other
industries, “Impact of product design complexity on supply chain risk is even more significant
in industries, such as fashion, where product design is a competitive advantage (Sardar and
Lee, 2014).” Fast fashion strategy further enhances product complexity, reaching a point
where some companies value capacity flexibility over cost benefits, provoking an emerging
trend of reshoring (Sardar and Lee, 2014).
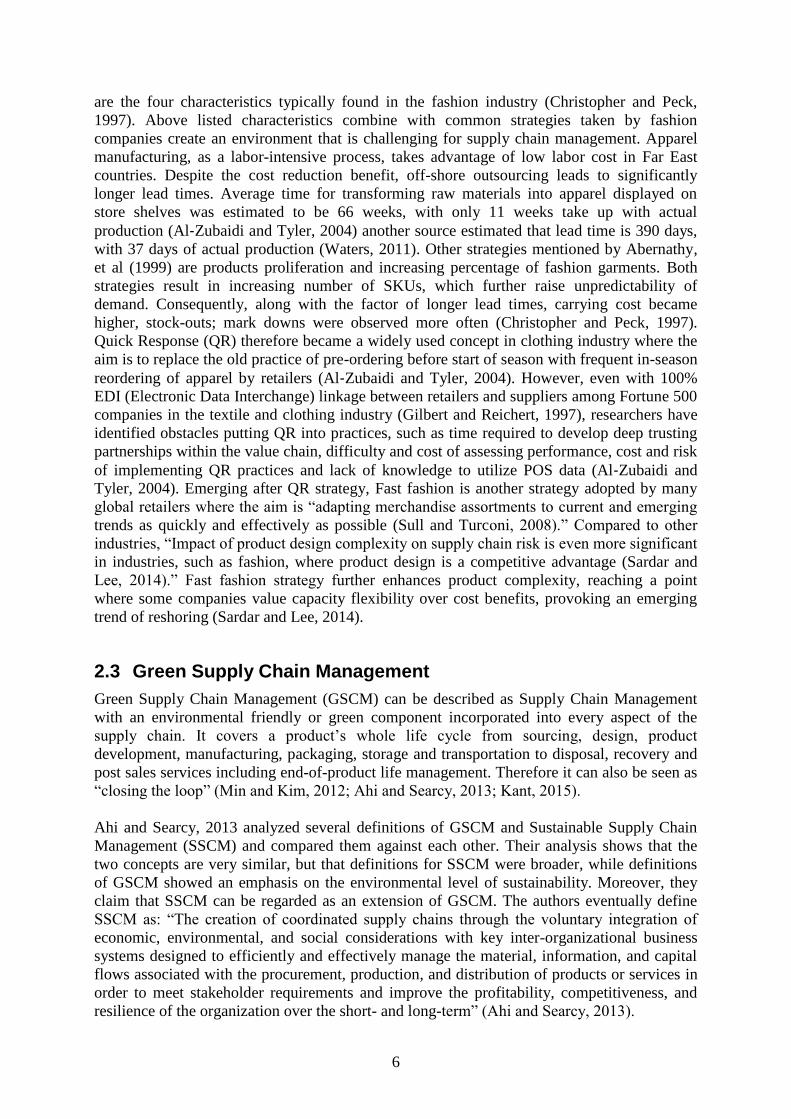
2.3 Green Supply Chain Management
Green Supply Chain Management (GSCM) can be described as Supply Chain Management
with an environmental friendly or green component incorporated into every aspect of the
supply chain. It covers a product’s whole life cycle from sourcing, design, product
development, manufacturing, packaging, storage and transportation to disposal, recovery and
post sales services including end-of-product life management. Therefore it can also be seen as
“closing the loop” (Min and Kim, 2012; Ahi and Searcy, 2013; Kant, 2015).
Ahi and Searcy, 2013 analyzed several definitions of GSCM and Sustainable Supply Chain
Management (SSCM) and compared them against each other. Their analysis shows that the
two concepts are very similar, but that definitions for SSCM were broader, while definitions
of GSCM showed an emphasis on the environmental level of sustainability. Moreover, they
claim that SSCM can be regarded as an extension of GSCM. The authors eventually define
SSCM as: “The creation of coordinated supply chains through the voluntary integration of
economic, environmental, and social considerations with key inter-organizational business
systems designed to efficiently and effectively manage the material, information, and capital
flows associated with the procurement, production, and distribution of products or services in
order to meet stakeholder requirements and improve the profitability, competitiveness, and
resilience of the organization over the short- and long-term” (Ahi and Searcy, 2013).
7
Tihomir and Goran, 2014 identify three main reasons why companies implement the
environmental friendly GSCM strategy into their corporation:
- Legislation - they have to comply with the environmental regulations,
- Marketing - addressing the environmental concerns of their customers,
- Ecological awareness - mitigate the environmental impact of their production
activities (Tihomir and Goran, 2014).
Environmental legislation is also mentioned in Kant’s review as one of the prime concerns for
manufacturers across the world economy. He explains further that GSCM is an essential
strategy to integrate environmental management practices for increasing the business profit
and market share in order to increase the competitive advantage and maintain a greener
supply chain (Kant, 2015). Diabat et al. 2014 explain claim that there can be social, economic
and environmental benefits for traditional supply chains if they develop a Sustainable Supply
Chain Management (SSCM) strategy. Employees, shareholders, business partners and the
wider community can profit from those benefits. However, the authors also explain that
effective integration of sustainability into industries requires action beyond the organizational
boundaries (Diabat et al. 2014).
Kant, 2015 investigated the frequency with which certain focused industries published articles
that contained the key word “GSCM”. The research shows that most articles were published
in the automotive industry (15), the manufacturing industry (14) and the electronics industry
(11). The textile and apparel industry published 5 articles, the fashion industry 4 articles and
the apparel industry 2 articles. However, it is not completely clear why the fashion industry
and the apparel industry are mentioned separately and not included in textile and apparel
industry. Most articles about GSCM are published in Asia (especially Taiwan and China), the
USA and Europe (especially the UK and the Netherlands) (Kant, 2015).
Eventually the author claims that there is currently no research with the purpose to understand
similarities and differences of GSCM approaches across different types of organizations. Also
a mixed methods approach and the use of a mathematical model to explain the subject lacks in
his review of 177 GSCM related articles (Kant, 2015). The insight that sustainability can
improve a company’s bottom line through cost savings, increased market share, and better
brand images, has caused that the number of companies that have started to implement GSCM
practices has grown. Subsequently, within the past two decades academia has risen strong
interest in GSCM related topics. Min and Kim, 2012 explain that GSCM research is
interdisciplinary by nature. However, they identify a lack of and a growing need for studies
that use hybrid methodologies or mixed method approaches that combine the advantages of
different research tools and address interdependent environmental issues considering the
entire supply chain. Besides, the use of the empirical research approaches for manufacturing,
green logistics, and reverse logistics is very rare (Min and Kim, 2012).
Companies with a green supply chain (GSC) need to have very strict partner selection and
performance evaluation processes (Wu and Barnes, 2015, Chen et al. 2012). When choosing
the most appropriate partners for developing a GSC, a company has to consider contemporary
environmental issues, as well as traditional economic factors in order to keep profitability
high (Wu and Barnes, 2015). Wu and Barnes, 2015 describe four clusters that need to be
considered when operating a green supply chain (GSC): cost, pollution control, quality and
resource consumption. Keeping the costs at a minimum is an important goal for any supply
chain, also a GSC. Pollution control is important in order to keep the negative environmental
impact due to different kinds of waste to a minimum. High product quality and good customer
8
service are essential also for GSCs. With the goal to minimize the negative environmental
impact, the consumption of resources also needs to be minimized in a green supply chain (Wu
and Barnes, 2015).
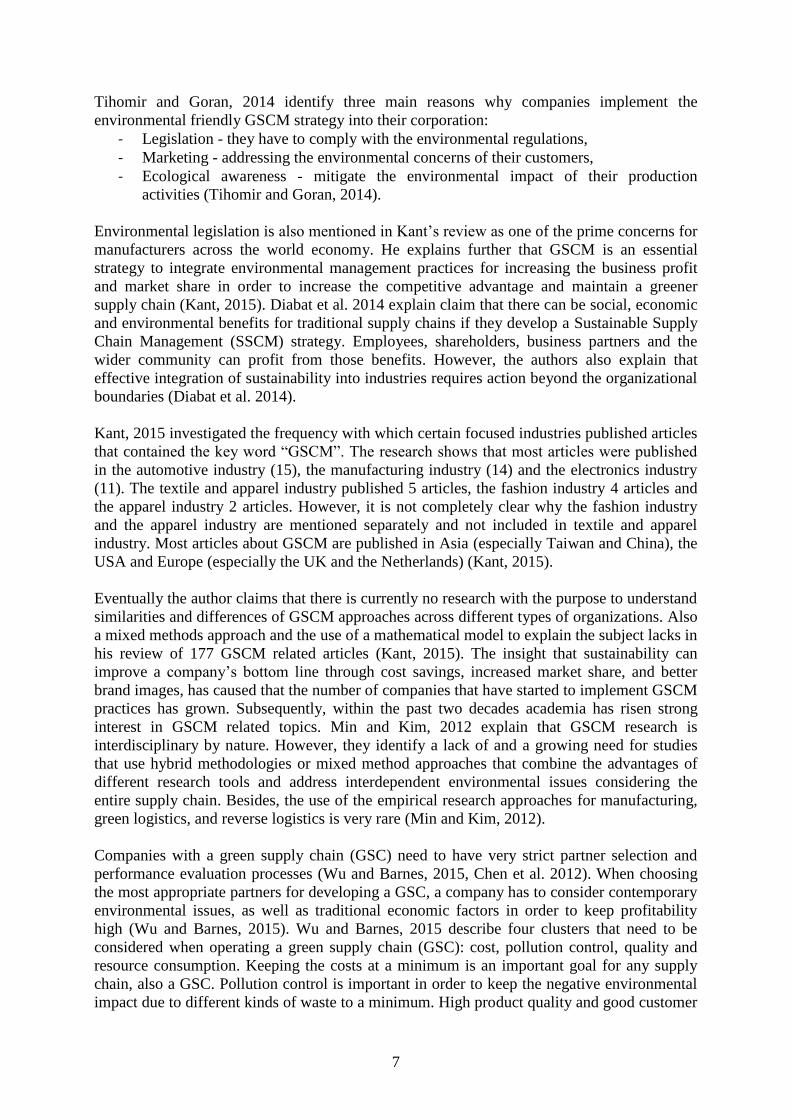
A questionnaire survey conducted during April and May 2009 investigated the level of GSCM
(LGSCM) of Chinese companies and analyzed the relationships between LGSCM and the
classified determinant factors. The study shows that Chinese companies were still at a
preliminary stage of GSCM practices at that time. There is very limited cooperation between
the environmental management and external members of the supply chain. A company’s
LGSCM is deeply connected with the external pressures from regulatory, domestic clients and
business competitors. As an internal factor, a company’s learning capacity strongly
determines LGSCM. It is also shown that the internal factors function as intermediate
variables of external pressures in influencing a company’s LGSCM. Internal training of
employees to increase their involvement in GSCM practices can significantly improve a
company’s environmental management capacities. Figure 3 shows how GSCM practices are
influenced and controlled by external, internal and controlling factors (Lui et al. 2011).
Figure 3 Influencing factors on GSCM practices
Adapted from Lui et al. 2011
2.4 Green Supply Chain Management in textile and fashion industry
With the exception of the luxury market, the textiles and fashion industry is considered a low-
value manufacturing industry, with extremely high competition. Supply chains are becoming
more complex, global and faster, which is counterproductive for the ecological footprint of
the industry. Under these circumstances GSCM and SSCM are seen as a promising
9
opportunity to create the ideal low-impact industry and profit from many benefits. However,
many companies struggle moving toward sustainability in the supply chain (Pui-Yan Ho and
Choi, 2012).
Especially fast fashion products are usually very trend sensitive and are therefore often
disposed by the consumers after a short period of time. This disposal of fashion products
causes waste and environmental problems. On the other hand, many fast fashion companies,
such as Zara, H&M, and Topshop, source from local manufacturers and suppliers in order to
minimize lead time. Shorter transportation distances decrease the carbon foot print and are
therefore more environmentally friendly than the more traditional offshore sourcing.
Moreover, fast fashion products better match supply and demand and keep inventory low. A
low level of inventory and a lower forecast error reduce the amount of waste (Choi and
Cheng, 2015). This means that the fast fashion model appears to be unsustainable from a
consumer perspective, but might in fact be more sustainable than a traditional fashion model
from a supply chain perspective. However, since GSCM considers the whole supply chain
including end-of-product life management. This means that a fast fashion company with a
serious GSCM approach would need to take responsibility for the disposed garments, since
green supply chains are ideally cyclical in nature; keeping waste within the industrial system.
This development towards a closed loop supply chain is an ideal which many companies seek
to achieve in the long term (Pui-Yan Ho and Choi, 2012). The most sustainable solution
would be if the company takes back their unsold and sold, used products, recycles them and
uses the material for new products. That way, a product has a theoretically endless lifecycle
and the fashion loop is completely closed. A less sustainable option would be selling the used
and unsold products as second-hand clothes in developing countries, since the cheap import of
second-hand clothing can harm the local economy (Brooks, 2015).
Wu et al (2011) found that there are not many papers about GSCM that have focused on the
textile and apparel industry and took this as a motivation to investigate GSCM practices in
Taiwan’s textile and apparel industry. According to them GSCM practices include green
purchasing, cooperation with customers, eco design and investment recovery. In order to
fulfill their corporate social responsibility and ensure sustainable development, apparel
manufacturers need to offer sustainable products (Wu et al. 2011). According to Choi and
Cheng, textile and fashion companies should embrace corporate social responsibility and
develop a long-term vision on managing the brand in order to maintain a strong brand (Choi
and Cheng, 2015). Pui-Yan Ho and Choi, 2012 believe that fashion companies can gain
competitive advantage through strategic management of environmental challenges and should
strongly consider the product development process in their greening initiatives. Moreover,
they need to take responsibility across the multiple life-cycles of products in order to have a
green supply chain (Pui-Yan Ho and Choi, 2012).
2.5 Enablers and Barriers of adopting GSCM
Companies face enablers and barriers to Sustainable Supply Chain Management (SSCM)
(Seuring and Müller, 2008); factors that can be internal or external to the organization
(Walker and Jones, 2012). Tay et al. 2015 explain that the drivers and barriers of GSCM are
results of conflicts between different stakeholders, including customers, employees, suppliers,
regulators, governmental agencies, and shareholders and their reactions towards green
initiatives (Tay et al. 2015). Some important GSCM drivers are organizational support, social
capital and government involvement. Institutional pressures, including market pressure,
10
regulatory pressure and competitive pressure are essential in developing sustainable and green
products in the textile and apparel industry (Wu et al. 2011).
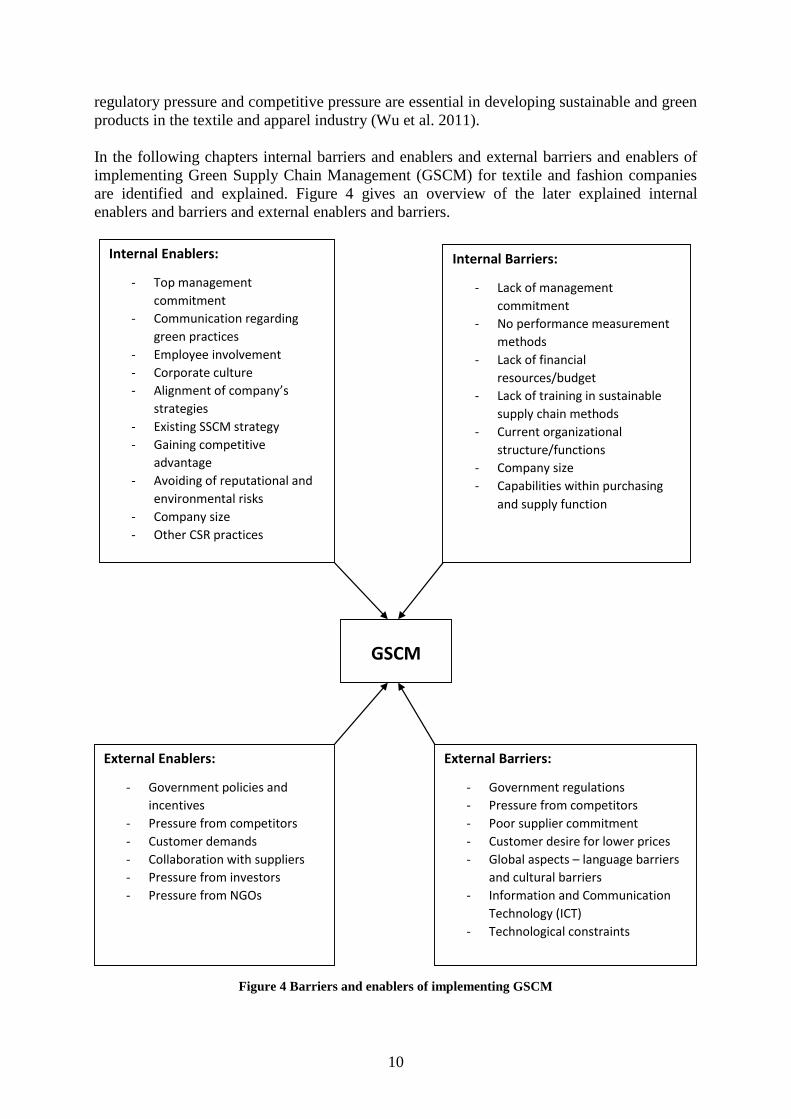
In the following chapters internal barriers and enablers and external barriers and enablers of
implementing Green Supply Chain Management (GSCM) for textile and fashion companies
are identified and explained. Figure 4 gives an overview of the later explained internal
enablers and barriers and external enablers and barriers.
Internal
GSCM
Internal Enablers:
- Top management
commitment
- Communication regarding
green practices
- Employee involvement
- Corporate culture
- Alignment of company’s
strategies
- Existing SSCM strategy
- Gaining competitive
advantage
- Avoiding of reputational and
environmental risks
- Company size
- Other CSR practices
Internal Barriers:
- Lack of management
commitment
- No performance measurement
methods
- Lack of financial
resources/budget
- Lack of training in sustainable
supply chain methods
- Current organizational
structure/functions
- Company size
- Capabilities within purchasing
and supply function
External Enablers:
- Government policies and
incentives
- Pressure from competitors
- Customer demands
- Collaboration with suppliers
- Pressure from investors
- Pressure from NGOs
External Barriers:
- Government regulations
- Pressure from competitors
- Poor supplier commitment
- Customer desire for lower prices
- Global aspects – language barriers
and cultural barriers
- Information and Communication
Technology (ICT)
- Technological constraints
Figure 4 Barriers and enablers of implementing GSCM
11
Several articles have done literature review on the drivers or barriers of adopting GSCM
(Walker, Di Sisto and McBain, 2008; Diabat and Govindan, 2011; Wu, Ding and Chen, 2012;
Muduli et al., 2013) and SSCM (Walker and Jones, 2012; Diabat, Kannan and
Mathiyazhagan, 2014; Tay et al., 2015). Diabat and Govindan (2011) identified two factors:
government regulation and legislation and reverse logistics as dominate enablers for an Indian
manufacturing firm using Interpretive Structural Modeling (ISM). Using the same
methodology, another five dominant enablers are identified for five Indian textile units:
adoption of safety standards, adoption of green practices, community economic welfare,
health and safety issues, and employment stability (Diabat, Kannan and Mathiyazhagan,
2014). Despite the different focus of adopting GSCM and SSCM, the drivers and barriers
identified in the articles of Walker, Di Sisto and McBain (2008), Wu, Ding and Chen (2012),
Muduli et al. (2013), Walker and Jones (2012) and Tay et al. (2015) share high resemblance.
Their results are presented in the following sectors.
2.5.1 Internal enablers
Most enablers identified are surrounded with the “people” factor, whether people are
committed toward implementing GSCM and whether people have the ability of implementing
GSCM. Enablers which involve commitment include the commitment of top and middle
management (Walker and Jones, 2012; Wu, Ding and Chen, 2012; Muduli et al., 2013; Tay et
al., 2015), employee involvement (Walker, Di Sisto and McBain, 2008; Walker and Jones,
2012; Wu, Ding and Chen, 2012; Muduli et al., 2013; Tay et al., 2015), or more generally put,
personal commitment of individuals (Walker, Di Sisto and McBain, 2008) and foster of
culture (Walker and Jones, 2012; Muduli et al., 2013; Tay et al., 2015). In order to increase
the rate of employee involvement, it is suggested management should authorize power
regarding environmental issues to employees (Muduli et al., 2013). It is therefore crucial that
everyone involves in the implementation of GSCM possesses professional knowledge of
environmental issues (Wu, Ding and Chen, 2012). On-job-training (Wu, Ding and Chen,
2012; Muduli et al., 2013) not only can provide the human resource required but also provide
a mean of cultural transformation (Muduli et al., 2013). Implementation of GSCM is a
makeover of companies, affecting current processes and practices of different departments,
cross-departmental communication thus enables the implementation process (Wu, Ding and
Chen, 2012; Muduli et al., 2013). From a resource-based perspective, larger organizations are
more likely to adopt GSCM (Tay et al., 2015) since their relative abundance of human and
financial resources (Wu, Ding and Chen, 2012). Human and financial resources ensure
enablers such as capabilities within purchasing and supply function (Walker and Jones, 2012;
Tay et al., 2015) and long-term investment in technology (Wu, Ding and Chen, 2012; Muduli
et al., 2013). Companies can evaluate the cost-benefit of adopting GSCM, based on the
appraisal of performance and reward system (Wu, Ding and Chen, 2012; Muduli et al., 2013;
Tay et al., 2015). The system, if well designed, can financially justifies investment on GSCM
and also provide relevant information for strategic planning (Muduli et al., 2013) which is
helpful for identifying GSCM goals and corresponding long-term strategies. Whether
adopting GSCM aligns with the other strategies of the company (Walker and Jones, 2012; Tay
et al., 2015) is a determining factor, as the ultimate objective of companies is to enhance
competitiveness. Therefore gaining competitive advantages (Walker and Jones, 2012; Tay et
al., 2015), reducing reputational and environmental risk (Walker and Jones, 2012; Wu, Ding
and Chen, 2012; Tay et al., 2015), and desire to reduce hidden cost (Walker, Di Sisto and
McBain, 2008) are undoubtedly enablers. The readiness of GSCM affects the wiliness of
companies to implement GSCM practices (Lee, 2008), where existence of sustainable SCM
strategy (Walker and Jones, 2012; Tay et al., 2015), Environmental Management System
12
EMS adoption (Walker and Jones, 2012; Wu, Ding and Chen, 2012; Tay et al., 2015) and
other internal CSR practices influencing SCM (Walker and Jones, 2012; Tay et al., 2015) are
identified as enablers.
Few empirical studies were done to understand the actual strength of enablers in the textile
and fashion industry. Wu, Ding and Chen (2012) conducted an empirical research on
Taiwan’s textile and apparel manufacturers and observed that organizational support (internal
enablers) has the main effects on green practices such as green purchasing, cooperation with
customers, eco-design and investment recovery. Caniato et al. (2012) conducted five case
studies in which two of the participant companies they categorized as Green International
Brands (GBIs) and the other three as Small Alternative Firms (SAFs). They concluded that all
five cases positioned themselves in the green segment because of corporate values and
influence of top management. Two of the SAFs stated it is also their strategy to reduce brand
and retail costs. However, only two internal drivers had been considered; efficiency objectives
related and other company-specific factors such as corporate values.
2.5.2 Internal barriers
Similarly, barriers identified are related with “people”, “resource” and the “alignment of
strategies”. If adopting GSCM is not aligned with other SCM priorities (Walker and Jones,
2012; Tay et al., 2015), for example, a focus on cost reduction (Walker and Jones, 2012) or
other financial, technical, information related goals (Tay et al., 2015), it is less likely
companies will devote resources to it without commitment from top management (Walker and
Jones, 2012; Wu, Ding and Chen, 2012; Tay et al., 2015). Implementing GSCM is demanding
on financial and human resources (Wu, Ding and Chen, 2012; Tay et al., 2015), which smaller
organizations (Walker and Jones, 2012; Tay et al., 2015) might not have sufficient resources
for. Lack of information and technological systems (Wu, Ding and Chen, 2012), lack of
supportive corporate structures and processes (Walker and Jones, 2012; Tay et al., 2015) and
lack of environmental professional knowledge for managers (Wu, Ding and Chen, 2012) all
require resources to make improvements. Other technical aspects are identified as barriers
also, for example lack of understanding of how to incorporate in purchasing (Tay et al., 2015)
and reliance on traditional accounting methods (Walker and Jones, 2012; Tay et al., 2015)
which results in difficulties for companies to justify their investments on implementing
GSCM. There is also an element of organizational reluctance (Muduli et al., 2013) which can
be worsen by lack on training for entry-level employee (Walker and Jones, 2012; Tay et al.,
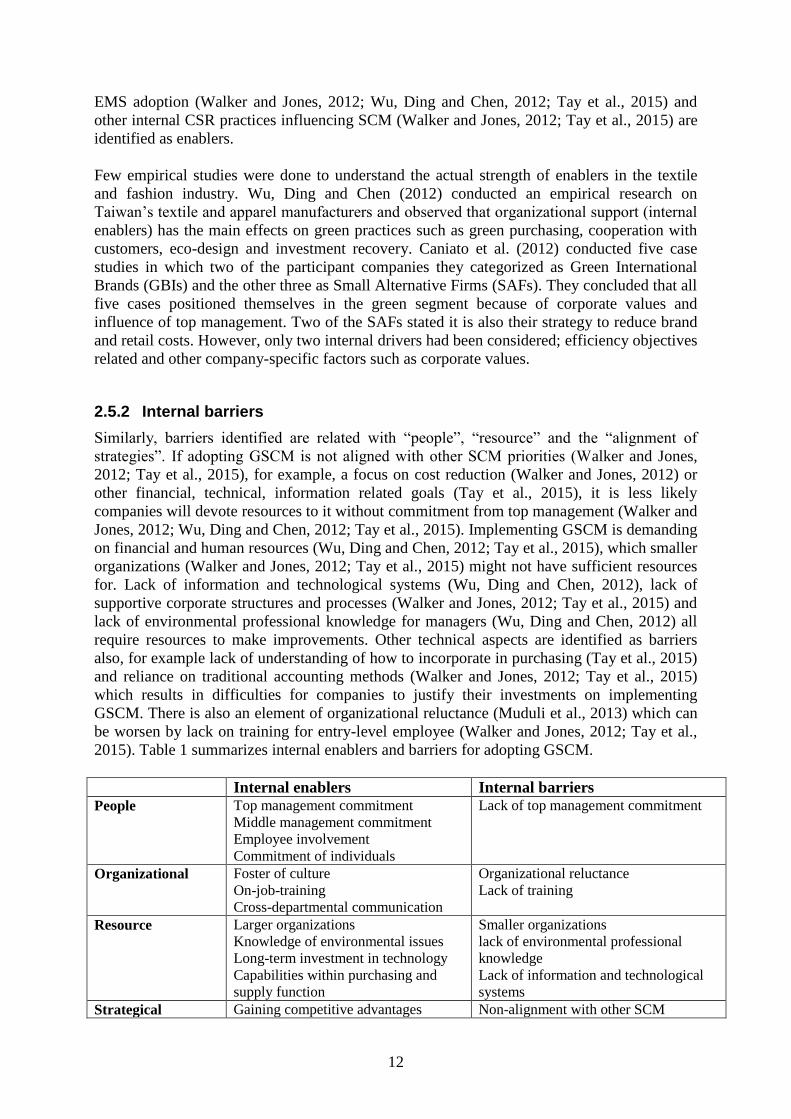
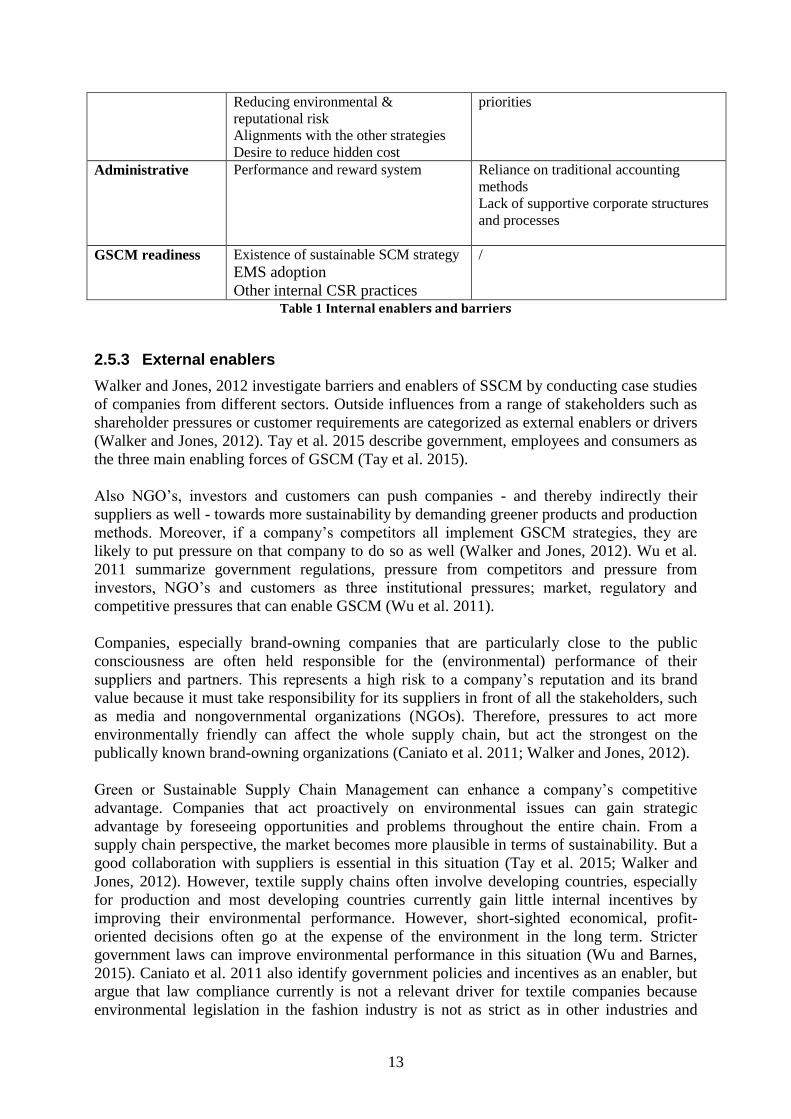
2015). Table 1 summarizes internal enablers and barriers for adopting GSCM.
Internal enablers Internal barriers
People Top management commitment
Middle management commitment
Employee involvement
Commitment of individuals
Lack of top management commitment
Organizational Foster of culture
On-job-training
Cross-departmental communication
Organizational reluctance
Lack of training
Resource Larger organizations
Knowledge of environmental issues
Long-term investment in technology
Capabilities within purchasing and
supply function
Smaller organizations
lack of environmental professional
knowledge
Lack of information and technological
systems
Strategical Gaining competitive advantages Non-alignment with other SCM
13
Reducing environmental &
reputational risk
Alignments with the other strategies
Desire to reduce hidden cost
priorities
Administrative Performance and reward system Reliance on traditional accounting
methods
Lack of supportive corporate structures
and processes
GSCM readiness Existence of sustainable SCM strategy
EMS adoption
Other internal CSR practices
/
Table 1 Internal enablers and barriers
2.5.3 External enablers
Walker and Jones, 2012 investigate barriers and enablers of SSCM by conducting case studies
of companies from different sectors. Outside influences from a range of stakeholders such as
shareholder pressures or customer requirements are categorized as external enablers or drivers
(Walker and Jones, 2012). Tay et al. 2015 describe government, employees and consumers as
the three main enabling forces of GSCM (Tay et al. 2015).
Also NGO’s, investors and customers can push companies - and thereby indirectly their
suppliers as well - towards more sustainability by demanding greener products and production
methods. Moreover, if a company’s competitors all implement GSCM strategies, they are
likely to put pressure on that company to do so as well (Walker and Jones, 2012). Wu et al.
2011 summarize government regulations, pressure from competitors and pressure from
investors, NGO’s and customers as three institutional pressures; market, regulatory and
competitive pressures that can enable GSCM (Wu et al. 2011).
Companies, especially brand-owning companies that are particularly close to the public
consciousness are often held responsible for the (environmental) performance of their
suppliers and partners. This represents a high risk to a company’s reputation and its brand
value because it must take responsibility for its suppliers in front of all the stakeholders, such
as media and nongovernmental organizations (NGOs). Therefore, pressures to act more
environmentally friendly can affect the whole supply chain, but act the strongest on the
publically known brand-owning organizations (Caniato et al. 2011; Walker and Jones, 2012).
Green or Sustainable Supply Chain Management can enhance a company’s competitive
advantage. Companies that act proactively on environmental issues can gain strategic
advantage by foreseeing opportunities and problems throughout the entire chain. From a
supply chain perspective, the market becomes more plausible in terms of sustainability. But a
good collaboration with suppliers is essential in this situation (Tay et al. 2015; Walker and
Jones, 2012). However, textile supply chains often involve developing countries, especially
for production and most developing countries currently gain little internal incentives by
improving their environmental performance. However, short-sighted economical, profit-
oriented decisions often go at the expense of the environment in the long term. Stricter
government laws can improve environmental performance in this situation (Wu and Barnes,
2015). Caniato et al. 2011 also identify government policies and incentives as an enabler, but
argue that law compliance currently is not a relevant driver for textile companies because
environmental legislation in the fashion industry is not as strict as in other industries and
14
recently only concerns elements such as air emissions or water pollution. Therefore, fashion
companies that want to operate a green supply chain, usually go beyond these governmental
regulations in terms of green performance (Caniato et al. 2011).
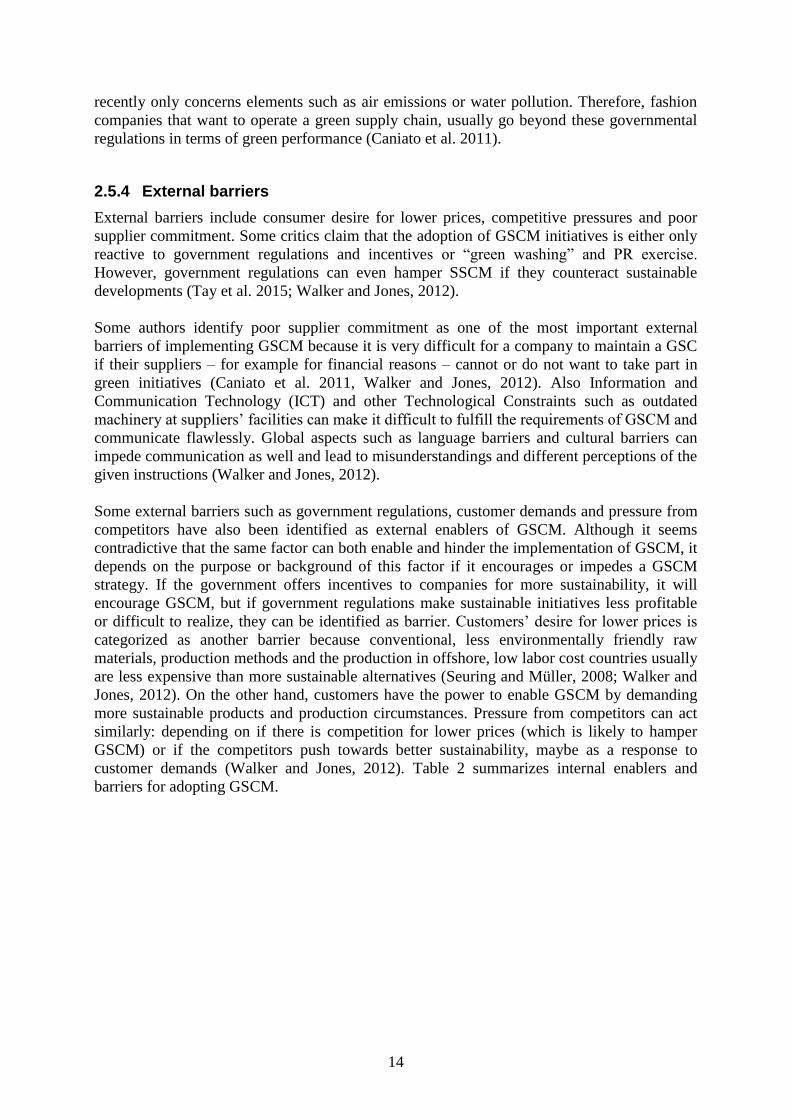
2.5.4 External barriers
External barriers include consumer desire for lower prices, competitive pressures and poor
supplier commitment. Some critics claim that the adoption of GSCM initiatives is either only
reactive to government regulations and incentives or “green washing” and PR exercise.
However, government regulations can even hamper SSCM if they counteract sustainable
developments (Tay et al. 2015; Walker and Jones, 2012).
Some authors identify poor supplier commitment as one of the most important external
barriers of implementing GSCM because it is very difficult for a company to maintain a GSC
if their suppliers – for example for financial reasons – cannot or do not want to take part in
green initiatives (Caniato et al. 2011, Walker and Jones, 2012). Also Information and
Communication Technology (ICT) and other Technological Constraints such as outdated
machinery at suppliers’ facilities can make it difficult to fulfill the requirements of GSCM and
communicate flawlessly. Global aspects such as language barriers and cultural barriers can
impede communication as well and lead to misunderstandings and different perceptions of the
given instructions (Walker and Jones, 2012).
Some external barriers such as government regulations, customer demands and pressure from
competitors have also been identified as external enablers of GSCM. Although it seems
contradictive that the same factor can both enable and hinder the implementation of GSCM, it
depends on the purpose or background of this factor if it encourages or impedes a GSCM
strategy. If the government offers incentives to companies for more sustainability, it will
encourage GSCM, but if government regulations make sustainable initiatives less profitable
or difficult to realize, they can be identified as barrier. Customers’ desire for lower prices is
categorized as another barrier because conventional, less environmentally friendly raw
materials, production methods and the production in offshore, low labor cost countries usually
are less expensive than more sustainable alternatives (Seuring and Müller, 2008; Walker and
Jones, 2012). On the other hand, customers have the power to enable GSCM by demanding
more sustainable products and production circumstances. Pressure from competitors can act
similarly: depending on if there is competition for lower prices (which is likely to hamper
GSCM) or if the competitors push towards better sustainability, maybe as a response to
customer demands (Walker and Jones, 2012). Table 2 summarizes internal enablers and
barriers for adopting GSCM.
15
External Enablers External Barriers
Governmental Government policies and
incentives
Government regulations
Customers Customer demands for
sustainability
Customer desire for lower prices
Suppliers Collaboration with suppliers Poor supplier commitment
Competitors Pressure from competitors Pressure from competitors
Other actors Pressure from investors
Pressure from NGOs
Culture Global aspects – cultural barriers and
language barriers
Technology Information and Communication
Technology (ICT)
Technological constraints Table 2 External enablers and barriers
16
3 Methodology
The theoretical framework contains information about supply chain management and Green
Supply Chain Management, in general and with focus on the textile and fashion industry.
Several factors that can work as drivers or barriers for a company trying to adopt a GSCM
strategy have been identified in literature. These factors are also described in the literature
review. The empirical study combines an online survey and a semi-structured interview where
companies are asked what factors they perceive as their most important GSCM drivers and
barriers. The evaluation process of the survey and the interview is explained in the
methodology chapter and the results are shown in the results chapter and explained in the
analysis chapter. The last part of the results chapter presents case studies about the companies
H&M and Nike in which it is explained how they deal with Corporate Social Responsibility
and GSCM issues.
The methodology chapter strives to provide transparent descriptions of the research process;
the research strategy and design, the design of the survey questionnaire, the data collection
process, the data analysis and the evaluation methods.
3.1 Research strategy and design
An exploratory research approach has been chosen for this report since only few studies about
the barriers and enablers of implementing Green Supply Chain Management in textile supply
chains have been conducted so far, and since this study does not aim to give final and
conclusive answers to the research questions, but rather explores the topic. This approach also
allows having smaller sample sizes (Brown, 2006, p.43; Singh, 2007, p.46).
The relationship between theory and research of this study is mainly deductive because the
theory guides the research; meaning that the design of the empirical studies are built on the
findings of the literature study. However, if the results of this study contradict with the theory,
an inductive approach can be applicable and the theory may be questioned and changed
according to the found results (Bryman, 2012).
Combining both, a quantitative online survey and the qualitative case studies and semi-
structured interviews, a mixed-methods research strategy is applied in this report. The
advantage of a mixed-methods approach in this case is that it allows having a horizontal
approach for the survey; considering global textile supply chains and using the qualitative
studies as explanation for the results of the survey (Bryman, 2012, p.627-630). This way, a
geographic delimitation or a focus on a certain group of supply chain actors is not necessary,
since the case studies and interviews investigate the topic more focused and in-depth.
3.1.1 Design of survey questionnaire
The purpose of the survey is to understand how companies within textile and fashion supply
chains perceive their own tendency to implement Green Supply Chain Management (GSCM).
In search of a comprehensive sample representing companies all across the supply chain, a
multiple choice question was designed to gain knowledge whether the company is a supplier,
manufacturer, retailer or other. However, information regarding company name, department
and position of the respondent is voluntarily provided. The main part of the questionnaire is
organized into four sections: Internal barriers, internal drivers, external barriers and external
17
drivers. In each section, participants were given five to ten factors and were asked to evaluate
how strong each factor is influencing the adoption of GSCM in their company on a seven
point Likert scale.
Factors in the questionnaire were identified through literature review regarding drivers and
barriers of adopting Green Supply Chain Management. Currently, few studies were designed
specifically to identify drivers and barriers within textile and fashion industry. Therefore a
non-mandatory open question is included in the questionnaire as a feedback section for
participants whether they felt the questionnaire is complete regarding the factors listed.
The survey questionnaire is created in a way that allows a deep analysis of the results; even
with a small number of participants. It is for example possible to filter only the answers from
suppliers, manufacturers or all answers from participants of a certain country and compare
them with each other. Also the answers of every single participant can be analyzed separately.
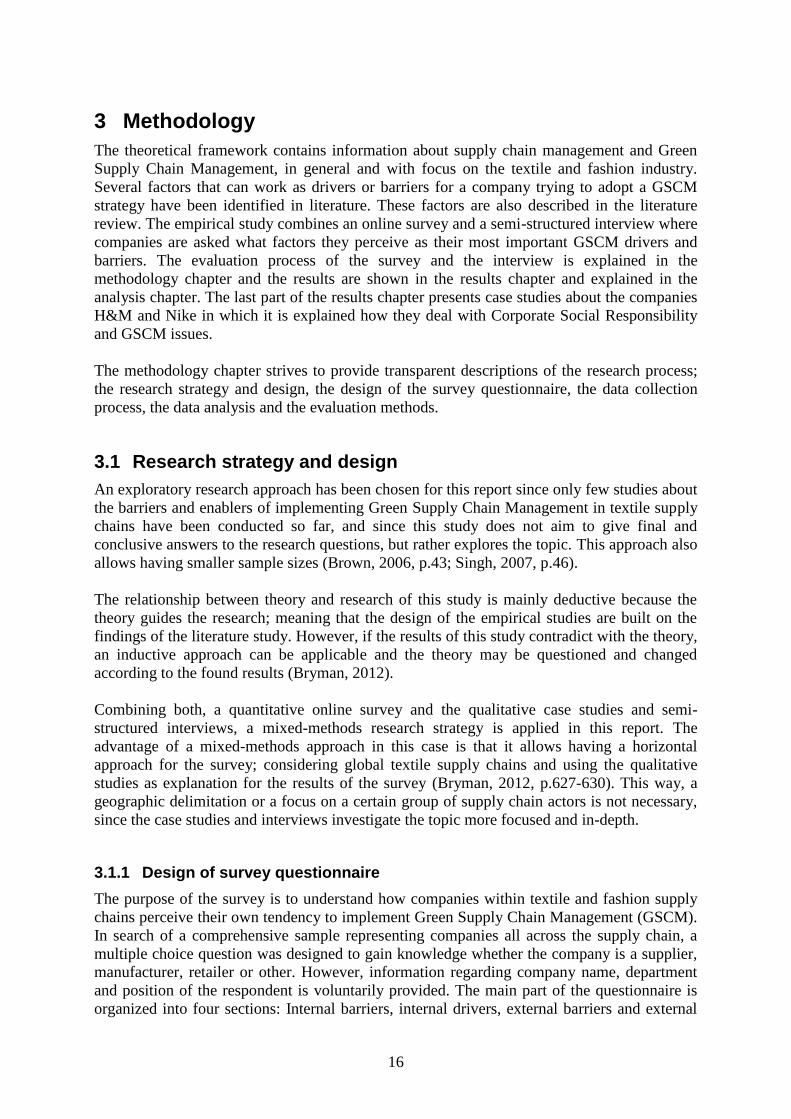
3.2 Data collection
The process consisted of three stages, first an online survey has been conducted, followed by
a semi-structured interview. As there were no respondents that fell in the category of retailers
from the online survey and semi-structured interview, case studies targeted at retailers were
conducted accordingly.
Figure 5 Data collection process
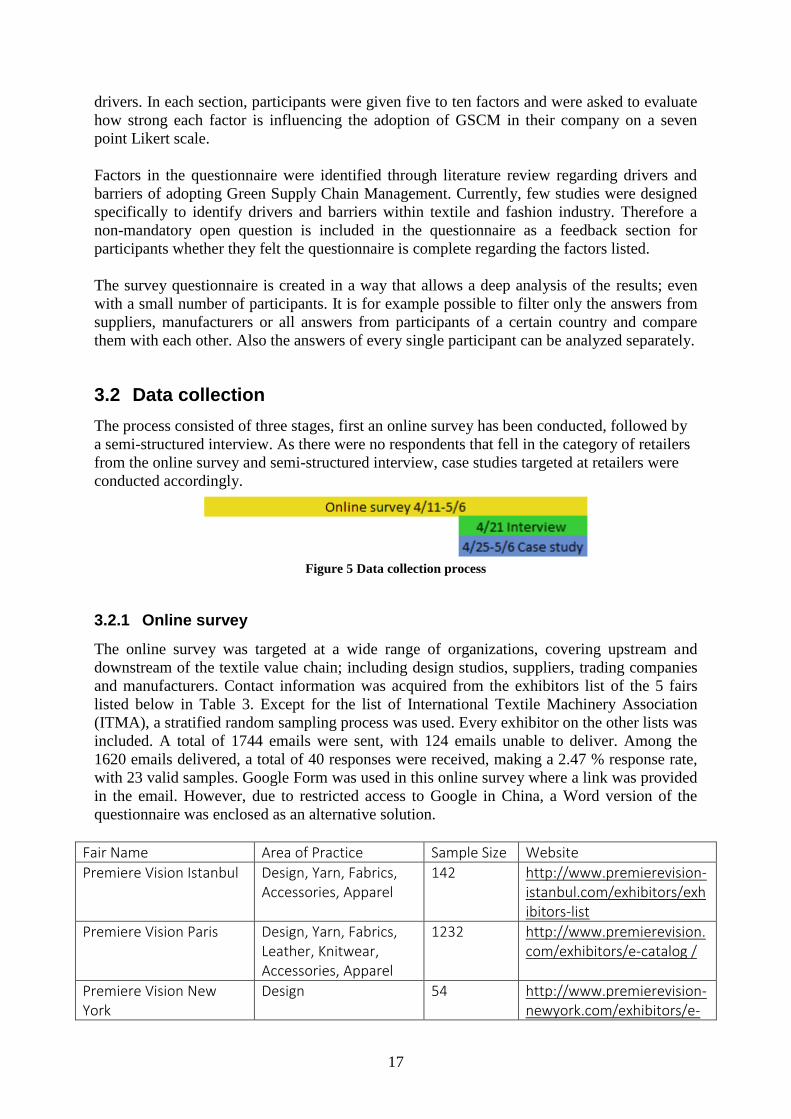
3.2.1 Online survey
The online survey was targeted at a wide range of organizations, covering upstream and
downstream of the textile value chain; including design studios, suppliers, trading companies
and manufacturers. Contact information was acquired from the exhibitors list of the 5 fairs
listed below in Table 3. Except for the list of International Textile Machinery Association
(ITMA), a stratified random sampling process was used. Every exhibitor on the other lists was
included. A total of 1744 emails were sent, with 124 emails unable to deliver. Among the
1620 emails delivered, a total of 40 responses were received, making a 2.47 % response rate,
with 23 valid samples. Google Form was used in this online survey where a link was provided
in the email. However, due to restricted access to Google in China, a Word version of the
questionnaire was enclosed as an alternative solution.
Fair Name Area of Practice Sample Size Website
Premiere Vision Istanbul Design, Yarn, Fabrics, Accessories, Apparel
142 http://www.premierevision-istanbul.com/exhibitors/exhibitors-list
Premiere Vision Paris Design, Yarn, Fabrics, Leather, Knitwear, Accessories, Apparel
1232 http://www.premierevision.com/exhibitors/e-catalog /
Premiere Vision New York
Design 54 http://www.premierevision-newyork.com/exhibitors/e-
18
catalog/
International Textile Machinery Association
Machinery, Chemicals 224 http://www.itma.com/exhibitors/list-of-exhibitors
Techtextil Russia Fibres, Yarn, Fabrics Machinery, Technology
92 https://online.messefrankfurt.ru/eng/info/ttr16/companies/
Table 3 Trade Fairs
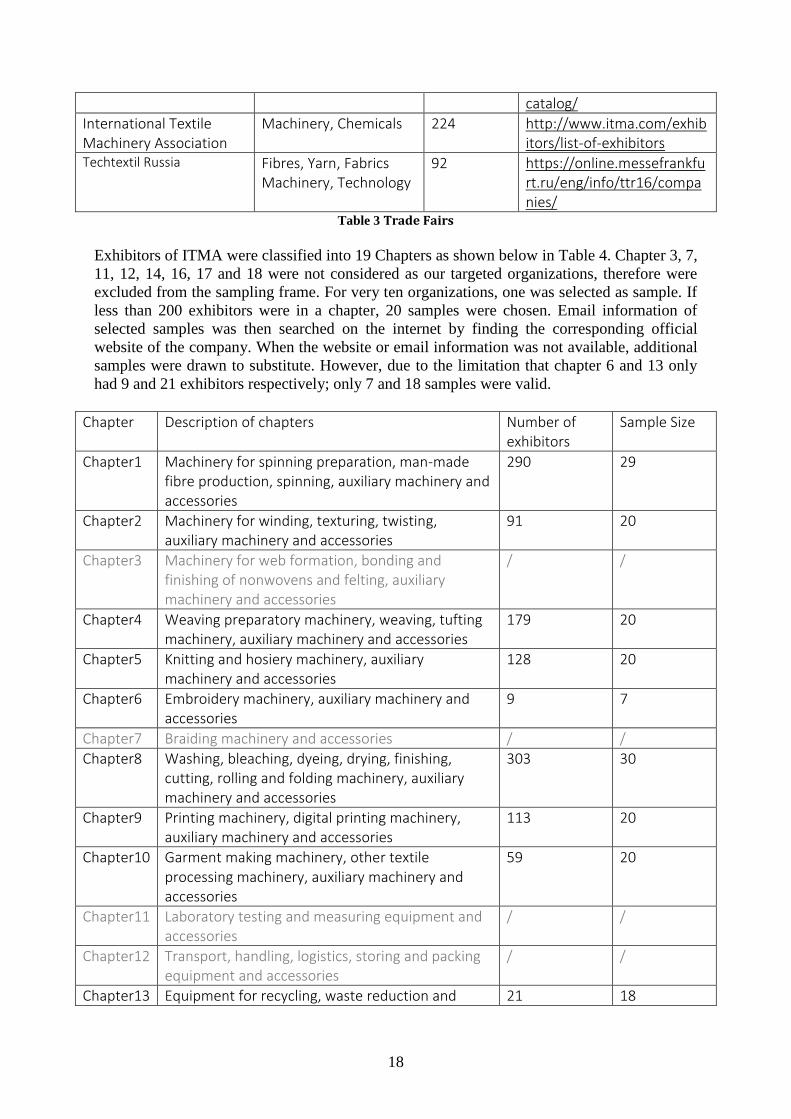
Exhibitors of ITMA were classified into 19 Chapters as shown below in Table 4. Chapter 3, 7,
11, 12, 14, 16, 17 and 18 were not considered as our targeted organizations, therefore were
excluded from the sampling frame. For very ten organizations, one was selected as sample. If
less than 200 exhibitors were in a chapter, 20 samples were chosen. Email information of
selected samples was then searched on the internet by finding the corresponding official
website of the company. When the website or email information was not available, additional
samples were drawn to substitute. However, due to the limitation that chapter 6 and 13 only
had 9 and 21 exhibitors respectively; only 7 and 18 samples were valid.
Chapter Description of chapters Number of exhibitors
Sample Size
Chapter1 Machinery for spinning preparation, man-made fibre production, spinning, auxiliary machinery and accessories
290 29
Chapter2 Machinery for winding, texturing, twisting, auxiliary machinery and accessories
91 20
Chapter3 Machinery for web formation, bonding and finishing of nonwovens and felting, auxiliary machinery and accessories
/ /
Chapter4 Weaving preparatory machinery, weaving, tufting machinery, auxiliary machinery and accessories
179 20
Chapter5 Knitting and hosiery machinery, auxiliary machinery and accessories
128 20
Chapter6 Embroidery machinery, auxiliary machinery and accessories
9 7
Chapter7 Braiding machinery and accessories / /
Chapter8 Washing, bleaching, dyeing, drying, finishing, cutting, rolling and folding machinery, auxiliary machinery and accessories
303 30
Chapter9 Printing machinery, digital printing machinery, auxiliary machinery and accessories
113 20
Chapter10 Garment making machinery, other textile processing machinery, auxiliary machinery and accessories
59 20
Chapter11 Laboratory testing and measuring equipment and accessories
/ /
Chapter12 Transport, handling, logistics, storing and packing equipment and accessories
/ /
Chapter13 Equipment for recycling, waste reduction and 21 18
19
pollution prevention and accessories
Chapter14 Software for design, data monitoring, processing and integrated production
/ /
Chapter15 Colorants and chemical auxiliaries for the textile industry
101 20
Chapter16 Equipment and products to ensure machinery and plant operations
/ /
Chapter17 Services for the textile industry / /
Chapter18 Research and educational institutions / /
Chapter19 Natural fibres, man-made fibres, technical fibres, natural yarns, synthetic yarns, technical yarns and recycled fibres and yarns
60 20
Table 4 Classification in ITMA, 2015 (ITMA, 2015) (http://www.itma.com/exhibitors/sector-allocation-plan)
3.2.2 Interview
Invitation of online survey and interview was sent together in the same email. One sample
showed interest in taking part of the interview. An interview framework was sent to the
interviewee one day before the Skype interview took place.
3.2.3 Case study
Nike and H&M have been chosen because both are large, global companies that source from
different offshore suppliers and outsource production activities (Nike, Inc. 2013; H&M,
2013). For a global fast fashion company as H&M and a global sports company as Nike
sustainable business operations are not self-evident. However, both organizations have
developed CSR strategies over the years and published their own CSR reports.
3.3 Data analysis
3.3.1 Online survey
Three methods were adopted to map the results. The first method is to evaluate the overall
incentive of a company implementing GSCM. The second method served the purpose of
categorizing companies according to their organizational responses towards implementing
GSCM. The third method paired up similar factors in order to identify factors that serve as
both barrier and enabler.
3.3.1.1 Evaluating overall incentives towards implementing GSCM
Based on the questionnaire a method to evaluate the perceived incentives of implementing
GSCM has been developed. A simple calculation categorizes the company's answers into five
levels showing the advantages or disadvantages of applying GSCM. The survey is evaluated
by analyzing each company's answers. In order to find out what each company’s potential to
apply green practices is the results are analyzed per participant; not per question.
20
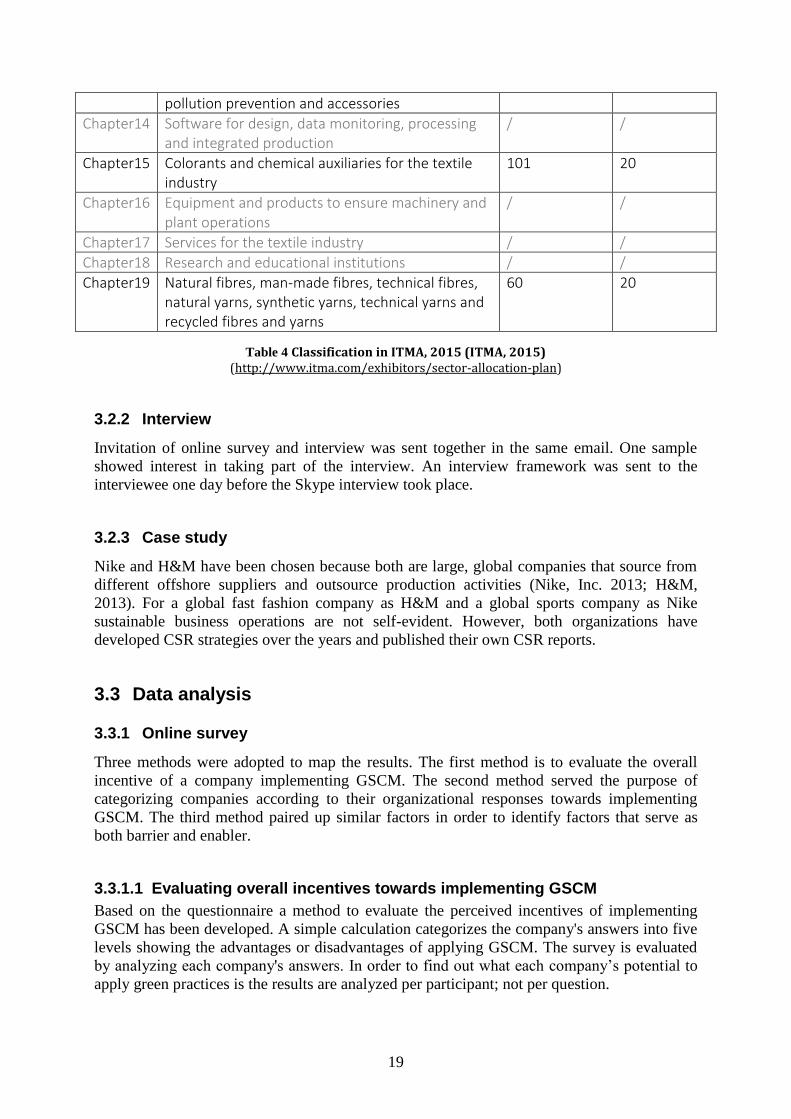
The survey questionnaire is structured into internal barriers, internal enablers and external
barriers and enablers with each a different number of Likert scale questions. The Likert scale
questions range from 1 (“Not at all“) to 7 (“Very strongly“). In the calculation, a question
answered with 1 gets the value -3, a question answered with 2 gets the value -2 and so on,
until value 3, for a question answered with 7 (see Table 5).
Likert scale answer from 1-7 Number value for calculation
1 -3
2 -2
3 -1
4 0
5 1
6 2
7 3
Table 5 Survey answers and values for calculation
The following equations are used to calculate the level of perceived incentives of applying
GSCM for the companies that took part in the survey. The result is categorized into five
levels, as shown in Figure 6.
1. Total intensity of perception from the External Enablers factors = ∑EE/6
2. Total intensity of perception from the External Barriers factors = ∑EB/7
3. Total intensity of perception from the Internal Enablers factors = ∑IE/10
4. Total intensity of perception from the Internal Barriers factors = ∑IB/7
5. External incentive = (∑EE/6 -∑EB/7) 6. Internal incentive = (∑IE/10-∑IB/7)
7. Overall incentive = [(∑EE/6 -∑EB/7) + (∑IE/10-∑IB/7)]/2
- EE (External Enablers) section: 6 questions
- EB (External Barriers) section: 7 questions
- IE (Internal Enablers) section: 10 questions
- IB (Internal Barriers) section: 7 questions
The values for each section (internal enablers, internal barriers, external enablers, and external
barriers) are summed up and then divided by the number of questions in this section. If all
questions in a section receive an answer of “not at all” that would result in a minimum value
of -3, (-3*X/X=-3), where X represents number of questions in a section. After this
calculation there are four values; one for each section. (Equation 1-4) The value for external
enablers is then subtracted the value of external barriers (Equation 5) and the value of internal
enablers is subtracted the value of internal barriers (Equation 6); resulting in two numbers for
each company; one for the external data and one for the internal data. Finally, total incentive
(Equation 7) of a company is calculated by summing external incentive (Equation 5) and
internal incentive (Equation 6).
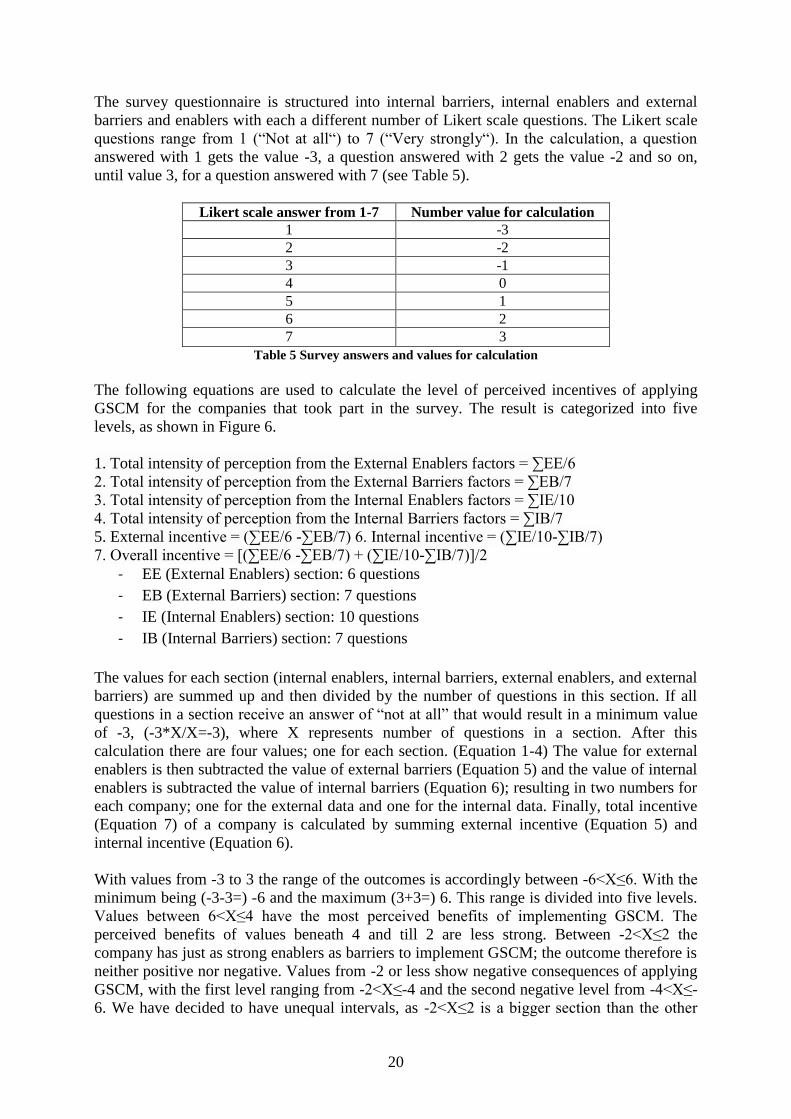
With values from -3 to 3 the range of the outcomes is accordingly between -6<X≤6. With the
minimum being (-3-3=) -6 and the maximum (3+3=) 6. This range is divided into five levels.
Values between 6<X≤4 have the most perceived benefits of implementing GSCM. The
perceived benefits of values beneath 4 and till 2 are less strong. Between -2<X≤2 the
company has just as strong enablers as barriers to implement GSCM; the outcome therefore is
neither positive nor negative. Values from -2 or less show negative consequences of applying
GSCM, with the first level ranging from -2<X≤-4 and the second negative level from -4<X≤-
6. We have decided to have unequal intervals, as -2<X≤2 is a bigger section than the other
21
four because we find that a company with values between -2<X≤2 faces neither significant
incentives nor obstacles to implement GSCM.
A company that has the impression that the barriers affect them just as much or little as the
enablers will consequently have similar values on enablers and barriers. The subtraction is
therefore likely to be in the neutral level between -2<X≤2. A company that perceives the
enablers to be especially strong and the barriers to be weak will probably be categorized in
one of the first two levels, while a company that rated the barriers stronger than the enablers is
likely to end up in the lowest sections (see Figure 6).
Figure 6 GSCM incentive score (level of perceived incentives of applying GSCM)
The results show how textile companies are affected by sustainability issues and indicate how
sustainable the textile industry currently is and how likely it is that the sector will become
more environmentally friendly in the near future. Moreover, the points that are identified as
strong barriers by many companies show what needs to be changed in order for the industry to
be more sustainable.
3.3.1.2 Categorizing companies according to organizational response
A second way of mapping the results, as shown in Fehler! Verweisquelle konnte nicht
gefunden werden. is to categorize the company’s GSCM incentive score into four categories:
Agenda setters, External responders, Internal focusers and Reserved players.
22
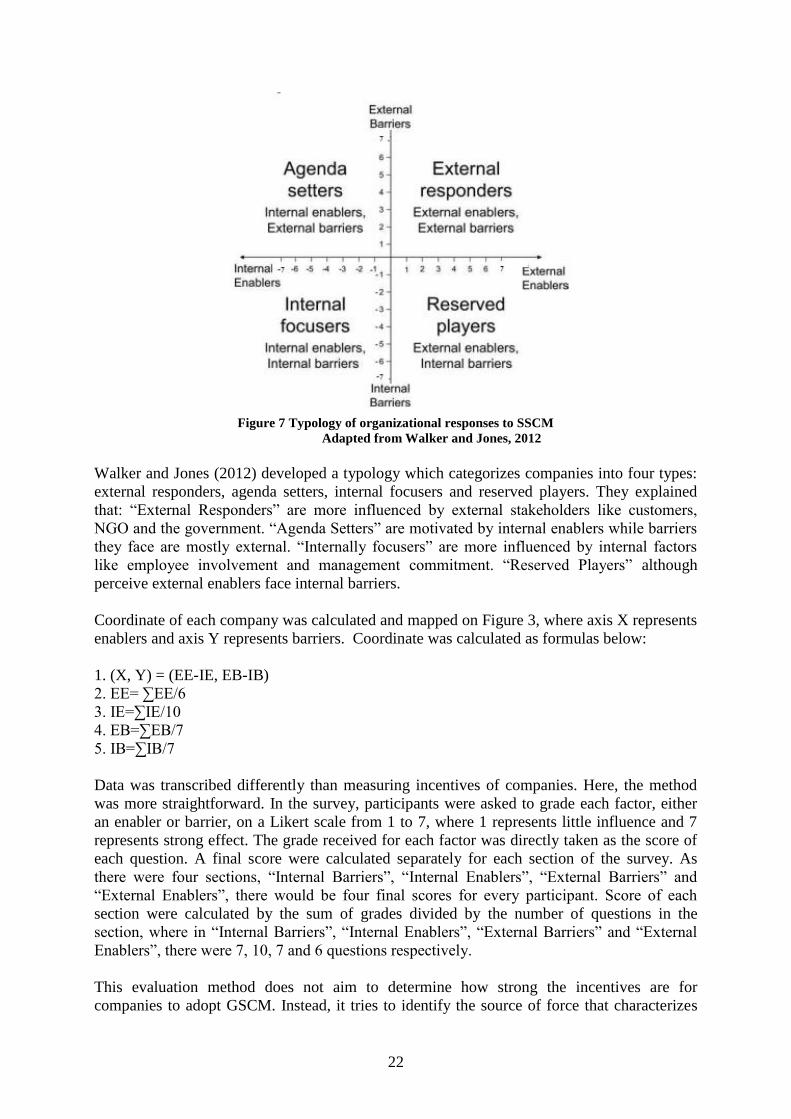
Figure 7 Typology of organizational responses to SSCM
Adapted from Walker and Jones, 2012
Walker and Jones (2012) developed a typology which categorizes companies into four types:
external responders, agenda setters, internal focusers and reserved players. They explained
that: “External Responders” are more influenced by external stakeholders like customers,
NGO and the government. “Agenda Setters” are motivated by internal enablers while barriers
they face are mostly external. “Internally focusers” are more influenced by internal factors
like employee involvement and management commitment. “Reserved Players” although
perceive external enablers face internal barriers.
Coordinate of each company was calculated and mapped on Figure 3, where axis X represents
enablers and axis Y represents barriers. Coordinate was calculated as formulas below:
1. (X, Y) = (EE-IE, EB-IB)
2. EE= ∑EE/6
3. IE=∑IE/10
4. EB=∑EB/7
5. IB=∑IB/7
Data was transcribed differently than measuring incentives of companies. Here, the method
was more straightforward. In the survey, participants were asked to grade each factor, either
an enabler or barrier, on a Likert scale from 1 to 7, where 1 represents little influence and 7
represents strong effect. The grade received for each factor was directly taken as the score of
each question. A final score were calculated separately for each section of the survey. As
there were four sections, “Internal Barriers”, “Internal Enablers”, “External Barriers” and
“External Enablers”, there would be four final scores for every participant. Score of each
section were calculated by the sum of grades divided by the number of questions in the
section, where in “Internal Barriers”, “Internal Enablers”, “External Barriers” and “External
Enablers”, there were 7, 10, 7 and 6 questions respectively.
This evaluation method does not aim to determine how strong the incentives are for
companies to adopt GSCM. Instead, it tries to identify the source of force that characterizes
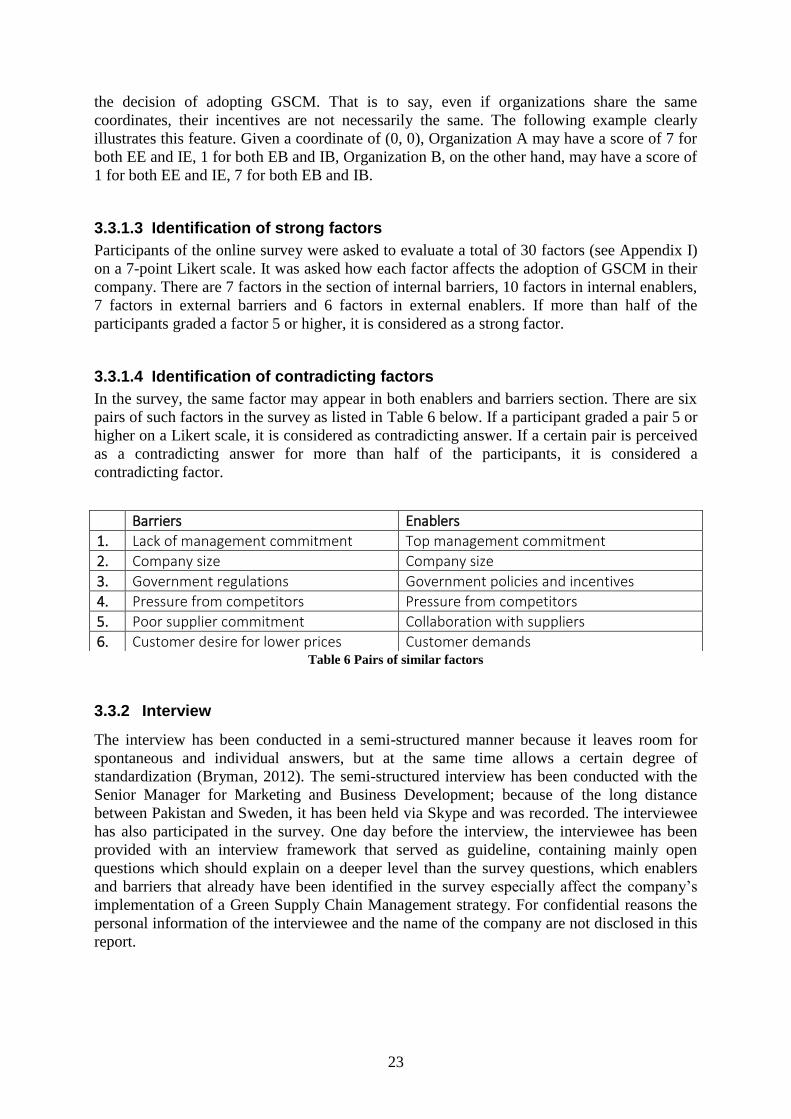
23
the decision of adopting GSCM. That is to say, even if organizations share the same
coordinates, their incentives are not necessarily the same. The following example clearly
illustrates this feature. Given a coordinate of (0, 0), Organization A may have a score of 7 for
both EE and IE, 1 for both EB and IB, Organization B, on the other hand, may have a score of
1 for both EE and IE, 7 for both EB and IB.
3.3.1.3 Identification of strong factors
Participants of the online survey were asked to evaluate a total of 30 factors (see Appendix I)
on a 7-point Likert scale. It was asked how each factor affects the adoption of GSCM in their
company. There are 7 factors in the section of internal barriers, 10 factors in internal enablers,
7 factors in external barriers and 6 factors in external enablers. If more than half of the
participants graded a factor 5 or higher, it is considered as a strong factor.
3.3.1.4 Identification of contradicting factors
In the survey, the same factor may appear in both enablers and barriers section. There are six
pairs of such factors in the survey as listed in Table 6 below. If a participant graded a pair 5 or
higher on a Likert scale, it is considered as contradicting answer. If a certain pair is perceived
as a contradicting answer for more than half of the participants, it is considered a
contradicting factor.
Table 6 Pairs of similar factors
3.3.2 Interview
The interview has been conducted in a semi-structured manner because it leaves room for
spontaneous and individual answers, but at the same time allows a certain degree of
standardization (Bryman, 2012). The semi-structured interview has been conducted with the
Senior Manager for Marketing and Business Development; because of the long distance
between Pakistan and Sweden, it has been held via Skype and was recorded. The interviewee
has also participated in the survey. One day before the interview, the interviewee has been
provided with an interview framework that served as guideline, containing mainly open
questions which should explain on a deeper level than the survey questions, which enablers
and barriers that already have been identified in the survey especially affect the company’s
implementation of a Green Supply Chain Management strategy. For confidential reasons the
personal information of the interviewee and the name of the company are not disclosed in this
report.
Barriers Enablers
1. Lack of management commitment Top management commitment
2. Company size Company size
3. Government regulations Government policies and incentives
4. Pressure from competitors Pressure from competitors
5. Poor supplier commitment Collaboration with suppliers
6. Customer desire for lower prices Customer demands
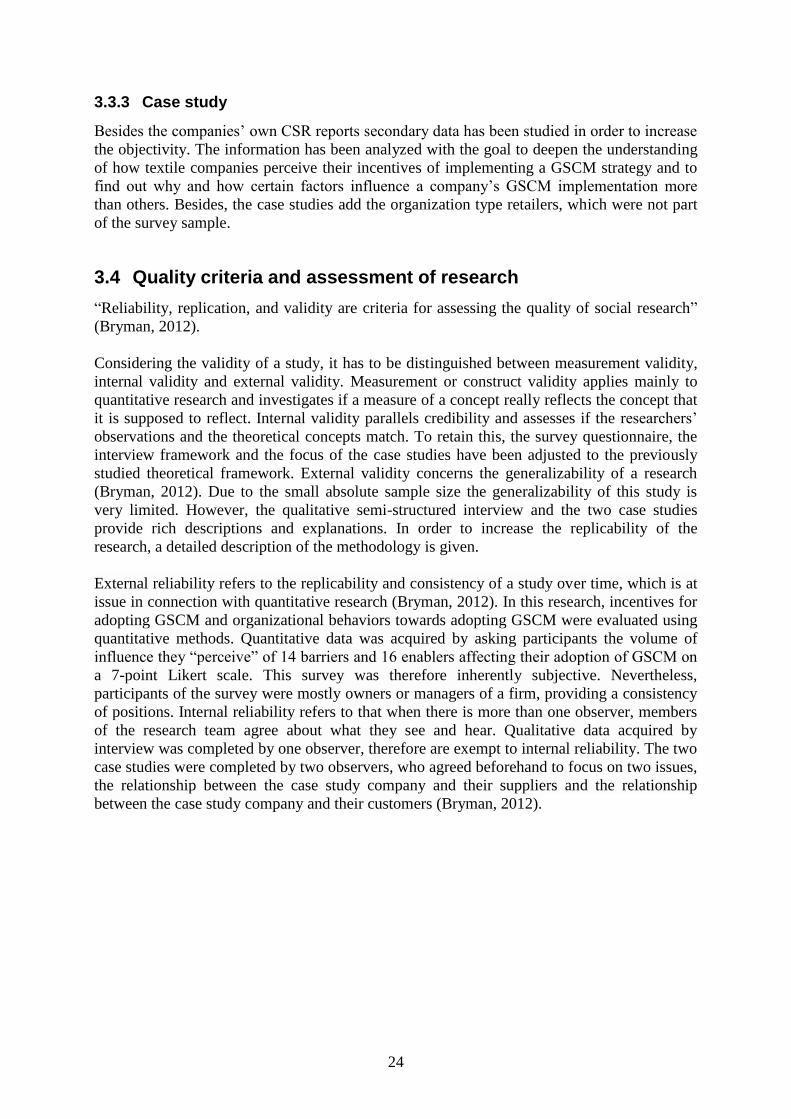
24
3.3.3 Case study
Besides the companies’ own CSR reports secondary data has been studied in order to increase
the objectivity. The information has been analyzed with the goal to deepen the understanding
of how textile companies perceive their incentives of implementing a GSCM strategy and to
find out why and how certain factors influence a company’s GSCM implementation more
than others. Besides, the case studies add the organization type retailers, which were not part
of the survey sample.
3.4 Quality criteria and assessment of research
“Reliability, replication, and validity are criteria for assessing the quality of social research”
(Bryman, 2012).
Considering the validity of a study, it has to be distinguished between measurement validity,
internal validity and external validity. Measurement or construct validity applies mainly to
quantitative research and investigates if a measure of a concept really reflects the concept that
it is supposed to reflect. Internal validity parallels credibility and assesses if the researchers’
observations and the theoretical concepts match. To retain this, the survey questionnaire, the
interview framework and the focus of the case studies have been adjusted to the previously
studied theoretical framework. External validity concerns the generalizability of a research
(Bryman, 2012). Due to the small absolute sample size the generalizability of this study is
very limited. However, the qualitative semi-structured interview and the two case studies
provide rich descriptions and explanations. In order to increase the replicability of the
research, a detailed description of the methodology is given.
External reliability refers to the replicability and consistency of a study over time, which is at
issue in connection with quantitative research (Bryman, 2012). In this research, incentives for
adopting GSCM and organizational behaviors towards adopting GSCM were evaluated using
quantitative methods. Quantitative data was acquired by asking participants the volume of
influence they “perceive” of 14 barriers and 16 enablers affecting their adoption of GSCM on
a 7-point Likert scale. This survey was therefore inherently subjective. Nevertheless,
participants of the survey were mostly owners or managers of a firm, providing a consistency
of positions. Internal reliability refers to that when there is more than one observer, members
of the research team agree about what they see and hear. Qualitative data acquired by
interview was completed by one observer, therefore are exempt to internal reliability. The two
case studies were completed by two observers, who agreed beforehand to focus on two issues,
the relationship between the case study company and their suppliers and the relationship
between the case study company and their customers (Bryman, 2012).
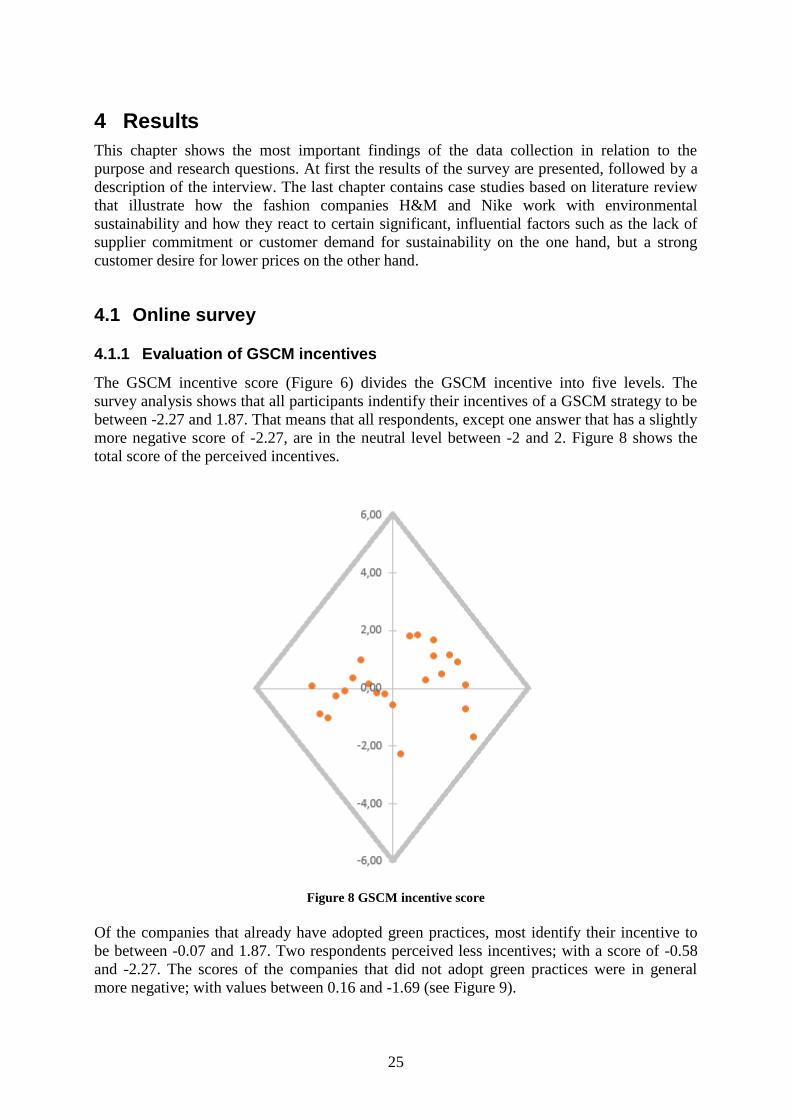
25
4 Results
This chapter shows the most important findings of the data collection in relation to the
purpose and research questions. At first the results of the survey are presented, followed by a
description of the interview. The last chapter contains case studies based on literature review
that illustrate how the fashion companies H&M and Nike work with environmental
sustainability and how they react to certain significant, influential factors such as the lack of
supplier commitment or customer demand for sustainability on the one hand, but a strong
customer desire for lower prices on the other hand.
4.1 Online survey
4.1.1 Evaluation of GSCM incentives
The GSCM incentive score (Figure 6) divides the GSCM incentive into five levels. The
survey analysis shows that all participants indentify their incentives of a GSCM strategy to be
between -2.27 and 1.87. That means that all respondents, except one answer that has a slightly
more negative score of -2.27, are in the neutral level between -2 and 2. Figure 8 shows the
total score of the perceived incentives.
Figure 8 GSCM incentive score
Of the companies that already have adopted green practices, most identify their incentive to
be between -0.07 and 1.87. Two respondents perceived less incentives; with a score of -0.58
and -2.27. The scores of the companies that did not adopt green practices were in general
more negative; with values between 0.16 and -1.69 (see Figure 9).
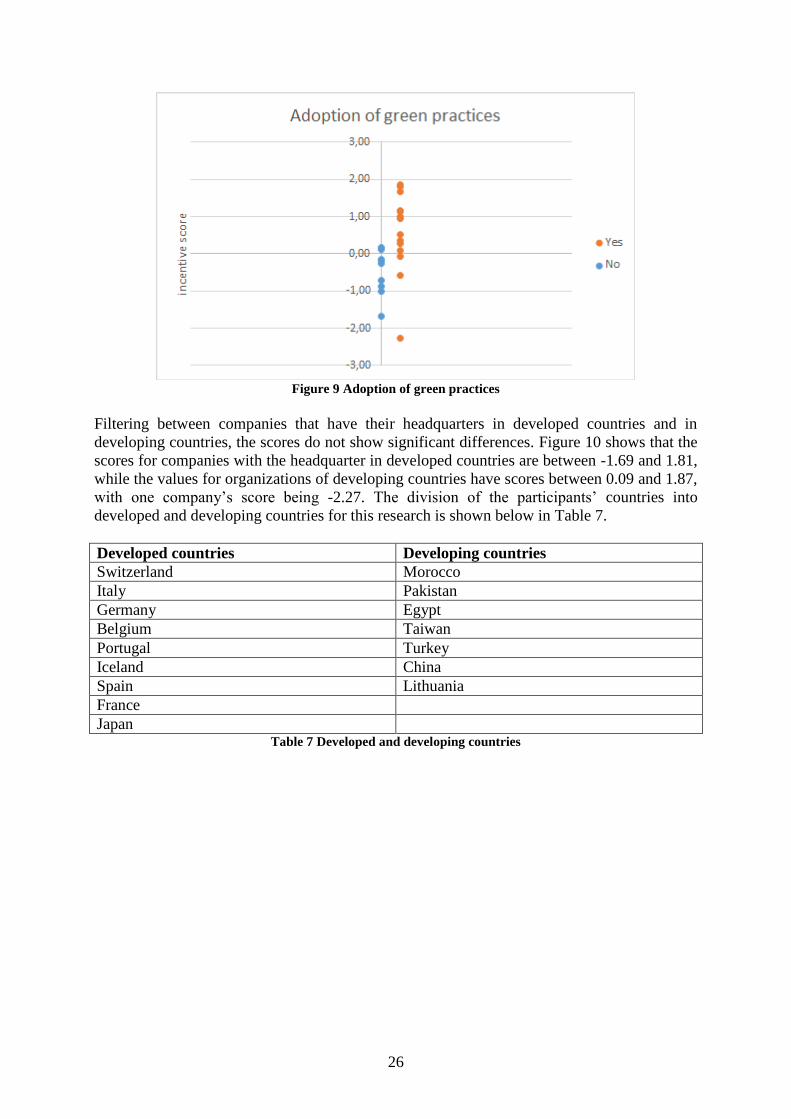
26
Figure 9 Adoption of green practices
Filtering between companies that have their headquarters in developed countries and in
developing countries, the scores do not show significant differences. Figure 10 shows that the
scores for companies with the headquarter in developed countries are between -1.69 and 1.81,
while the values for organizations of developing countries have scores between 0.09 and 1.87,
with one company’s score being -2.27. The division of the participants’ countries into
developed and developing countries for this research is shown below in Table 7.
Developed countries Developing countries
Switzerland Morocco
Italy Pakistan
Germany Egypt
Belgium Taiwan
Portugal Turkey
Iceland China
Spain Lithuania
France
Japan Table 7 Developed and developing countries
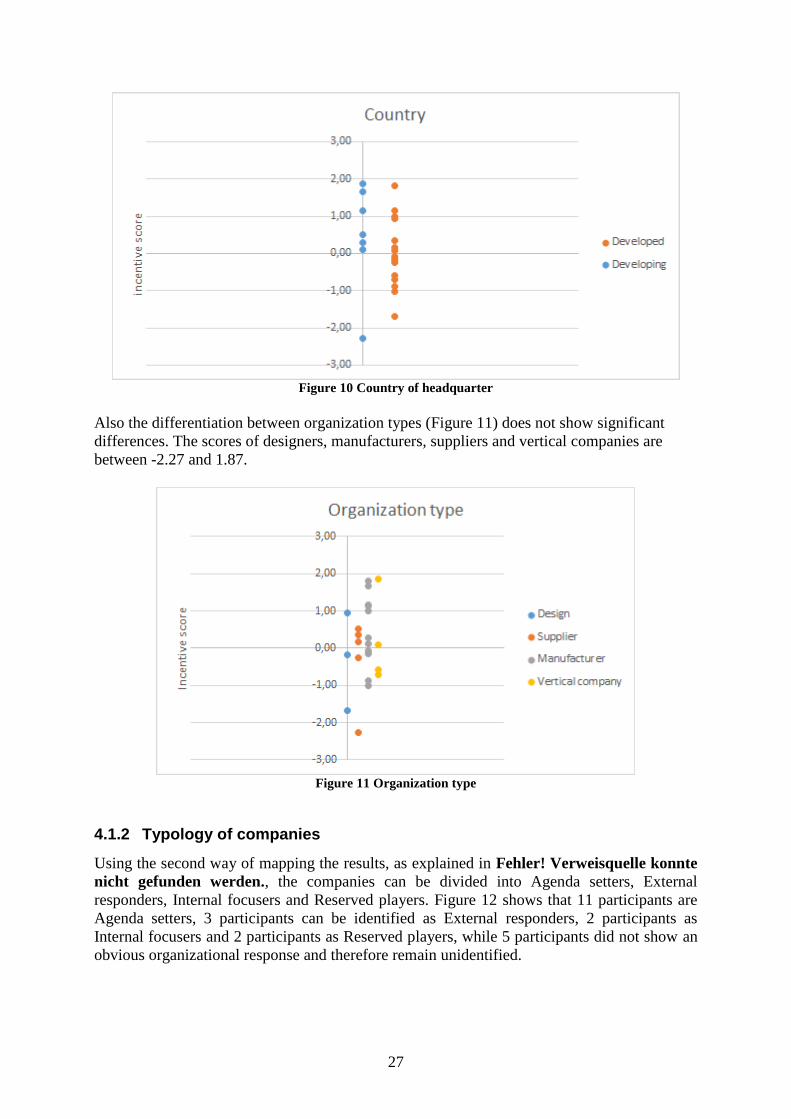
27
Figure 10 Country of headquarter
Also the differentiation between organization types (Figure 11) does not show significant
differences. The scores of designers, manufacturers, suppliers and vertical companies are
between -2.27 and 1.87.
Figure 11 Organization type
4.1.2 Typology of companies
Using the second way of mapping the results, as explained in Fehler! Verweisquelle konnte
nicht gefunden werden., the companies can be divided into Agenda setters, External
responders, Internal focusers and Reserved players. Figure 12 shows that 11 participants are
Agenda setters, 3 participants can be identified as External responders, 2 participants as
Internal focusers and 2 participants as Reserved players, while 5 participants did not show an
obvious organizational response and therefore remain unidentified.
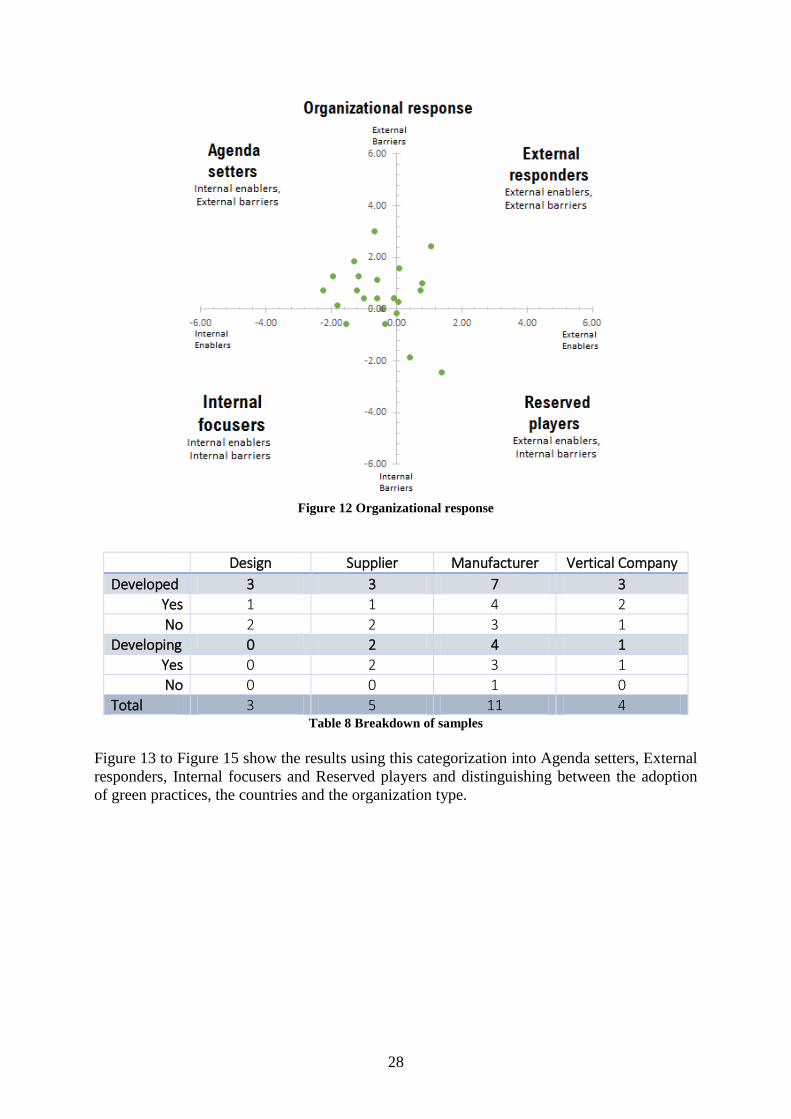
28
Figure 12 Organizational response
Design Supplier Manufacturer Vertical Company
Developed 3 3 7 3
Yes 1 1 4 2
No 2 2 3 1
Developing 0 2 4 1
Yes 0 2 3 1
No 0 0 1 0
Total 3 5 11 4 Table 8 Breakdown of samples
Figure 13 to Figure 15 show the results using this categorization into Agenda setters, External
responders, Internal focusers and Reserved players and distinguishing between the adoption
of green practices, the countries and the organization type.
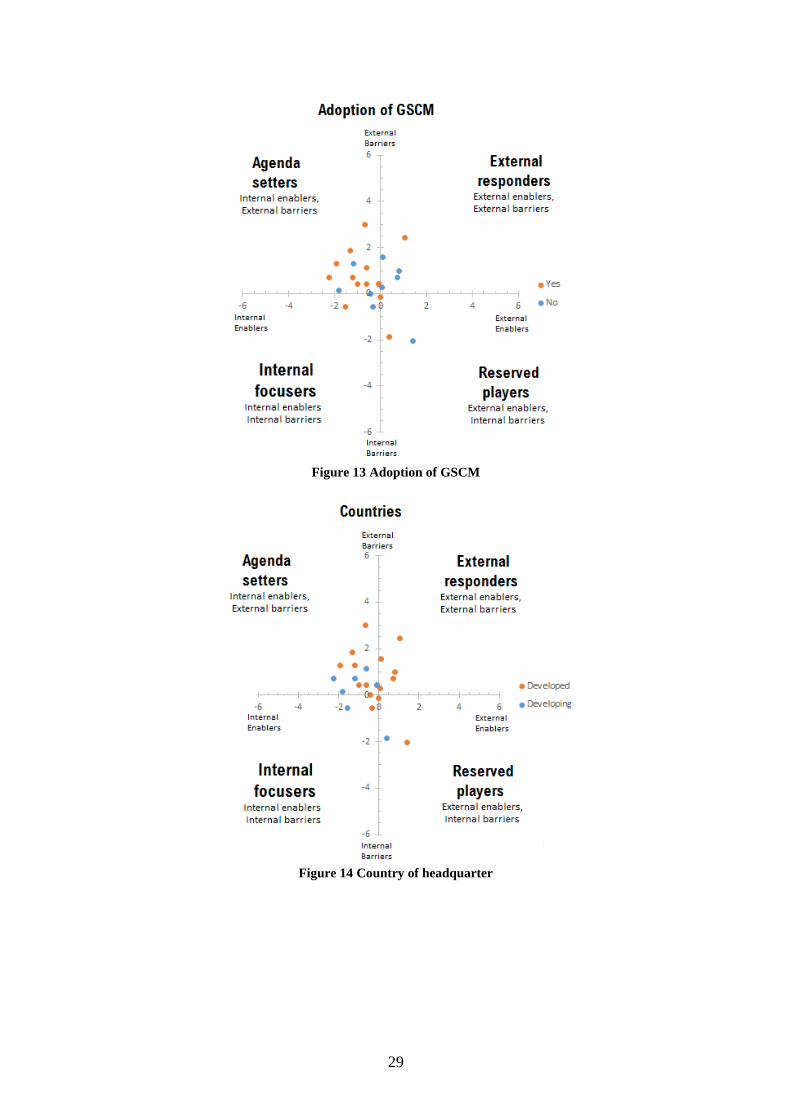
29
Figure 13 Adoption of GSCM
Figure 14 Country of headquarter
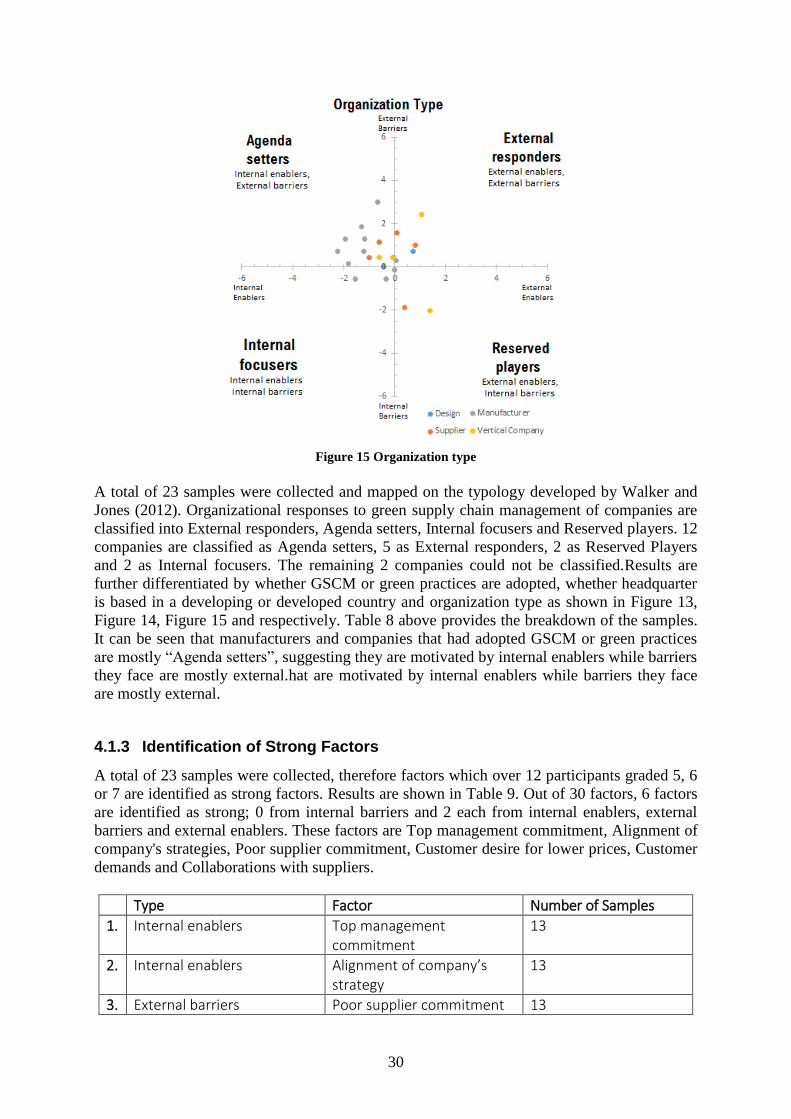
30
Figure 15 Organization type
A total of 23 samples were collected and mapped on the typology developed by Walker and
Jones (2012). Organizational responses to green supply chain management of companies are
classified into External responders, Agenda setters, Internal focusers and Reserved players. 12
companies are classified as Agenda setters, 5 as External responders, 2 as Reserved Players
and 2 as Internal focusers. The remaining 2 companies could not be classified.Results are
further differentiated by whether GSCM or green practices are adopted, whether headquarter
is based in a developing or developed country and organization type as shown in Figure 13,
Figure 14, Figure 15 and respectively. Table 8 above provides the breakdown of the samples.
It can be seen that manufacturers and companies that had adopted GSCM or green practices
are mostly “Agenda setters”, suggesting they are motivated by internal enablers while barriers
they face are mostly external.hat are motivated by internal enablers while barriers they face
are mostly external.
4.1.3 Identification of Strong Factors
A total of 23 samples were collected, therefore factors which over 12 participants graded 5, 6
or 7 are identified as strong factors. Results are shown in Table 9. Out of 30 factors, 6 factors
are identified as strong; 0 from internal barriers and 2 each from internal enablers, external
barriers and external enablers. These factors are Top management commitment, Alignment of
company's strategies, Poor supplier commitment, Customer desire for lower prices, Customer
demands and Collaborations with suppliers.
Type Factor Number of Samples
1. Internal enablers Top management commitment
13
2. Internal enablers Alignment of company’s strategy
13
3. External barriers Poor supplier commitment 13
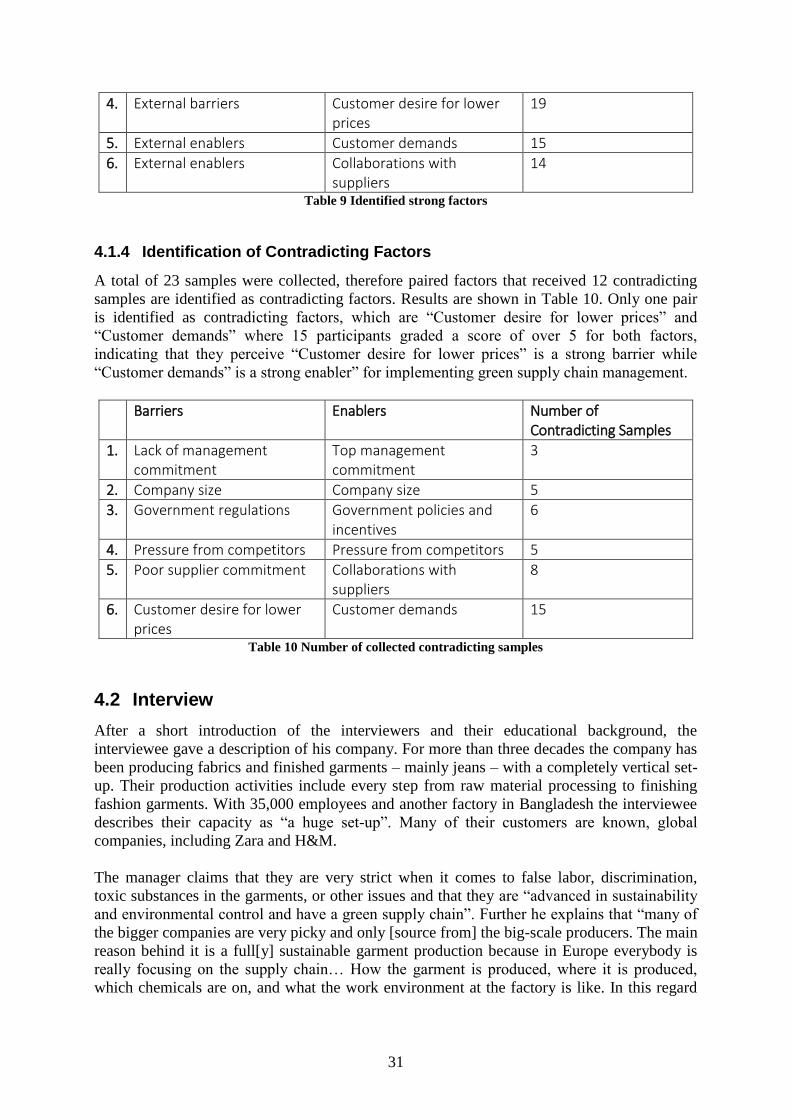
31
4. External barriers Customer desire for lower prices
19
5. External enablers Customer demands 15
6. External enablers Collaborations with suppliers
14
Table 9 Identified strong factors
4.1.4 Identification of Contradicting Factors
A total of 23 samples were collected, therefore paired factors that received 12 contradicting
samples are identified as contradicting factors. Results are shown in Table 10. Only one pair
is identified as contradicting factors, which are “Customer desire for lower prices” and
“Customer demands” where 15 participants graded a score of over 5 for both factors,
indicating that they perceive “Customer desire for lower prices” is a strong barrier while
“Customer demands” is a strong enabler” for implementing green supply chain management.
Barriers Enablers Number of Contradicting Samples
1. Lack of management commitment
Top management commitment
3
2. Company size Company size 5
3. Government regulations Government policies and incentives
6
4. Pressure from competitors Pressure from competitors 5
5. Poor supplier commitment Collaborations with suppliers
8
6. Customer desire for lower prices
Customer demands 15
Table 10 Number of collected contradicting samples
4.2 Interview
After a short introduction of the interviewers and their educational background, the
interviewee gave a description of his company. For more than three decades the company has
been producing fabrics and finished garments – mainly jeans – with a completely vertical set-
up. Their production activities include every step from raw material processing to finishing
fashion garments. With 35,000 employees and another factory in Bangladesh the interviewee
describes their capacity as “a huge set-up”. Many of their customers are known, global
companies, including Zara and H&M.
The manager claims that they are very strict when it comes to false labor, discrimination,
toxic substances in the garments, or other issues and that they are “advanced in sustainability
and environmental control and have a green supply chain”. Further he explains that “many of
the bigger companies are very picky and only [source from] the big-scale producers. The main
reason behind it is a full[y] sustainable garment production because in Europe everybody is
really focusing on the supply chain… How the garment is produced, where it is produced,
which chemicals are on, and what the work environment at the factory is like. In this regard
32
[…] we have social orders from customers and independent bodies [such as] BVQI1, SGS
2,
Intertek3 and other NGOs such as Greenpeace”. That is why the interviewee, as head of the
marketing team at his company, has to make sure that the garments fulfill the ethical and
environmental requirements. Having a sustainable supply chain means that every part, starting
from the raw materials, needs to be sustainable and meet the demands of a sustainable
production. For instance, it must be ensured that their suppliers for the indigo dyes have a
sustainable supply chain as well. He explains that even though dyeing jeans with indigo dyes
has a strong, negative impact on the environment, there are no laws for the waste disposal in
Pakistan and at some companies the waste would just go into the sea without any processing
and harm the sea life. At his company however, they make sure that they get the indigo dyes
from well-known, reliable chemical suppliers, some of them are located in Italy and Turkey.
The chemicals that the suppliers use must be according to the standards. Moreover, the
company has a waste water treatment plant that cleans the water before it goes into the drain.
After this treatment the water is not drinkable, but clean enough for fish to survive in it.
Intertek’s REACH certificate program concerns the EU REACH Regulation (Registration,
Evaluation and Authorization of Chemical Substances – EC1907/2006) and requires that all
chemicals that are in contact with the garments are non-toxic and non-hazardous (Intertek
Group plc).
A green supply chain goes that far in detail that the company needs to ensure that the
suppliers of the zippers dyed the polyester fabric for the zippers without non-toxic chemicals.
Another environmental effort concerns not the garments itself, but the factories. The company
has installed LED lights and water-saving toilets in order to reduce the ecological footprint as
much as possible. Normally, many of the company’s goods from suppliers (for example raw
materials and zippers) are coming by air, but in order to decrease air pollution and reduce
waste, the company tells their suppliers to use fewer cartons and send the goods in one
shipment rather than in two, if possible.
The interviewee explains that his company has a separate department for sustainability issues.
The Social Compliance Department is split into three groups: one group is taking care of the
certificates; one group is responsible for the ethical production and another for the sustainable
(environmental) production.
The strongest internal barrier for the organization is the low level of education many of the
employees in Pakistan have. They receive some training before they start working for the
company and the company also needs to explain them the concept of sustainability and the
sustainability-related things they need to take care of. The biggest challenge the company
faces external is the lack of supplier commitment. Many of their suppliers are much smaller
than them and it can be hard for them to follow the strict environmental regulations. However,
if one supplier does not fulfill all the requirements, the company cannot meet their customers’
demands either. This dilemma puts much pressure on the company. The reason this company
is engaged in green practices is on the one hand the Muslim religion, which make them care
about their environment and on the other hand the pressure from the buyer side. Although
daily communication with the suppliers is not necessary, the company makes random check-
ins to ensure that they meet the requirements. Those check-ins are the best way to measure
performance (of the suppliers) in the eyes of the manager.
1 Bureau Veritas Certification Pakistan (Formerly BVQI) performs Commercial inspections on behalf of
producers, manufacturers, traders, financial institutions and other private clients (Bureau Veritas) 2 SGS is the world's leading inspection, verification, testing and certification company (SGS SA, 2016)
3 Intertek is a worldwide textile testing institution (Intertek Group plc)
33
The green supply chain requires high investments. There is usually no Return on Investment
on these investments since they are fixed costs. The only return is that the company can get
good customers. Since there are no strict environmental regulations for the textile industry in
Pakistan, the interviewee was not able to describe a government policy that encourages
Pakistani companies to implement GSCM. Another significant problem to establish green
practices in the (Pakistani) textile industry is the unwillingness to change. The interviewee
explains that many people who have been working in the textile industry for many years do
not want to accept the change and act more environmentally friendly.
4.3 Case studies
The following part describes the sustainability efforts of the two global fashion companies
H&M and Nike. The case studies contribute together with the survey and the interviews to a
better understanding of how textile and fashion companies handle environmental issues; what
encourages them and what obstacles they face.
As mentioned earlier customer demand for lower prices has been identified as a strong
external barrier by many participants, but on the other hand consumer demand for
sustainability has been regarded as important external enabler. The fact that some participants
perceived both factors concurrently seems contradictive. Collaboration with suppliers is
enabling for many companies and a lack of supplier commitment has been perceived as one of
the strongest barriers by some respondents. Therefore, the case studies particularly focus on
the companies’ relationships with customers and suppliers.
4.3.1 H&M
The following case study was based upon H&M’s 14 sustainability reports available for
download on their official website, covering from 2002 to 2015. In 1998 H&M started
monitoring their first-tier suppliers, whom they have direct relations with. Throughout the
years, H&M has expanded the scope to fabric suppliers and cotton growers. In recent years,
sustainability efforts focuses on increasing coverage of current scope and expand their scope
once more, aiming at closing the loop of their supply chain.
4.3.1.1 Strategies and sustainability
In 2014, CEO of H&M mentioned in an interview that: “Good sustainability work will require
big investments. We will have to be prepared to sacrifice short-term profits for long-term
success.” In H&M, efforts on sustainability are project based. Most projects that are in place
today, can trace its origin back to 2002. The Mill Development Programme which by 2015
covers fabric and yarn mills producing 51% of H&M’s products, started off as a project called
Supplier Environmental Motivation Strategy (SEMS) with only four vertical mills
participated. H&M’s first use of organic cotton was in 2004, mixing 5% of organic cotton in
one style which only contains 5 tonnes of organic cotton in total. In 2015, 14.3% of the cotton
consumed by H&M came from organic cotton. In 2011, H&M introduced Joint Audit
Assessment Programme (JAP) in China in collaboration with 20 factories which they aim to
apply this program to all their strategic suppliers with an advanced in-house sustainability
organization. All these examples show that H&M conducts trial runs in a small scale before
entering the next phase which is implementing projects in a larger scope and scale.
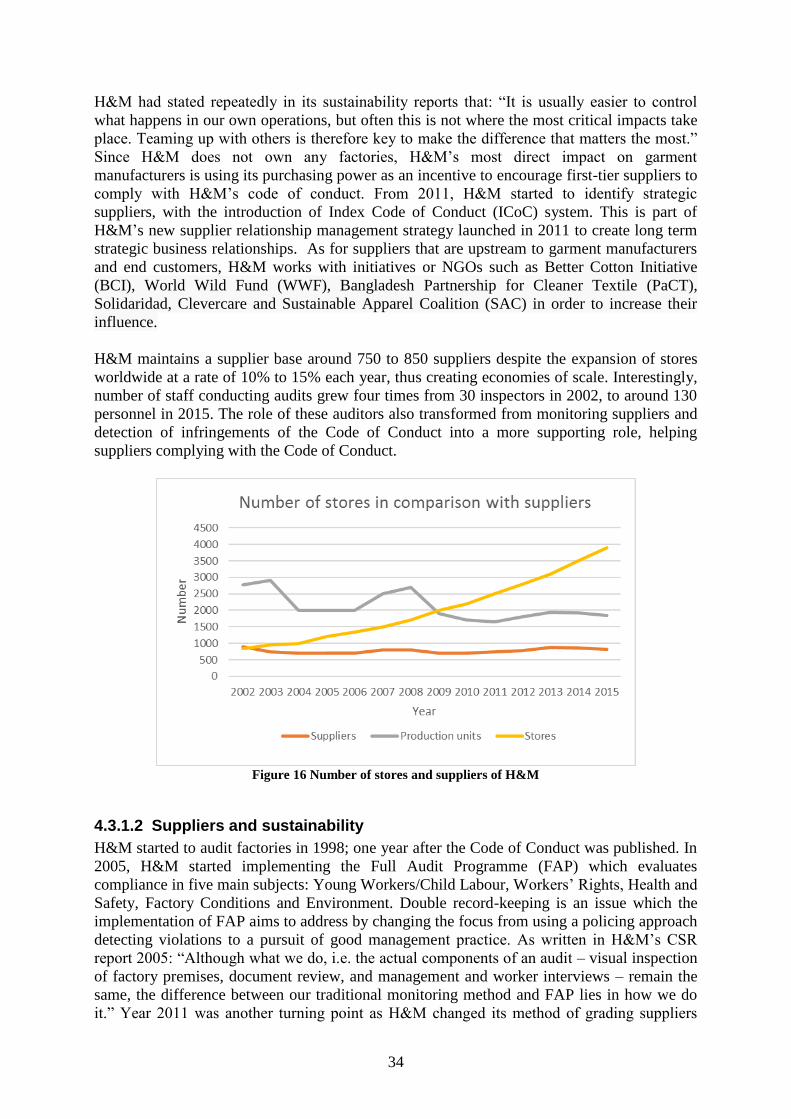
34
H&M had stated repeatedly in its sustainability reports that: “It is usually easier to control
what happens in our own operations, but often this is not where the most critical impacts take
place. Teaming up with others is therefore key to make the difference that matters the most.”
Since H&M does not own any factories, H&M’s most direct impact on garment
manufacturers is using its purchasing power as an incentive to encourage first-tier suppliers to
comply with H&M’s code of conduct. From 2011, H&M started to identify strategic
suppliers, with the introduction of Index Code of Conduct (ICoC) system. This is part of
H&M’s new supplier relationship management strategy launched in 2011 to create long term
strategic business relationships. As for suppliers that are upstream to garment manufacturers
and end customers, H&M works with initiatives or NGOs such as Better Cotton Initiative
(BCI), World Wild Fund (WWF), Bangladesh Partnership for Cleaner Textile (PaCT),
Solidaridad, Clevercare and Sustainable Apparel Coalition (SAC) in order to increase their
influence.
H&M maintains a supplier base around 750 to 850 suppliers despite the expansion of stores
worldwide at a rate of 10% to 15% each year, thus creating economies of scale. Interestingly,
number of staff conducting audits grew four times from 30 inspectors in 2002, to around 130
personnel in 2015. The role of these auditors also transformed from monitoring suppliers and
detection of infringements of the Code of Conduct into a more supporting role, helping
suppliers complying with the Code of Conduct.
Figure 16 Number of stores and suppliers of H&M
4.3.1.2 Suppliers and sustainability
H&M started to audit factories in 1998; one year after the Code of Conduct was published. In
2005, H&M started implementing the Full Audit Programme (FAP) which evaluates
compliance in five main subjects: Young Workers/Child Labour, Workers’ Rights, Health and
Safety, Factory Conditions and Environment. Double record-keeping is an issue which the
implementation of FAP aims to address by changing the focus from using a policing approach
detecting violations to a pursuit of good management practice. As written in H&M’s CSR
report 2005: “Although what we do, i.e. the actual components of an audit – visual inspection
of factory premises, document review, and management and worker interviews – remain the
same, the difference between our traditional monitoring method and FAP lies in how we do
it.” Year 2011 was another turning point as H&M changed its method of grading suppliers
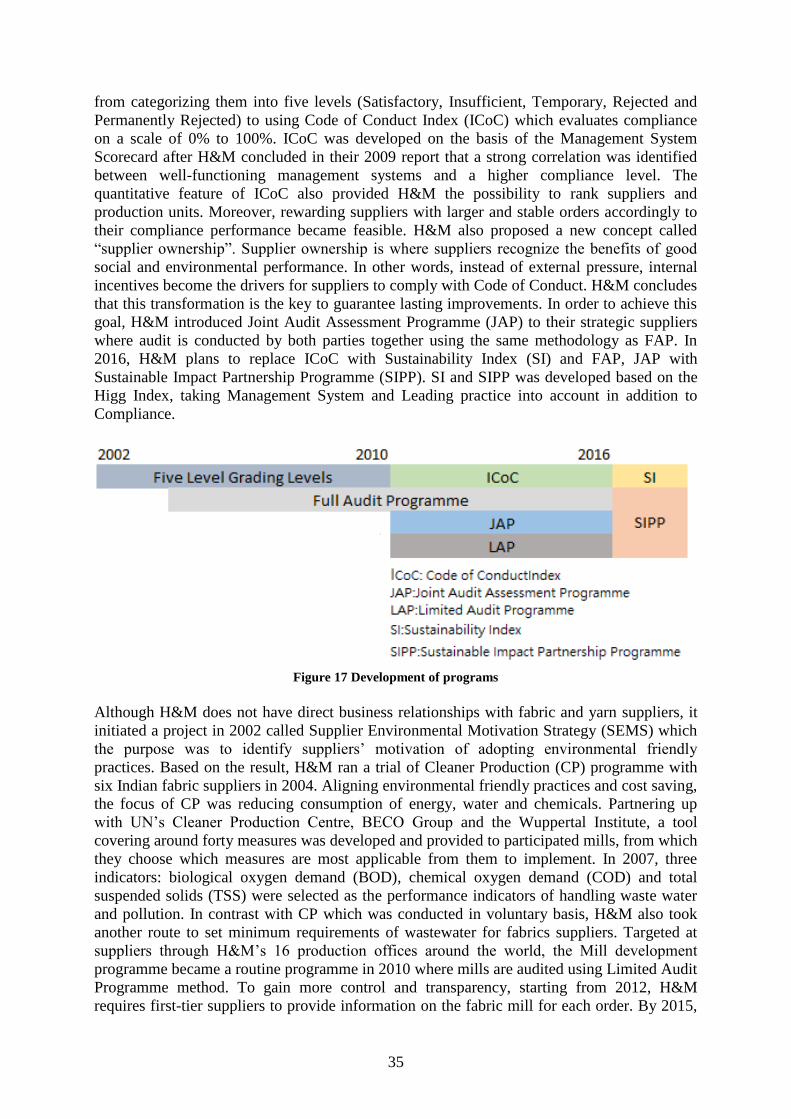
35
from categorizing them into five levels (Satisfactory, Insufficient, Temporary, Rejected and
Permanently Rejected) to using Code of Conduct Index (ICoC) which evaluates compliance
on a scale of 0% to 100%. ICoC was developed on the basis of the Management System
Scorecard after H&M concluded in their 2009 report that a strong correlation was identified
between well-functioning management systems and a higher compliance level. The
quantitative feature of ICoC also provided H&M the possibility to rank suppliers and
production units. Moreover, rewarding suppliers with larger and stable orders accordingly to
their compliance performance became feasible. H&M also proposed a new concept called
“supplier ownership”. Supplier ownership is where suppliers recognize the benefits of good
social and environmental performance. In other words, instead of external pressure, internal
incentives become the drivers for suppliers to comply with Code of Conduct. H&M concludes
that this transformation is the key to guarantee lasting improvements. In order to achieve this
goal, H&M introduced Joint Audit Assessment Programme (JAP) to their strategic suppliers
where audit is conducted by both parties together using the same methodology as FAP. In
2016, H&M plans to replace ICoC with Sustainability Index (SI) and FAP, JAP with
Sustainable Impact Partnership Programme (SIPP). SI and SIPP was developed based on the
Higg Index, taking Management System and Leading practice into account in addition to
Compliance.
Figure 17 Development of programs
Although H&M does not have direct business relationships with fabric and yarn suppliers, it
initiated a project in 2002 called Supplier Environmental Motivation Strategy (SEMS) which
the purpose was to identify suppliers’ motivation of adopting environmental friendly
practices. Based on the result, H&M ran a trial of Cleaner Production (CP) programme with
six Indian fabric suppliers in 2004. Aligning environmental friendly practices and cost saving,
the focus of CP was reducing consumption of energy, water and chemicals. Partnering up
with UN’s Cleaner Production Centre, BECO Group and the Wuppertal Institute, a tool
covering around forty measures was developed and provided to participated mills, from which
they choose which measures are most applicable from them to implement. In 2007, three
indicators: biological oxygen demand (BOD), chemical oxygen demand (COD) and total
suspended solids (TSS) were selected as the performance indicators of handling waste water
and pollution. In contrast with CP which was conducted in voluntary basis, H&M also took
another route to set minimum requirements of wastewater for fabrics suppliers. Targeted at
suppliers through H&M’s 16 production offices around the world, the Mill development
programme became a routine programme in 2010 where mills are audited using Limited Audit
Programme method. To gain more control and transparency, starting from 2012, H&M
requires first-tier suppliers to provide information on the fabric mill for each order. By 2015,
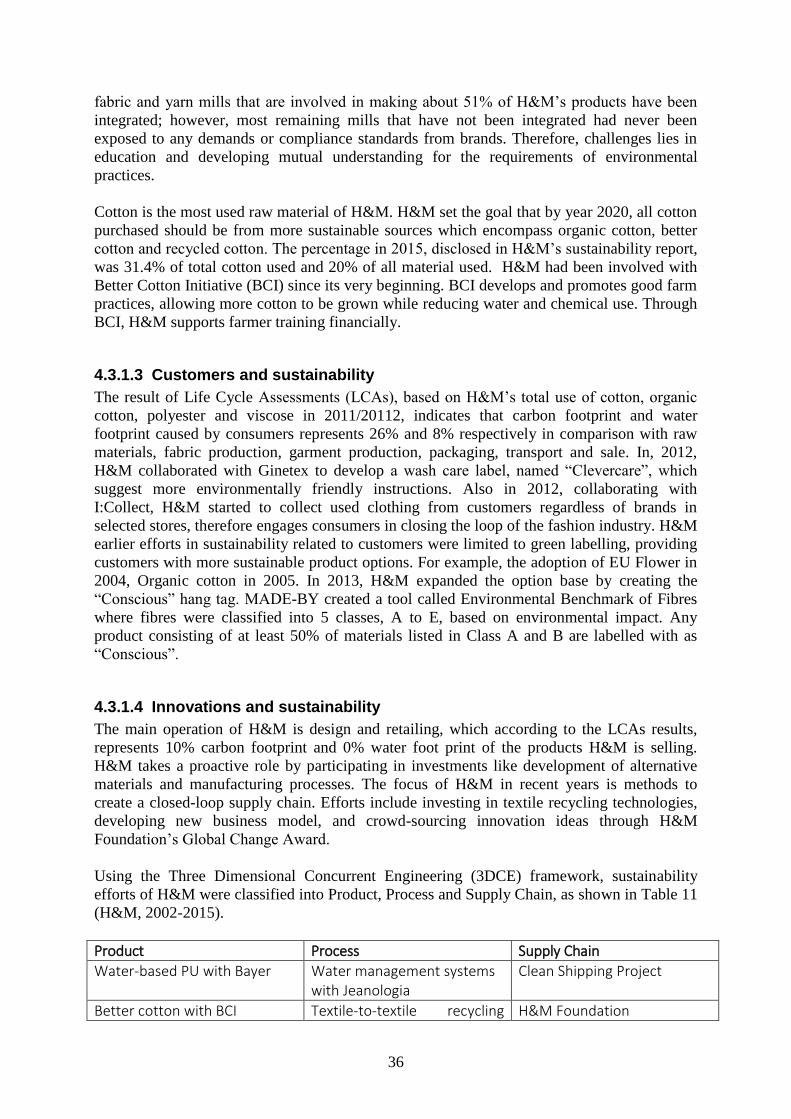
36
fabric and yarn mills that are involved in making about 51% of H&M’s products have been
integrated; however, most remaining mills that have not been integrated had never been
exposed to any demands or compliance standards from brands. Therefore, challenges lies in
education and developing mutual understanding for the requirements of environmental
practices.
Cotton is the most used raw material of H&M. H&M set the goal that by year 2020, all cotton
purchased should be from more sustainable sources which encompass organic cotton, better
cotton and recycled cotton. The percentage in 2015, disclosed in H&M’s sustainability report,
was 31.4% of total cotton used and 20% of all material used. H&M had been involved with
Better Cotton Initiative (BCI) since its very beginning. BCI develops and promotes good farm
practices, allowing more cotton to be grown while reducing water and chemical use. Through
BCI, H&M supports farmer training financially.
4.3.1.3 Customers and sustainability
The result of Life Cycle Assessments (LCAs), based on H&M’s total use of cotton, organic
cotton, polyester and viscose in 2011/20112, indicates that carbon footprint and water
footprint caused by consumers represents 26% and 8% respectively in comparison with raw
materials, fabric production, garment production, packaging, transport and sale. In, 2012,
H&M collaborated with Ginetex to develop a wash care label, named “Clevercare”, which
suggest more environmentally friendly instructions. Also in 2012, collaborating with
I:Collect, H&M started to collect used clothing from customers regardless of brands in
selected stores, therefore engages consumers in closing the loop of the fashion industry. H&M
earlier efforts in sustainability related to customers were limited to green labelling, providing
customers with more sustainable product options. For example, the adoption of EU Flower in
2004, Organic cotton in 2005. In 2013, H&M expanded the option base by creating the
“Conscious” hang tag. MADE-BY created a tool called Environmental Benchmark of Fibres
where fibres were classified into 5 classes, A to E, based on environmental impact. Any
product consisting of at least 50% of materials listed in Class A and B are labelled with as
“Conscious”.
4.3.1.4 Innovations and sustainability
The main operation of H&M is design and retailing, which according to the LCAs results,
represents 10% carbon footprint and 0% water foot print of the products H&M is selling.
H&M takes a proactive role by participating in investments like development of alternative
materials and manufacturing processes. The focus of H&M in recent years is methods to
create a closed-loop supply chain. Efforts include investing in textile recycling technologies,
developing new business model, and crowd-sourcing innovation ideas through H&M
Foundation’s Global Change Award.
Using the Three Dimensional Concurrent Engineering (3DCE) framework, sustainability
efforts of H&M were classified into Product, Process and Supply Chain, as shown in Table 11
(H&M, 2002-2015).
Product Process Supply Chain
Water-based PU with Bayer Water management systems with Jeanologia
Clean Shipping Project
Better cotton with BCI Textile-to-textile recycling H&M Foundation
37
technologies with Worn Again Global Change Award
Recycled polyester from PET bottles
Fossil Free Sweden
Recycled PE plastic shopping bags
Circular business model with Ellen MacArthur Foundation
Water-based adhesives with chemical manufacturers
Table 11 Overview of H&M’s sustainability efforts
4.3.2 Nike
For the following case study Nike’s first CSR report from FY2001 and their last CSR report
from FY2012/13 have been reviewed. Additionally, secondary sources from other authors
have been studied in order to increase the objectivity.
4.3.2.1 The development of Nike’s CSR strategy
Nike is an American multinational sports company that was founded in 1964. By the end of
2013 Nike had approximately 48,000 employees, including seasonal and part-time employees
and approximately more than 2.5 million people working at various stages throughout their
supply chain, including more than 1 million in the factories they contract directly (Nike, Inc.
2013).
Since Nike has made negative headlines with poor labor conditions in the 1990’s, the
organization has strived to increase their sustainability. They published their first CSR report
in 2001, when not many fashion companies even had CSR strategies (Nike, Inc. 2013). At that
time there were hardly any standards or regulations regarding sustainability or Corporate
Social Responsibility (CSR) in the fashion industry, which explains Nike’s insecurity in some
points of their first CSR report. Chairman and CEO Philip Knight claimed: “I’m not sure how
we measure good performance in corporate responsibility. I’m not convinced anybody does”
(Nike, Inc. 2001).
Corporate Responsibility at Nike is handled like any other business operation and integrated
into every part of the company and taught to employees of all departments. For example after
launching a new environmental policy, Nike sent 100 persons from every part of the
organization to a sustainability learning program (Nike, Inc. 2001).
Despite many developments and improvements over the last decade, Nike has many goals for
the future to become even more environmentally sustainable. When it comes to suppliers and
consumers, they want to improve the environmental performance of their suppliers and
engage consumers in the potential for a different way of consuming, since the company is
convinced that consumption is not the problem, but the current form of consumption is. Nike
is also planning to educate employees, customers, and business partners about sustainability
and promote their practices throughout the supply chain and seek business partnerships with
suppliers who operate in a way that agrees with their values (Nike, Inc. 2001).
In Figure 18 Nike’s system-change initiatives (Nike, Inc. 2013) an overview of Nike’s
system-change initiatives is shown. After mentioning and describing the system barrier, Nike
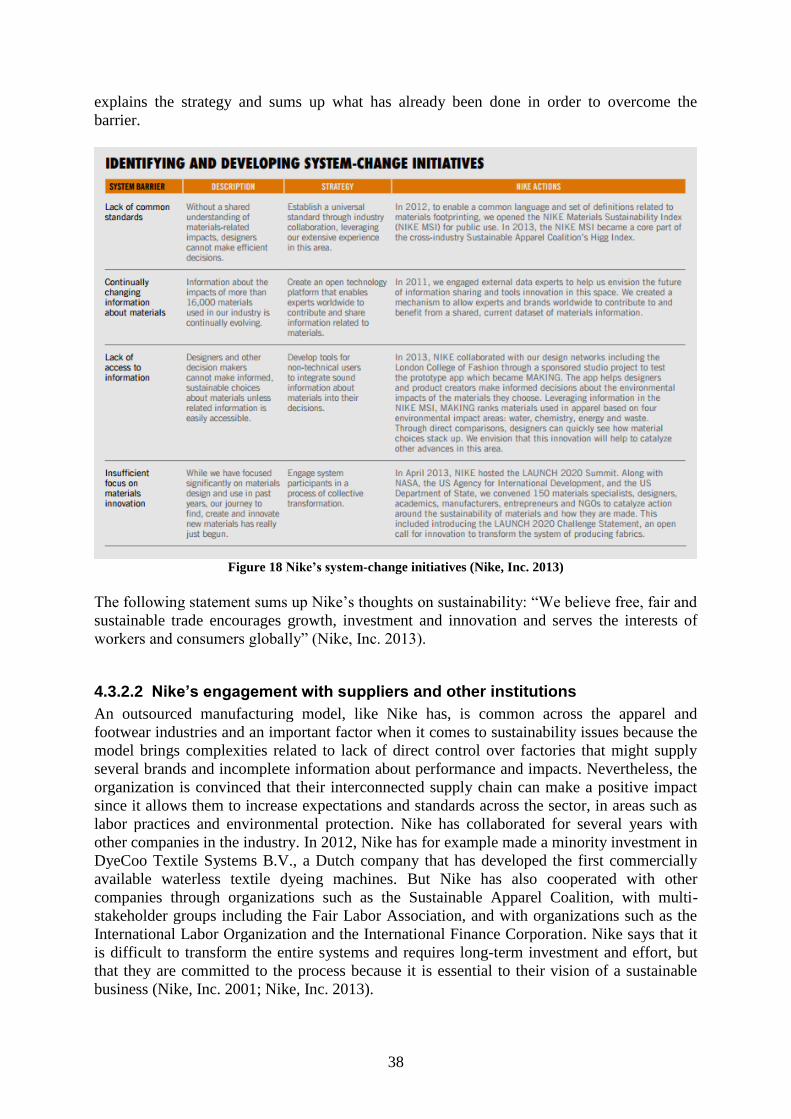
38
explains the strategy and sums up what has already been done in order to overcome the
barrier.
Figure 18 Nike’s system-change initiatives (Nike, Inc. 2013)
The following statement sums up Nike’s thoughts on sustainability: “We believe free, fair and
sustainable trade encourages growth, investment and innovation and serves the interests of
workers and consumers globally” (Nike, Inc. 2013).
4.3.2.2 Nike’s engagement with suppliers and other institutions
An outsourced manufacturing model, like Nike has, is common across the apparel and
footwear industries and an important factor when it comes to sustainability issues because the
model brings complexities related to lack of direct control over factories that might supply
several brands and incomplete information about performance and impacts. Nevertheless, the
organization is convinced that their interconnected supply chain can make a positive impact
since it allows them to increase expectations and standards across the sector, in areas such as
labor practices and environmental protection. Nike has collaborated for several years with
other companies in the industry. In 2012, Nike has for example made a minority investment in
DyeCoo Textile Systems B.V., a Dutch company that has developed the first commercially
available waterless textile dyeing machines. But Nike has also cooperated with other
companies through organizations such as the Sustainable Apparel Coalition, with multi-
stakeholder groups including the Fair Labor Association, and with organizations such as the
International Labor Organization and the International Finance Corporation. Nike says that it
is difficult to transform the entire systems and requires long-term investment and effort, but
that they are committed to the process because it is essential to their vision of a sustainable
business (Nike, Inc. 2001; Nike, Inc. 2013).
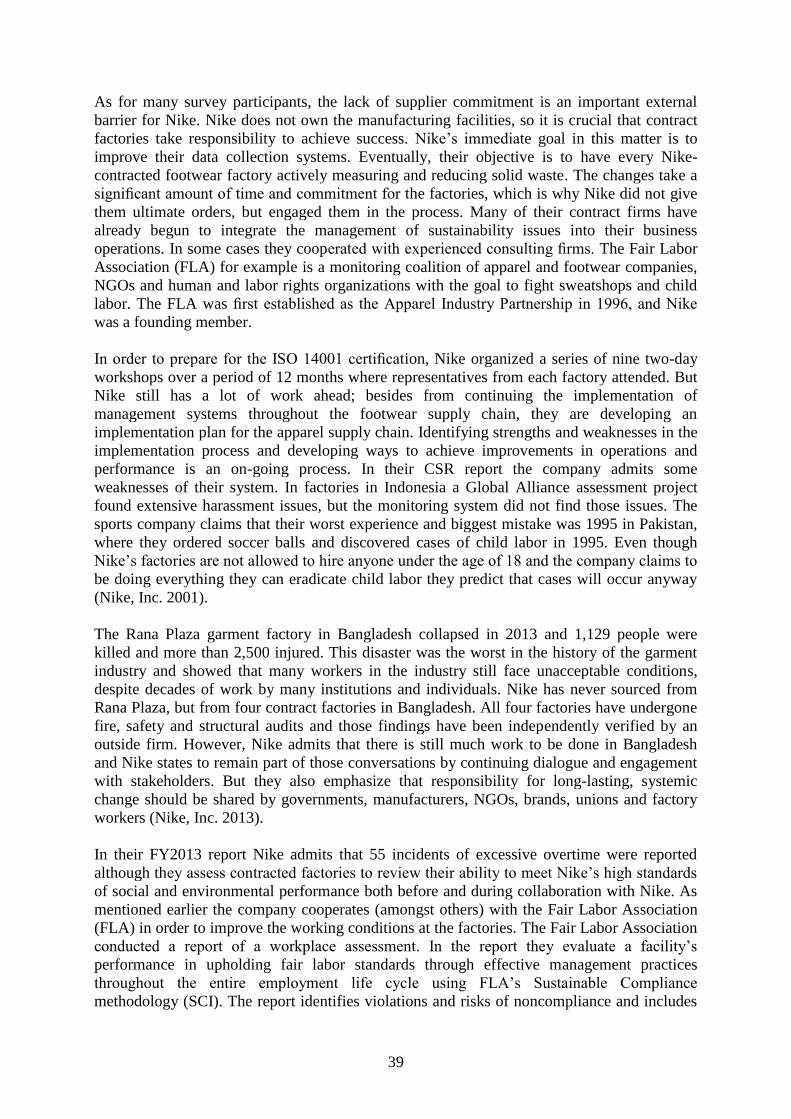
39
As for many survey participants, the lack of supplier commitment is an important external
barrier for Nike. Nike does not own the manufacturing facilities, so it is crucial that contract
factories take responsibility to achieve success. Nike’s immediate goal in this matter is to
improve their data collection systems. Eventually, their objective is to have every Nike-
contracted footwear factory actively measuring and reducing solid waste. The changes take a
significant amount of time and commitment for the factories, which is why Nike did not give
them ultimate orders, but engaged them in the process. Many of their contract firms have
already begun to integrate the management of sustainability issues into their business
operations. In some cases they cooperated with experienced consulting firms. The Fair Labor
Association (FLA) for example is a monitoring coalition of apparel and footwear companies,
NGOs and human and labor rights organizations with the goal to fight sweatshops and child
labor. The FLA was first established as the Apparel Industry Partnership in 1996, and Nike
was a founding member.
In order to prepare for the ISO 14001 certification, Nike organized a series of nine two-day
workshops over a period of 12 months where representatives from each factory attended. But
Nike still has a lot of work ahead; besides from continuing the implementation of
management systems throughout the footwear supply chain, they are developing an
implementation plan for the apparel supply chain. Identifying strengths and weaknesses in the
implementation process and developing ways to achieve improvements in operations and
performance is an on-going process. In their CSR report the company admits some
weaknesses of their system. In factories in Indonesia a Global Alliance assessment project
found extensive harassment issues, but the monitoring system did not find those issues. The
sports company claims that their worst experience and biggest mistake was 1995 in Pakistan,
where they ordered soccer balls and discovered cases of child labor in 1995. Even though
Nike’s factories are not allowed to hire anyone under the age of 18 and the company claims to
be doing everything they can eradicate child labor they predict that cases will occur anyway
(Nike, Inc. 2001).
The Rana Plaza garment factory in Bangladesh collapsed in 2013 and 1,129 people were
killed and more than 2,500 injured. This disaster was the worst in the history of the garment
industry and showed that many workers in the industry still face unacceptable conditions,
despite decades of work by many institutions and individuals. Nike has never sourced from
Rana Plaza, but from four contract factories in Bangladesh. All four factories have undergone
fire, safety and structural audits and those findings have been independently verified by an
outside firm. However, Nike admits that there is still much work to be done in Bangladesh
and Nike states to remain part of those conversations by continuing dialogue and engagement
with stakeholders. But they also emphasize that responsibility for long-lasting, systemic
change should be shared by governments, manufacturers, NGOs, brands, unions and factory
workers (Nike, Inc. 2013).
In their FY2013 report Nike admits that 55 incidents of excessive overtime were reported
although they assess contracted factories to review their ability to meet Nike’s high standards
of social and environmental performance both before and during collaboration with Nike. As
mentioned earlier the company cooperates (amongst others) with the Fair Labor Association
(FLA) in order to improve the working conditions at the factories. The Fair Labor Association
conducted a report of a workplace assessment. In the report they evaluate a facility’s
performance in upholding fair labor standards through effective management practices
throughout the entire employment life cycle using FLA’s Sustainable Compliance
methodology (SCI). The report identifies violations and risks of noncompliance and includes
40
a description of the root causes of violations, recommendations for sustainable and immediate
improvement, and the corrective action plan for each risk or violation as submitted by the
company (Fair Labor Association, 2015; Nike, Inc. 2013).
Figure 19 shows Nike’s performance score in a Chinese factory. The percentage indicates
how well the factory fulfilled the fair labor requirements. The worst performances were made
in the areas of industrial relations, grievance system and termination and worker
retrenchment.
Figure 19 Nike’s performance score in a Chinese factory
Adapted from Fair Labor Association, 2015
4.3.2.3 Nike’s approach towards resource scarcity and hazardous chemicals
Nike collects footwear returned from distribution centers and retailers, as well as used
products from consumers in the frame of a project that they call” Reuse-A-Shoe”. These shoes
are then reduced by grinding down to granules of rubber and other materials and made into
new products. The company considers the collection to be the hardest task because it requires
a change in consumer behavior. However, Nike is in a position to positively influence the
business practices of other industries. Nike’s partner, the Cathay Recycling Development
Corporation (CRDC), is building a firm economic base in China for recycled waste materials.
In 2001 more than 50% of rubber waste from Nike’s 17 contracted factories in China has been
ground and reused. CRDC is working with Nike’s manufacturing sustainability group on
additional projects such as reducing waste incineration, and with Philips, on fluorescent light
bulb recycling (Nike, Inc. 2001).
It has not yet been possible for Nike to shift to organically-produced cotton for our entire
product line because current supply would not meet the demand of the global sports company.
But by increasing the usage as the market and economy allow, Nike supports pioneer farmers
who are switching to organic practices and the organic cotton industry (Nike, Inc. 2001).
In their latest CSR report from FY2012/13 Nike states: “We believe business has a critical
role to play in meeting the challenges of a changing world – addressing climate change,
preserving the earth’s constrained resources, enhancing global economic opportunity – not by
reducing growth but by redefining it. To do this we believe businesses must embrace
sustainability as an innovation opportunity and governments should act to create the right
policies and incentives to accelerate change at scale” (Nike, Inc. 2013). The organization is
convinced that sustainability and business growth are complementary. Their strategy is to
create value through innovation and thereby reducing the impact on the environment.
Breakthrough technologies like NIKE Flyknit, which significantly reduces waste compared to
traditional footwear manufacturing, and ColorDry, which eliminates water and process
chemicals from dyeing while decreasing energy consumption and improving productivity
quality are some of their latest innovations. Nike explains further: “Early on, we learned that
41
rather than just managing our reputation by reacting to criticism about our supply chain, we
could create real opportunities for change by creating an environment of industry
collaboration, partnership and transparency. We still believe transparency is essential for
industry change”. From only approaching sustainability reactively as a reputation
management issue, Nike has evolved to embracing it as a key driver of innovation and an
important source of competitive advantage. Nike claims that they are trying to integrate
sustainability into every business aspect; materials, design and manufacturing. Materials and
manufacturing have the strongest impact on people and environment, and a potential for
sustainable innovation. Innovation fuels Nike’s success and challenges them at the same time.
Their athletes, consumers and investors expect and always have expected Nike to be
innovative (Nike, Inc. 2013).
Their definition of a sustainable supply chain is “one that is lean with regard to our
manufacturing philosophy; green in our approach to design, product creation and sourcing;
equitable in our commitment to balance people and profit; and empowered by building a
workforce that knows and can advocate for its rights”. Nike’s recent footprinting work
revealed that 73% of the water needed to make the products is used at the beginning of the
value chain, in the raw materials stage; mostly because cotton is very water-intensive to grow.
Rising costs for energy, materials and labor and severe weather events, such as flooding in
Thailand, put stress on textile supply chains. In 2012 NIKE released a Materials Sustainability
Index to the Sustainable Apparel Coalition (SAC) (Nike, Inc. 2013).
In the future NIKE wants to deliver profitable growth through sustainable manufacturing and
sourcing. To do so, the company plans to make their lean production system a standard
practice at all their factories. Using the so called Sourcing and Manufacturing Sustainability
Index the company assesses factories based on sustainability, cost, quality, and on-time
delivery. They believe that their lean manufacturing system is an enabler of sustained,
improved business performance where employees are engaged and enabled to continuously
improve. Nike states: “[Lean manufacturing has helped to deepen the] understanding of the
cultural differences between management and workers’ priorities and perceptions, as well as
the need to enhance communication and engagement with workers directly on problem
solving” (Nike, Inc. 2001; Nike, Inc. 2013).
Although the company claims to take a leadership role whenever it has direct influence, it
emphasizes the importance of collaboration with other supply chain participants for example
in order to improve working conditions within the global textile supply chain. One way Nike
is working on those improvements is through collaborating with the Fair Labor Association to
develop the Sustainable Compliance Initiative. This initiative, still in development, provides
tools to improve the quality, consistency and efficiency of efforts in the industry to comply
with government laws or regulations and company standards (Nike, Inc. 2013).
In 2013 an article about Nike’s sustainability effort has been published in Harvard Business
Review. Nike mentions this review in their latest CSR report, saying: “To share our
experience in this area with others, in 2013 we engaged with professors at Harvard Business
School who produced Governance and Sustainability at NIKE – a case study about our
journey. This publication […] describes how we transformed from a company that reacted to
external pressures while working to minimize reputation risks to one that views sustainability
as among our leading innovation opportunities; catalyzing strategic partnerships to bring
sustainable innovation to scale.” The article talks amongst other things about the company’s
plan to join the Greenpeace initiative “Roadmap to Zero”, an initiative to eliminate the
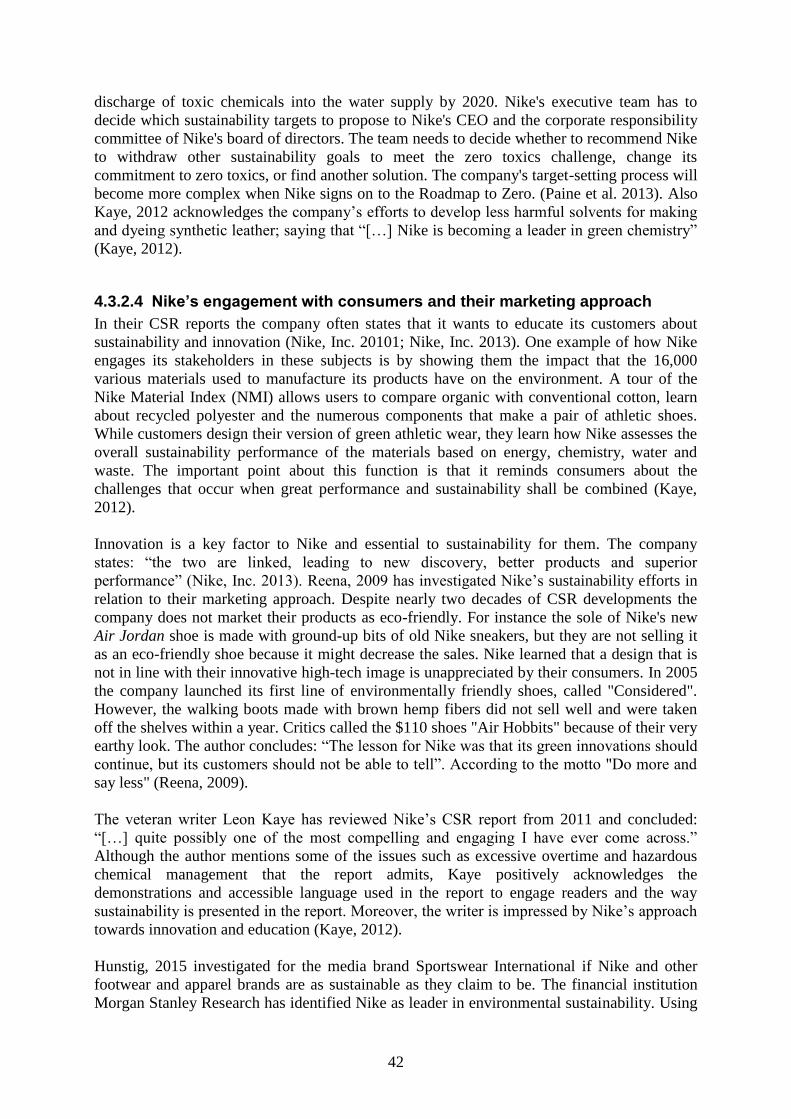
42
discharge of toxic chemicals into the water supply by 2020. Nike's executive team has to
decide which sustainability targets to propose to Nike's CEO and the corporate responsibility
committee of Nike's board of directors. The team needs to decide whether to recommend Nike
to withdraw other sustainability goals to meet the zero toxics challenge, change its
commitment to zero toxics, or find another solution. The company's target-setting process will
become more complex when Nike signs on to the Roadmap to Zero. (Paine et al. 2013). Also
Kaye, 2012 acknowledges the company’s efforts to develop less harmful solvents for making
and dyeing synthetic leather; saying that “[…] Nike is becoming a leader in green chemistry”
(Kaye, 2012).
4.3.2.4 Nike’s engagement with consumers and their marketing approach
In their CSR reports the company often states that it wants to educate its customers about
sustainability and innovation (Nike, Inc. 20101; Nike, Inc. 2013). One example of how Nike
engages its stakeholders in these subjects is by showing them the impact that the 16,000
various materials used to manufacture its products have on the environment. A tour of the
Nike Material Index (NMI) allows users to compare organic with conventional cotton, learn
about recycled polyester and the numerous components that make a pair of athletic shoes.
While customers design their version of green athletic wear, they learn how Nike assesses the
overall sustainability performance of the materials based on energy, chemistry, water and
waste. The important point about this function is that it reminds consumers about the
challenges that occur when great performance and sustainability shall be combined (Kaye,
2012).
Innovation is a key factor to Nike and essential to sustainability for them. The company
states: “the two are linked, leading to new discovery, better products and superior
performance” (Nike, Inc. 2013). Reena, 2009 has investigated Nike’s sustainability efforts in
relation to their marketing approach. Despite nearly two decades of CSR developments the
company does not market their products as eco-friendly. For instance the sole of Nike's new
Air Jordan shoe is made with ground-up bits of old Nike sneakers, but they are not selling it
as an eco-friendly shoe because it might decrease the sales. Nike learned that a design that is
not in line with their innovative high-tech image is unappreciated by their consumers. In 2005
the company launched its first line of environmentally friendly shoes, called "Considered".
However, the walking boots made with brown hemp fibers did not sell well and were taken
off the shelves within a year. Critics called the $110 shoes "Air Hobbits" because of their very
earthy look. The author concludes: “The lesson for Nike was that its green innovations should
continue, but its customers should not be able to tell”. According to the motto "Do more and
say less" (Reena, 2009).
The veteran writer Leon Kaye has reviewed Nike’s CSR report from 2011 and concluded:
“[…] quite possibly one of the most compelling and engaging I have ever come across.”
Although the author mentions some of the issues such as excessive overtime and hazardous
chemical management that the report admits, Kaye positively acknowledges the
demonstrations and accessible language used in the report to engage readers and the way
sustainability is presented in the report. Moreover, the writer is impressed by Nike’s approach
towards innovation and education (Kaye, 2012).
Hunstig, 2015 investigated for the media brand Sportswear International if Nike and other
footwear and apparel brands are as sustainable as they claim to be. The financial institution
Morgan Stanley Research has identified Nike as leader in environmental sustainability. Using
43
a Sole Sustainability Index (SSI), the performance of some of the largest branded apparel and
footwear businesses have been analyzed. The index summarizes existing data and compares
the companies’ performance in terms of environmental issues (examining water, waste and
raw materials, specifically cotton and leather), social matters (supply chain management and
community engagement) and governance (how sustainability is integrated into the business
strategy and how shareholder-friendly the corporate governance structure is). Nike and the
organization PVH had the highest score on social topics and Nike, VF Corp., and
Hanesbrands had the highest overall ranks on the Sole Sustainability Index.
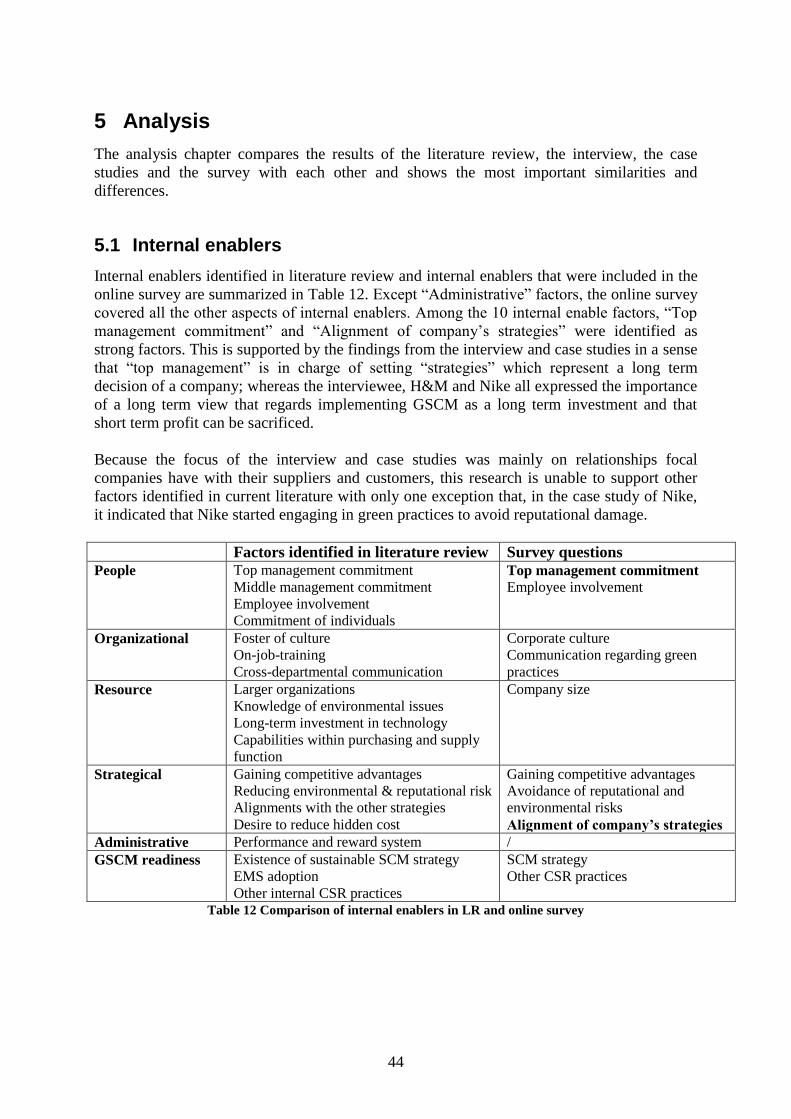
44
5 Analysis
The analysis chapter compares the results of the literature review, the interview, the case
studies and the survey with each other and shows the most important similarities and
differences.
5.1 Internal enablers
Internal enablers identified in literature review and internal enablers that were included in the
online survey are summarized in Table 12. Except “Administrative” factors, the online survey
covered all the other aspects of internal enablers. Among the 10 internal enable factors, “Top
management commitment” and “Alignment of company’s strategies” were identified as
strong factors. This is supported by the findings from the interview and case studies in a sense
that “top management” is in charge of setting “strategies” which represent a long term
decision of a company; whereas the interviewee, H&M and Nike all expressed the importance
of a long term view that regards implementing GSCM as a long term investment and that
short term profit can be sacrificed.
Because the focus of the interview and case studies was mainly on relationships focal
companies have with their suppliers and customers, this research is unable to support other
factors identified in current literature with only one exception that, in the case study of Nike,
it indicated that Nike started engaging in green practices to avoid reputational damage.
Factors identified in literature review Survey questions
People Top management commitment
Middle management commitment
Employee involvement
Commitment of individuals
Top management commitment
Employee involvement
Organizational Foster of culture
On-job-training
Cross-departmental communication
Corporate culture
Communication regarding green
practices
Resource Larger organizations
Knowledge of environmental issues
Long-term investment in technology
Capabilities within purchasing and supply
function
Company size
Strategical Gaining competitive advantages
Reducing environmental & reputational risk
Alignments with the other strategies
Desire to reduce hidden cost
Gaining competitive advantages
Avoidance of reputational and
environmental risks
Alignment of company’s strategies
Administrative Performance and reward system /
GSCM readiness Existence of sustainable SCM strategy
EMS adoption
Other internal CSR practices
SCM strategy
Other CSR practices
Table 12 Comparison of internal enablers in LR and online survey
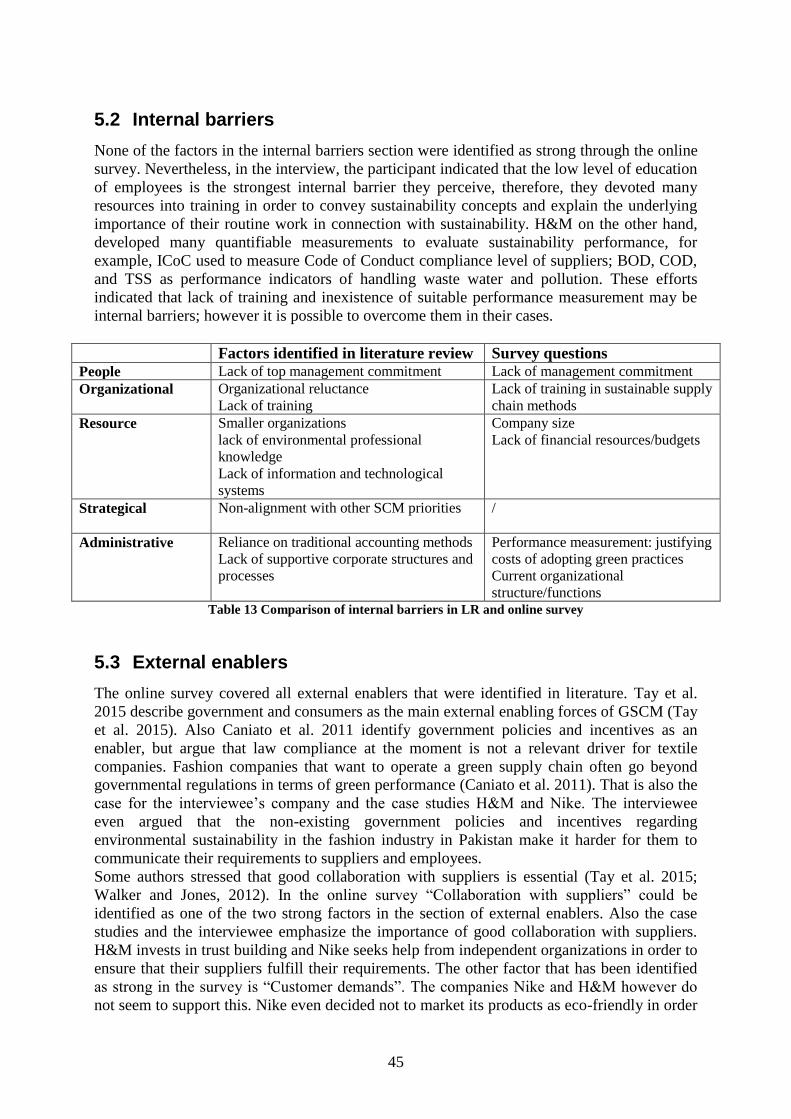
45
5.2 Internal barriers
None of the factors in the internal barriers section were identified as strong through the online
survey. Nevertheless, in the interview, the participant indicated that the low level of education
of employees is the strongest internal barrier they perceive, therefore, they devoted many
resources into training in order to convey sustainability concepts and explain the underlying
importance of their routine work in connection with sustainability. H&M on the other hand,
developed many quantifiable measurements to evaluate sustainability performance, for
example, ICoC used to measure Code of Conduct compliance level of suppliers; BOD, COD,
and TSS as performance indicators of handling waste water and pollution. These efforts
indicated that lack of training and inexistence of suitable performance measurement may be
internal barriers; however it is possible to overcome them in their cases.
Factors identified in literature review Survey questions
People Lack of top management commitment Lack of management commitment
Organizational Organizational reluctance
Lack of training
Lack of training in sustainable supply
chain methods
Resource Smaller organizations
lack of environmental professional
knowledge
Lack of information and technological
systems
Company size
Lack of financial resources/budgets
Strategical Non-alignment with other SCM priorities
/
Administrative Reliance on traditional accounting methods
Lack of supportive corporate structures and
processes
Performance measurement: justifying
costs of adopting green practices
Current organizational
structure/functions Table 13 Comparison of internal barriers in LR and online survey
5.3 External enablers
The online survey covered all external enablers that were identified in literature. Tay et al.
2015 describe government and consumers as the main external enabling forces of GSCM (Tay
et al. 2015). Also Caniato et al. 2011 identify government policies and incentives as an
enabler, but argue that law compliance at the moment is not a relevant driver for textile
companies. Fashion companies that want to operate a green supply chain often go beyond
governmental regulations in terms of green performance (Caniato et al. 2011). That is also the
case for the interviewee’s company and the case studies H&M and Nike. The interviewee
even argued that the non-existing government policies and incentives regarding
environmental sustainability in the fashion industry in Pakistan make it harder for them to
communicate their requirements to suppliers and employees.
Some authors stressed that good collaboration with suppliers is essential (Tay et al. 2015;
Walker and Jones, 2012). In the online survey “Collaboration with suppliers” could be
identified as one of the two strong factors in the section of external enablers. Also the case
studies and the interviewee emphasize the importance of good collaboration with suppliers.
H&M invests in trust building and Nike seeks help from independent organizations in order to
ensure that their suppliers fulfill their requirements. The other factor that has been identified
as strong in the survey is “Customer demands”. The companies Nike and H&M however do
not seem to support this. Nike even decided not to market its products as eco-friendly in order
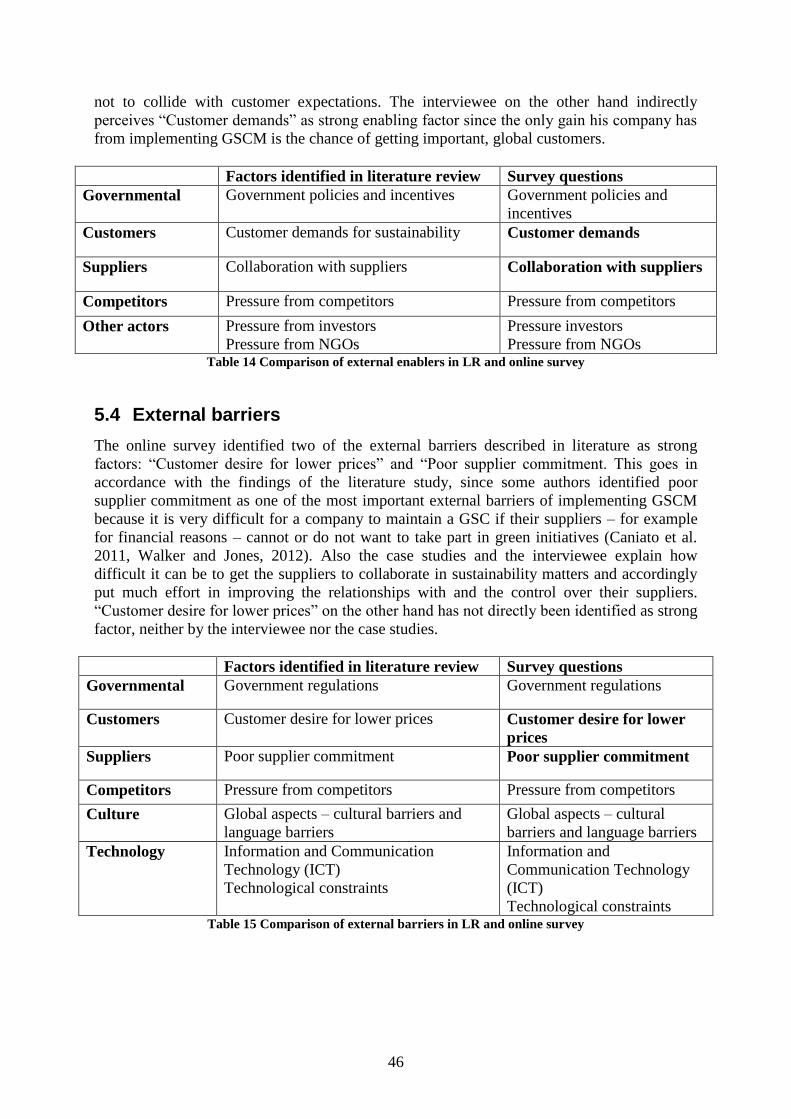
46
not to collide with customer expectations. The interviewee on the other hand indirectly
perceives “Customer demands” as strong enabling factor since the only gain his company has
from implementing GSCM is the chance of getting important, global customers.
Factors identified in literature review Survey questions
Governmental Government policies and incentives Government policies and
incentives
Customers Customer demands for sustainability Customer demands
Suppliers Collaboration with suppliers Collaboration with suppliers
Competitors Pressure from competitors Pressure from competitors
Other actors Pressure from investors
Pressure from NGOs
Pressure investors
Pressure from NGOs Table 14 Comparison of external enablers in LR and online survey
5.4 External barriers
The online survey identified two of the external barriers described in literature as strong
factors: “Customer desire for lower prices” and “Poor supplier commitment. This goes in
accordance with the findings of the literature study, since some authors identified poor
supplier commitment as one of the most important external barriers of implementing GSCM
because it is very difficult for a company to maintain a GSC if their suppliers – for example
for financial reasons – cannot or do not want to take part in green initiatives (Caniato et al.
2011, Walker and Jones, 2012). Also the case studies and the interviewee explain how
difficult it can be to get the suppliers to collaborate in sustainability matters and accordingly
put much effort in improving the relationships with and the control over their suppliers.
“Customer desire for lower prices” on the other hand has not directly been identified as strong
factor, neither by the interviewee nor the case studies.
Factors identified in literature review Survey questions
Governmental Government regulations Government regulations
Customers Customer desire for lower prices Customer desire for lower
prices
Suppliers Poor supplier commitment Poor supplier commitment
Competitors Pressure from competitors Pressure from competitors
Culture Global aspects – cultural barriers and
language barriers
Global aspects – cultural
barriers and language barriers
Technology Information and Communication
Technology (ICT)
Technological constraints
Information and
Communication Technology
(ICT)
Technological constraints Table 15 Comparison of external barriers in LR and online survey
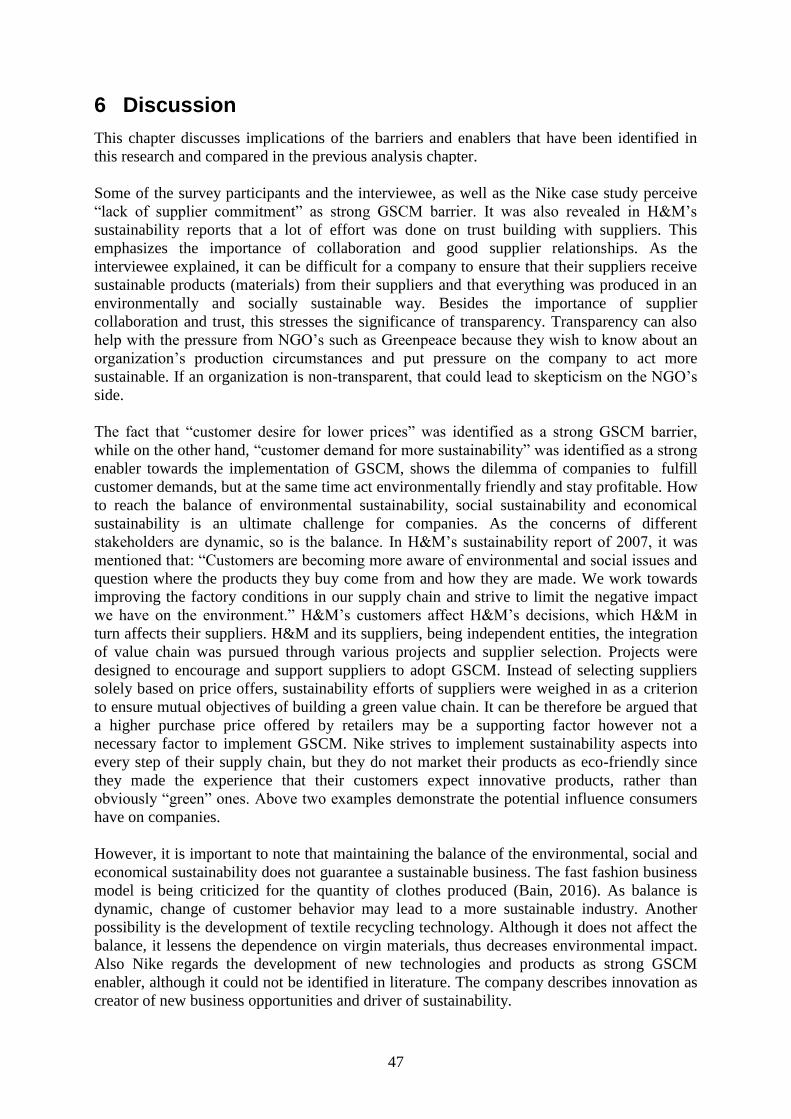
47
6 Discussion
This chapter discusses implications of the barriers and enablers that have been identified in
this research and compared in the previous analysis chapter.
Some of the survey participants and the interviewee, as well as the Nike case study perceive
“lack of supplier commitment” as strong GSCM barrier. It was also revealed in H&M’s
sustainability reports that a lot of effort was done on trust building with suppliers. This
emphasizes the importance of collaboration and good supplier relationships. As the
interviewee explained, it can be difficult for a company to ensure that their suppliers receive
sustainable products (materials) from their suppliers and that everything was produced in an
environmentally and socially sustainable way. Besides the importance of supplier
collaboration and trust, this stresses the significance of transparency. Transparency can also
help with the pressure from NGO’s such as Greenpeace because they wish to know about an
organization’s production circumstances and put pressure on the company to act more
sustainable. If an organization is non-transparent, that could lead to skepticism on the NGO’s
side.
The fact that “customer desire for lower prices” was identified as a strong GSCM barrier,
while on the other hand, “customer demand for more sustainability” was identified as a strong
enabler towards the implementation of GSCM, shows the dilemma of companies to fulfill
customer demands, but at the same time act environmentally friendly and stay profitable. How
to reach the balance of environmental sustainability, social sustainability and economical
sustainability is an ultimate challenge for companies. As the concerns of different
stakeholders are dynamic, so is the balance. In H&M’s sustainability report of 2007, it was
mentioned that: “Customers are becoming more aware of environmental and social issues and
question where the products they buy come from and how they are made. We work towards
improving the factory conditions in our supply chain and strive to limit the negative impact
we have on the environment.” H&M’s customers affect H&M’s decisions, which H&M in
turn affects their suppliers. H&M and its suppliers, being independent entities, the integration
of value chain was pursued through various projects and supplier selection. Projects were
designed to encourage and support suppliers to adopt GSCM. Instead of selecting suppliers
solely based on price offers, sustainability efforts of suppliers were weighed in as a criterion
to ensure mutual objectives of building a green value chain. It can be therefore be argued that
a higher purchase price offered by retailers may be a supporting factor however not a
necessary factor to implement GSCM. Nike strives to implement sustainability aspects into
every step of their supply chain, but they do not market their products as eco-friendly since
they made the experience that their customers expect innovative products, rather than
obviously “green” ones. Above two examples demonstrate the potential influence consumers
have on companies.
However, it is important to note that maintaining the balance of the environmental, social and
economical sustainability does not guarantee a sustainable business. The fast fashion business
model is being criticized for the quantity of clothes produced (Bain, 2016). As balance is
dynamic, change of customer behavior may lead to a more sustainable industry. Another
possibility is the development of textile recycling technology. Although it does not affect the
balance, it lessens the dependence on virgin materials, thus decreases environmental impact.
Also Nike regards the development of new technologies and products as strong GSCM
enabler, although it could not be identified in literature. The company describes innovation as
creator of new business opportunities and driver of sustainability.
48
7 Conclusion
This chapter sums up the findings of this research and provides answers to the three research
questions accordingly. Finally, the contributions of this research are stated and suggestions for
future research are given.
Due to the 2.47 % low response rate, no hard conclusions can be drawn from the online
survey. Nevertheless, the collected 23 samples show a strong tendency. When measuring the
GSCM incentives, 22 samples are in the “Neutral” zone, suggesting these companies face
neither significant incentives nor obstacles to implement GSCM. 12 out of 23 samples are
classified as Agenda setters, indicating companies perceive internal incentives and the need to
overcome external barriers. 15 out of 23 samples graded “Customer desire for lower prices”
as a strong barrier while graded “Customer demands” as a strong enabler.
Similarities can be found from the interview and two case studies on H&M and Nike, that all
three companies view implementing GSCM as a long term investment, which may not be
economically sustainable in the short run. In the case studies, many efforts were made on
establishing mutual trust with suppliers. Only when trust is built, can traceability and
transparency of value chain be increased.
The research questions can be answered as following:
Research question: Answered by:
RQ1 Discussed/investigated in LR. Tested and
confirmed/denied in survey, interview and
case studies
RQ2 Answered by survey and interview
RQ3 Answered by survey, case study and
interview
Table 16 Answering of RQs
RQ1: What are the factors that enable or aggravate the implementation of a GSCM
strategy for textile and fashion companies? The different factors that enable (internal and external enablers) or aggravate (internal and
external barriers) have been identified in the literature review. In the online survey six out of
30 factors identified in literature are identified as strong: Top management commitment,
Alignment of company's strategies, Poor supplier commitment, Customer desire for lower
prices, Collaborations with suppliers and Customer demand for sustainability. That shows that
the main factors that affect the implementation of GSCM are supplier relationships and
customer demands. With the example of the Nike case study, innovation could be identified
as another enabling factor that has not been identified in literature. In contrast to the literature
study, government regulations and incentives have not been identified as strong factors by the
case study and the interviewee and the interviewee is of the opinion that the absence of
government regulations and incentives regarding green practices in the Pakistani textile
industry rather impede GSCM implementation.
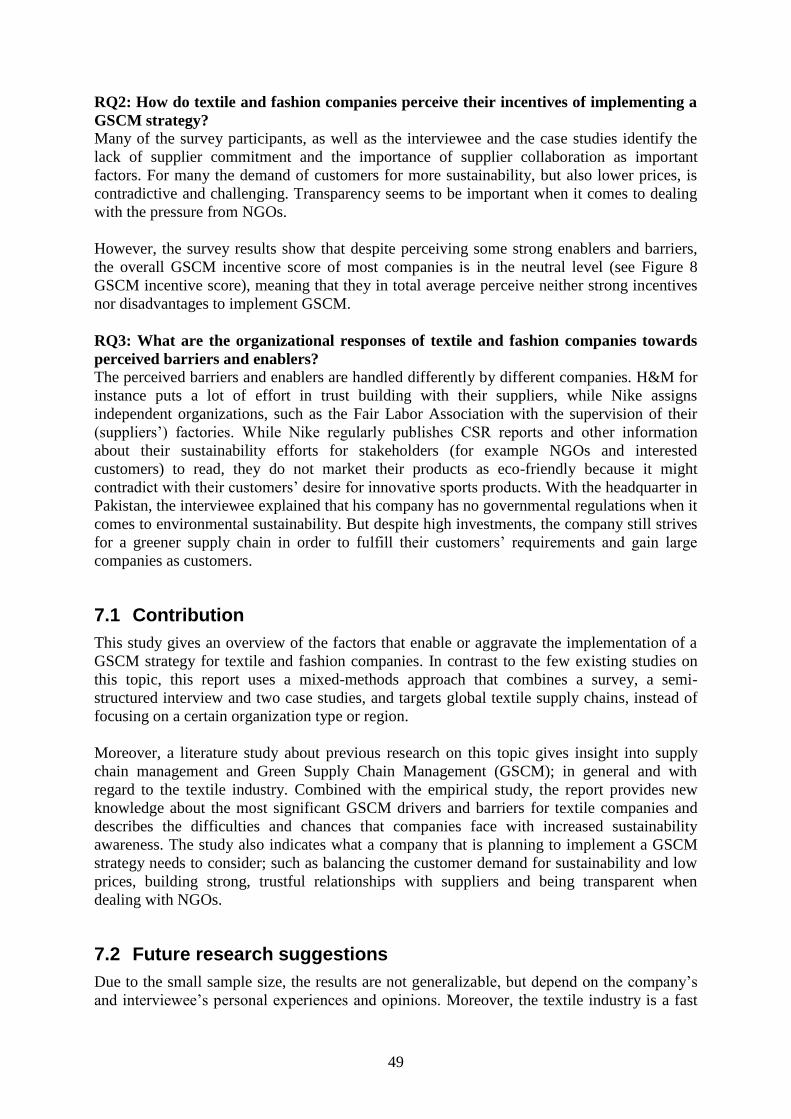
49
RQ2: How do textile and fashion companies perceive their incentives of implementing a
GSCM strategy? Many of the survey participants, as well as the interviewee and the case studies identify the
lack of supplier commitment and the importance of supplier collaboration as important
factors. For many the demand of customers for more sustainability, but also lower prices, is
contradictive and challenging. Transparency seems to be important when it comes to dealing
with the pressure from NGOs.
However, the survey results show that despite perceiving some strong enablers and barriers,
the overall GSCM incentive score of most companies is in the neutral level (see Figure 8
GSCM incentive score), meaning that they in total average perceive neither strong incentives
nor disadvantages to implement GSCM.
RQ3: What are the organizational responses of textile and fashion companies towards
perceived barriers and enablers?
The perceived barriers and enablers are handled differently by different companies. H&M for
instance puts a lot of effort in trust building with their suppliers, while Nike assigns
independent organizations, such as the Fair Labor Association with the supervision of their
(suppliers’) factories. While Nike regularly publishes CSR reports and other information
about their sustainability efforts for stakeholders (for example NGOs and interested
customers) to read, they do not market their products as eco-friendly because it might
contradict with their customers’ desire for innovative sports products. With the headquarter in
Pakistan, the interviewee explained that his company has no governmental regulations when it
comes to environmental sustainability. But despite high investments, the company still strives
for a greener supply chain in order to fulfill their customers’ requirements and gain large
companies as customers.
7.1 Contribution
This study gives an overview of the factors that enable or aggravate the implementation of a
GSCM strategy for textile and fashion companies. In contrast to the few existing studies on
this topic, this report uses a mixed-methods approach that combines a survey, a semi-
structured interview and two case studies, and targets global textile supply chains, instead of
focusing on a certain organization type or region.
Moreover, a literature study about previous research on this topic gives insight into supply
chain management and Green Supply Chain Management (GSCM); in general and with
regard to the textile industry. Combined with the empirical study, the report provides new
knowledge about the most significant GSCM drivers and barriers for textile companies and
describes the difficulties and chances that companies face with increased sustainability
awareness. The study also indicates what a company that is planning to implement a GSCM
strategy needs to consider; such as balancing the customer demand for sustainability and low
prices, building strong, trustful relationships with suppliers and being transparent when
dealing with NGOs.
7.2 Future research suggestions
Due to the small sample size, the results are not generalizable, but depend on the company’s
and interviewee’s personal experiences and opinions. Moreover, the textile industry is a fast
50
changing industry, so the results of similar studies in the future might look differently. This
study gives however a good indication what important barriers and enablers of GSCM can be
for textile companies. But in order to find out if these drivers and barriers affect textile
companies in general, a similar study with a significantly larger sample size needs to be
performed. The reason the sample size of this study is so small is because of the low response
rate of 2.47%. Designing a different methodology with a different sampling method in order
to increase the response rate therefore is advisable.
In overview suggested areas for future research can be the following:
- A similar study with a different (sampling) methodology, in order to increase the
response rate and receive a larger sample size
- Research on the differences between organization types (more upstream or
downstream of the value chain)
- A longitudinal research on how the perceived GSCM enablers and barriers of certain
companies change over time
- Companies that do not engage in green practices or GSCM, what would they require
to get engaged?
51
References
- Abernathy, F.H., Dunlop, J.T., Hammond, J.H., Weil, D.1999, A stitch in time: lean
retailing and the transformation of manufacturing, lessons from the apparel and
textile industries. Oxford University Press, Oxford; New York.
- Ahi, P. and Searcy, C. (2013). A comparative literature analysis of definitions for
green and sustainable supply chain management. Journal of Cleaner Production
- Al‐Zubaidi, H. and Tyler, D. (2004). A simulation model of quick response
replenishment of seasonal clothing. International Journal of Retail & Distribution Mgt,
32(6), pp.320-327
- Brooks, A. (2015). Chapter 9. Clothing Poverty: The Hidden World of Fast Fashion
and Second-hand Clothes. Zed Books
- Brown, R. B. (2006). Doing Your Dissertation in Business and Management: The
Reality of Research and Writing. Sage Publications
- Burau Veritas. Bureau Veritas Pakistan.
http://www.bureauveritas.co.in/wps/wcm/connect/bv_coin/Local/Home/Worldwide-
Locations/South+Asia+Region/Pakistan [Accessed: 2016-05-11]
- Bryman, A. (2012). Social Research Methods, 4th
Edition. Oxford University Press
- Caniato, F., Caridi, M., Crippa, L. and Moretto, A. (2012). Environmental
sustainability in fashion supply chains: An exploratory case based research.
International Journal of Production Economics, 135(2), pp.659-670.
- Chen, C. et al (2012). A business strategy selection of green supply chain management
via an analytic network process. Computers and Mathematics with Applications
- Choi, T. and Cheng, T. C. (2015). Sustainable Fashion Supply Chain Management
from Sourcing to Retailing. Springer
- Christopher, M. (1998). Logistics and supply chain management. London: Financial
Times/Pitman.
- Diabat, A. and Govindan, K. (2011). An analysis of the drivers affecting the
implementation of green supply chain management. Resources, Conservation and
Recycling, 55(6), pp.659-667.
- Diabat, A., Kannan, D. and Mathiyazhagan, K. (2014). Analysis of enablers for
implementation of sustainable supply chain management – A textile case. Journal of
Cleaner Production, 83, pp.391-403.
- Fair Labor Association (2015). Independent External Assessment Report about Nike’s
factory in China
- Forrester, JW. (1958). Industrial dynamics: a major breakthrough for decision
makers. Havard Business Review, 38, July-August, pp.37-66.
- Handfield, R. and Nichols, E. (2002). Supply chain redesign. Upper Saddle River, NJ:
Financial Times Prentice Hall.
- Hunstig, M. (2015). Are Nike and VF Corp. Really That Sustainable? Sportswear
International. http://www.sportswear-international.com/news/pages/protected/Are-
Nike-and-VF-Corp-really-that-sustainable_9895.html [Accessed:2016-04-29]
- Hunter, A.N. 1990, Quick response in apparel manufacturing: a survey of the
American scene. Textile Institute, Manchester.
- Iglesias, J et al (2008). The GMA 2008 Logistics Survey, Grocery Manufacturers
Association, Washington DC.
- Intertek. Textile Testing. Intertek Group plc.
http://www.intertek.com/textiles/testing/apparel/ [Accessed: 2016-05-11]
52
- Jespersen, B. and Skjott-Larsen, T. (2005). Supply chain management. Herndon, VA:
Copenhagen Business School Press.
- Kant, R. (2015). Green supply chain management (GSCM): a structured literature
review and research implications, Benchmarking: An International Journal, Vol. 22
- Kaye, L. (2012). Nike Interactive Sustainability Report. TriplePundit.
http://www.triplepundit.com/2012/05/nike-interactive-sustainability-report [Accessed:
2016-04-28]
- Lee, S. (2008). Drivers for the participation of small and medium‐sized suppliers in
green supply chain initiatives. Supply Chain Management: An International Journal,
13(3), pp.185-198.
- Liu, X. et al. (2011). Sustainable Production: Practices and Determinant Factors of
Green Supply Chain Management of Chinese Companies. Business Strategy and the
Environment
- Mhlnews.com. (2004). Council of Logistics Management to become Council of Supply
Chain Management Professionals. [online] Available at: http://mhlnews.com/global-
supply-chain/council-logistics-management-become-council-supply-chain-
management-professional [Accessed 2016-03-15].
- Min, H. and Kim, I. (2012). Green supply chain research: past, present, and future.
Springer Verlag
- Muduli, K., Govindan, K., Barve, A., Kannan, D. and Geng, Y. (2013). Role of
behavioural factors in green supply chain management implementation in Indian
mining industries. Resources, Conservation and Recycling, 76, pp.50-60.
- Newell, A. (2012). 10 Outstanding CSR Reports. TriplePundit.
http://www.triplepundit.com/2012/05/10-outstanding-csr-reports [Accessed: 2016-04-
28]
- Nike, Inc. (2001). FY01 CR Report. Nike, Inc.
- Nike, Inc. (2013). FY12/13 Sustainable Business Performance Summary. Nike, Inc.
- Paine, L. S. et al. (2013). Governance and Sustainability at Nike – A case study.
Harvard Business Review
- Pui-Yan Ho, H. and Choi, T.M. (2012). A Five-R analysis for sustainable fashion
supply chain management in Hong Kong: a case analysis. Journal of Fashion
Marketing and Management: An International Journal, Vol. 16
- Reena, J. (2009). Nike Quietly Goes Green. Bloomberg Businessweek.
http://www.bloomberg.com/news/articles/2009-06-11/nike-quietly-goes-green
[Accessed: 2016-04-29]
- Sardar, S. and Lee, Y. (2014). Analysis of Product Complexity considering Disruption
Cost in Fast Fashion Supply Chain. Mathematical Problems in Engineering, 2015,
pp.1-15.
- Scott, C., Lundgren, H. and Thompson, P. (2011). Guide to supply chain management.
Berlin: Springer.
- Seuring, S. and Müller, M. (2008). From a literature review to a conceptual
framework for sustainable supply chain management. Journal of Cleaner Production
- SGS SA (2016). SGS. http://www.sgsgroup.us.com/ [Accessed: 2016-05-11]
- Singh, K. (2007). Quantitative Social Research Methods. SAGE Publications
- Sull, D. and Turconi, S. (2008). Fast fashion lessons. Business Strategy Review,
19(2), pp.4-11.
- Tan, K. (2001). A framework of supply chain management literature. European
Journal of Purchasing & Supply Management, 7(1), pp.39-48.
53
- Tay, M., Rahman, A., Aziz, Y. and Sidek, S. (2015). A Review on Drivers and
Barriers towards Sustainable Supply Chain Practices. International Journal of Social
Science and Humanity, 5(10), pp.892-897.
- Tihomir, O. and Goran, D. (2014). Literature Survey of GSCM with Interrelated
Concepts. Proquest, Bulletin of Engineering
- Turker, D. and Altuntas, C. (2014). Sustainable supply chain management in the fast
fashion industry: An analysis of corporate reports. European Management Journal
- Walker, H. and Jones, N. (2012). Sustainable supply chain management across the UK
private sector. Supply Chain Management: An International Journal, 17(1), pp.15-28.
- Walker, H., Di Sisto, L. and McBain, D. (2008). Drivers and barriers to
environmental supply chain management practices: Lessons from the public and
private sectors. Journal of Purchasing and Supply Management, 14(1), pp.69-85.
- Wu, C. and Barnes, D. (2015). An integrated model for green partner selection and
supply chain construction. Journal of Cleaner Production
- Wu, G. et al. (2011). The effects of GSCM drivers and institutional pressures on
GSCM practices in Taiwan’s textile and apparel industry. International Journal of
Production Economics
- Wu, G., Ding, J. and Chen, P. (2012). The effects of GSCM drivers and institutional
pressures on GSCM practices in Taiwan’s textile and apparel industry. International
Journal of Production Economics, 135(2), pp.618-636.
I
Appendix I - Interview questions
GSCM enablers and barriers in textile supply chains
- Can you tell us about your job? How close is it related to GSCM?
- What activities does your position as a marketing and business development manager
include, especially when it comes to GSCM/sustainability?
- For how many years has your company been engaged in green practices?
- Can you describe specifically the green practices your company is engaged in?
*For example: Green purchasing, Cooperation with customers, Eco-Design,
Investment recovery
- According to what requirements does Soorty select its suppliers (for raw materials,
dyeing, garment manufacturing, etc. or if they outsource something)? Do you have a
code of conduct that your suppliers need to follow?
- Do Soorty’s employees receive training/education in sustainability matters?
- What is the biggest challenge your company has faced internally when implementing
GSCM?
- What is the biggest challenge your company has faced externally when implementing
GSCM?
- What is the major reason your company decided to engage in green practices?
- What do you find the most enabling about GSCM and why?
- From a financial perspective: do you feel that GSCM is disadvantageous or
advantageous for Soorty?
- Can you describe one government policy that encourages Pakistani companies to
implement GSCM?
- We noticed from the survey that customer demand for sustainability seems to be high,
but so does customer desire for lower prices. How do you balance that as a
company?
- Do you have any solutions or other alternatives to measure performance?
- Does your company have a department responsible for all those sustainability issues or
does every department is responsible for assuring its own sustainability standards?

II
Appendix II - Overview of survey answers

- -
- - Visiting address: Allégatan 1 · Postal address: 501 90 Borås · Phone: 033-435 40 00 · E-mail: [email protected] · Webb:
www.hb.se
2016/5/18 Perception of incentives & barriers for adopting Green Supply Chain Management(GSCM) Google Forms
https://docs.google.com/forms/d/1XtnIeAYp5pVrMLZMDGrYPmj1XwtOFWs7xHWHnK4t9bk/viewanalytics 1/18
23 responsesView all responses
Summary
[Image]
Basic Information
Company Name (optional)
V&A Japan
Luxury Jersey srl
MATEX SRL
NGS MALHAS SA
Solwa Srl
Depoortere Deco
Primkastudio Textile
Atlantic Leather
CIXI SUN TEXTILE SCIENCE AND TECHNOLOGY CO., LTD
textil santanderina SA
Soorty Enterprises (Pvt.) Ltd.
EGYPTIAN SPINNING & WEAVING (ESW)
UMORFIL Beauty Fiber
Kiron SA
BUT Srl
IMAGOROLA / Ricamificio A. ROLA srl
Department and position (optional)
CEO
Vice president
Management
SALES DEPARTMENT
COMMERCIAL DEPARTMENT
Edit this form
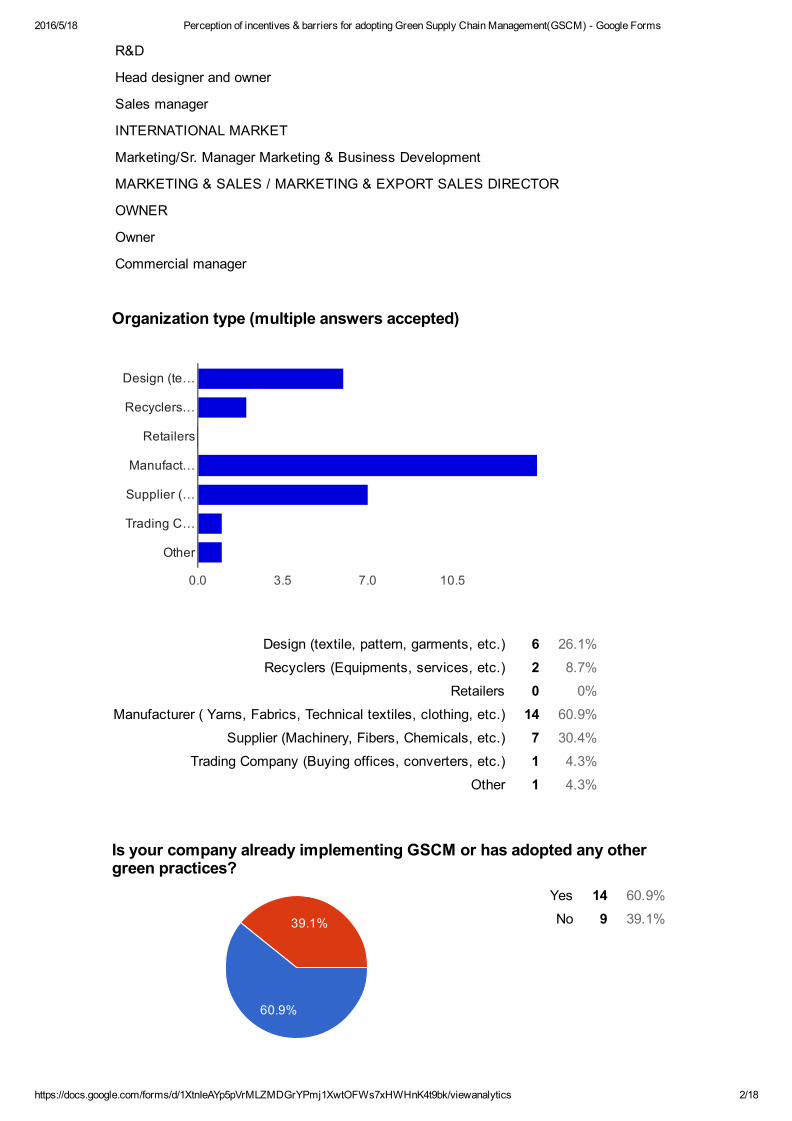
2016/5/18 Perception of incentives & barriers for adopting Green Supply Chain Management(GSCM) Google Forms
https://docs.google.com/forms/d/1XtnIeAYp5pVrMLZMDGrYPmj1XwtOFWs7xHWHnK4t9bk/viewanalytics 2/18
Design (textile, pattern, garments, etc.) 6 26.1%Recyclers (Equipments, services, etc.) 2 8.7%
Retailers 0 0%Manufacturer ( Yarns, Fabrics, Technical textiles, clothing, etc.) 14 60.9%
Supplier (Machinery, Fibers, Chemicals, etc.) 7 30.4%Trading Company (Buying offices, converters, etc.) 1 4.3%
Other 1 4.3%
Yes 14 60.9%No 9 39.1%
R&D
Head designer and owner
Sales manager
INTERNATIONAL MARKET
Marketing/Sr. Manager Marketing & Business Development
MARKETING & SALES / MARKETING & EXPORT SALES DIRECTOR
OWNER
Owner
Commercial manager
Organization type (multiple answers accepted)
Is your company already implementing GSCM or has adopted any othergreen practices?
0.0 3.5 7.0 10.5
Design (te…
Recyclers…
Retailers
Manufact…
Supplier (…
Trading C…
Other
39.1%
60.9%
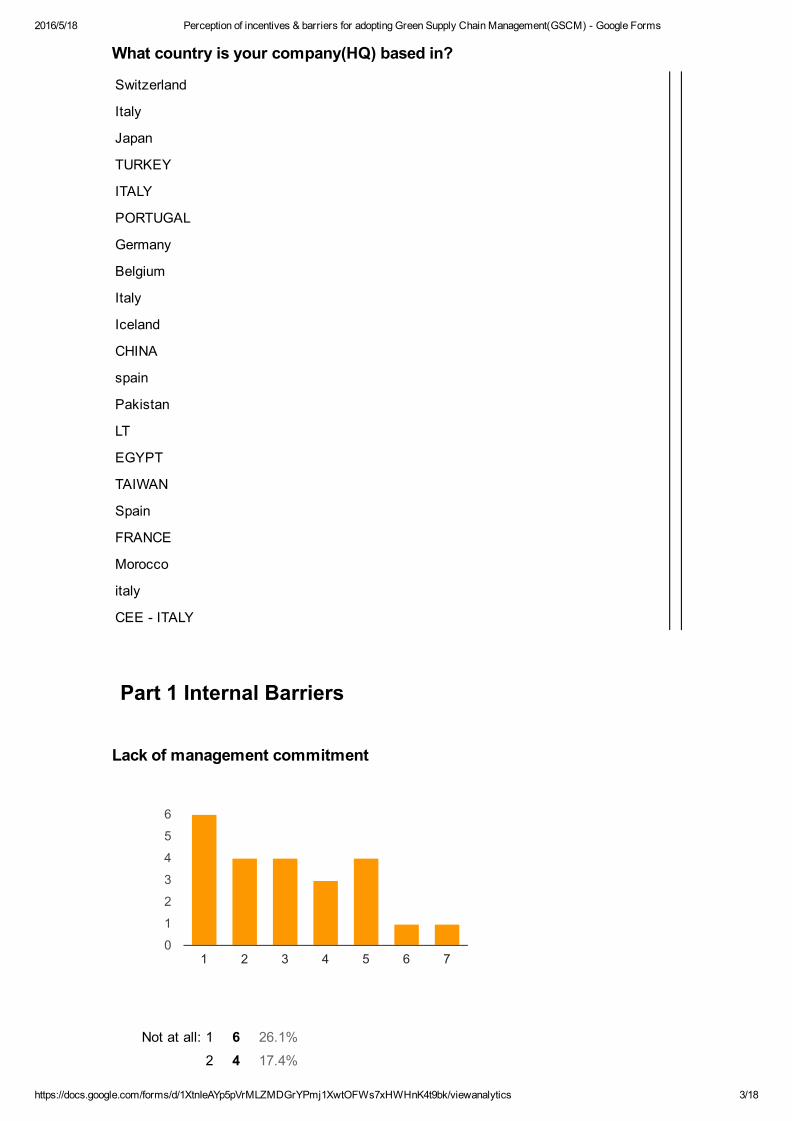
2016/5/18 Perception of incentives & barriers for adopting Green Supply Chain Management(GSCM) Google Forms
https://docs.google.com/forms/d/1XtnIeAYp5pVrMLZMDGrYPmj1XwtOFWs7xHWHnK4t9bk/viewanalytics 3/18
Not at all: 1 6 26.1%2 4 17.4%
What country is your company(HQ) based in?
Switzerland
Italy
Japan
TURKEY
ITALY
PORTUGAL
Germany
Belgium
Italy
Iceland
CHINA
spain
Pakistan
LT
EGYPT
TAIWAN
Spain
FRANCE
Morocco
italy
CEE ITALY
Part 1 Internal Barriers
Lack of management commitment
1 2 3 4 5 6 70
1
2
3
4
5
6
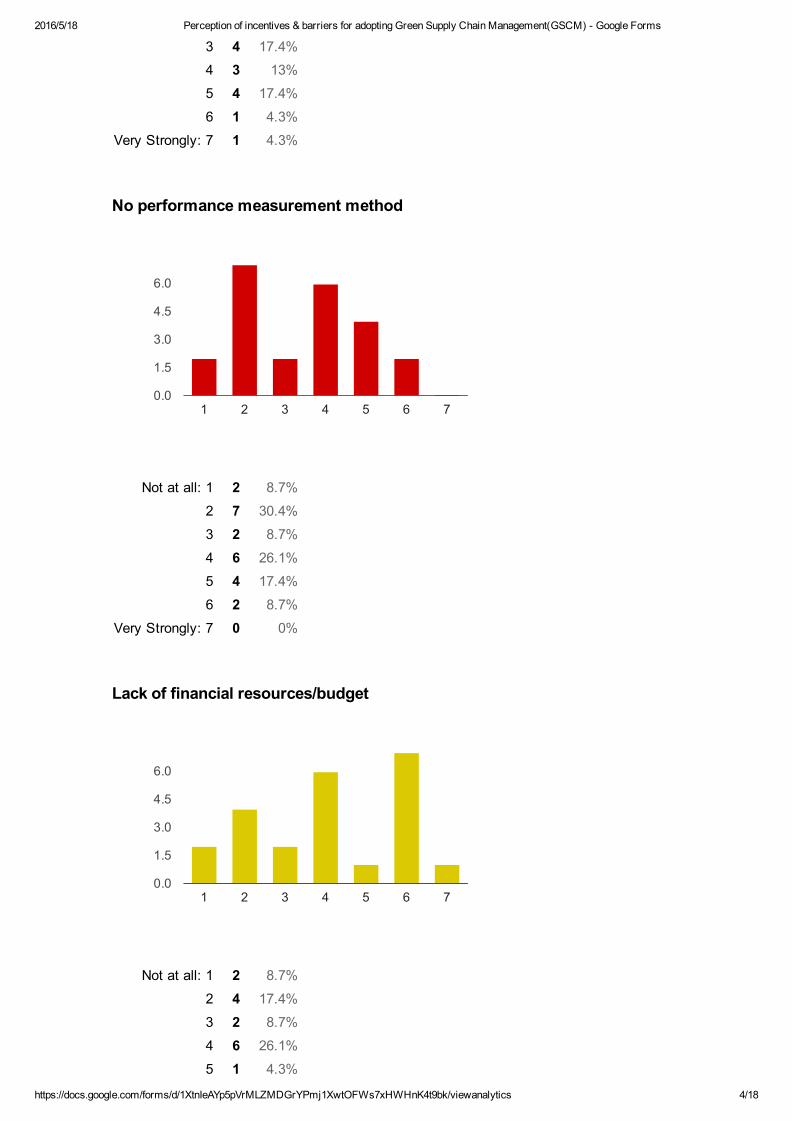
2016/5/18 Perception of incentives & barriers for adopting Green Supply Chain Management(GSCM) Google Forms
https://docs.google.com/forms/d/1XtnIeAYp5pVrMLZMDGrYPmj1XwtOFWs7xHWHnK4t9bk/viewanalytics 4/18
3 4 17.4%4 3 13%5 4 17.4%6 1 4.3%
Very Strongly: 7 1 4.3%
Not at all: 1 2 8.7%2 7 30.4%3 2 8.7%4 6 26.1%5 4 17.4%6 2 8.7%
Very Strongly: 7 0 0%
Not at all: 1 2 8.7%2 4 17.4%3 2 8.7%4 6 26.1%5 1 4.3%
No performance measurement method
Lack of financial resources/budget
1 2 3 4 5 6 70.0
1.5
3.0
4.5
6.0
1 2 3 4 5 6 70.0
1.5
3.0
4.5
6.0
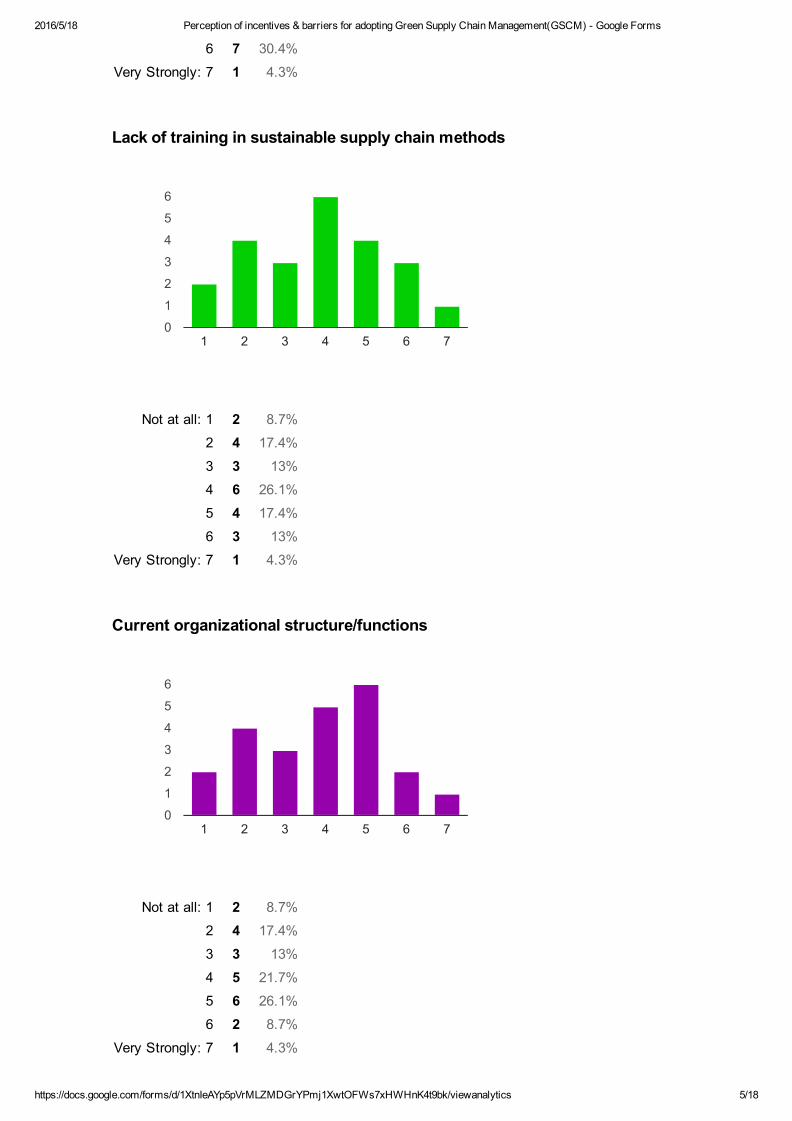
2016/5/18 Perception of incentives & barriers for adopting Green Supply Chain Management(GSCM) Google Forms
https://docs.google.com/forms/d/1XtnIeAYp5pVrMLZMDGrYPmj1XwtOFWs7xHWHnK4t9bk/viewanalytics 5/18
6 7 30.4%Very Strongly: 7 1 4.3%
Not at all: 1 2 8.7%2 4 17.4%3 3 13%4 6 26.1%5 4 17.4%6 3 13%
Very Strongly: 7 1 4.3%
Not at all: 1 2 8.7%2 4 17.4%3 3 13%4 5 21.7%5 6 26.1%6 2 8.7%
Very Strongly: 7 1 4.3%
Lack of training in sustainable supply chain methods
Current organizational structure/functions
1 2 3 4 5 6 70
1
2
3
4
5
6
1 2 3 4 5 6 70
1
2
3
4
5
6
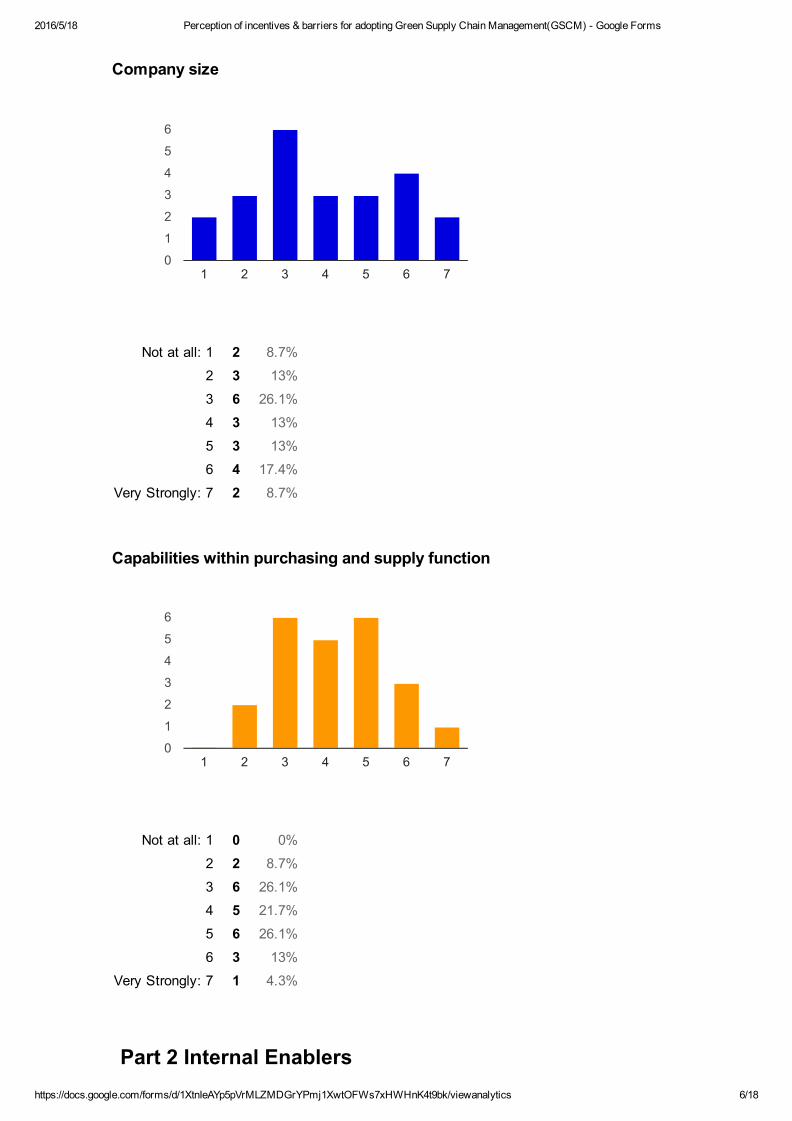
2016/5/18 Perception of incentives & barriers for adopting Green Supply Chain Management(GSCM) Google Forms
https://docs.google.com/forms/d/1XtnIeAYp5pVrMLZMDGrYPmj1XwtOFWs7xHWHnK4t9bk/viewanalytics 6/18
Not at all: 1 2 8.7%2 3 13%3 6 26.1%4 3 13%5 3 13%6 4 17.4%
Very Strongly: 7 2 8.7%
Not at all: 1 0 0%2 2 8.7%3 6 26.1%4 5 21.7%5 6 26.1%6 3 13%
Very Strongly: 7 1 4.3%
Company size
Capabilities within purchasing and supply function
Part 2 Internal Enablers
1 2 3 4 5 6 70
1
2
3
4
5
6
1 2 3 4 5 6 70
1
2
3
4
5
6
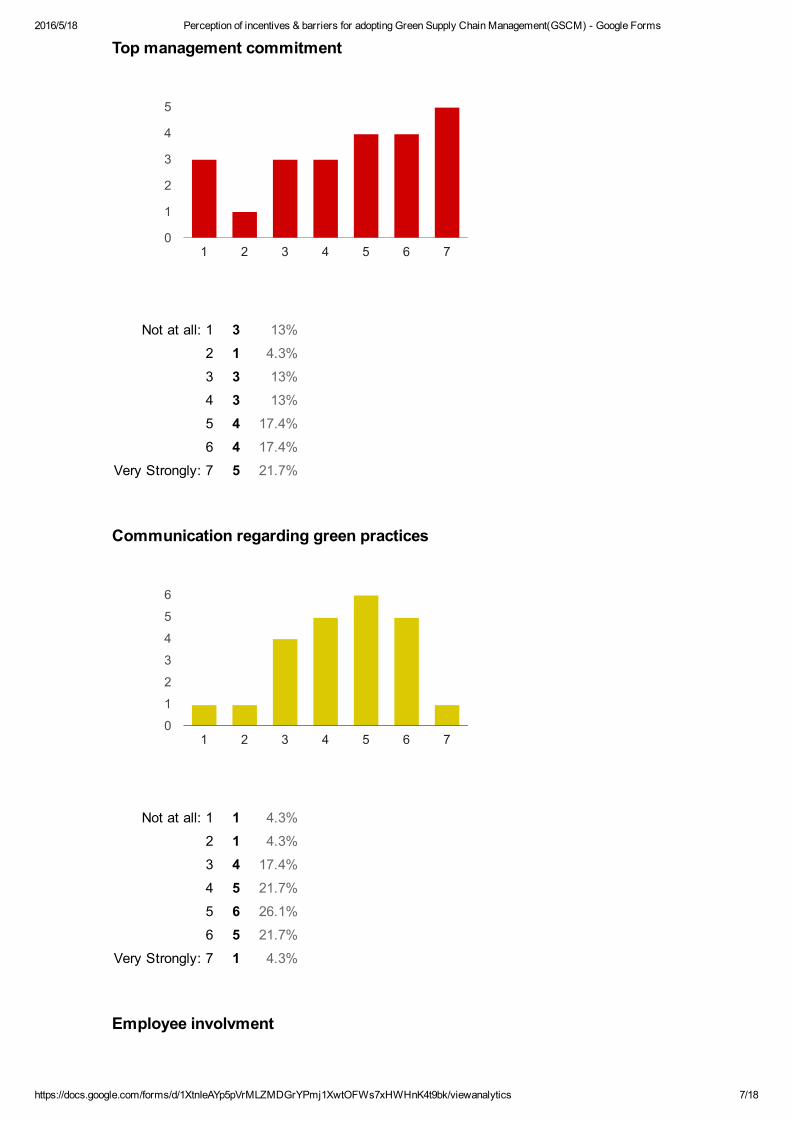
2016/5/18 Perception of incentives & barriers for adopting Green Supply Chain Management(GSCM) Google Forms
https://docs.google.com/forms/d/1XtnIeAYp5pVrMLZMDGrYPmj1XwtOFWs7xHWHnK4t9bk/viewanalytics 7/18
Not at all: 1 3 13%2 1 4.3%3 3 13%4 3 13%5 4 17.4%6 4 17.4%
Very Strongly: 7 5 21.7%
Not at all: 1 1 4.3%2 1 4.3%3 4 17.4%4 5 21.7%5 6 26.1%6 5 21.7%
Very Strongly: 7 1 4.3%
Top management commitment
Communication regarding green practices
Employee involvment
1 2 3 4 5 6 70
1
2
3
4
5
1 2 3 4 5 6 70
1
2
3
4
5
6
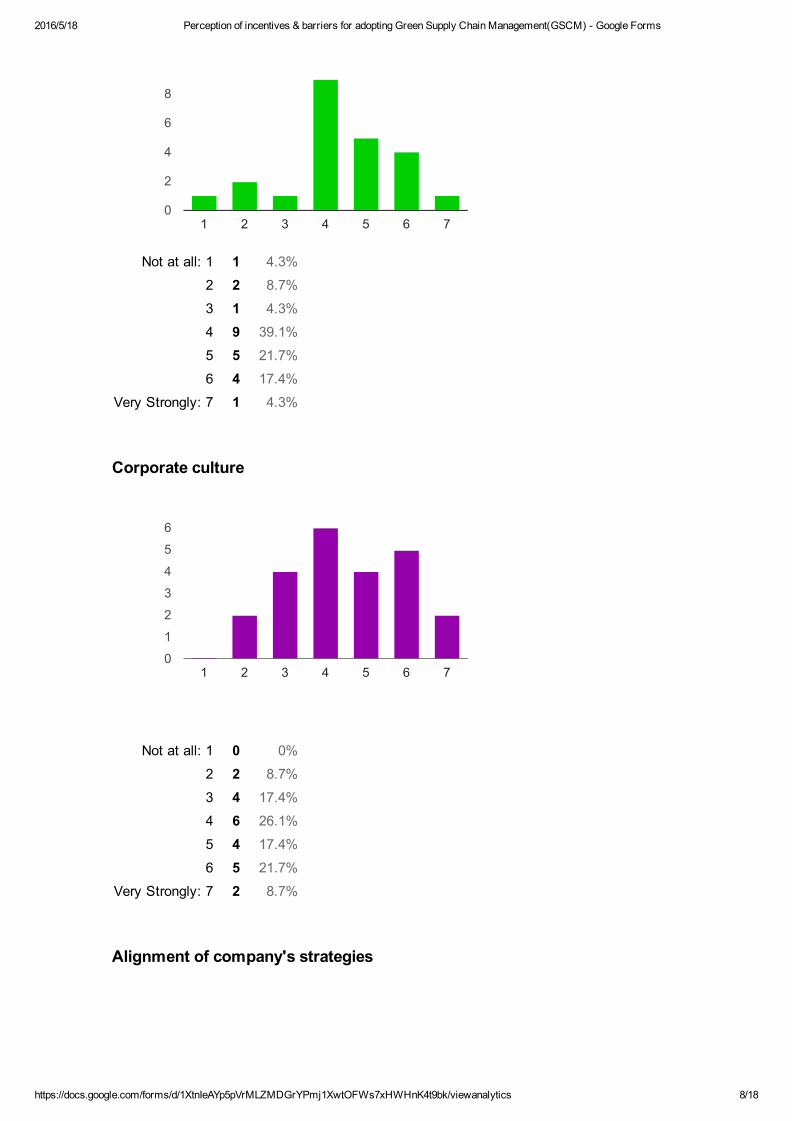
2016/5/18 Perception of incentives & barriers for adopting Green Supply Chain Management(GSCM) Google Forms
https://docs.google.com/forms/d/1XtnIeAYp5pVrMLZMDGrYPmj1XwtOFWs7xHWHnK4t9bk/viewanalytics 8/18
Not at all: 1 1 4.3%2 2 8.7%3 1 4.3%4 9 39.1%5 5 21.7%6 4 17.4%
Very Strongly: 7 1 4.3%
Not at all: 1 0 0%2 2 8.7%3 4 17.4%4 6 26.1%5 4 17.4%6 5 21.7%
Very Strongly: 7 2 8.7%
Corporate culture
Alignment of company's strategies
1 2 3 4 5 6 70
2
4
6
8
1 2 3 4 5 6 70
1
2
3
4
5
6
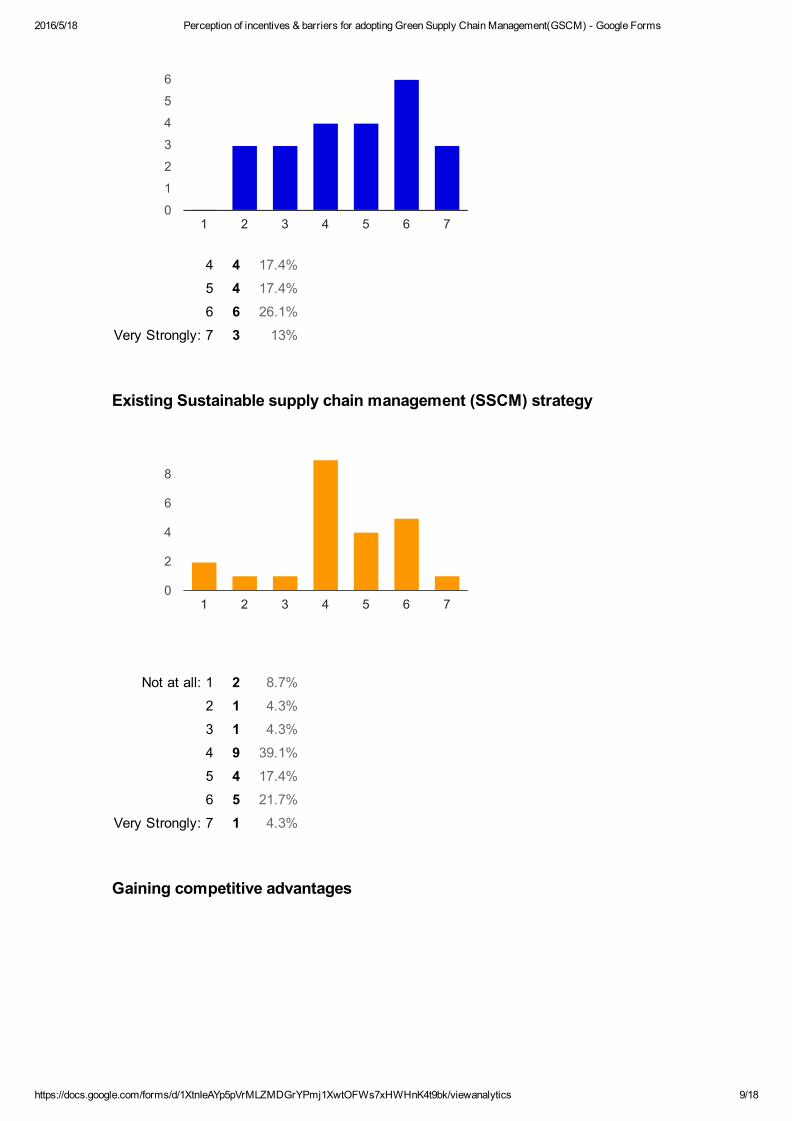
2016/5/18 Perception of incentives & barriers for adopting Green Supply Chain Management(GSCM) Google Forms
https://docs.google.com/forms/d/1XtnIeAYp5pVrMLZMDGrYPmj1XwtOFWs7xHWHnK4t9bk/viewanalytics 9/18
Not at all: 1 0 0%2 3 13%3 3 13%4 4 17.4%5 4 17.4%6 6 26.1%
Very Strongly: 7 3 13%
Not at all: 1 2 8.7%2 1 4.3%3 1 4.3%4 9 39.1%5 4 17.4%6 5 21.7%
Very Strongly: 7 1 4.3%
Existing Sustainable supply chain management (SSCM) strategy
Gaining competitive advantages
1 2 3 4 5 6 70
1
2
3
4
5
6
1 2 3 4 5 6 70
2
4
6
8
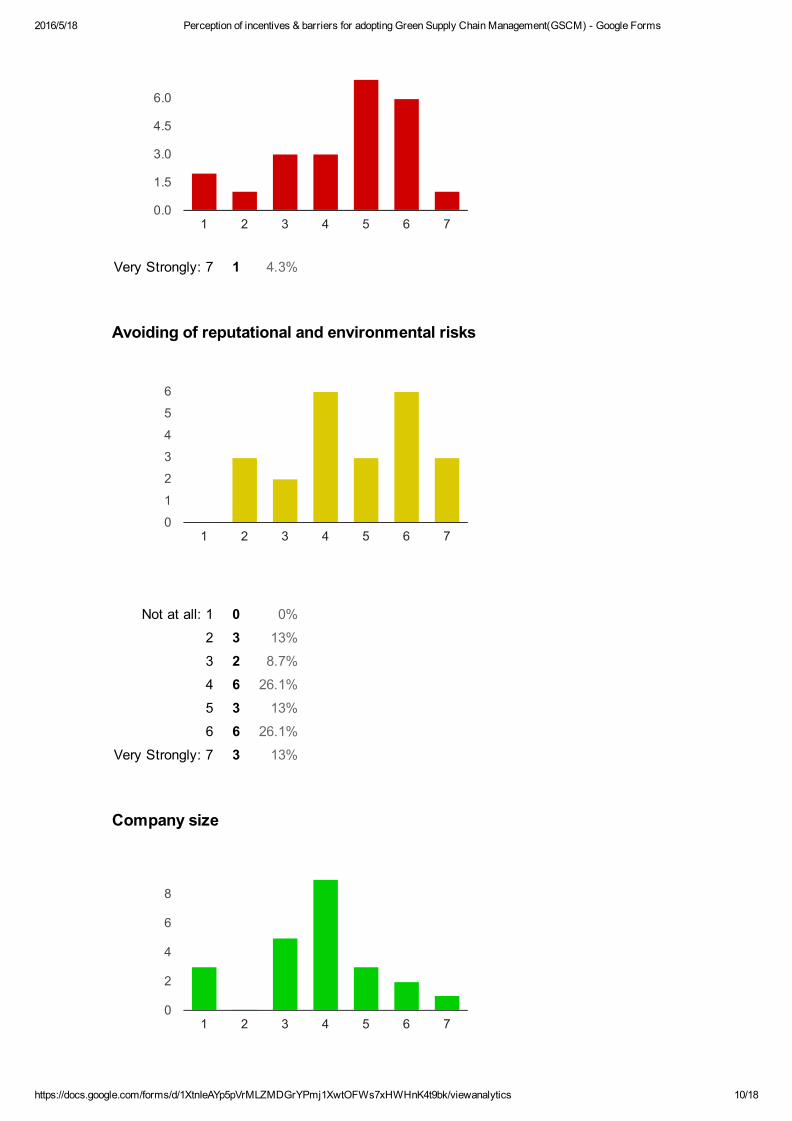
2016/5/18 Perception of incentives & barriers for adopting Green Supply Chain Management(GSCM) Google Forms
https://docs.google.com/forms/d/1XtnIeAYp5pVrMLZMDGrYPmj1XwtOFWs7xHWHnK4t9bk/viewanalytics 10/18
Not at all: 1 2 8.7%2 1 4.3%3 3 13%4 3 13%5 7 30.4%6 6 26.1%
Very Strongly: 7 1 4.3%
Not at all: 1 0 0%2 3 13%3 2 8.7%4 6 26.1%5 3 13%6 6 26.1%
Very Strongly: 7 3 13%
Avoiding of reputational and environmental risks
Company size
1 2 3 4 5 6 70.0
1.5
3.0
4.5
6.0
1 2 3 4 5 6 70
1
2
3
4
5
6
1 2 3 4 5 6 70
2
4
6
8
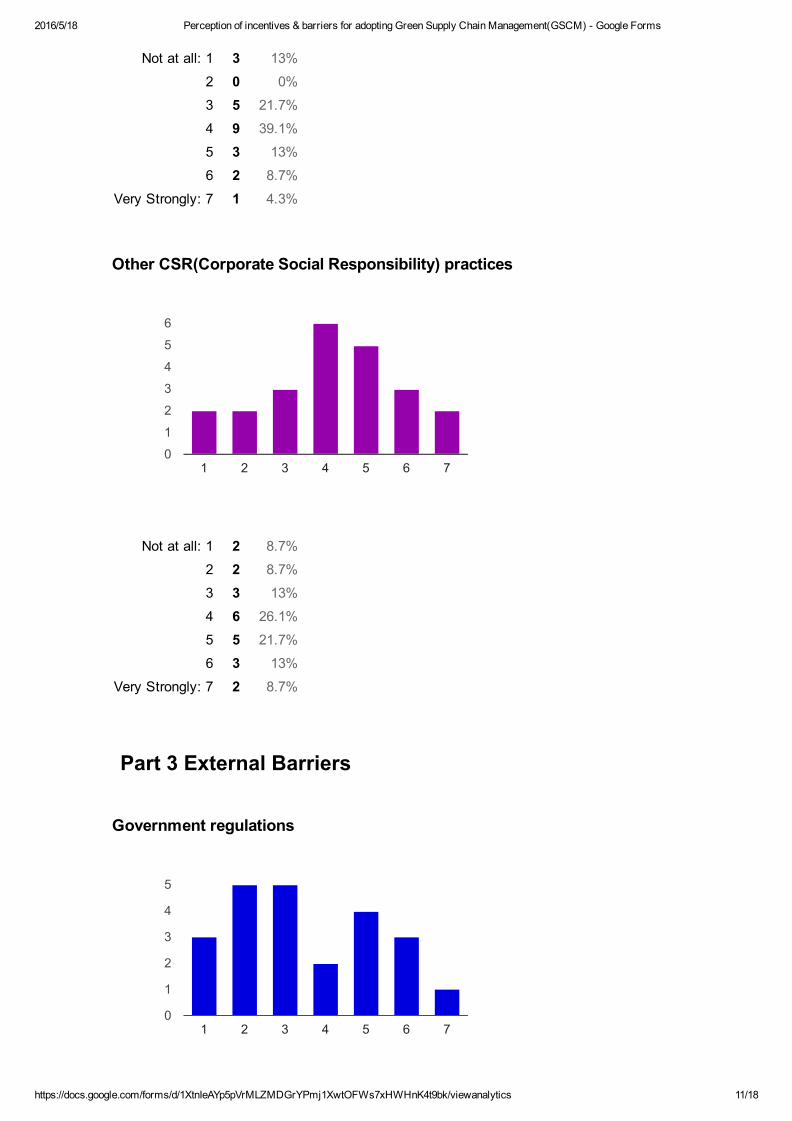
2016/5/18 Perception of incentives & barriers for adopting Green Supply Chain Management(GSCM) Google Forms
https://docs.google.com/forms/d/1XtnIeAYp5pVrMLZMDGrYPmj1XwtOFWs7xHWHnK4t9bk/viewanalytics 11/18
Not at all: 1 3 13%2 0 0%3 5 21.7%4 9 39.1%5 3 13%6 2 8.7%
Very Strongly: 7 1 4.3%
Not at all: 1 2 8.7%2 2 8.7%3 3 13%4 6 26.1%5 5 21.7%6 3 13%
Very Strongly: 7 2 8.7%
Other CSR(Corporate Social Responsibility) practices
Part 3 External Barriers
Government regulations
1 2 3 4 5 6 70
1
2
3
4
5
6
1 2 3 4 5 6 70
1
2
3
4
5
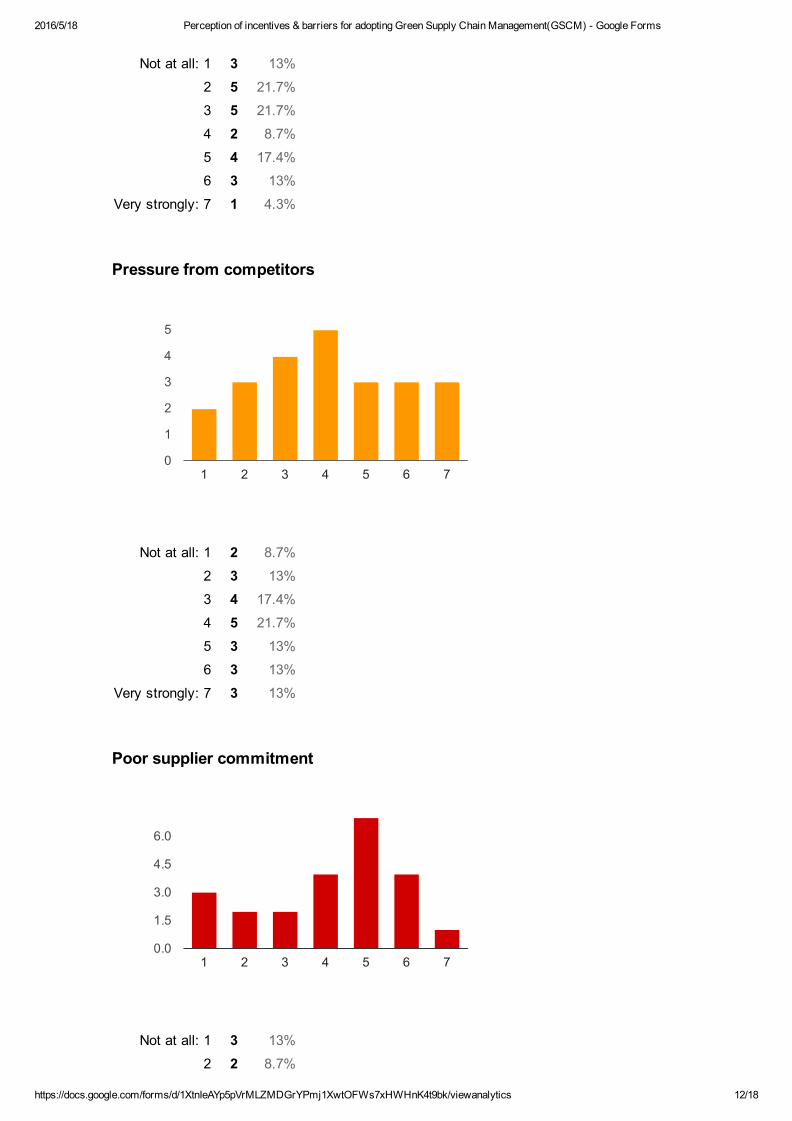
2016/5/18 Perception of incentives & barriers for adopting Green Supply Chain Management(GSCM) Google Forms
https://docs.google.com/forms/d/1XtnIeAYp5pVrMLZMDGrYPmj1XwtOFWs7xHWHnK4t9bk/viewanalytics 12/18
Not at all: 1 3 13%2 5 21.7%3 5 21.7%4 2 8.7%5 4 17.4%6 3 13%
Very strongly: 7 1 4.3%
Not at all: 1 2 8.7%2 3 13%3 4 17.4%4 5 21.7%5 3 13%6 3 13%
Very strongly: 7 3 13%
Not at all: 1 3 13%2 2 8.7%
Pressure from competitors
Poor supplier commitment
1 2 3 4 5 6 70
1
2
3
4
5
1 2 3 4 5 6 70.0
1.5
3.0
4.5
6.0
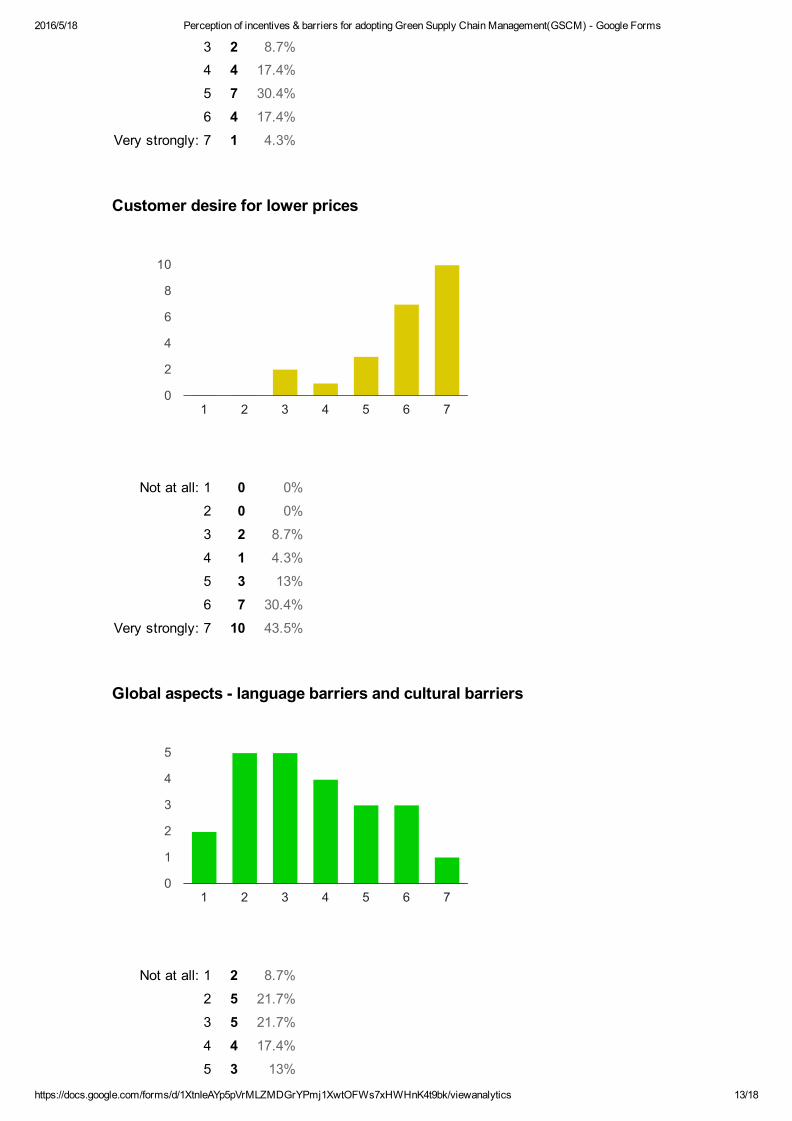
2016/5/18 Perception of incentives & barriers for adopting Green Supply Chain Management(GSCM) Google Forms
https://docs.google.com/forms/d/1XtnIeAYp5pVrMLZMDGrYPmj1XwtOFWs7xHWHnK4t9bk/viewanalytics 13/18
3 2 8.7%4 4 17.4%5 7 30.4%6 4 17.4%
Very strongly: 7 1 4.3%
Not at all: 1 0 0%2 0 0%3 2 8.7%4 1 4.3%5 3 13%6 7 30.4%
Very strongly: 7 10 43.5%
Not at all: 1 2 8.7%2 5 21.7%3 5 21.7%4 4 17.4%5 3 13%
Customer desire for lower prices
Global aspects language barriers and cultural barriers
1 2 3 4 5 6 70
2
4
6
8
10
1 2 3 4 5 6 70
1
2
3
4
5
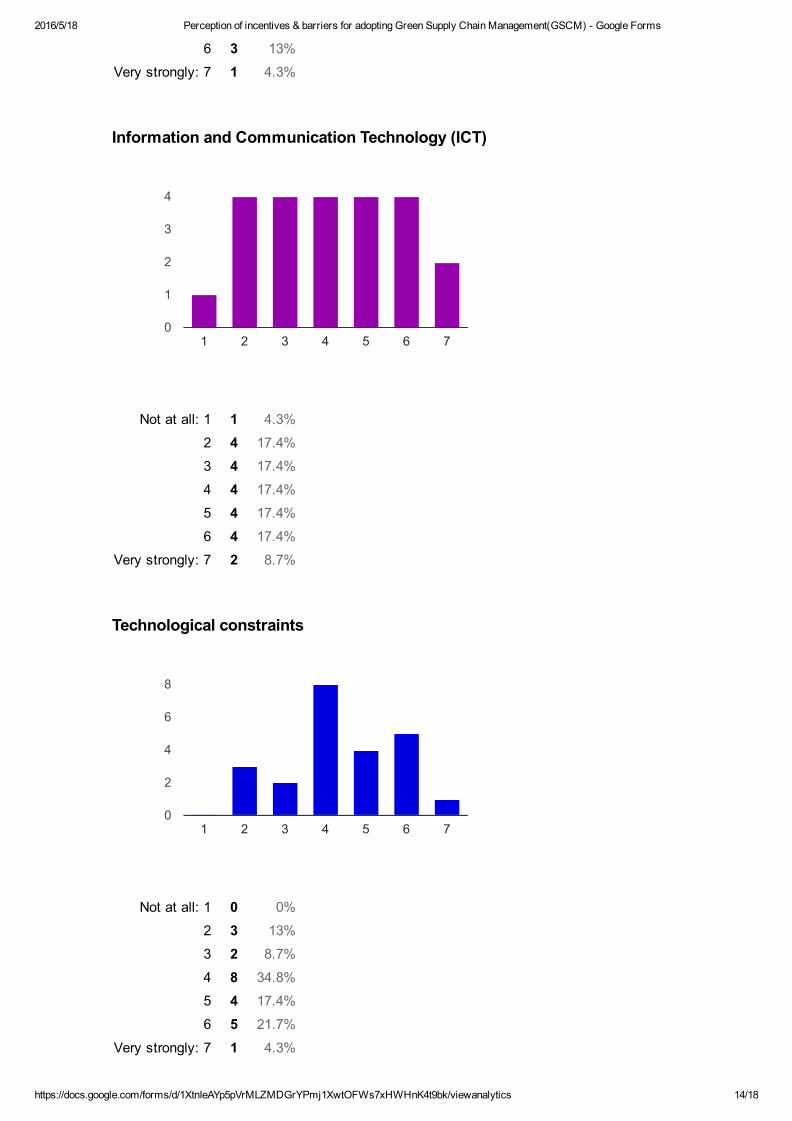
2016/5/18 Perception of incentives & barriers for adopting Green Supply Chain Management(GSCM) Google Forms
https://docs.google.com/forms/d/1XtnIeAYp5pVrMLZMDGrYPmj1XwtOFWs7xHWHnK4t9bk/viewanalytics 14/18
6 3 13%Very strongly: 7 1 4.3%
Not at all: 1 1 4.3%2 4 17.4%3 4 17.4%4 4 17.4%5 4 17.4%6 4 17.4%
Very strongly: 7 2 8.7%
Not at all: 1 0 0%2 3 13%3 2 8.7%4 8 34.8%5 4 17.4%6 5 21.7%
Very strongly: 7 1 4.3%
Information and Communication Technology (ICT)
Technological constraints
1 2 3 4 5 6 70
1
2
3
4
1 2 3 4 5 6 70
2
4
6
8
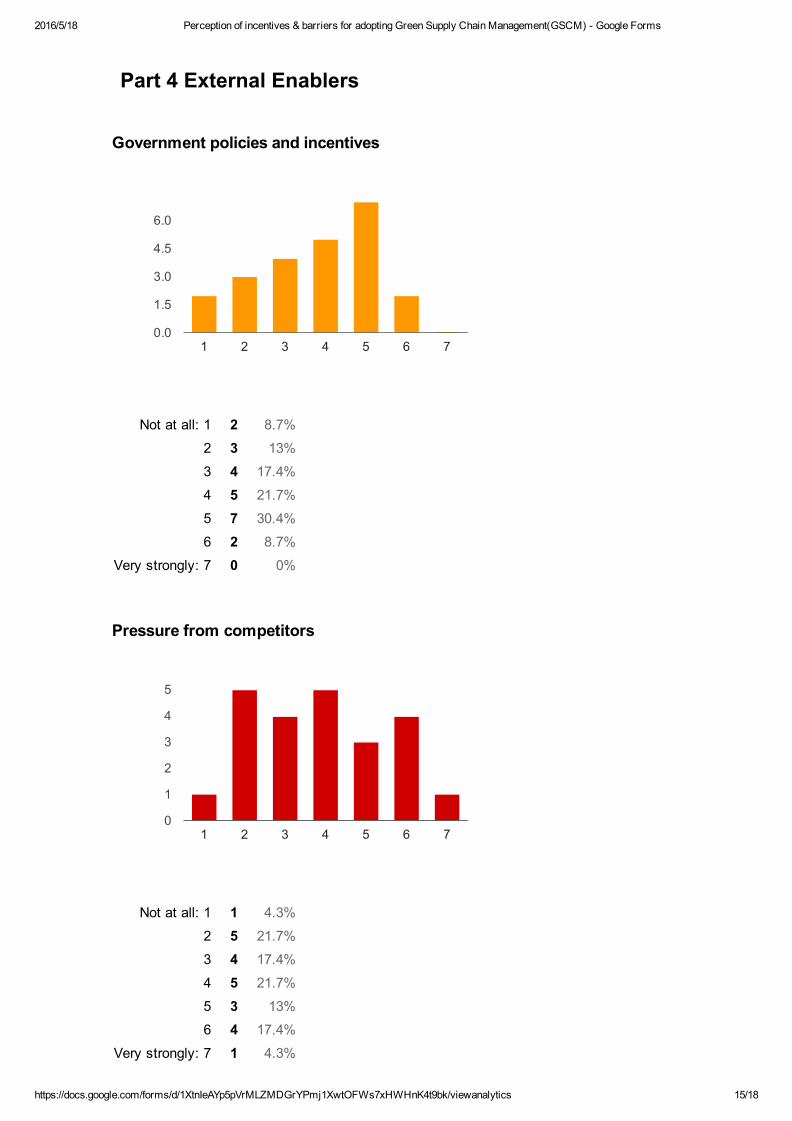
2016/5/18 Perception of incentives & barriers for adopting Green Supply Chain Management(GSCM) Google Forms
https://docs.google.com/forms/d/1XtnIeAYp5pVrMLZMDGrYPmj1XwtOFWs7xHWHnK4t9bk/viewanalytics 15/18
Not at all: 1 2 8.7%2 3 13%3 4 17.4%4 5 21.7%5 7 30.4%6 2 8.7%
Very strongly: 7 0 0%
Not at all: 1 1 4.3%2 5 21.7%3 4 17.4%4 5 21.7%5 3 13%6 4 17.4%
Very strongly: 7 1 4.3%
Part 4 External Enablers
Government policies and incentives
Pressure from competitors
1 2 3 4 5 6 70.0
1.5
3.0
4.5
6.0
1 2 3 4 5 6 70
1
2
3
4
5
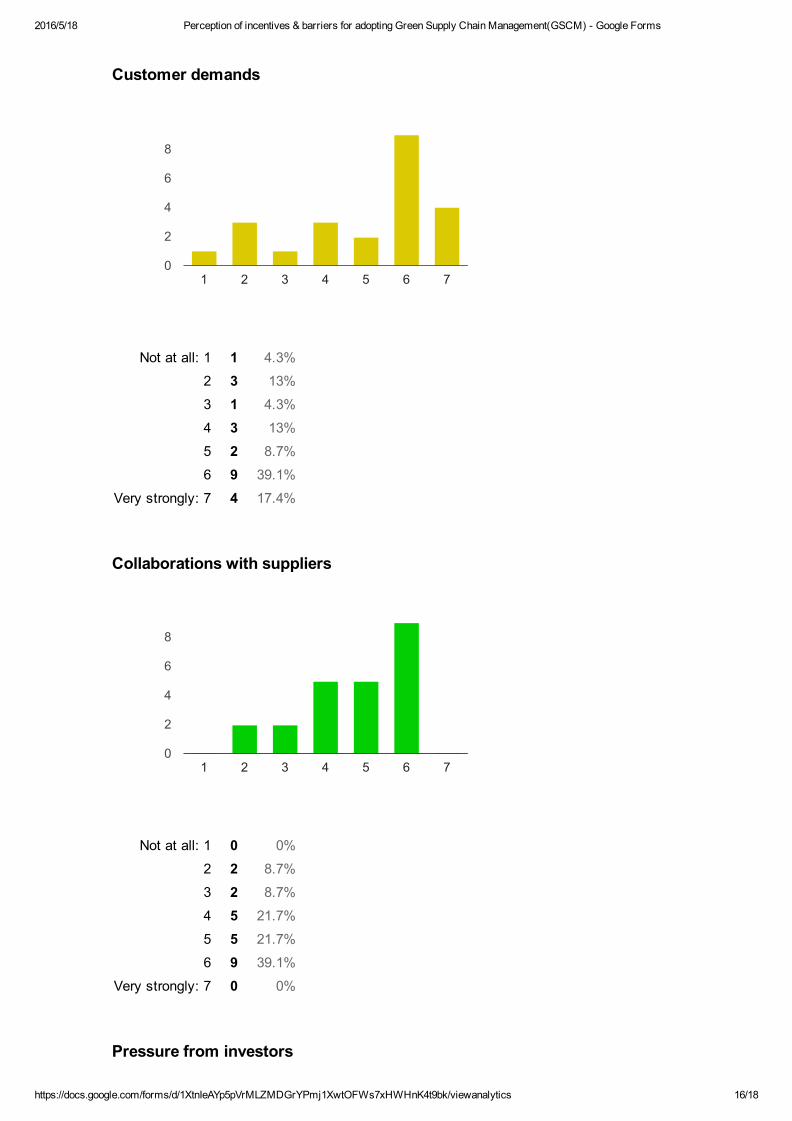
2016/5/18 Perception of incentives & barriers for adopting Green Supply Chain Management(GSCM) Google Forms
https://docs.google.com/forms/d/1XtnIeAYp5pVrMLZMDGrYPmj1XwtOFWs7xHWHnK4t9bk/viewanalytics 16/18
Not at all: 1 1 4.3%2 3 13%3 1 4.3%4 3 13%5 2 8.7%6 9 39.1%
Very strongly: 7 4 17.4%
Not at all: 1 0 0%2 2 8.7%3 2 8.7%4 5 21.7%5 5 21.7%6 9 39.1%
Very strongly: 7 0 0%
Customer demands
Collaborations with suppliers
Pressure from investors
1 2 3 4 5 6 70
2
4
6
8
1 2 3 4 5 6 70
2
4
6
8
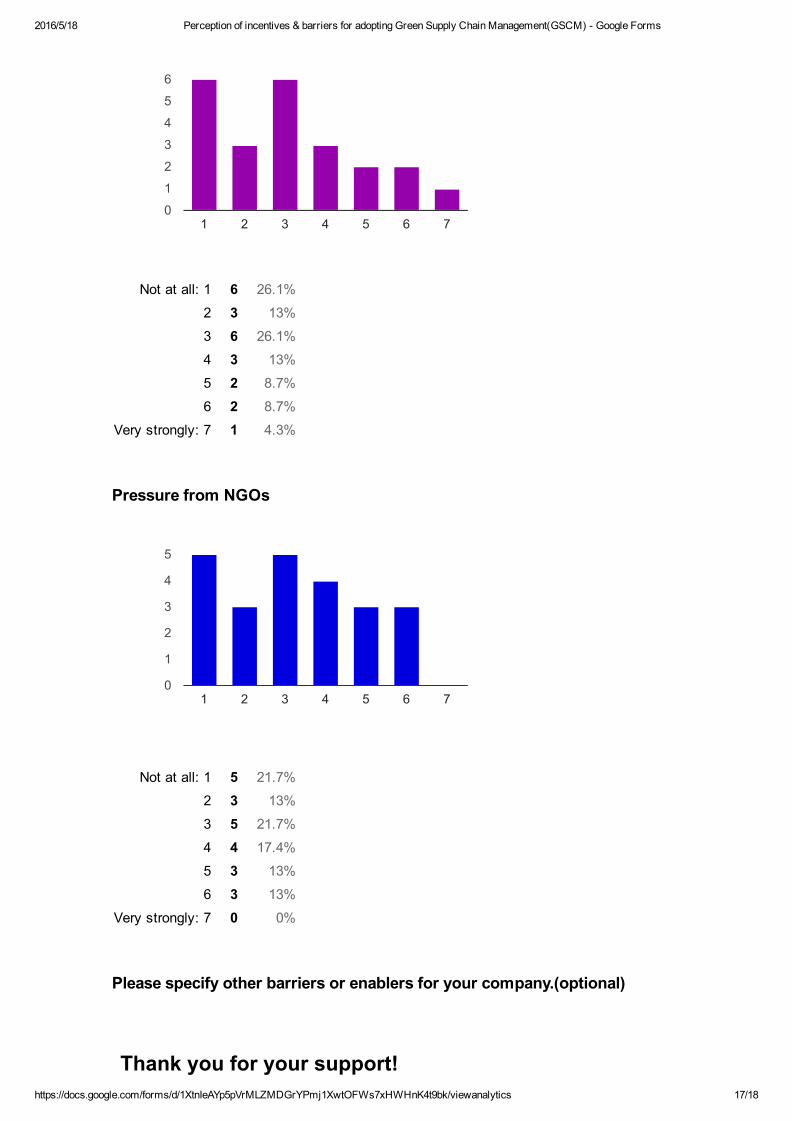
2016/5/18 Perception of incentives & barriers for adopting Green Supply Chain Management(GSCM) Google Forms
https://docs.google.com/forms/d/1XtnIeAYp5pVrMLZMDGrYPmj1XwtOFWs7xHWHnK4t9bk/viewanalytics 17/18
Not at all: 1 6 26.1%2 3 13%3 6 26.1%4 3 13%5 2 8.7%6 2 8.7%
Very strongly: 7 1 4.3%
Not at all: 1 5 21.7%2 3 13%3 5 21.7%4 4 17.4%5 3 13%6 3 13%
Very strongly: 7 0 0%
Pressure from NGOs
Please specify other barriers or enablers for your company.(optional)
Thank you for your support!
1 2 3 4 5 6 70
1
2
3
4
5
6
1 2 3 4 5 6 70
1
2
3
4
5

2016/5/18 Perception of incentives & barriers for adopting Green Supply Chain Management(GSCM) Google Forms
https://docs.google.com/forms/d/1XtnIeAYp5pVrMLZMDGrYPmj1XwtOFWs7xHWHnK4t9bk/viewanalytics 18/18
Number of daily responses
0
2
4
6
8