Embed Size (px)
DESCRIPTION
Green shoots or weeds?. Robert Gardner, Head of Macroeconomics. What to expect in the next 30 mins: an RBS double-act. Robert: A simple framework for thinking about the future An evaluation of the options Our view.... Peter: A closer look at the Nordic region Q&A. - PowerPoint PPT Presentation
Citation preview
Green shoots or weeds? Robert Gardner, Head of Macroeconomics
Slide 2
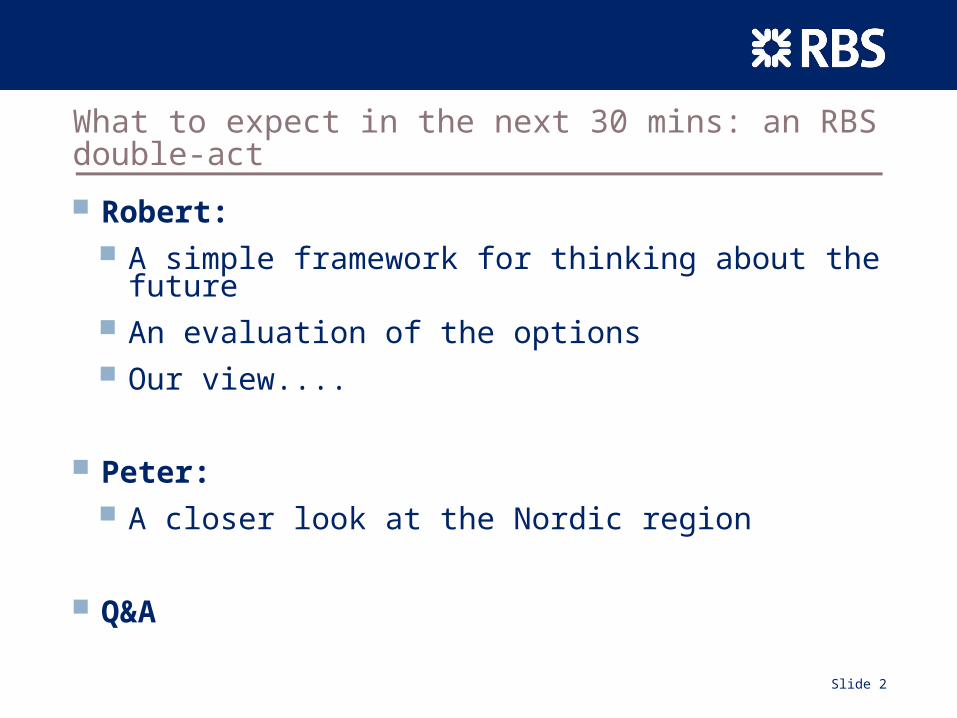
What to expect in the next 30 mins: an RBS double-act
Robert: A simple framework for thinking about the future An evaluation of the options Our view....
Peter: A closer look at the Nordic region
Q&A
Slide 3
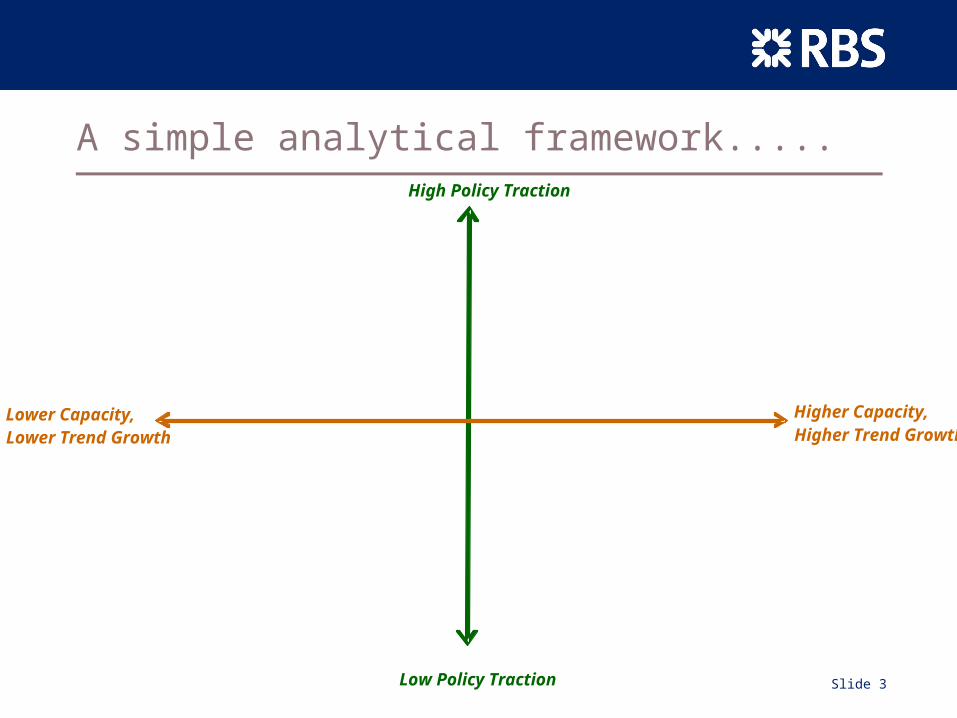
A simple analytical framework.....
Higher Capacity, Higher Trend Growth
Lower Capacity, Lower Trend Growth
High Policy Traction
Low Policy Traction
Slide 4
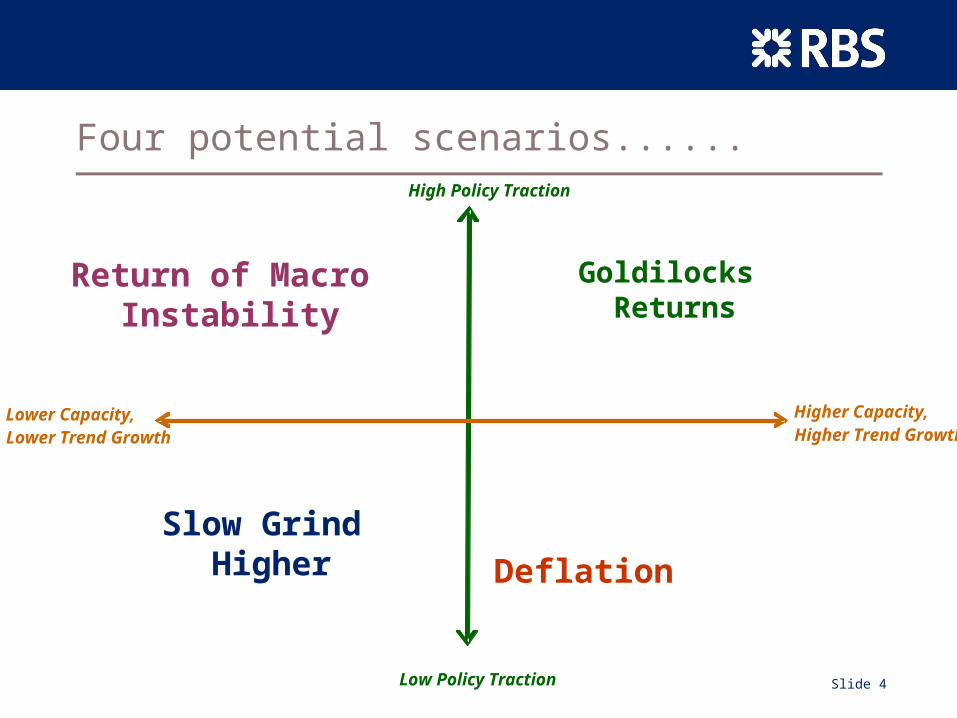
Four potential scenarios......
Slow Grind Higher
Return of Macro Instability
Goldilocks Returns
Deflation
Higher Capacity, Higher Trend Growth
Lower Capacity, Lower Trend Growth
High Policy Traction
Low Policy Traction
Slide 5
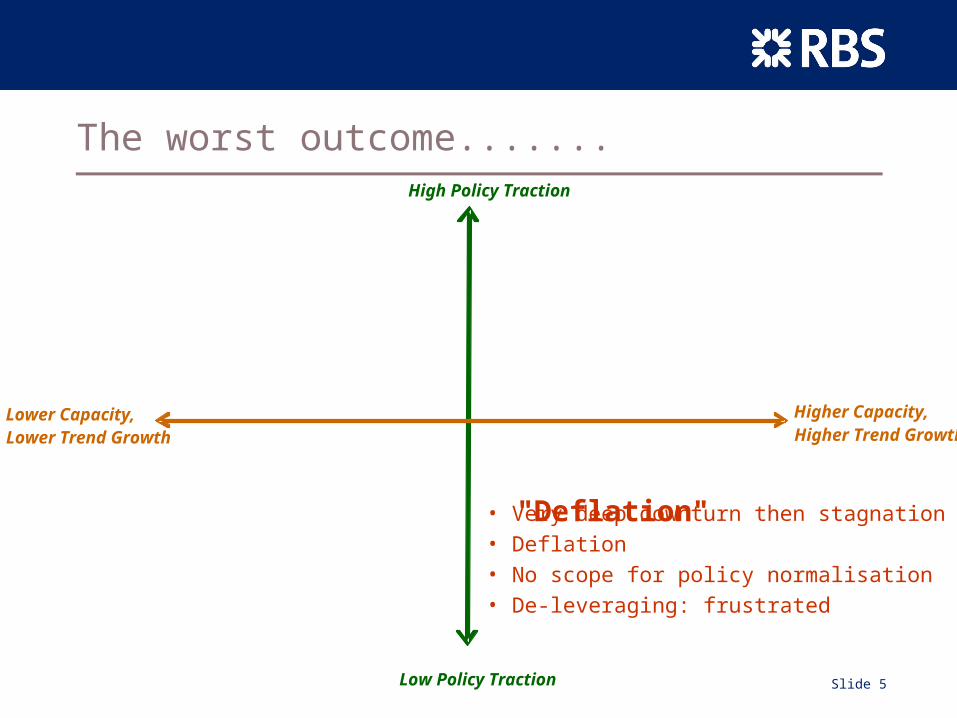
The worst outcome.......
"Deflation"• Very deep downturn then stagnation• Deflation• No scope for policy normalisation• De-leveraging: frustrated
Higher Capacity, Higher Trend Growth
Lower Capacity, Lower Trend Growth
High Policy Traction
Low Policy Traction

Slide 6
Disaster Avoided?
Slide 7
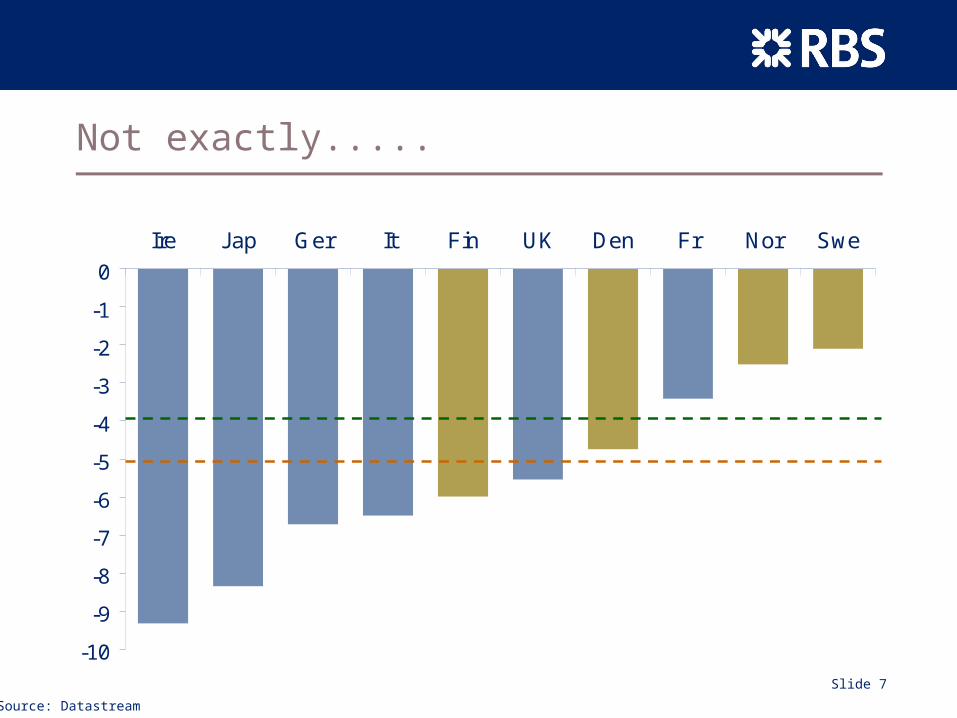
Not exactly.....
-10
-9
-8
-7
-6
-5
-4
-3
-2
-1
0
Ire Jap Ger It Fin UK Den Fr Nor Swe
Eurozone Average
United States
Peak to Trough Decline in GDP (Percentage Points)
Source: Datastream
Slide 8
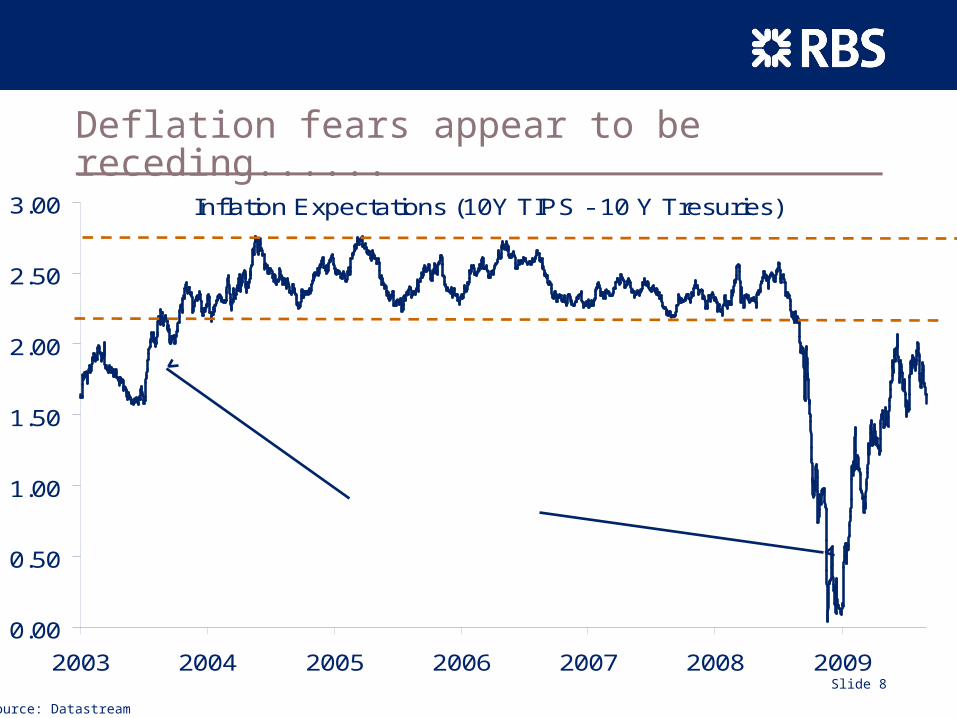
Deflation fears appear to be receding......
Inflation Expectations (10Y TIPS - 10 Y Tresuries)
0.00
0.50
1.00
1.50
2.00
2.50
3.00
2003 2004 2005 2006 2007 2008 2009
Deflation Scares
Source: Datastream
Slide 9
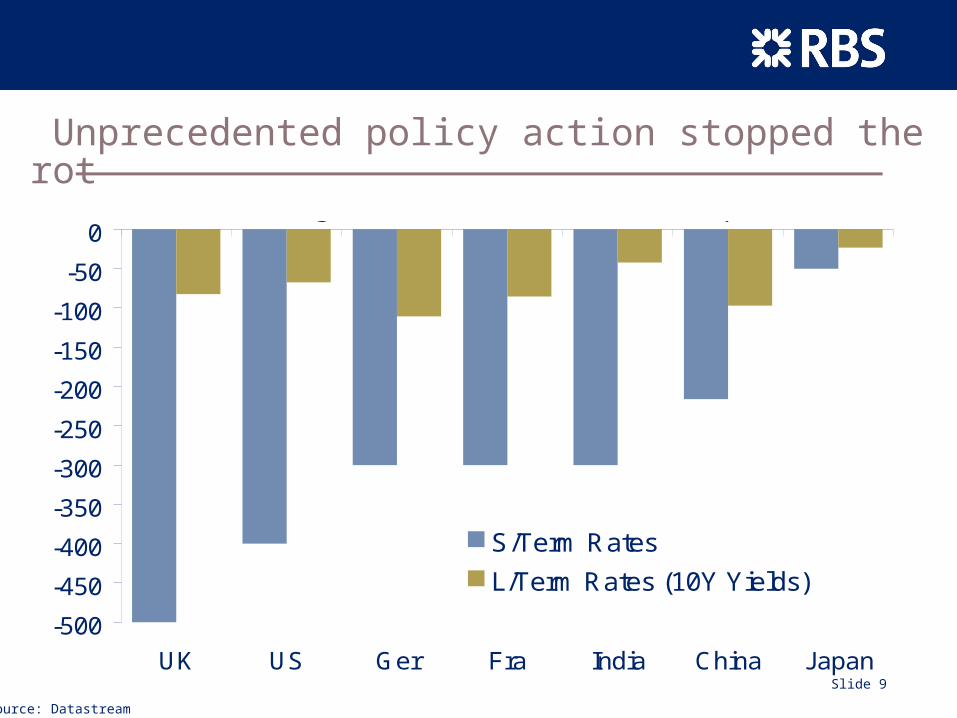
Unprecedented policy action stopped the rot
-500
-450
-400
-350
-300
-250
-200
-150
-100
-50
0
UK US Ger Fra India China Japan
S/Term Rates
L/Term Rates (10Y Yields)
Change in Interest Rates (2007-2009, bps)
Source: Datastream
Slide 10
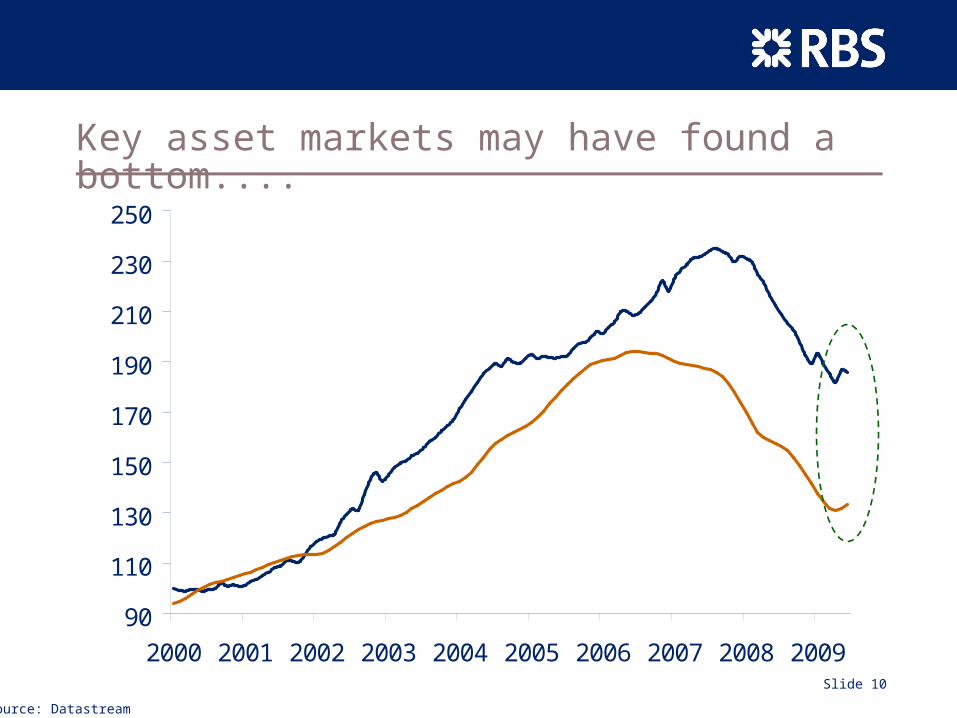
Key asset markets may have found a bottom....
90
110
130
150
170
190
210
230
250
2000 2001 2002 2003 2004 2005 2006 2007 2008 2009
House Prices (Index, 2000=100) UK
US
Stabilisation?
Source: Datastream
Slide 11
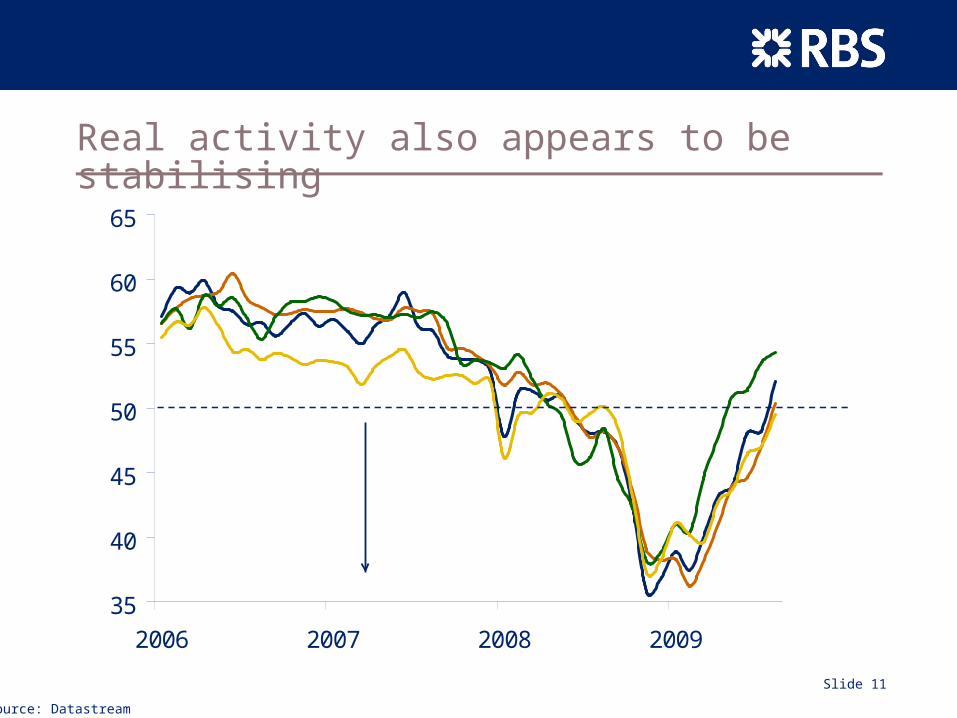
Real activity also appears to be stabilising
35
40
45
50
55
60
65
2006 2007 2008 2009
World
UK
EZ
US
Contraction
Global Purchasing Managers Indicators (Index, >50 = expansion)
Source: Datastream

Slide 12
Goldilocks Returns?
Slide 13
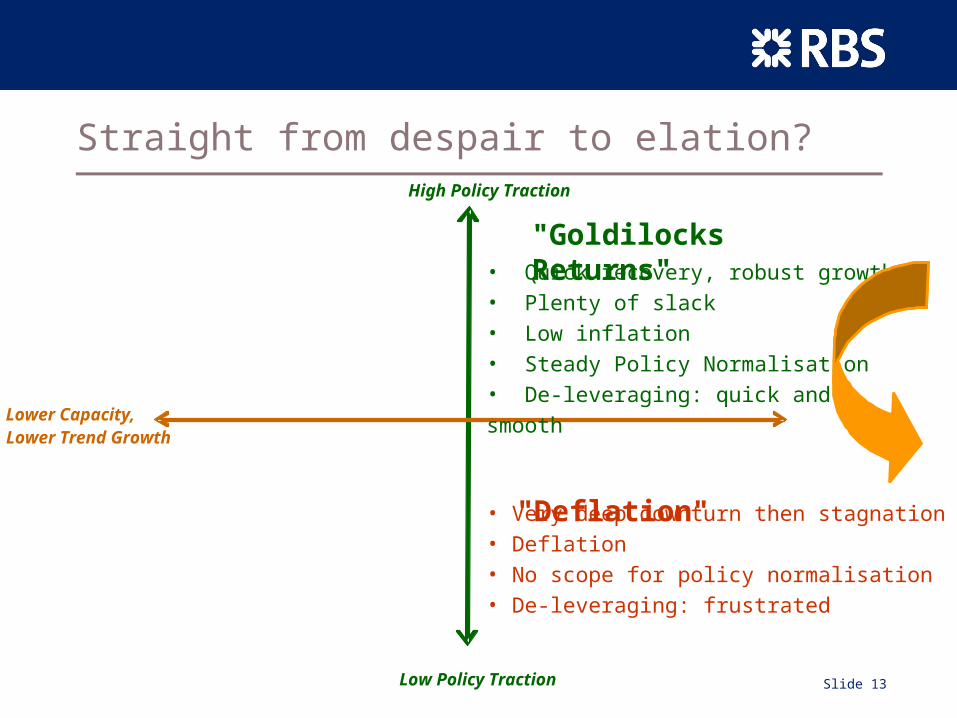
Straight from despair to elation?
"Goldilocks Returns"
"Deflation"• Very deep downturn then stagnation• Deflation• No scope for policy normalisation• De-leveraging: frustrated
Lower Capacity, Lower Trend Growth
High Policy Traction
Low Policy Traction
• Quick recovery, robust growth • Plenty of slack• Low inflation• Steady Policy Normalisation• De-leveraging: quick and smooth
Slide 14
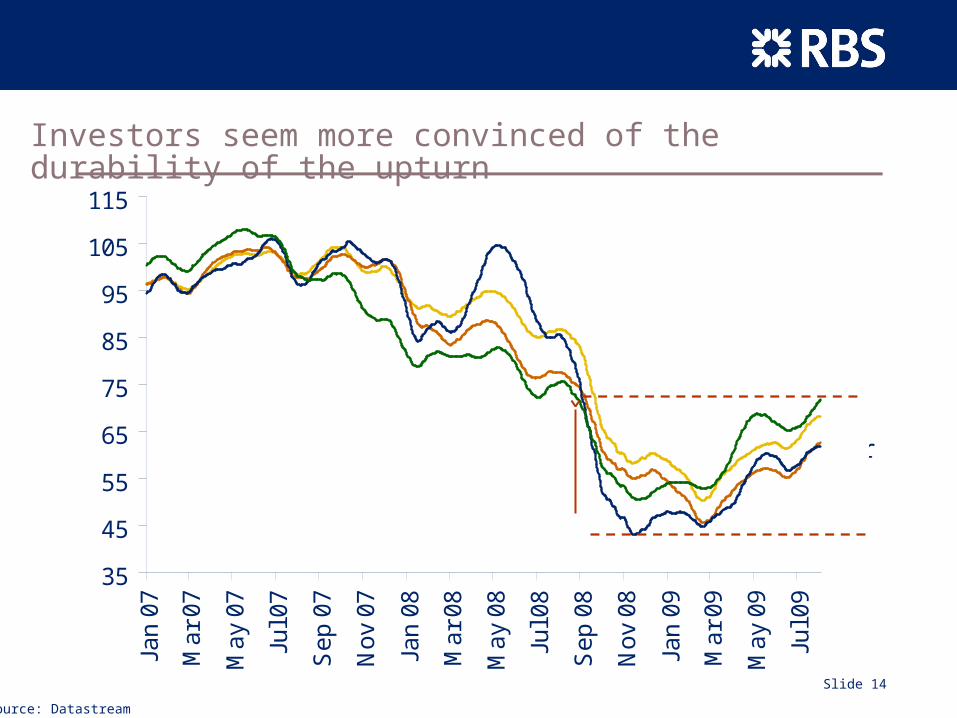
Investors seem more convinced of the durability of the upturn
35
45
55
65
75
85
95
105
115
Jan
07
Ma
r 0
7
Ma
y 0
7
Jul 0
7
Se
p 0
7
No
v 0
7
Jan
08
Ma
r 0
8
Ma
y 0
8
Jul 0
8
Se
p 0
8
No
v 0
8
Jan
09
Ma
r 0
9
Ma
y 0
9
Jul 0
9
Equity Market Performance (Index 2007 = 100)
Swe
USNorEZKey indices up by 40% to 65%
Source: Datastream
Slide 15
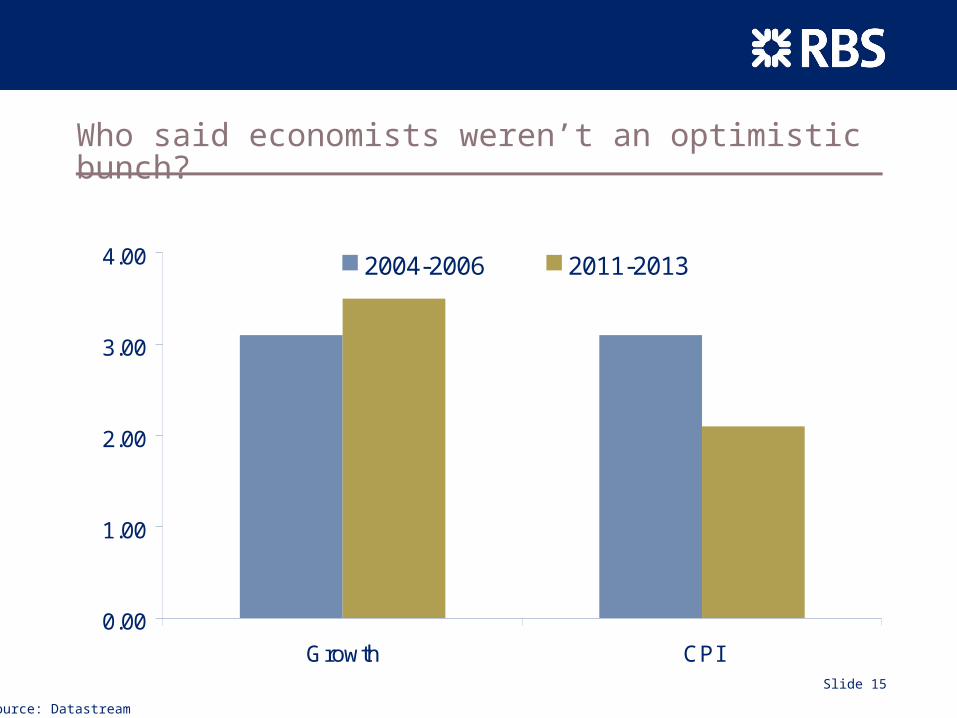
Who said economists weren’t an optimistic bunch?
0.00
1.00
2.00
3.00
4.00
Growth CPI
2004-2006 2011-2013
US Economic Data and Outlook (y/y %, Period Average)
Source: Datastream
Slide 16
Unfinished Business
Slide 17
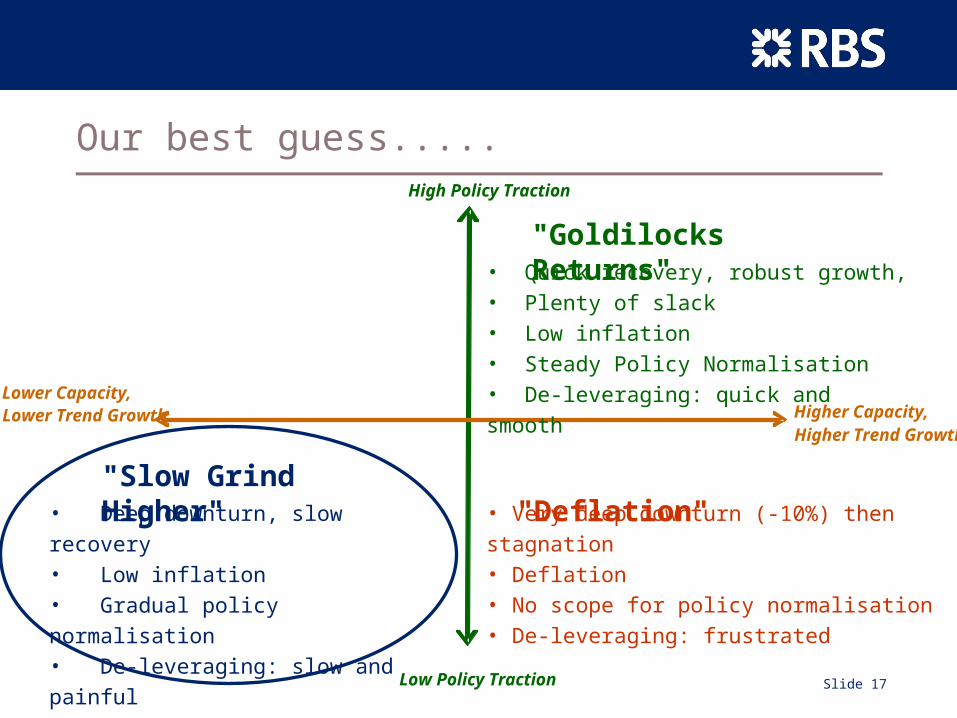
Our best guess.....
"Slow Grind Higher"• Deep downturn, slow recovery• Low inflation • Gradual policy normalisation• De-leveraging: slow and painful
"Goldilocks Returns"
"Deflation"• Very deep downturn (-10%) then stagnation• Deflation• No scope for policy normalisation• De-leveraging: frustrated
Higher Capacity, Higher Trend Growth
Lower Capacity, Lower Trend Growth
High Policy Traction
Low Policy Traction
• Quick recovery, robust growth, • Plenty of slack• Low inflation• Steady Policy Normalisation• De-leveraging: quick and smooth
Slide 18
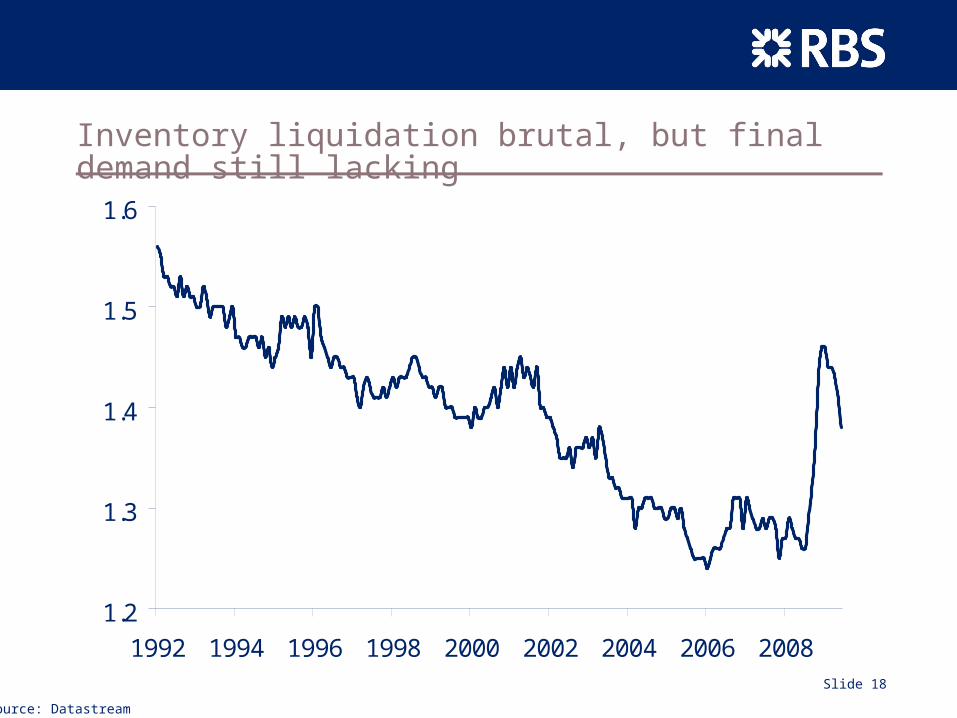
Inventory liquidation brutal, but final demand still lacking
1.2
1.3
1.4
1.5
1.6
1992 1994 1996 1998 2000 2002 2004 2006 2008
US Inventory to Sales Ratio - Still Bloated....
Source: Datastream
Slide 19
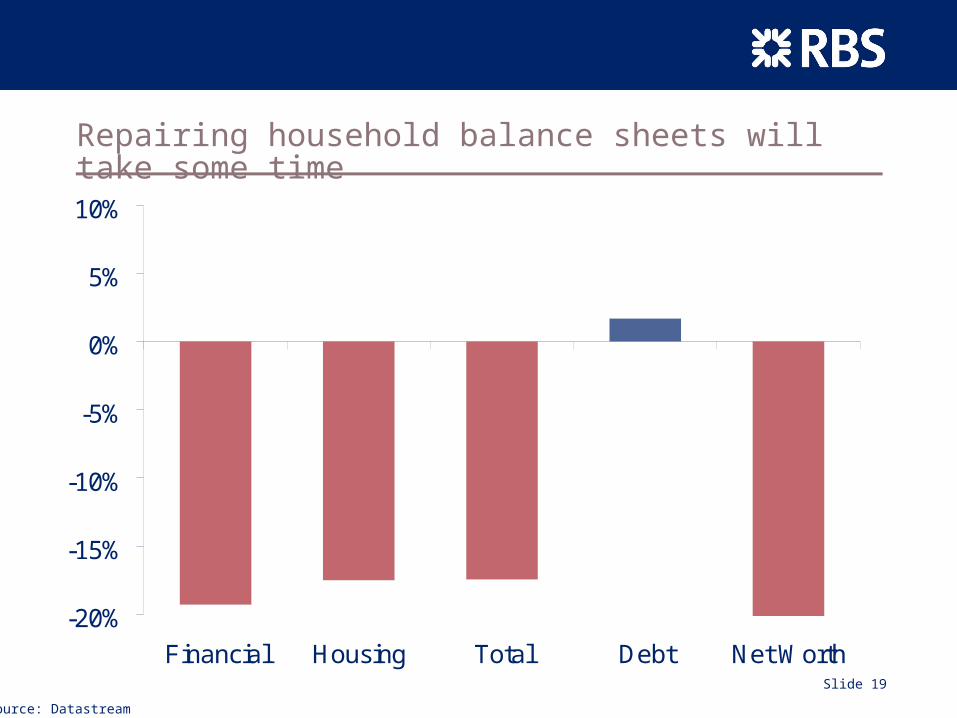
Repairing household balance sheets will take some time
-20%
-15%
-10%
-5%
0%
5%
10%
Financial Housing Total Debt Net Worth
US Household Balance Sheets(% change between Q2 2007 peak and Q1 2009)
-9,643bn -4,206bn -13,640bn
+234bn
-13,874bn
Source: Datastream
Slide 20
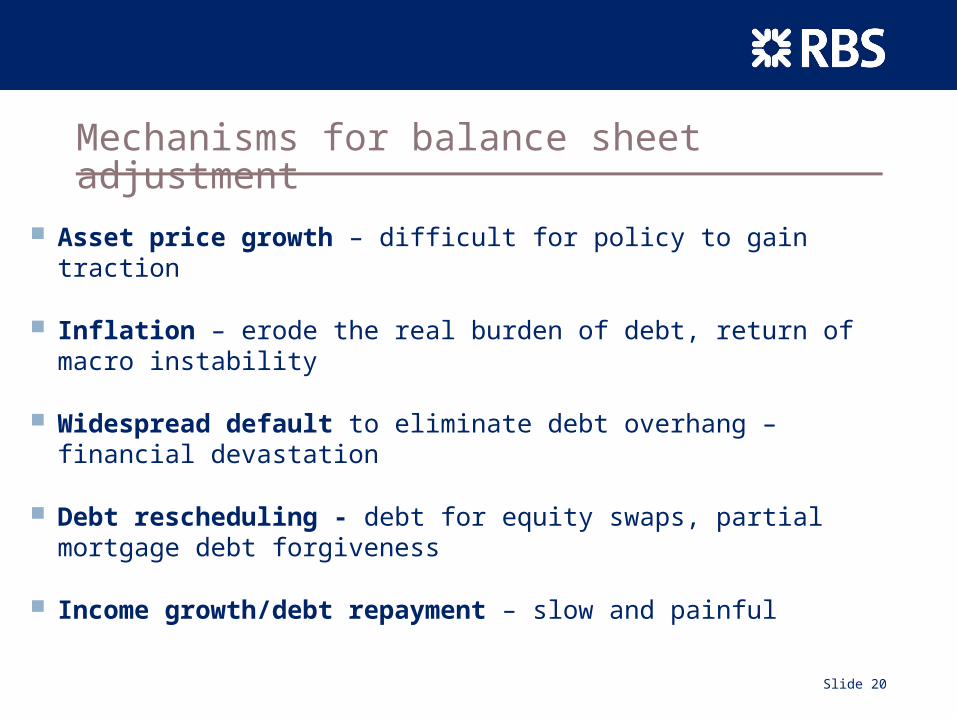
Mechanisms for balance sheet adjustment
Asset price growth – difficult for policy to gain traction
Inflation – erode the real burden of debt, return of macro instability
Widespread default to eliminate debt overhang – financial devastation
Debt rescheduling - debt for equity swaps, partial mortgage debt forgiveness
Income growth/debt repayment – slow and painful
Slide 21
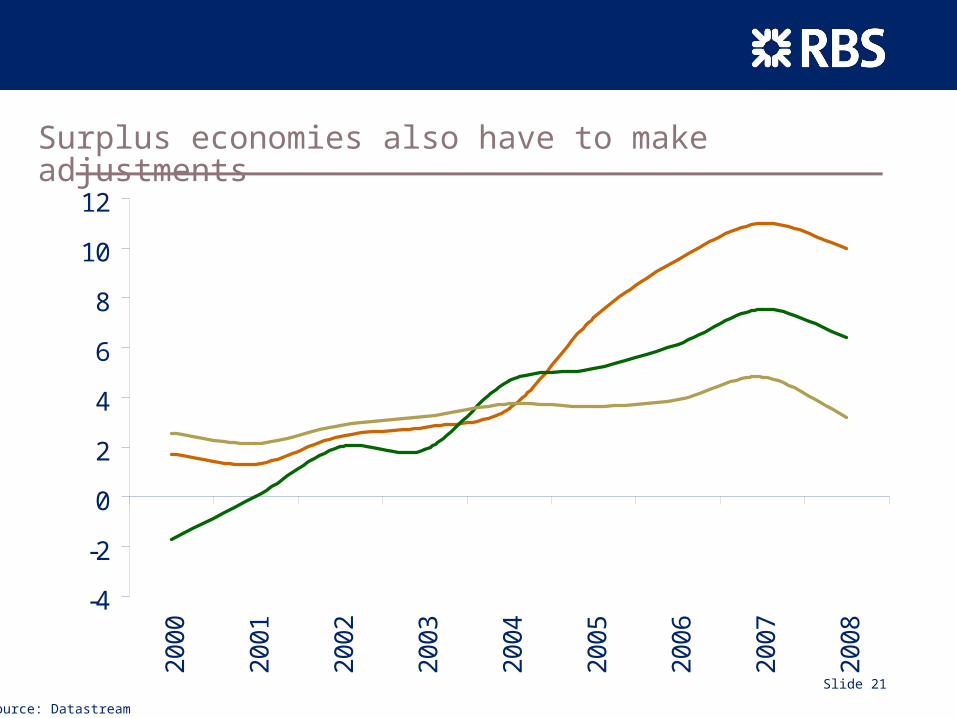
Surplus economies also have to make adjustments
-4
-2
0
2
4
6
8
10
122
000
200
1
200
2
200
3
200
4
200
5
200
6
200
7
200
8
Japan
Germany
China
Current Account Balances (% of GDP)
Source: Datastream
Slide 22
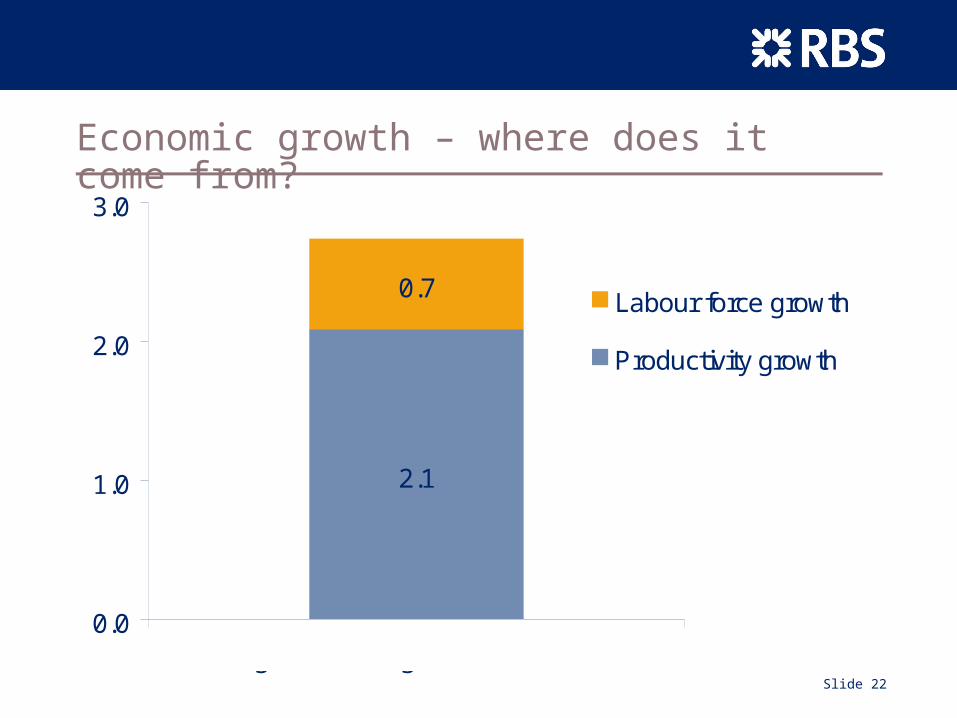
Economic growth – where does it come from?
2.1
0.7
0.0
1.0
2.0
3.0
Labour force growth
Productivity growth
Long term GDP growth = 2.8%
UK Economic Growth
Slide 23
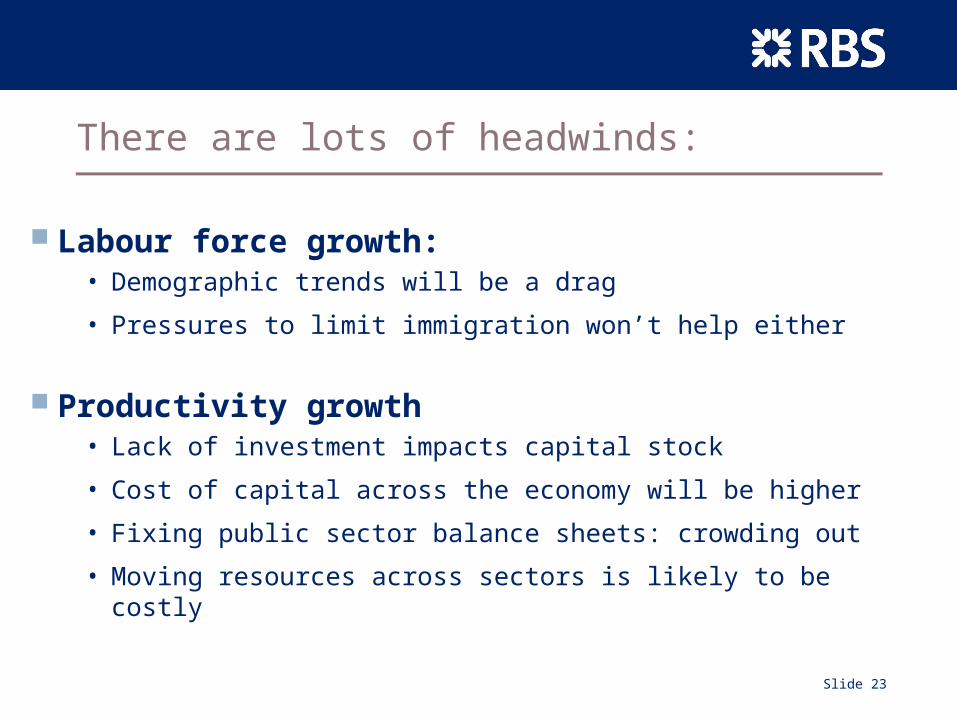
There are lots of headwinds:
Labour force growth:• Demographic trends will be a drag
• Pressures to limit immigration won’t help either
Productivity growth• Lack of investment impacts capital stock
• Cost of capital across the economy will be higher
• Fixing public sector balance sheets: crowding out
• Moving resources across sectors is likely to be costly
Slide 24
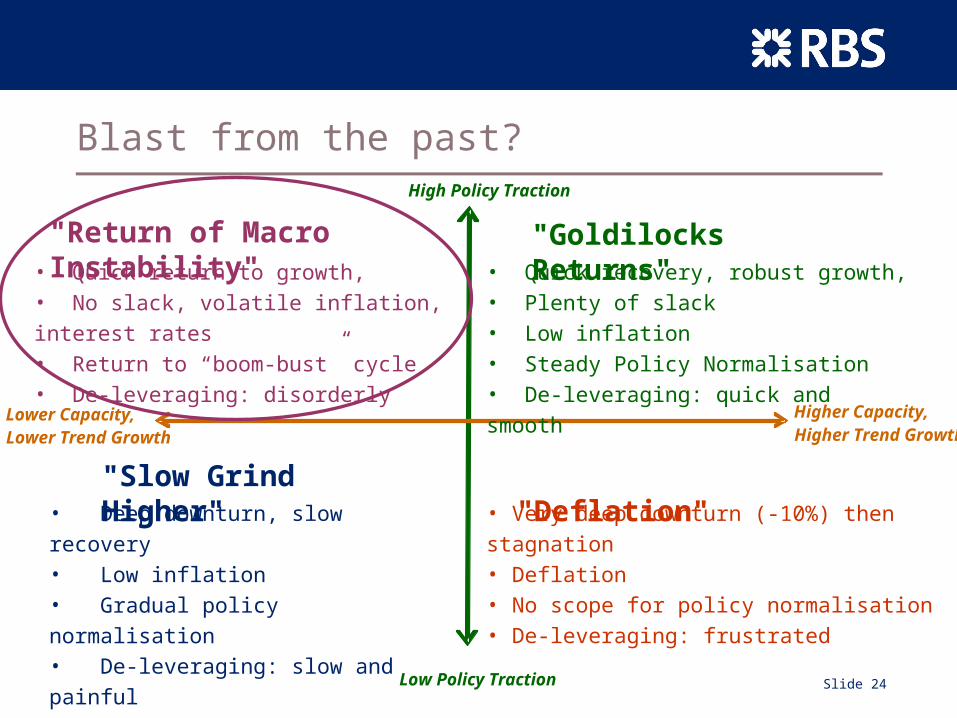
Blast from the past?
"Slow Grind Higher"• Deep downturn, slow recovery• Low inflation • Gradual policy normalisation• De-leveraging: slow and painful
"Return of Macro Instability"• Quick return to growth, • No slack, volatile inflation, interest rates• Return to “boom-bust” cycle• De-leveraging: disorderly
"Goldilocks Returns"
"Deflation"• Very deep downturn (-10%) then stagnation• Deflation• No scope for policy normalisation• De-leveraging: frustrated
Higher Capacity, Higher Trend Growth
Lower Capacity, Lower Trend Growth
High Policy Traction
Low Policy Traction
• Quick recovery, robust growth, • Plenty of slack• Low inflation• Steady Policy Normalisation• De-leveraging: quick and smooth
Slide 25
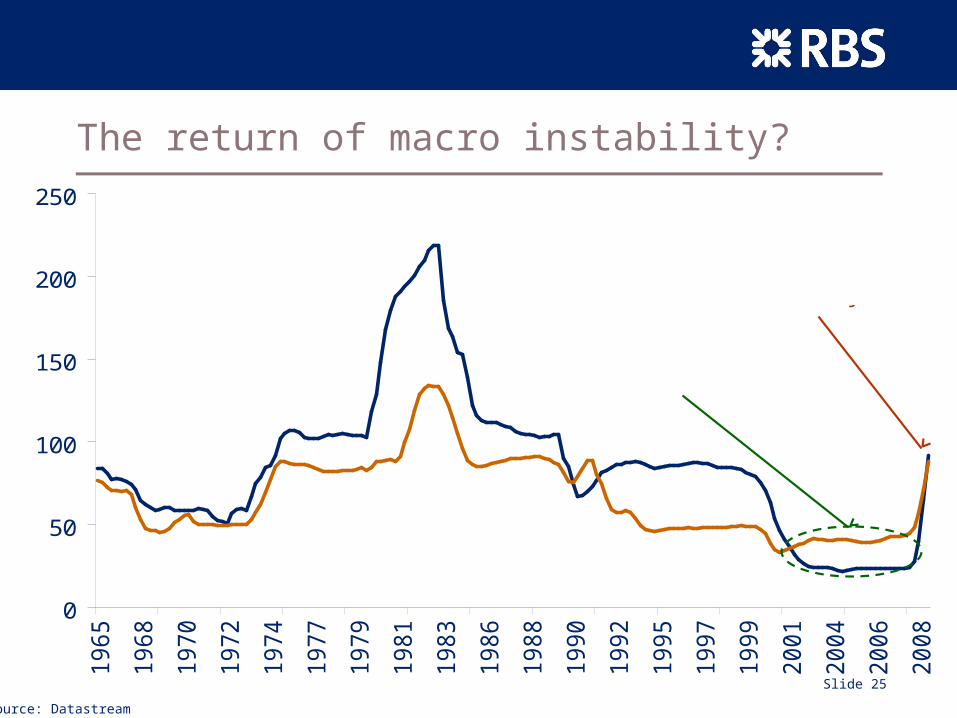
The return of macro instability?
0
50
100
150
200
250
19
65
19
68
19
70
19
72
19
74
19
77
19
79
19
81
19
83
19
86
19
88
19
90
19
92
19
95
19
97
19
99
20
01
20
04
20
06
20
08
UK
US
The "Great Moderation"
Economic Volatility (10 Year Rolling Coefficiant of Variation of Real GDP Growth)
Return of Macro-Instability?
Source: Datastream
Slide 26
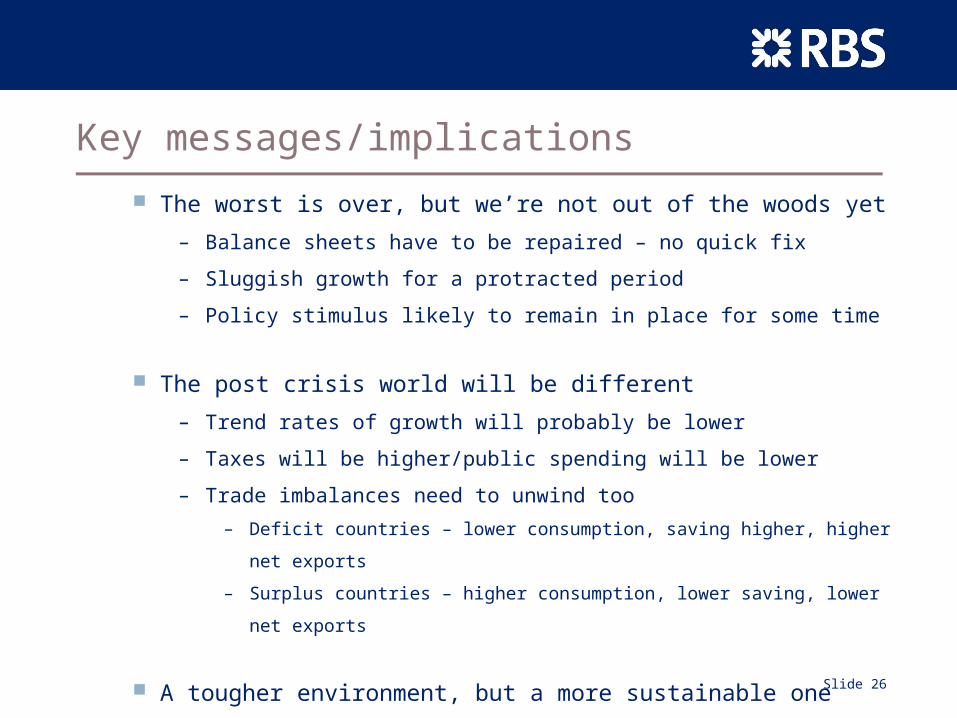
Key messages/implications
The worst is over, but we’re not out of the woods yet
– Balance sheets have to be repaired – no quick fix
– Sluggish growth for a protracted period
– Policy stimulus likely to remain in place for some time
The post crisis world will be different
– Trend rates of growth will probably be lower
– Taxes will be higher/public spending will be lower
– Trade imbalances need to unwind too
– Deficit countries – lower consumption, saving higher, higher net exports
– Surplus countries – higher consumption, lower saving, lower net exports
A tougher environment, but a more sustainable one

Slide 27
Questions
Slide 28
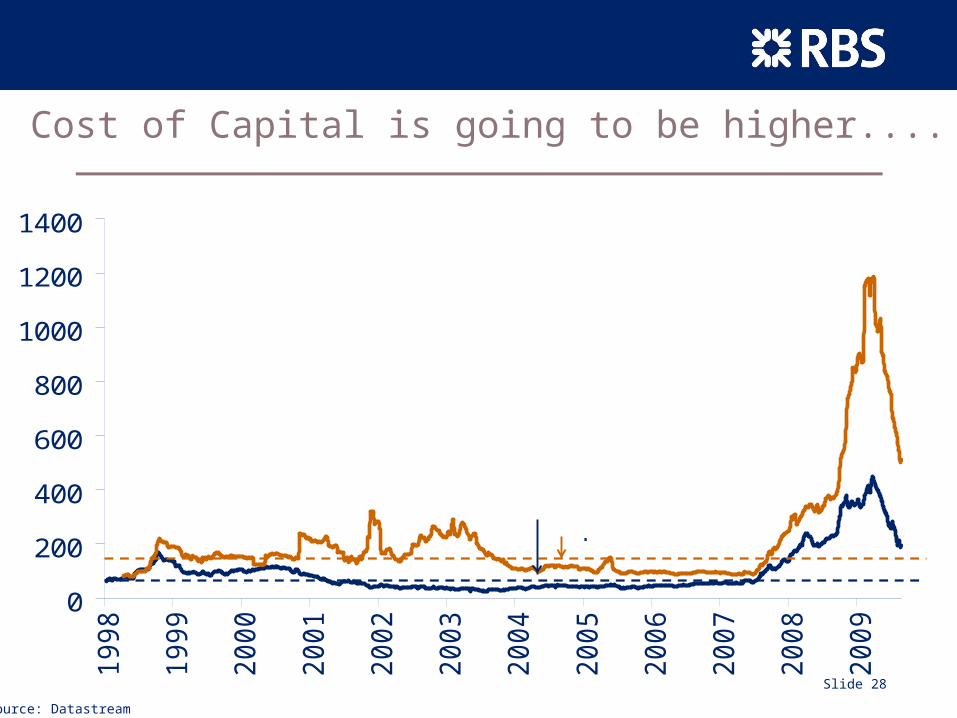
Cost of Capital is going to be higher....
0
200
400
600
800
1000
1200
1400
19
98
19
99
20
00
20
01
20
02
20
03
20
04
20
05
20
06
20
07
20
08
20
09
Corporate Bond Spreads(£, 1-5Yr vs UK Gilt, Bps)
AA
BBB
1998-2008 average spreads
Source: Datastream
Slide 29
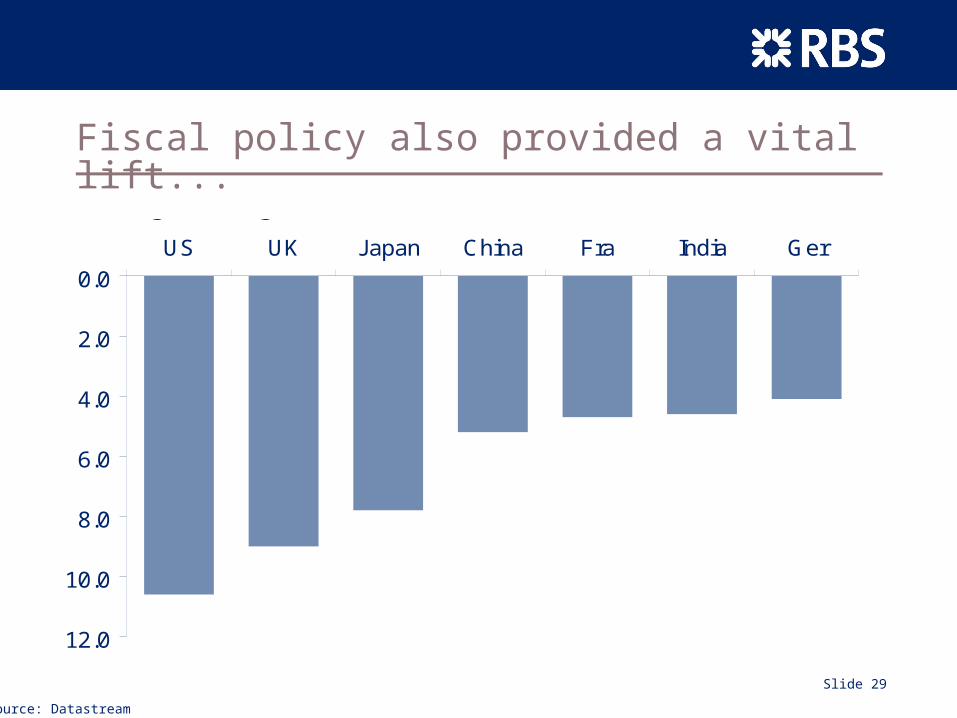
Fiscal policy also provided a vital lift...
0.0
2.0
4.0
6.0
8.0
10.0
12.0
US UK Japan China Fra India Ger
Change in Budget Balance (% of GDP, percentage points, 2007-2009)
Source: Datastream
Slide 30
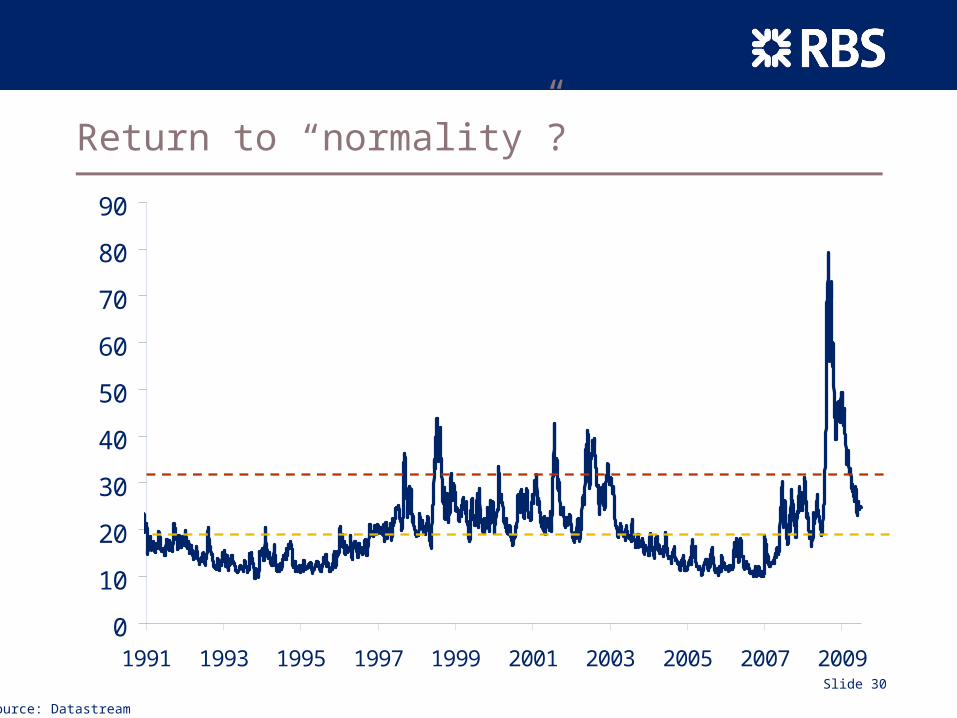
Return to “normality”?
0
10
20
30
40
50
60
70
80
90
1991 1993 1995 1997 1999 2001 2003 2005 2007 2009
Volatile Conditions
Normal Conditions
VIX Implied Volatility Index
Source: Datastream
Slide 31
Legal disclaimer
This material is published by The Royal Bank of Scotland plc (“RBS”) which is authorised and regulated by the Financial Services Authority for the conduct of regulated activities in the UK. It has been prepared for information purposes only and does not constitute a solicitation or an offer to buy or sell any securities, related investments, other financial instruments or related derivatives (“Securities”). It should not be reproduced or disclosed to any other person, without our prior consent.
This material is not intended for distribution in any jurisdiction in which its distribution would be prohibited.
Whilst this information is believed to be reliable, it has not been independently verified by RBS and RBS makes no representation, express or implied, nor does it accept any responsibility or liability of any kind, with regard to the accuracy or completeness of this information. Unless otherwise stated, any views, opinions, forecasts, valuations, or estimates contained in this material are those solely of the RBS Group’s Group Economics Department, as of the date of publication of this material and are subject to change without notice. Recipients of this material should make their own independent evaluation of this information and make such other investigations as they consider necessary (including obtaining independent financial advice), before acting in reliance on this information.
This material should not be regarded as providing any specific advice. RBS accepts no obligation to provide any advice or recommendations in respect of the information contained in this material and accepts no fiduciary duties to the recipient in relation to this information.