Embed Size (px)
Citation preview

This dissertation has been
microfilmed exactly as received69-16,653
GREEN, Robert William, 1932-TIlE BEHAVlOR OF HORSE LIVER ALCOHOLDEHYDROGENASE IN GUANIDINE HYDROCHLORIDE SOLUTIONS.
University of Hawaii, Ph.D., 1969Biochemistry
University Microfilms, Inc., Ann Arbor, Michigan
THE BEHAVIOR OF HORSE LIVER ALCOHOL DEHYDROGENASE
IN GUANIDINE HYDROCHLORIDE SOLUTIONS
A DISSERTATION SUBMITTED TO THE GRADUATE DIVISION OF THE
UNIVERSITY OF HAWAII IN PARTIAL FULFILLMENT
OF THE REQUIREMENTS FOR THE DEGREE OF
DOCTOR OF PHILOSOPHY
IN BIOCHEMISTRY
JANUARY 1969
By
Robert William Green
. ,Dissertation Committee:
Robert H. McKay, ChairmanKerry T. YasunobuJohn B. HallMorton MandelJohn W. Hylin

PLEASE NOTE: Appendix pagesare not original copy. Printis indistinct on many pages.Filmed in the best possibleway.
UNIVERSITY MICROFILMS.

iii
ACKNOWLEDGMENTS
The author wishes to express appreciation to Dr. Roy
A. Scott and Dr. Hannah O. Green for their helpful advice.
He is grateful to the National Institutes of Health for
providing financial support during graduate study at the
University of Hawaii.

ABSTRACT
The Z average molecular weight of horse liver
alcohol dehydrogenase (LAID!) in dilute neutral buffer
was found to be 78,200 by sedimentation equilibrium.
One molar guanidine hydrochloride (GuHCl) reversibly
inhibited LADH activity. The inhibition was competitive
with limiting nicotinamide adenine dinucleotide and mixed
with limiting ethanol. When EDTA was added to LADH in
1 M GuHCl, zinc was removed followed by aggregation.
Sedimentation velocity experiments indicated that no sub
unit was formed under these conditions. Higher concen
trations of GuHCl resulted in dissociation of LADH. In
3 M GuHCl, the sedimentation equilibrium data indicated
the presence of a reversible association-dissociation
system involving subunit, dimer, and trimer. EDTA removed
zinc but had no effect on the molecular weight of LADH
in 3 M GuHCl. Reduction and alkylation of LADH in 3 M
GuHCl resulted in almost complete dissociation into two
subunits. Apparently, sulfhydryl residues are involved
in subunit association, while zinc plays little or no
role. The Z average molecular weight of LADH in 5 M
GuHCl containing mercaptoethanol was found to be 45,700,
a value higher than expected. The discrepancy may be
attributed to incomplete dissociation, a small error in
apparent partial specific volume, or solvent binding.
v
Measurements of molecular weight, sedimentation coeffi
cient, and intrinsic viscosity of LADH in 5 M GuHCl
indicate that the structure of LADH is composed of two
subunits.
TABLE OF CONTENTS
ABSTRACT . . • .
LIST OF TABLES .
LIST OF FIGURES.
ABBREVIATIONS..
INTRODUCTION
EXPERIMENTAL PROCEDURES
MATERIALS.
METHODS. .
RESULTS. . .
DISCUSSION ...
APPENDIX
COMPUTER PROGRAMS.
BIBLIOGRAPHY . . . . . .
iv
vii
viii
ix
1
9
11
24
73
85
110

LIST OF TABLES
TABLE
I. ABSORPTIVITY OF LADH AND CHYMOTRYPSINOGEN A • 12
II. SPECIFIC ACTIVITY OF FRACTIONS IN MAJORPEAK FROM SEPHADEX G-IOO · · · · · · 27
III. SPECIFIC ACTIVITY OF FRACTIONS FROMWHATMAN CM- 52. · · · · · · · · 30
IV. KINETIC CONSTANTS FOR LADH. · · · · · · · 39
V. APPARENT PARTIAL SPECIFIC VOLUME OFLADH AT 20° C. · · · · · · · · · · 46
VI. SEDIMENTATION COEFFICIENTS. · · · · · · · · · 47
VII. DIFFUSION COEFFICIENTS OF LADH. · · · · 49
VIII. MOLECULAR WEIGHT OF LADH FROM SEDIMENTATIONAND DIFFUSION COEFFICIENTS . S1
IX. Z AVERAGE MOLECULAR WEIGHT. · · · · · · · S3
X. INTRINSIC VISCOSITY OF LADH AND CTOGEN. · · · 66
XI. ZINC REMOVAL FROM LADH BY EXHAUSTIVEDIALYSIS . . . · · · · · · · · · · · · · 69
XII. ZINC REMOVAL FROM LADH IN 1 M GUHC1CONTAINING EDTA. · · · · · · · · · · · · 70
XIII. ZINC REMOVAL FROM LADH BY EQUILIBRIUMDIALYSIS • . . · · · · · · · · · 71
XIV. NUMBER OF RESIDUES PER CHAIN FROMSEDIMENTATION COEFFICIENT. · · · · · · · 82
XV. NUMBER OF RESIDUES PER CHAIN FROMINTRINSIC VISCOSITY. · · · · · · · · · · 83

LIST OF FIGURES
FIGURE
1. CHROMATOGRAPHY OF LADH ON SEPHADEX G-100. 26
2. CHROMATOGRAPHY OF LADH ON CARBOXY METHYLCELLULOSE. • . • •• .... 29
3a. STARCH GEL ELECTROPHORESIS OF LADH IN 0.05 MPHOSPHATE BUFFER, PH 7.0 . . . • • • .• 33
3b. STARCH GEL ELECTROPHORESIS OF LADH IN 0.05 MSUCCINATE BUFFER, PH 5.0 . . • . . . .• 33
4. LINEWEAVER-BURK PLOTS OF LADH WITH LIMITINGETHANOL CONCENTRATIONS . . . • • • . •. 36
S. LINEWEAVER-BURK PLOTS OF LADH WITH LIMITINGNAD CONCENTRATIONS . • • • • . • . . .• 38
7 •
8.
9.
THE EFFECT OF 1 M, 2 M, and 3 M GUHClON LADH ACTIVITY • • . . • •
SEDIMENTATION VELOCITY OF LADH IN 2 M GUHC1 •
MOLECULAR WEIGHT OF LADH IN 3 M GUHC1
MOLECULAR WEIGHT OF LADH IN 3 M GUHClCONTAINING EDTA. • • . . • • • •
42
44
S6
58
10. MOLECULAR WEIGHT OF ALKYLATED LADH IN3 M GUHC1. . . • . . . •• .•••• 60
11. MOLECULAR WEIGHT OF ALKYLATED LADH IN S MGUHC 1. • . • . . • • • • . • • . 62
12. MOLECULAR WEIGHT OF LADH IN 5 M GUHC1CONTAINING MERCAPTOETHANOL . • . 64

a
A
b
B
c
C
cm
CTogen
D
DTE
DTT
EDTA
EtSH
F
gm
GuHCI
IA
k
K
LADH
M
MO
Mapp
mg
ix
ABBREVIATIONS
Radius of meniscus
Angstrom
Radius of cell bottom
Second virial coefficient
Concentration
Centigrade
Cen timeter
Chymotrypsinogen A
Diffusion coefficient
Dithioerythritol
Dithiothreitol
Disodium ethylenediaminetetraacetic acid
Mercaptoethanol
Fick
Gram
Guanidine hydrochloride
Iodoacetate
Huggins constant
Michaelis constant
Horse liver alcohol dehydrogenase
Molar
Molecular weight at zero concentration
Apparent molecular weight
Milligram
min
ml
mm"
mll
n
N
NaCl
NAD
NADH
obs
OP
PCMB
ppm
r
R
rpm
S
sec
SDS
t
T
tris
v
Vmax
w
ZAMW
x
Minute
Milliliter
Millimeter
Millimicron
Index of refraction
Number of residues per chain
Sodium chloride
Nicotinamide adenine dinucleotide
Nicotinamide adenine dinucleotide reduced
Observed
Orthophenanthroline
p-chloromercuribenzoate
Parts per million
Radius
Gas constant
Revolutions per minute
Sedimentation coefficient, Svedberg
Second
Sodium dodecylsulfate
Time
Absolute temperature
Trishydroxymethylaminomethane
Apparent partial specific volume
Maximum specific activity
Water
Z average molecular weight

n Viscosity
[n] Intrinsic viscosity
lJ Micron
p Density
w Angular velocity
0 Degree
xi
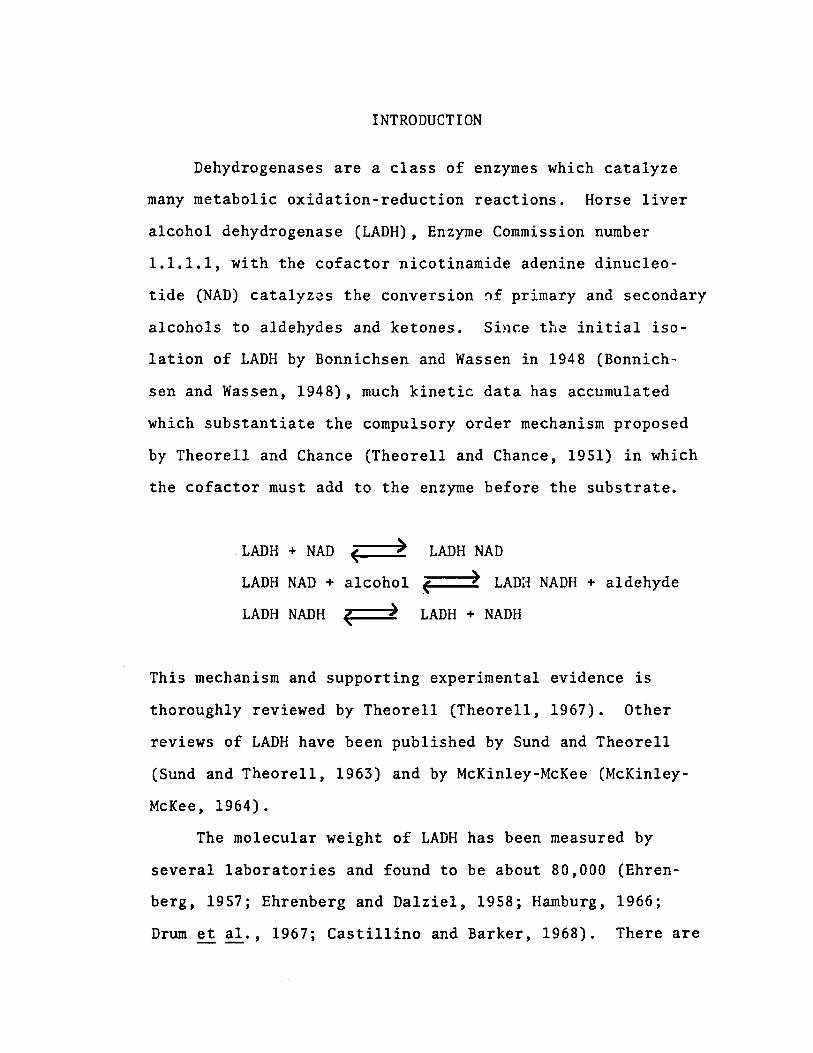
INTRODUCTION
Dehydrogenases are a class of enzymes which catalyze
many metabolic oxidation-reduction reactions. Horse liver
alcohol dehydrogenase (LADH), Enzyme Commission number
1.1.1.1, with the cofactor nicotinamide adenine dinucleo
tide (NAD) catalyzes the conversion ~f primary and secondary
alcohols to aldehydes and ketones. Since the initial iso-
lation of LADH by Bonnichsen and Wassen in 1948 (Bonnich
sen and Wassen, 1948), much kinetic data has accumulated
which substantiate the compulsory order mechanism proposed
by Theorell and Chance (Theorell and Chance, 1951) in which
the cofactor must add to the enzyme before the substrate.
LADH + NAD ( ) LADH NAD
LADH NAD + alcohol ( ) LADa NADH + aldehyde
LADH NADH ~(===z) LADH + NADH
This mechanism and supporting experimental evidence is
thoroughly reviewed by Theorell (Theorell, 1967). Other
reviews of LADH have been published by Sund and Theorell
(Sund and Theorell, 1963) and by McKinley-McKee (McKinley
McKee, 1964).
The molecular weight of LADH has been measured by
several laboratories and found to be about 80,000 (Ehren
berg, 1957; Ehrenberg and Dalziel, 1958; Hamburg, 1966;
Drum et al., 1967; Castillino and Barker, 1968). There are

2
26 sulfhydryl groups (Witter, 1960; Oppenheimer et al., 1967)
and 4 zinc atoms per molecule (Akeson, 1964; Oppenheimer
et al., 1967). Each molecule has two cofactor binding
sites and presumably two active centers (Theorell and
Bonnichsen, 1951; Ehrenberg and Dalziel, 1958; Oppenheimer
et al., 1967).
Recent work has been devoted toward determining which
of the functional groups of the enzyme are involved in the
catalytic mechanism. The fact that all dehydrogenases
have a high sulfhydryl content suggests that sulfhydryl
groups are involved in the catalytic process. The sulfhy
dryl reagents p-chloromercuribenzoate (PCMB) and iodoace
tate have been used to substantiate this hypothesis.
When PCMB is added to LADH, there is a linear loss of
enzymatic activity and cofactor binding (Witter, 1960).
The presence of cofactor retards the reaction of PCMB with
LADH. Iodoacetate appears to be more discriminating than
PCMB toward the sulfhydryl groups in LADH. Only two moles
of iodoacetate per mole of enzyme are needed to completely
inactivate the enzyme (Li aud Vallee, 1964; Harris,1964).
Iodoacetate reactivity is also hindered by the presence of
cofactor. Although these experiments seem to directly
implicate sulfhydryl residues in the catalytic mechanism
of LADH, the modification of these residues may cause con
formational changes of catalytically important regions
which are distant from sulfhydryl loci.

When LADH was reacted with radioactive iodoacetate,
followed by tryptic digestion and peptide mapping, only
one radioactive peptide was found (Li and Vallee, 1964;
Harris, 1964). When the radioactive peptide was isolated
and its sequence determined, it was found to be homoge
neous. The total number of peptides was about half the
number expected. These data indicate that LADH is composed
of two identical subunits, each containing an unusually
reactive sulfhydryl group.
The Tole of the four zinc atoms in LADH is also of
considerable interest. The kinetic and structural func
tions of zinc have been investigated by means of che1ating
agents. Orthophenanthro1ine (OP) and 2,2-bipyridine have
two binding sites per molecule of LADH (Vallee and Coombs,
1959; Yonetani, 1963; Sigman, 1967). They competitively
inhibit activity by interfering with cofactor binding
(Vallee et a1., 1959). The spectrum of the chelate-enzyme
complex is characteristic of a chelate-zinc complex. When
zinc is removed at low pH, there is a linear loss of co
factor binding (Oppenheimer et a1., 1967). Apparently the
cofactor binds at or near zinc atoms. On the other hand,
when zinc is removed from LADH by lowering the pH in the
presence of chelating agent, activity decreases faster
than zinc is removed (Akeson, 1964; Drum et a1., 1967).
Furthermore, two zinc atoms per molecule of LADH seem to
be more easily exchanged with Zn65 than the other two zinc
3

4
atoms (Drum et aI., 1967; Akeson, 1964; Druyan and Vallee,
1964). When LADH is denatured with 8 M urea, dissociation
into two subunits occurs with zinc retention. Subsequent
addition of EDTA causes zinc removal and further dissocia
tion to a molecular weight of 20,000 (Drum ~ al., 1967).
It is probable that the four zinc atoms are nonequivalent
in their catalytic effectiveness. The suggestion has been
made that the two zinc atoms which are more easily ex
changed are involved in catalysis while the other two zinc
atoms are buried and have a structural role (Akeson, 1964;
Drum et al., 1967).
Recent phosphorescence studies indicate that OP is
not complexing directly with the zinc atoms in LADH
(Piette and Rabold, 1967). When zinc ion is added to an
OP solution, there is a doubling of the OP triplet life
time when the zinc to OP ratio is I : 1. However, when
OP is added to an LADH solution, the triplet life time
does not increase, indicating that all four zinc atoms are
buried in the enzyme. Thus the precise structural and
catalytic roles of zinc in LADH remain unclear.
Subunit content is an important factor in enzyme
structure. If subunits are identical, structural analysis
is considerably simplified. Often one active center is
associated with each subunit (Sund and Weber, 1966).
Sometimes subunits interact with each other forming an
allosteric system (Monod et al., 1963).
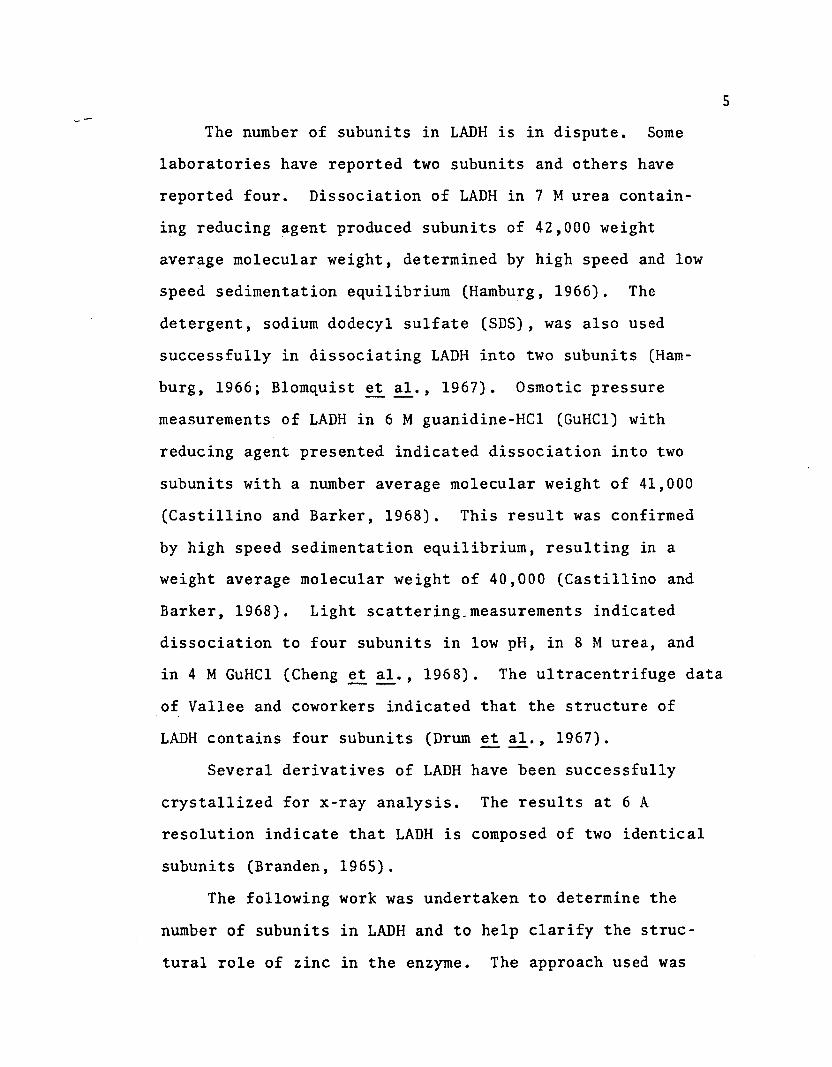
5
The number of subunits in LAnH is in dispute. Some
laboratories have reported two subunits and others have
reported four. Dissociation of LADH in 7 M urea contain
ing reducing agent produced subunits of 42,000 weight
average molecular weight, determined by high speed and low
speed sedimentation equilibrium (Hamburg, 1966). The
detergent, sodium dodecy1 sulfate (SDS) , was also used
successfully in dissociating LADH into two subunits (Ham
burg, 1966; Blomquist et a1., 1967). Osmotic pressure
measurements of LADH in 6 M guanidine-HC1 (GuHC1) with
reducing agent presented indicated dissociation into two
subunits with a number average molecular weight of 41,000
(Casti11ino and Barker, 1968). This result was confirmed
by high speed sedimentation equilibrium, resulting in a
weight average molecular weight of 40,000 (Casti11ino and
Barker, 1968). Light scattering_measurements indicated
dissociation to four subunits in low pH, in 8 M urea, and
in 4 M GuHC1 (Cheng et a1., 1968). The ultracentrifuge data
of Vallee and coworkers indicated that the structure of
LADH contains four subunits (Drum et a1., 1967).
Several derivatives of LADH have been successfully
crystallized for x-ray analysis. The results at 6 A
resolution indicate that LADH is composed of two identical
subunits (Branden, 1965).
The following work was undertaken to determine the
number of subunits in LAnH and to help clarify the struc
tural role of zinc in the enzyme. The approach used was

6
stepwise disruption of structure with GuHCl while measur-
ing molecular weight, sedimentation, diffusion, viscosity,
and zinc content at each step.
GuHC1 was chosen because of its strong denaturing
ability. The mechanism of denaturation of proteins by
GuHC1 is not completely understood. The guanidinium ion
consists of three equivalent amino groups arranged with a
planar trigonal symmetry around a central carbon atom.
The carbon atom has an empty p orbital where most of the
positive charge is located. Each nitrogen of the amino
groups has three planar, trigonally hybridized atomic
orbitals engaged in sigma bonds with hydrogen and carbon.
The lone pair of electrons are in a p orbital which is
involved in pi-pi conjugation with the carbon p orbital.
Six electrons are involved in this conjugated system (Dewar
and Pao1oni, 1957). The distribution of pi like electrons
is shown below together with the charge distribution.
This charge distribution is thought to play an important
role in denaturation (Jo1y, 1965).
N 1.914
1C 0.258
/\1.914 N N 1.914
Pi ElectronDistribution
N + 0.086,C + 0.742
/\+ 0.086 N N + 0.086
Charge Distribution

Tanfcrd and coworkers observed that proteins in con
centrated GuHCl with a reducing agent present are com
pletely dissociated and behave like random coils (Tanford
et al., 1967). Their data for sedimentation coefficient
and intrinsic velocity of several proteins fit the fol
lowing equations, which were derived assuming a random
coil.
SO = (1 - vp) AN B
[n] = CND
where SO = sedimentation coefficient at zeroconcentration
--- apparent partial specificv =volume
p = solvent density
N = number of residues per chain
[n] = intrinsic viscosity
A, B, C, and D are constants
7
In the following study, measurements of molecular
weight, sedimentation velocity, diffusion, viscosity, and
zinc content were made at 1 M, 3 M, and 5 M GuHCl concen
trations. From these data the stepwise denaturing effect
of GuHCl on LADH could be observed. The Tanford equations

were applied to LADH in 5 M GuHCl. The minimum size of
subunits in LADH was then determined and conclusions were
drawn regarding the structural role of zinc and of sulf
hydryl in the enzyme.
8

EXPERIMENTAL PROCEDURES
MATERIALS
Proteins
Horse liver alcohol dehydrogenase was obtained as
a crystalline suspension from C. F. Boehringer and Son,
Manheim, Germany.
Chymotrypsinogen A from bovine pancreas (CGC grade)
was purchased from Worthington Biochemical Corporation,
Freehold, New Jersey. This protein was obtained as a
lyophilized salt free powder after being recrystallized
five times.
Reagents
Acetylpyridine adenine dinucleotide, C. F. Boehringer and
Son, Manheim, Germany.
Disodium ethylene diaminetetraacetic acid (EDTA), Reagent
grade, J. T. Baker Chemical Co., Phillipsburg, New
Jersey.
Disodium hydrogen phosphate, Reagent grade, Allied Chemical
Corporation, New York, New York.
Dithioerythritol, Grade I, Cyclo Chemical Corporation,
Los Angeles, California.
Dithiothreitol, A grade, Calbiochem, Los Angeles, Cali
fornia.
10
Ethanol, U. S. P. grade, Commercial Solvents Corporation,
Los Angeles, California.
Guanidine-HC1, Ultrapure, Mann Research Laboratories, New
York, New York.
Hydrochloric acid, Reagent grade, J. T. Baker Chemical
Company, Phillipsburg, New Jersey.
Iodoacetic acid, Sigma Chemical Company, St. Louis,
Missouri.
Mercaptoethano1, Calbiochem, Los Angeles, California.
Nicotinamide adenine dinucleotide, C. F. Boehringer and
Son, Manheim, Germany.
Sephadex G-100, Pharmacia Fine Chemicals, Inc., Piscataway,
New Jersey.
Sodium Carbonate, Reagent grade, J. T. Baker Chemical
Company, Phillipsburg, New Jersey.
Sodium Chloride, Reagent grade, Matheson Company, Inc.,
Norwood, Ohio.
Sodium succinate, Matheson Company Inc., Norwood, Ohio.
Starch, Connaught Medical Research Laboratories, Toronto,
Canada.
Thioglyco1ic acid, Purified, Mann Research Laboratories,
New York, New York.
Tris (trishydroxymethylaminomethane), Reagent grade,
Sigma Chemical Company, St. Louis, Missouri.
Whatman CM-52, Reeve Angel, Clifton, New Jersey.

EXPERIMENTAL PROCEDURES
METHODS
Preparation of LADH Stock Solution
The LADH suspension, obtained from C. F. Boehringer
and Son, was dialyzed against three changes of 0.05 M tris,
pH 7.5 at 4° C for approximately 24 hours. Subsequent
filtering through a 0.45~ Millipore filter resulted in a
stock solution of LADH which was stable for about one
month. Turbidity in this stock solution, which appeared
after several weeks, could be removed by heating at 40° C
for 15 minutes and filtering.
Protein Concentration Determination
Protein concentrations were determined spectrophoto
metrically by absorbance at the wave length of maximum
absorptivity in the 280 m~ region. Absorbance was also
measured at 400 m~ to correct for light scatter. Scatter
corrections were previously determined empirically by
measuring absorbance at 400 m~ and 280 m~ before and
after centrifuging down the aggregate causing turbidity
(McKay, 1962). LADH solutions having an absorbance higher
than 0.006 at 400 m~ were heated to 40° C for 15 minutes.---
and then filtered through a 0.45 ~ Millipore filter. Table
1 gives the absorptivity of LADH and chymotrypsinogen A
in tris buffer and in 3 M GuHCl (Ehrenberg and Dalziel,

12
TABLE 1
Absorptivity of LADH and CTogen
Wave Absorp-Length tivity
Enzyme Solvent em}!) (mg- 1cm2) Reference
LADH tris buffer, 280 0.420 Ehrenberg andpH 7.4 Dalziel, 1958
LADH 3 M GuHC1, 277 0.426*pH 7.2
CTogen tris buffer, 280 2.00 Schwert, 1951pH 7.4
CTogen 3 M GuHC1, 280 2.06*pH 7.2
*Absorbance was measured after concentrated GuHC1 solutionwas added to solutions of known protein concentration intris buffer. Absorptivity in 3 M GuHC1 solution is basedon absorptivity in dilute buffer.

13
1958; Schwert, 1951).
LADH Activity Det'ermination
LAnH activity was determined spectrophotometrically
by measuring the rate of formation of NADH in a solution
containing 1.7 x 10- 3 M NAD, 1.6 x 10- 2 M ethanol and 0.06
M tris, pH 8.8 at 25° C. This environment gave optimum
LAnH activity.
Sephadex G-IOO Chromatography of LADH
Sephadex chromatography of LADH was done with a G-IOO
column having a diameter of 1.5 cm and a height of 21 cm.
This column was washed with 0.05 M tris, pH 7.1 until the
effluent had the same pH, conductivity, and 280 m~ absorb
ance as the starting tris buffer. 1.00 ml of LADH (7.79
mg/ml) was added to the column and then eluted with tris
buffer at a flow rate of 1.1 ml/min. The temperature was
approximately 24° C. Protein eluted from the column was
measured by absorbance at 280 mp.
Carboxy Methyl Cellulose Chromatography of LADH
A column of Whatman CM-52 having a diameter of 1.5 cm
and a height of 26.5 cm was washed with 0.01 M tris, pH
7.1 until the effluent had the same pH and conductivity
as the starting tris buffer. 1.00 ml of LADH (5.52 mg/ml)
was added to the column. After the first peak was eluted,
14
the buffer was changed to 0.05 M tris, pH 7.5. The flow
rate was 0.67 ml/min. The temperature was approximately
25° C. Eluted protein was measured by absorbance at 280
mlJ·
Starch Gel Electrophoresis of LADH
Starch gel electrophoresis was done by the method of
Smithies (Smithies, 1955) as modified by Ashton (Ashton
and Braden, 1961). Sixty-two gm of Connaught starch were
mixed with 500 ml of hot buffer to form the gel. Whatman
filter paper was saturated with LADH solution and inserted
into the starch gel of 3 mm thickness. Electrophoresis
was done for 4 to 12 hours at 4° C with approximately
7 volts/cm. Protein was detected by nigrosin stain.
Dehydrogenase activity was detected by spraying the starch
gel with a solution of ethanol and acetylpyridine adenine
dinucleotide at pH 8.8 and observing green fluorescence
when the gel was irradiated with ultraviolet light.
Preparation of LADH and Chymotrypsinogen A Solutions in
GuHCl
One M GuHCl solutions were made by adding concentrated
GuHCl to LADH stock solutions. Measurements were carried
out immediately since LADH is unstable in this environment
and tends to aggregate even when reducing agent is present.
Three molar and 5 M GuHCl solutions were prepared in

15
three different ways: (1) Enzyme stock solution was dia
lyzed for 48 hours against GuHCl in 0.05 M tris buffer,
containing 0.1 M mercaptoethanol. (2) Enzyme stock
solution was added to solid GuHCl and then dialyzed for
48 hours against GuHCl-tris buffer solution containing
0.1 M mercaptoethanol. (3) Enzyme stock solution was added
to solid GuHCl. This solution was made 2.5 x 10~3 M in
dithiothreitol. After an hour, an excess of iodoacetate
over the total sulfhydryl content was added and the pH
adjusted to 8.0. Four hours later, the alkylated LADH was
dialyzed for 48 hours against GuHCl-tris buffer solution.
Solutions of chymotrypsinogen A in 5 M and 6 M GW1Cl were
prepared in the same way. In addition to the above proce
dures, some solutions of LADH in 3 M GuHCl containing
no reducing agent were prepared by dialysis against
GuHCl-tris buffer solutions with and without EDTA.
Apparent Partial Specific Volume of LADH
Densities of enzyme and dialysate solutions were
measured with 3 ml and 5 ml pycnometers, designed by
Lipkin (Lipkin et al., 1944), obtained from Lab Glass,
Inc., Vineland, New Jersey. LADH concentrations ranged
from 6 to 15 mg/ml. Weighings were to the nearest 0.1 mg
with a Mettler type H16 analytical balance. Volumes were
measured in a constant temperature viscosity bath (Preci
sion Scientific Company, Chicago, Model S) which was

16
maintained at 20.00 0 C and regulated to t 0.005 0 C.
Apparent partial specific volume was calculated by the
following equation.
v =
p
c
=
=
=
density of dialysate
density of enzyme solution
enzyme concentration in mg/ml
Zinc Analysis
Zinc was determined by atomic absorption using the
method of Fuwa (Fuwa et al., 1964). A Westinghouse type
WL hollow cathode source was directed through a horizontal
hydrogen-air flame into a Zeiss Model PMQ-II spectropho
tometer. With this arrangement, zinc aspirated into
the flame could be accurately measured in the 0.1 to 0.5
ppm range. In the concentrations used, tris and GuHCl
had no enhancing or quenching effect on the zinc analysis.
Kinetics of Inhibition of LADH with GuHC1
Lineweaver-Burk plots (Lineweaver and Burk, 1934)
were made for limiting ethanol and limiting NAD concentra
tions. These kinetic measurements were done with and with
out 0.5 M GuHCl present in the activity assay mixture.
17
Kinetics of Denaturation of LADH with GuHCl
LADH was dissolved in 1 M, 2 M, and 3 M GuHCl at
00 C. Aliquots were taken at different time intervals
and activity was measured in an assay mixture containing
the same concentration of GuHCl. The decrease of activity
as a function of time was recorded. At the end of each
experiment, activity was determined in the absence of
GuHCl to measure reversibility. This procedure caused a
1 to 250 dilution of the GuHCl.
Sedimentation Velocity
Measurements of sedimentation velocity were done at
20.0 0 C with a Spinco Model E analytical ultracentrifuge
using a Schlieren optical system. The change of index of
refraction with radial distance in the cell was recorded
on Kodak metallographic plates at different times during
a run. The radial distance of the maximuma~ each time
was measured with a Gaertner microcomparator. Between
four and tmpictures were used for the calculation of
the sedimentation coefficient (Schachman, 1957). Densi
ties and relative viscosities of solvents were measured
for correction to water as solvent. The reciprocal sedi
mentation coefficient was extrapolated to ~ero concentra
tion by the least squares method. Because of radial
dilution, concentration was corrected to the concentration
of the plateau region at the half time of the run (Kegeles
18
and Gutter, 1951). A standard aluminum centerpiece (4°,
12 mm) was used for LADH in tris buffer and 1 M GuHCl.
An aluminum filled epon double sector synthetic boundary
centerpiece (2.5°, 12 mm) was used for LADH and chymotryp
sinogen A in 3 M and 5 M GuHCl so that early measurements
could be made prior to large diffusion and so that
measurements could be made at the plateau region of GuHCl.
Thus a correction for GuHCl sedimentation was not neces
sary.
Diffusion of LADH
The diffusion coefficient of LADH was obtained by
measuring the spreading of a synthetic boundary formed
by layering dialysate on enzyme solution. A double sector
synthetic boundary cell (2.5°, 12 mrn) was used at 20.0°
C and 8000 rpm. No sedimentation was observed at this
speed. The diffusion coefficient was calculated by the
height-area method after reading Schlieren pictures by
a Gaertner microcomparator (Ehrenberg, 1957). Correction
to water as solvent was done by the procedure outlined
by Schachman (Schachrnan, 1957).
Sedimentation Equilibrium
The method used for sedimentation equilibrium per
mitted an extrapolation of molecular weight to zero con
centration after one overnight experiment. Four
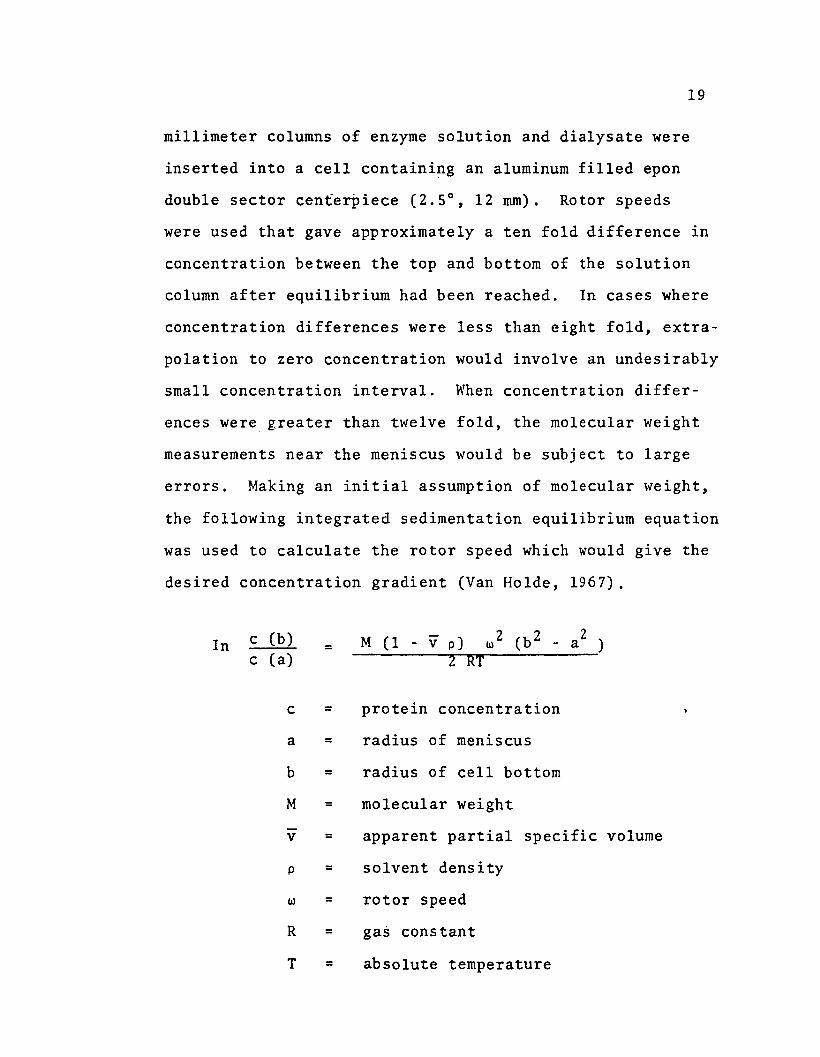
19
millimeter columns of enzyme solution and dialysate were
inserted into a cell containing an aluminum filled epon
double sector centerpiece (2.5°, 12 rom). Rotor speeds
were used that gave approximately a ten fold difference in
concentration between the top and bottom of the solution
column after equilibrium had been reached. In cases where
concentration differences were less than eight fold, extra
polation to zero concentration would involve an undesirably
small concentration interval. When concentration differ-
ences were greater than twelve fold, the molecular weight
measurements near the meniscus would be subject to large
errors. Making an initial assumption of molecular weight,
the following integrated sedimentation equilibrium equation
was used to calculate the rotor speed which would give the
desired concentration gradient (Van Holde, 1967).
c (b) M (1 - p) 2 (b 2 2In - v III - a )=
c (a) 2 RT
c = protein concentration
a = radius of meniscus
b = radius of cell bottom
M = molecular weight
v = apparent partial specific volume
p = solvent density
III = rotor speed
R = gas constant
T = absolute temperature

20
By using the rpm step down procedure of Hexner (Hexner
et al., 1961), equilibrium could be reached within a day,
thus saving considerable time. This procedure consists
of sedimenting the protein solution at a higher rpm for
a short time until a distribution is reached which approx
imates the equilibrium distribution at a lower rpm. Then
the rotor speed is decreased to the lower rpm and allowed
to rotate overnight. Pictures of the protein distribution
at equilibrium were taken on Kodak metallographic plates
using the Schlieren optical system. The differences in
change of index of refraction with distance between enzyme
and dialysate solutions, at 0.04 cm observed radial inter
vals from meniscus to the cell bottom, were measured with
a Gaertner microcomparator. The actual intervals were
approximately 0.02 cm when corrected for optical magnifica
tion. By measuring data in this way, the Schlieren read-
out is effectively divided into about 20 small trapezoids.
Concentration at each radial interval was calculated by
the following equation, assuming a conservation of mass.
2 r 2)area . Co Crbc = ab
Cr 2) ]E [area . !J.a
c = concentration in the interval
Co = initial concentration
area = trapezoid area in the interval

21
r a = radius of the meniscus
rb = radius of the cell bottom
t.r 2 = maximum difference of radius
squared in the interval
Calculation of Z average molecular weight was based on the
differential logarithmic form of the equilibrium equation
derived by Lamm (Lamm, 1929).
t.ln(l/r. dn/ dr)- ... 2. t.r
( -2M 1 - vp)w
2 RT
n = index of refraction
r = radius
M = molecular weight
v = apparent partial specific volume
p = solvent density
w = rotor speed
R = gas constant
T = absolute temperature
The reciprocal square roots of molecular weight calculated
at each radial interval were extrapolated to zero concen-
tration by the least squares method.

22
Intrinsic Viscosity
Flow times of enzyme solutions and dialysates were
measured in a 1 ml Ubbelohde semi-micro dilution type
viscometer of 0.004 centistokes per second (Cannon Instru
ment Company, State College, Pennsylvania). Constant
temperature was maintained at 25.00 0 C and regulated to
~ 0.005 0 C with a viscosity bath (Precision Scientific
Company, Chicago, Model S). Intrinsic viscosity was cal
culated by a least square extrapolation of the following
equation.
= [n] + k[n]2 c
=
t = solution flow time
to = so]vent flow time
P = solution density
Po = solvent density
c = concentration
[n] = intrinsic viscosity
k = Huggins constant
Calculations
Molecular weight and sedimentation coefficient calcula
tions were done by an IBM 360 computer. Other calculations

23
were done by a Digital PDP-8/S computer. All straight
lines were computed by the least squares method. Error
analyses are standard deviations (Baird, 1962). The
computer program listings and descriptions will be found
in the Appendix.

RESULTS
Sephadex G-IOO Chromatography of LADH
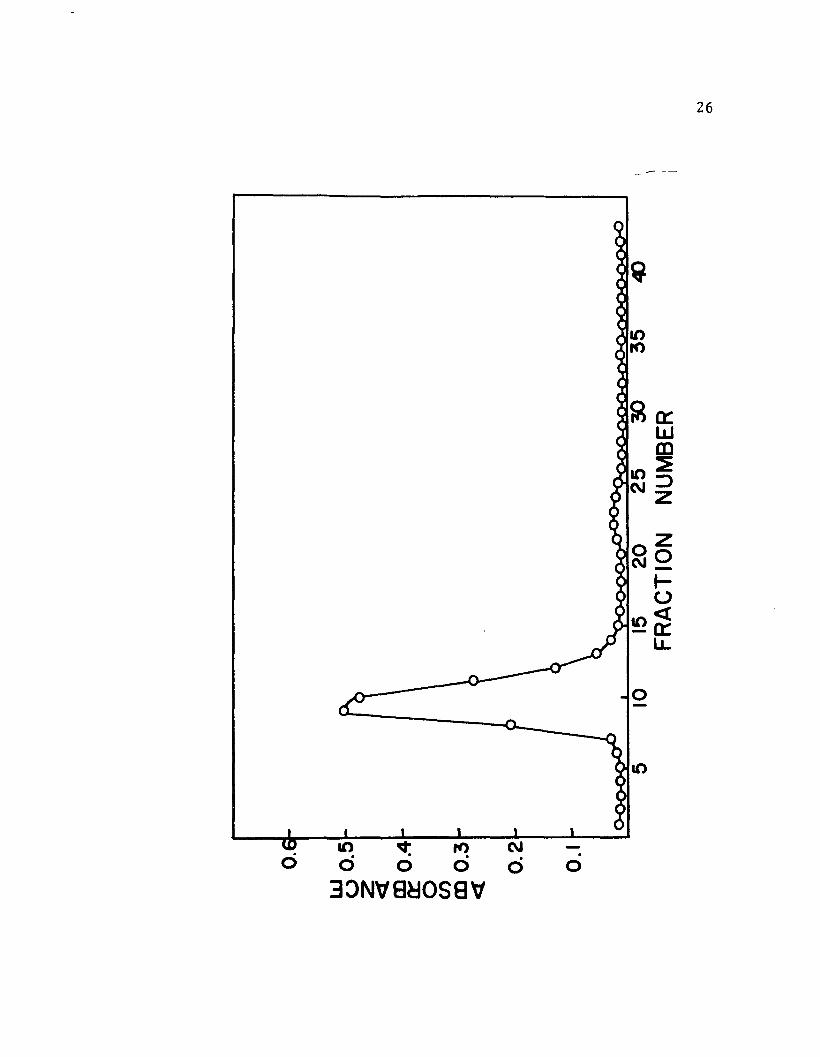
Chromatography of LADH with a Sephadex G-100 column
resulted in a major and a minor component. See Figure 1.
Recovery of protein was 104 per cent. The major component
contained 97 per cent of the total protein recovered.
The minor component, apparently of low molecular weight
since it was somewhat retarded by Sephadex G-100, was
3.2 per cent of the total protein recovered and had no
enzyme activity. Table II gives the specific activity of
fractions in the major peak. The small increase of spe
cific activity over that of unchromatographed LADH and
the high values of specific activity throughout the major
peak indicate that this preparation of LADH has a high
degree of homogeneity.
Carboxy Methyl Cellulose Chromatography of LADH
Figure 2 shows a chromatogram of LADH after elution
from a column of carboxy methYJ__cellulose (Whatman CM-52).
One initial minor component and one major component were
observed. Recovery of protein was 93 per cent. The major
component contained 93 per cent of the total protein
recovered and the minor component contained 7.S per cent.
Table III gives the specific activity of fractions in the
major and minor peaks. Both peaks had approximately the
25
Figure 1
Elution diagram for Sephadex G-IOO chromatography
of LADH. Absorbance at 280 m~ is plotted against
fraction number. Each fraction contained 2.0 mI.
7.8 mg of LADH were applied to the column and
eluted with 0.05 M tris, pH 7.1. Temperature was
24° C. Recovery of protein was 104 per cent.
~
o 0 0 0
3:>N'18~OS8'1
.o
26

TABLE II
Specific Activity of Fractions inMajor Peak from Sepfiadex G-Ioo
27
FractionNumber
8
9
10
11
12
13
original enzyme
Specific Activity(~mole min- 1 mg- 1)
8.13
8.42
8.42
8.57
8.04
7.45
8.23

28
Figure 2
Elution diagram for carboxy methyl cellulose (What
man CM-s2) chromatography of LADH. Absorbance at
280 m~ is plotted against fraction number. Each
fraction contained 1.0 mI. 5.5 mg of LADH were
added to the column with 0.01 M tris, pH 7.1. After
the first peak was eluted, the buffer was changed to
0.05 M tris, pH 7.5 to elute the second peak.
Temperature was 25 0 C. Recovery of protein was 93
per cent.

0.01 M TRIS,pH 7.1
807570
0.05 M TRIS,pH 7.5
30 35 60 65
FRACTION NUMBER2520
0.1
N1.0

TABLE III
Specific Activity of FractionsFrom Whatman CM-52
Fraction Specific ActivitrNumber (pmo1es min- 1 mg- )
27 8.57 + 0.12*-
28 8.23 + 0.00-
65 8.42 + 0.00
66 8.08 + 0.07
67 8.28 + 0.08
68 8.18 + 0.27-
69 7.94 + 0.03
70 7.31 + 0.05-
71 7.85 + 0.33-
original enzyme 8.23 + 0.23
*Average deviation of two determinations.
30
31
same specific activity as the unfractionated enzyme.
These results suggest that the two components are isozymes
and that a high degree of homogeneity is present. The
difference between the two components may be a difference
in amino acid content which apparently does not affect the
active center.
Starch Gel Electrophoresis of LADH
In starch gel electrophoresis at ~Is below 9, LADH
moved toward the cathode. See Figures 3a and 3b. When
electrophoresis was done at pHs 7 to 9 in 0.05 M tris
buffer or 0.05 M phosphate buffer, two minor bands and
one major band were observed. The major band appeared to
be about 90 per cent of the total protein. The leading
minor band had almost twice the mobility of the major band.
The other minor band was a trailing shoulder of the major
band. All bands had dehydrogenase activity. At pH 5.0
in 0.05 M succinate buffer, only one cathode migrating band
was observed. At pH 10.0, in 0.05 M carbonate buffer,
only one anode migrating band appeared. The minor bands
detected after electrophoresis in the pH 7 to 9 range are
presumed to be isozymes. Apparently, functional groups
in the minor components are titrated at pH 5.0 and pH 10.0
so that they display the same mobility as the major com
ponent at these pHs. Since all the protein bands observed
had alcohol dehydrogenase activity, the starting enzyme

32
Figure 3a
Starch gel electrophoresis of LADH in 0.05 M phos
phate buffer, pH 7.0. This run was done at 4° C and
7 volts/em for 12 hours. Protein was detected with
nigrosine stain.
Figure 3b
Starch gel electrophoresis of LADH in 0.05 M succin
ate buffer, pH 5.0. This run was done at 4° C and 7
volts/ern for 4 hours. Protein was detected with
nigrosine stain.

MINOR5/,
'"MAJOR CATHODE )
CATHODE )
33

34
appears to be homogeneous in enzymatic activity.
I
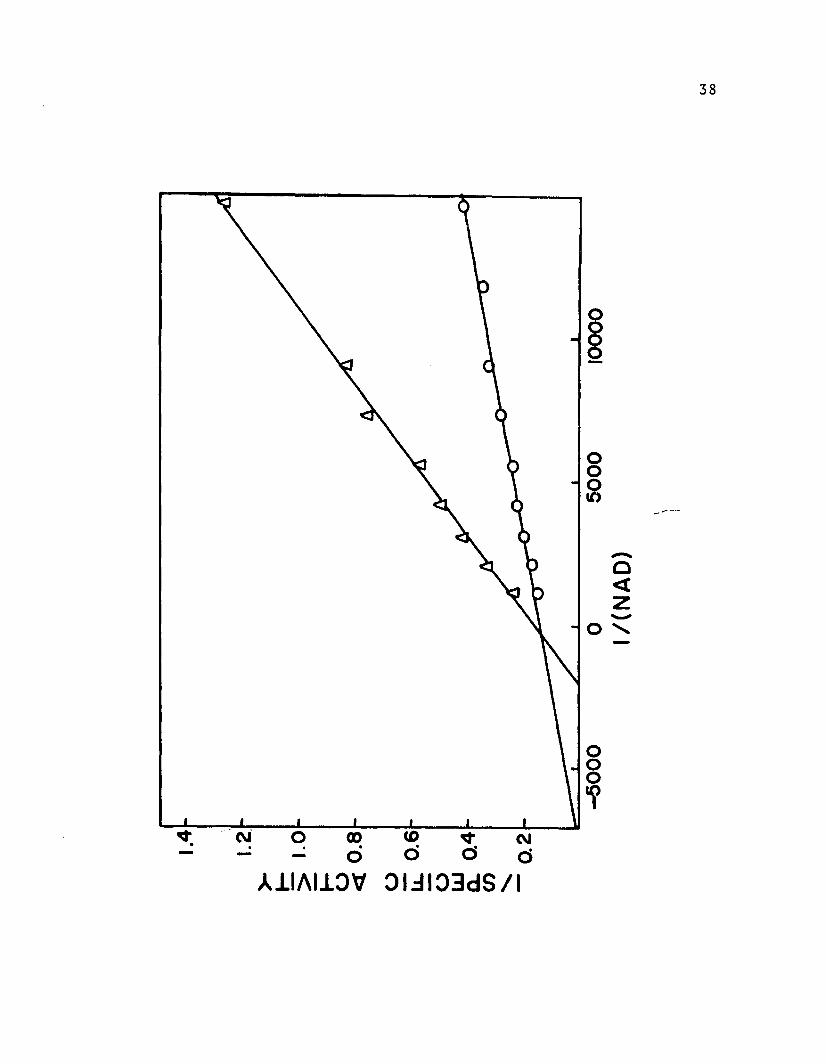
Kinetics of Inhib i tion of LADH by GuHC1
Kinetic measurements were made with limiting ethanol
concentrations (4.0 x 10- 4 M to 1.6 x 10- 2 M) and also
with limiting NAD concentrations (6.8 x 10- 5 M to 1.7 x
10- 3 M). Each case was examined with and without 0.5 M
GuHC1. Lineweaver-Burk plots of reciprocal specific
activity versus reciprocal concentration of substrate or
cofactor are shown in Figures 4 and 5. These data indicate
that there is competitive inhibition of the guanidinium
ion with NAD and mixed inhibition with ethanol. The
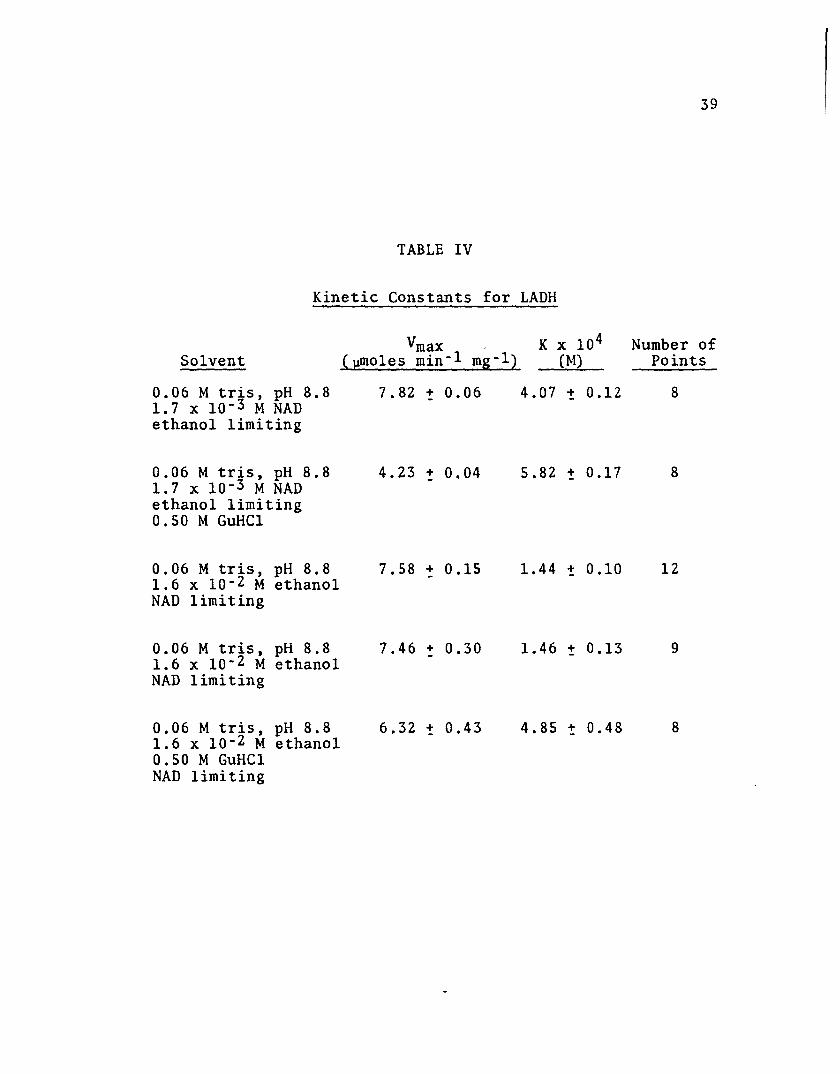
kinetic constants, Vmax and K, were calculated after a
least squares treatment of the data according to the fol
lowing equation (Eadie, 1952). See Table IV.
v = Vmax K v[S]
v = specific activity
Vmax = maximum specific activity
K = Michaelis constant
[S] = substrate or cofactor concen-
tration
Kinetics of Denaturation of LADH by GuHC1
The effects of GuHC1 on the activity of LADH when

35
Figure 4
Reciprocal specific activity is plotted against
reciprocal ethanol concentration (Lineweaver-Burk
plot). Specific activity was measured in 0.06 M
tris, pH 8.8, containing 1.7 x 10- 3 M NAD and 6.9 x
10- 8 M LADH at 25° C with and without 0.5 M GuHCl.
A 0.05 M GuHCl in assay.
o No GuHC1 in assay.

It') ~ rt')
o 0 0 d aAl.ll\ll.:>\f ~1.:U~3dS/1
-d
ooo(\J
ooo
--IoZ<t
oJ:ILU-"
ooQI
36

37
Figure 5
Reciprocal specific activity is plotted against reci
procal NAD concentration (Lineweaver-Burk plot) .
Specific activity was measured in 0.06 M tris, pH
8.8, containing 1.6 x 10- 2 M ethanol and 7.5 x 10- 8
M LADH at 25° C with and without 0.5 M GuHCl.
fj 0.05 M GuHCl in assay.
o No GuHCl in assay.
CD CD (\J
oddA1IAI1~\f ~ I=II ~3dS / I
oo~
-c«z-0 .......
ooo'?
38
39
TABLE IV
Kinetic Constants for LADH
Vmax K x 104 Number ofSolvent (}!IIloles min- l mg- l ) (M) Points
0.06 M tris, pH 8.8 7.82 + 0.06 4.07 't 0.12 81.7 x 10- 3 M NADethanol limiting
0.06 M tris, pH 8.8 4.23 + 0.04 5.82 + 0.17 81.7 x 10- 3 M NAD -ethanol limiting0.50 M GuHCl
0.06 M tris, pH 8.8 7.58 + 0.15 1.44 + 0.10 121.6 x 10- 2 M ethanol -NAD limiting
0.06 M tris, pH 8.8 7.46 + 0.30 1.46 + 0.13 91.6 x 10- 2 M ethanol -NAD limiting
0.06 M tris, pH 8.8 6.32 + 0.43 4.85 + 0.48 81.6 x 10- 2 M ethanol0.50 M GuHClNAD limiting

40
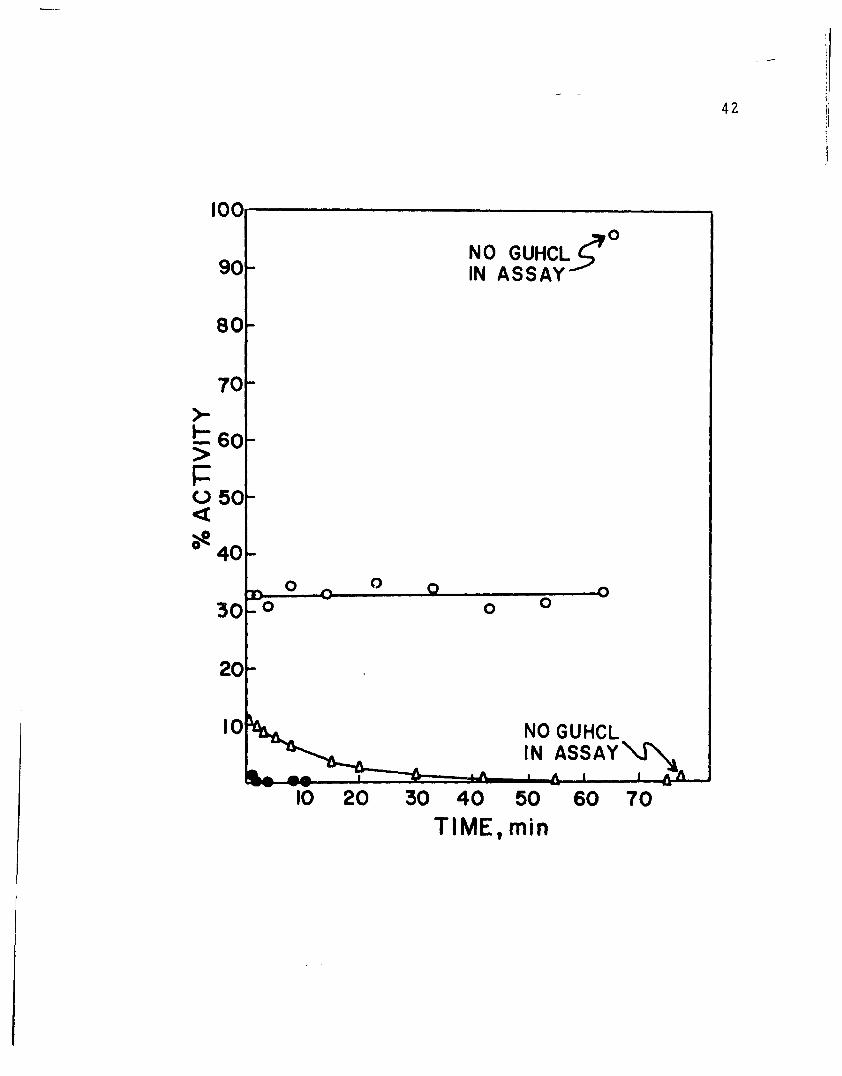
treated with 1 M, 2 M, and 3 M GuHCl at 00 C and assayed
in the presence of the same concentration of GuHCl are
shown in Figure 6. These data show the transition from
reversible inhibition by 1 M GuHCl to rapid and totally
irreversible denaturation by 3 M GuHC1. At the end of
each experiment, activity was determined in the absence of
GuHCl in order to indicate the reversibility of guanidine
treatment. This procedure caused a 1 to 250 dilution of
the GuHC1. The effect of 1 M GuHCl was found to be com
pletely reversible after one hour (96 per cent recovery of
activity). On the other hand, dilution after 2 M GuHCl
treatment resulted in only 1 per cent restoration of
activity after 75 minutes. Activity loss after 3 M GuHCl
treatment was irreversible within a short time.
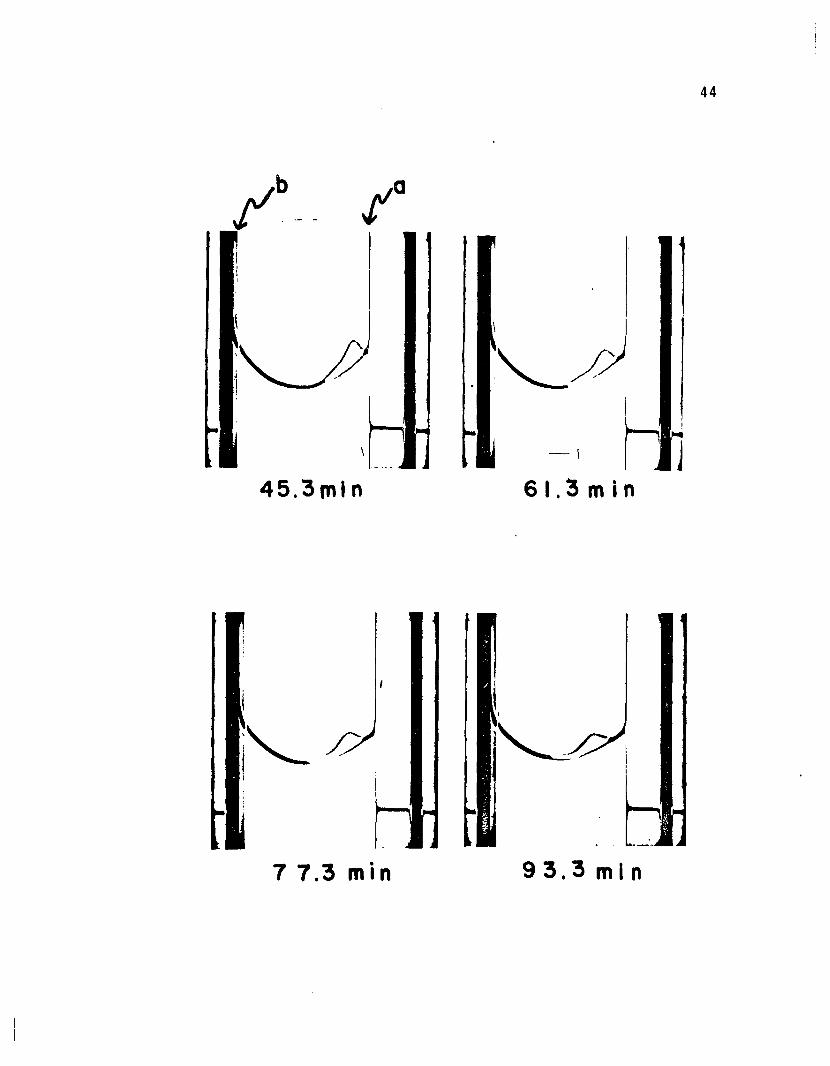
When a solution of LADH in 2 M GuHCl was examined by
ultracentrifugation, two Schlieren peaks were observed
(2.5 Sand 5.0 S). See Figure 7. The untreated enzyme
displayed only one peak (5.0 S). The appearance of two
peaks in GuHCl denatured LADH suggests an irreversible
interaction of LADH with GuHC1. Thus, a new structure
seems to be formed in 2 M GuHCl which cannot return to
its former state under the conditions of these experiments.
Whether this new structure is the result of dissociation
or the result of a large structural change without dis
sociation, can be determined by molecular weight measure
ments.
41
Figure 6
Per cent activity remaining in GuHCl treated LADH
is plotted against time. LADH was reacted with
1 M, 2 M, and 3 M GuHCl at 0° C. The same concen
tration of GuHCl was present in the activity assay
mixtures. At the end of each experiment, activity
was measured without GuHC1 present in the assay
mixture.
0 LADH in 1 M GuHCl.
A LADH in 2 M GuHCl.
• LADH in 3 M GuHCl.
•
1001.-------------------,
42
NO GUHCLSOIN ASSAY
oo o
NO GUHCLIN ASSAY~
10 20 30 40 50 60 70TIME, min
43
Figure 7
Sedimentation velocity of LADH in 2 M GuHCl was ob
served by a Schlieren optical system. The solvent
contained 0.05 M tris, 0.02 M thioglycolate, and 2.0
M GuHCl at pH 7.2. LADH dissolved in solvent was
centrifuged at 59,780 rpm in a cell containing a
double sector centerpiece (2.5°, 12 mm). Pictures
were taken at 16 minute intervals with a bar angle of
60° C. Zero time was when top speed was reached.
In this figure, a and b represent the meniscus and
cell bottom.
45.3,"ln
\
i"-u1 .
7 7.3 min
1
'--~
-\ ~ j61.3min
,I
'~
93.3mln
44
45
Apparent Partial Specific Volume of LADH in 5 M GuHCl
Apparent partial specific volumes (V) of LADH at 20° C
in tris buffer and in 5 M GuHCl are given in Table V.
The values of v in tris buffer agree quite well with the
v of 0.750 ml/gm obtained by Ehrenberg and Dalziel in
phosphate buffer (Ehrenberg and Dalziel, 1958). The
slight increase of v from 0.750 in tris buffer to 0.754
in 5 M GuHCl indicates little or no change of v when LADH
is denatured in GuHCl solution. Other laboratories have
found no change or a slight decrease in v for other proteins
dissolved in GuHCl (Seery et al., 1967; Kielley and
Harrington, 1960; Reithel and Sakura, 1963; Woods et al.,
1963; Marler et al., 1964). A v of 0.750 ml/gm was used
for calculating the molecular weight and sedimentation
coefficient of LADH in tris buffer and in 1 M GuHCl. For
calculations when LADH was in 3 M or 5 M GuHCl, a v of
0.754 was used.
Sedimentation Coefficient of LADH and Chymotrypsinogen A
Table VI gives observed and corrected sedimentation
coefficients after extrapolation of the reciprocal sedi
mentation coefficients to zero concentration to correct
for nonideality. The slopes of the extrapolations, also
listed in Table VI, are a measure of the nonideality of
each system. Solutions containing mercaptoethanol gave
significantly smaller slopes than solutions containing

TABLE V
Apparent Partial Specific Volume of LADH at 20° C
46
PycnometerConcentration Volume v
Solvent (mg ml- l ) (ml) (ml gm- l )
0.05 M tris, pH 7 . 5 9.85 5 0.750
0.05 M tris, pH 7.5 9.60 5 0.749
5 M GuHCl, pH 7.0 14.52 3 0.7570.1 M EtSH
5 M GuHCl, pH 7.0 4.80 5 0.7520.1 M EtSG

TABLE VI
Sedimentation CoefficientsSlope of Points in
0 SO l/S Extra-S20,obs 20
5W 20 obs po1ation
Enzyme Solvent (S)* (S * (m1 mg- 1 S-11
LADH 0.05 M tris, 4.93 ! 0.04 5.08 ! 0.04 0.00217 5pH 7.5
LADH 1 M GuHC1, 4.52 't 0.03 5.24 ! 0.04 0.00355 4pH 7.41.1 x 10- 3 DTE
LADH 3 M GuHC1, 1.47 "t 0.10 2.29 '! 0.15 0.00348 5pH 7.20.1 M EtSH
LADH 3 M GuHC1, 1.43 ! 0.04 2.25 ! 0.06 0.00458 \ 8pH 7.2DTT, IA
LADH 5 M GuHC1, 0.87 ! 0.09 1.98 ! 0.21 0.00607 4pH 7.00.1 M EtSH
LADH 5 M GuHC1, 0.94 "t 0.02 2.15 t 0.04 0.00813 8pH 7.0DTT, IA
CTogen 5 M GuHC1, 0.87 '! 0.06 1.83 '! 0.12 0.00658 6pH 7.00.1 M EtSH
CTogen 5 M GuHC1, 0.87 ! 0.02 1.87 ! 0.05 0.00864 8pH 7.0
~
DTT, IA ""'-J
* One Svedberg unit (S) = 10- 13 seconds.

48
dithiothreitol, dithioerythritol, or no reducing agent.
Since nonideality is minimized by the presence of mercap
toethanol, this reducing agent is preferred in experiments
where calculations require an extrapolation to zero con
cen tration.
For the purpose of comparing the results obtained
for LADH with a well characterized protein, the sedimen
tation coefficient was determined for chymotrypsinogen A
in 5 M GuHCl solution containing reducing agent. Subse
quent determi~~~ions of the molecular weight and intrinsic
viscosity of LADH were also compared to measurements of
these parameters for chymotrypsinogen A.
Diffusion Coefficient of LADH
The diffusion coefficient of LADH in tris buffer was
precise enough to extrapolate to zero concentration. See
Table VII. When diffusion experiments were done in GuHC1,
however, the forming of symmetrical and undisturbed syn
thetic boundaries became increasingly difficult as the
GuHCl concentration increased. This difficulty has been
observed by others (Creeth, 1967). Consequently the
precision was poor, and extrapolation to zero concentration
was not justified. Diffusion coefficients of LADH in GuHCl
represent average values for the concentration range of 4
to 8 rngjm1 .
.-_.---

49
TABLE VII
Diffusion Coefficients of LADH
D20,obs** D20,w** Number ofSolvent (F) * (F) tc Points
0.05 M tris, pH 7.5 6.11 t 0.12 6.23 t 0.12 4
1 M GuHC1~ pH 7.46.16 21.1 x 10- M DTE 5.84
3 M GuHC1, pH 7.23.80 0.23 110.1 M EtSH 3.22 t 0.20 +-
5 M GuHC1, pH 7.03.67 0.16 40.1 M EtSH 2.57 + 0.12 +- -
*One Fick unit (F)
**The diffusion coefficients in tris buffer were extrapolatedto zero concentration. In Gullel solutions the diffusioncoefficients were averaged for the concentration range of4 to 8 rng/rnl.
50
Molecular Weight of LADH from Sedimentation and Diffusion
Coefficients
Table VIII gives molecular weight calculations based
on the Svedberg equation.
Molecular Weight = S RTD (1 - 'Vp)
S = sedimentation coefficient
D = diffusion coefficient
v = apparent partial specific
volume
p = solvent density
R = gas constant
T = absolute temperature
The sedimentation and diffusion coefficients used in these
calculations are average values from Tables VI and VII.
The apparent slight increase of molecular weight for LADH
in 1 M GuHC1 may be due to a small amount of aggregation
since LADH is somewhat unstable in this environment. How-
ever, the error analysis indicates that the difference
is not significant. Even though the diffusion coefficient
is unreliable in 3 M and 5 M GuHC1 (Creeth, 1967), the
molecular weight of LADH in these solvents does appear to
be significantly decreased. These results suggest that
LADH dissociates into subunits in concentrated GuHCI.

TABLE VIII
Molecular wei~ht of LADH from Sedimentationand iffusion Coefficients
SO D v MolecularSolvent 20 ,w 20 )w eml gm- l ) Weight-
0.05 M tris, 5.08 ! 0.04 6.23 ! 0.12 0.750 79100 t 2100pH 7.5
1 M GuHCl, 5.24 t 0.04 6.16 0.750 82500pH 7.41.1 x 10- 3 MDTE
3 M GuHCl, 2.29 t 0.15 3.80 '! 0.23 0.754 59400 '! 7500pH 7.20.1 M EtSH
5 M GuHCl, 1.98 "!: 0.21 3.67 "!: 0.16 0.754 53200 ! 7900pH 7.00.1 M EtSH
V1~
52
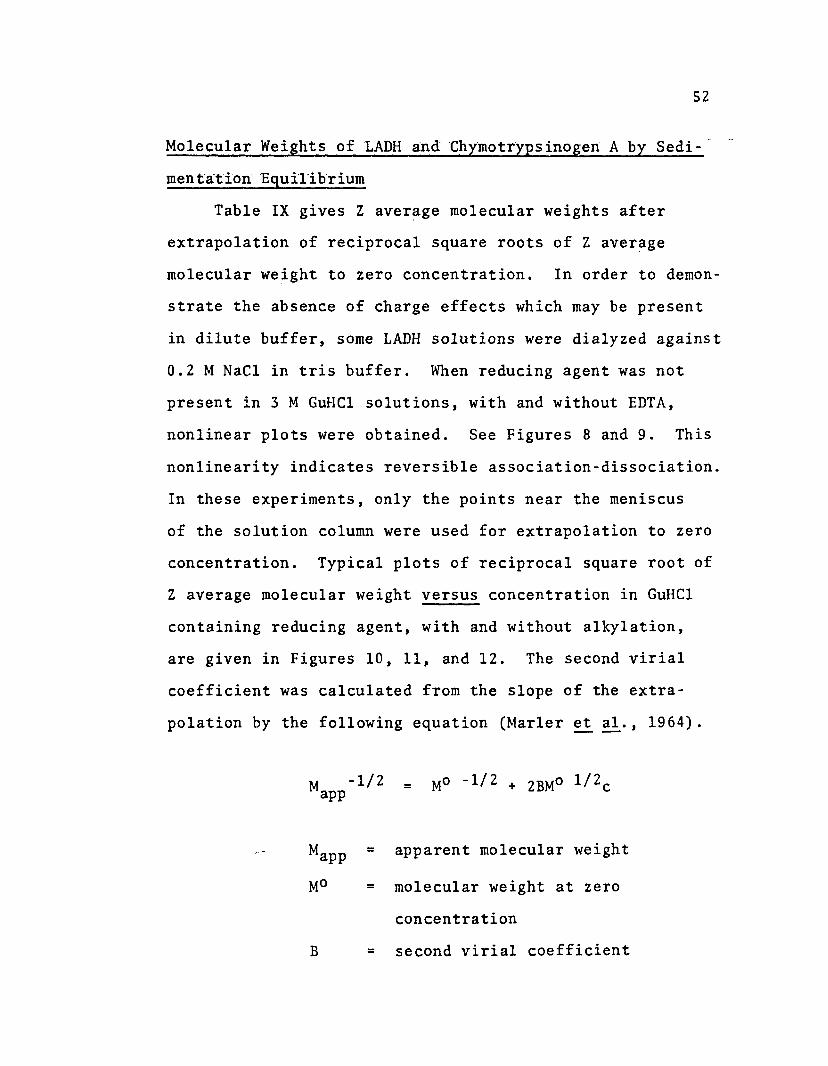
Molecular Weights of LADH and Chymotrypsinogen A by Sedi
mentation Equilihrium
Table IX gives Z average molecular weights after
extrapolation of reciprocal square roots of Z average
molecular weight to zero concentration. In order to demon-
strate the absence of charge effects which may be present
in dilute buffer, some LADH solutions were dialyzed against
0.2 M NaCl in tris buffer. When reducing agent was not
present in 3 M GuHCl solutions, with and without EDTA,
nonlinear plots were obtained. See Figures 8 and 9. This
nonlinearity indicates reversible association-dissociation.
In these experiments, only the points near the meniscus
of the solution column were used for extrapolation to zero
concentration. Typical plots of reciprocal square root of
Z average molecular weight versus concentration in GuHCl
containing reducing agent, with and without alkylation,
are given in Figures 10, 11, and 12. The second virial
coefficient was calculated from the slope of the extra
polation by the following equation (Marler ~ al., 1964).
M -1/2app =
Mapp = apparent molecular weight
MO = molecular weight at zero
concentration
B = second viria1 coefficient
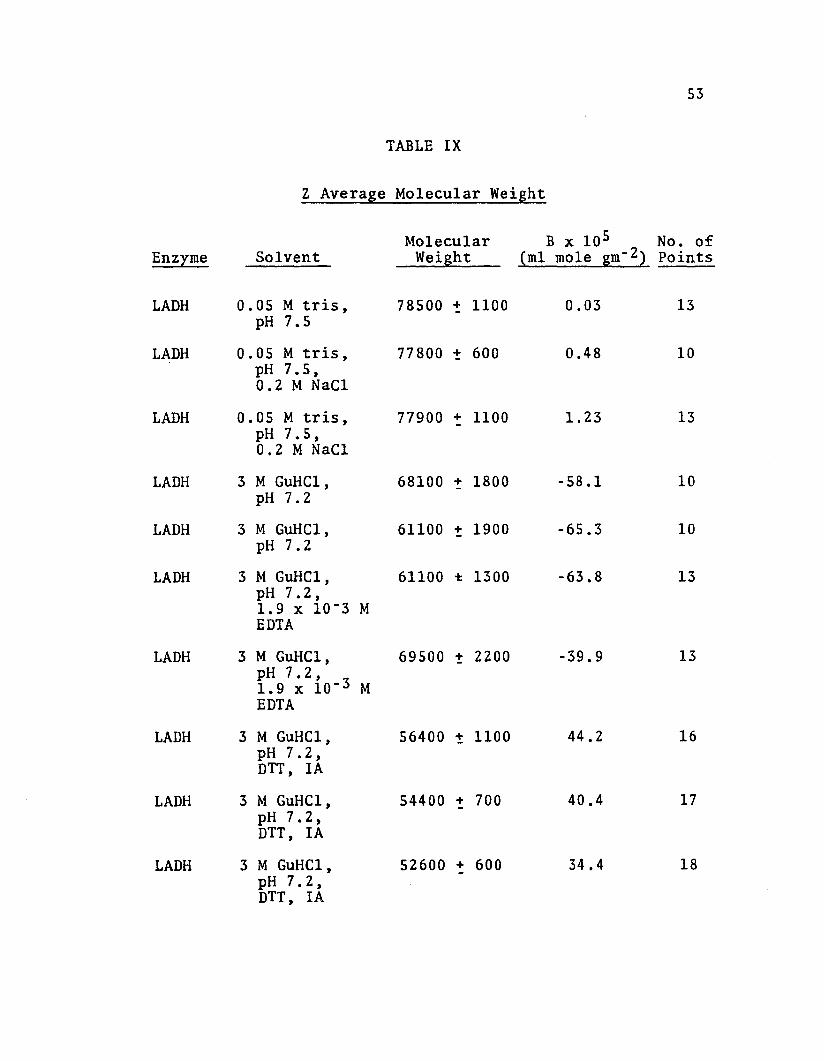
53
TABLE IX
Z Average Molecular Weight
Molecular B x 105 No. ofEnzyme Solvent Weight em1 mole gm- 2) Points
LADH 0.05 M tris, 78500 + 1100 0.03 13-pH 7.5
LADH 0.05 M tris, 77800 + 600 0.48 10pH 7.5,0.2 M NaC1
LADH 0.05 M tris, 77900 + 1100 1.23 13pH 7.5, -0.2 M NaC1
LADH 3 M GuHC1, 68100 + 1800 -58.1 10-pH 7.2
LADH 3 M GuHC1, 61100 + 1900 -65.3 10pH 7.2
LADH 3 M GuHC1, 61100 i: 1300 -63.8 13pH 7.2,1.9 x 10-3 MEDTA
LADH 3 M GuHC1, 69500 + 2200 -39.9 13pH 7.2, 3
M1.9 x 10-EDTA
LADH 3 M GuHC1, 56400 + 1100 44.2 16pH 7.2,DTT, IA
LADH 3 M GuHC1, 54400 + 700 40.4 17pH 7.2, -DTT, IA
LADH 3 M GuHC1, 52600 + 600 34.4 18pH 7.2, -DTT, IA

54
TABLE IX (Cont'd.)
Molecular B x 105 No. ofEnzyme Solvent Weight (m1 mole gm- 2) Points
LADH 5 M GuHCl, 50500 + 1000 54.8 15-pH 7.0,DTT, IA
LADH 5 M GuHC1, 47700 + 1200 51. 3 14-pH 7.0,DTT, IA
LADH 5 M GuHC1, 45700 + 700 24.0 13pH 7.0,0.1 M EtSH
LADH 5 M GuHC1, 45700 + 600 25.6 20pH 7.0,0.1 M EtSH
CTogen 5 M GuHC1, 23900 + 300 56.7 15-pH 7.0,DTT, IA
CTogen 5 M GuHC1, 23600 + 400 48.2 11-pH 7.0,DTT, IA

55
Figure 8
Reciprocal square root of Z average molecular weight
is plotted against LAnH concentration. Enzyme solu
tion was dialyzed against 3 M GuHCI for 48 hours.
Four mm columns of enzyme solution and dialysate were
put in a double sector cell (2.5°, 12 mm) and centri
fuged at 8225 rpm. When equilibrium was reached,
pictures were taken of the Schlieren optical system
with a bar angle of 54°.

It)
03.0)(
~I~::e«N 2.5
2.0
5
oo
o
o
10LADH,mg/ml
o
15
o
S6

57
Figure 9
Reciprocal square root of Z average molecular weight
is plotted against LADH concentration. The enzyme
solution was dialyzed against 3 M GuHCl containing
1.9 x 10- 3 M EDTA for 48 hours. Four mm columns of
enzyme solution and dialysate were put in a double
sector cell (2.5°, 12 mm) and centrifuged at 11,272
rpm. At equilibrium, pictures were taken of the
Schlieren optical system with a bar angle of 65°.

It)
03.5)(
N.......
';=:E
~ 3.0
2.5
o
o
o
o
5 10 15
LADH, mg/ml
58

59
Figure 10
Reciprocal square root of Z average molecular weight
is plotted against LADH concentration. Enzyme in
3 M GuHCl solution was treated with DTT and excess
iodoacetate and then dialyzed against 3 M GuHCI for
48 hours. Four mm columns of enzyme solution and
dialysate were put in a double sector cell (2.5°,
12 rom) and centrifuged at 17,250 rpm. At equili
brium, pictures were taken of the Schlieren optical
system with a bar angle of 55°.

6.0
It)
52 5.5)(
N
""I~:E« 5.0N
4.5o
o
~ 10 15
LADH. mg/ml
60

61
Figure 11
Reciprocal square root of Z average molecular weight
is plotted against LADH concentration. Enzyme in
5 M GuHCl solution was treated with DTT and excess
iodoacetate and then dialyzed against 5 M GuHCl for
48 hours. Four mm columns of enzyme solution and
dialysate were put in a double sector cell (2.5°,
12 mm) and centrifuged at 19,160 rpm. At equili
brium, pictures were taken of the Schlieren optical
system with a bar angle of 42°.

6.5
10o- 6.0)(
~I3:~«N 5.5
5.0
62
- ----. ---
5 10 15
LADH, mg/ml

63
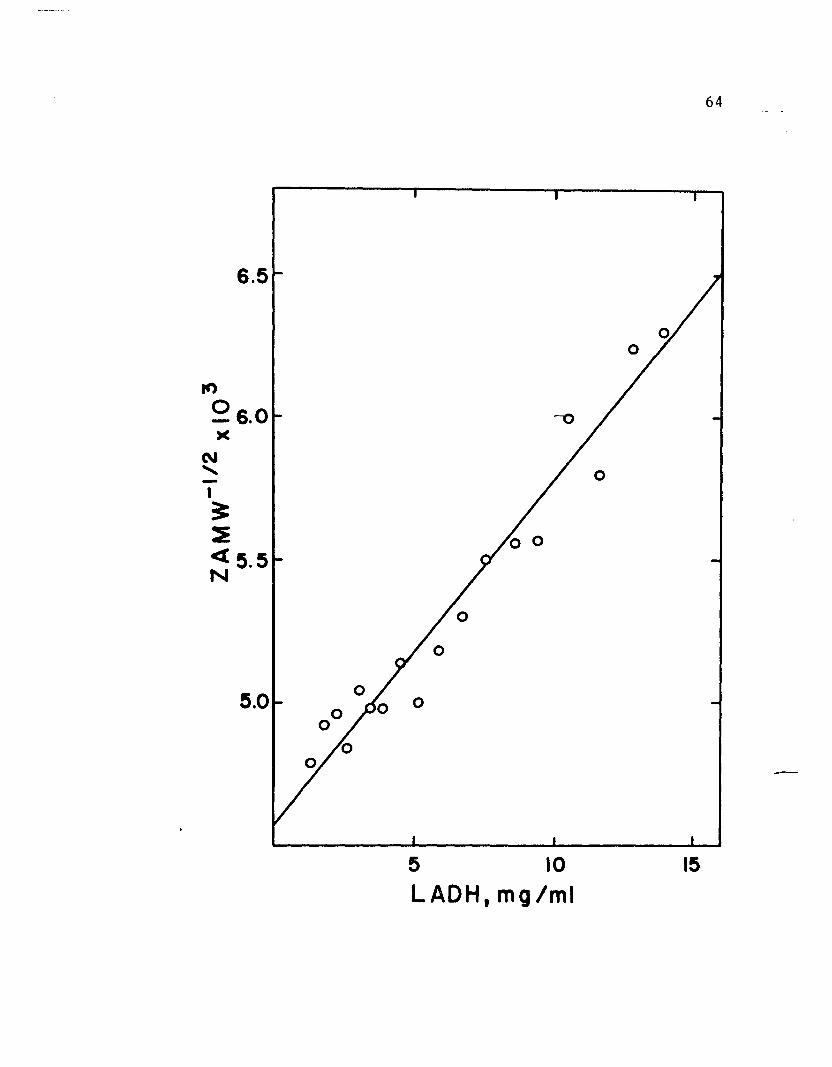
Figure 12
Reciprocal square root of Z average molecular weight
is plotted against LADH concentration. Enzyme in
5 M GuHC1 was dialyzed against 5 M GuHC1.containing
0.1 M mercaptoethano1 for 48 hours. Four mm column&-
of enzyme solution and dialysate were put in a double
sector cell (2.5°, 12 mm) and centrifuged at 19,160
rpm. At equilibrium, pictures were taken of the
Schlieren optical system with a bar angle of 45°.
64
6.5
If')
o-6.0)(
N.......
I
~:E~ 5.5N
5.0
5 10LADH, mg/ml
15

6S
c = concentration
In S M GuHCl with mercaptoethanol as the reducing agent,
the second virial coefficient was about half the value
obtained from solutions treated with dithiothreitol and
iodoacetate. As in the case of the sedimentation velocity
experiments, mercaptoethanol is the preferred reducing
agent when the calculations require an extrapolation to
zero concentration to correct for nonideality.
Intrinsic Viscosity of LADH and Chymotrypsinogen A
Intrinsic viscosities and Huggins constants are listed
in Table X. The Huggins constant is somewhat inaccurate
since it includes the error of the slope-plus twice the
error of the intrinsic viscosity. The Huggins constant
for LADH in 5 M GuHCl is 1.03, an average of three values.
This value is higher than those calculated for most other
proteins (Tanford, 1967). For a random coil, the expected
value of the Huggins constant is 0.35 and 0.40 (Huggins,
1942; Flory, 1953). The high Huggins constant calculated
for LADH suggests that LAnH is not completely a random
coil in S M GuHCl.
Zinc Content of LADH in GuHCl Solutions
After LADH was dissolved in 1 M, 2 M, or 3 M GuHCl and
dialyzed against three changes of GuHCl dialysate (volume

66
TABLE X
Intrinsic Viscosity of LADH and CTogen
IntrinsicViscosity Huggins No. of
Enzyme Solvent em1 gm- 1) Constant Points
LADH 3 M GuHC1, 26.5 t 0.5 3pH 7.2,DTT, IA
LADH 3 M GuHC1, 17.4 + 0.8 4pH 7.2,DTT, IA
LADH 3 M GuHC1, 26.4 + 0.4 3pH 7.2, -0.1 M EtSH
LADH 3 M GuHC1, 17.0 + 0.1 3pH 7.2, -8 x 10⁻³ MDTT
LADH 5 M GuHC1, 30.8 + 0.4 0.99 4pH 7.0, -DTT, IA
LADH 5 M GuHC1, 28.8 2pH 7.0,0.1 M EtSH
LADH 5 M GuHC1, 26.2 + 1.0 1. 24 4-pH 7.0,0.1 M EtSH
LADH 5 M GuHC1, 25.7 + 0.4 0.87 4pH 7.0, -0.1 M EtSH
CTogen 5 M GuHC1, 23.1 + 0.2 0.32 4pH 7.0, -DTT, IA
CTogen 5 M GuHC1, 22.0 + 0.3 0.25 4pH 7.0,0.1 M EtSH
67
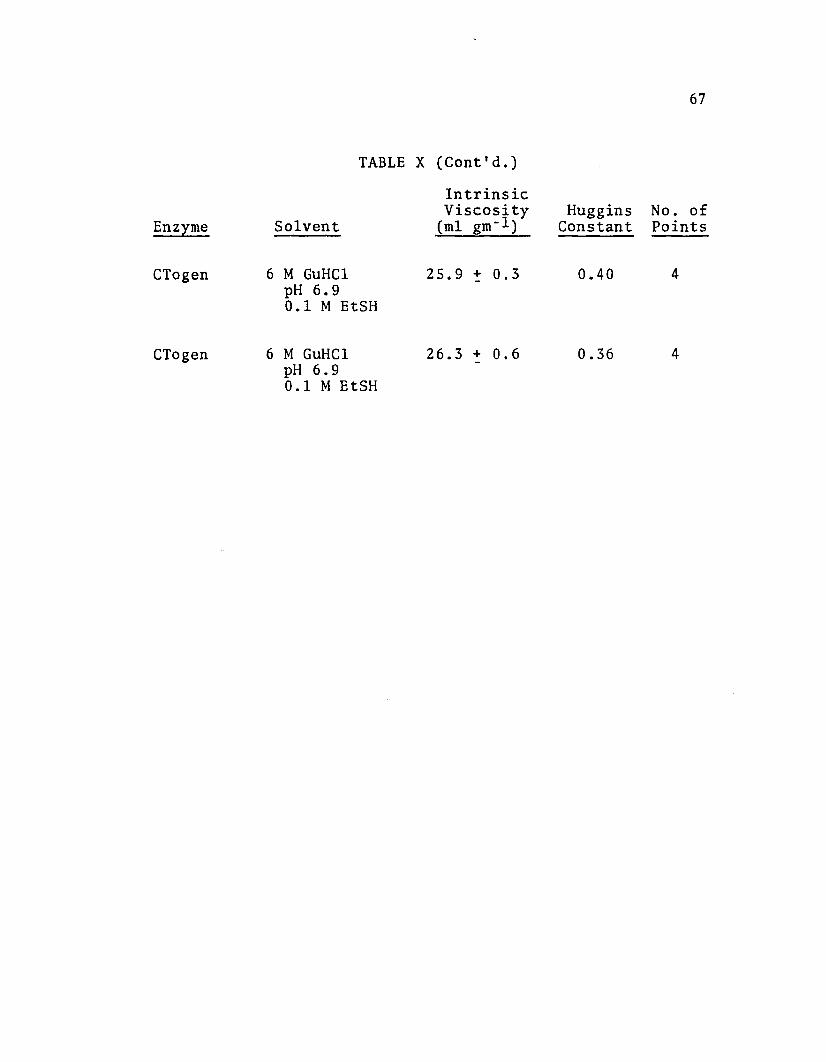
TABLE X (Cont'd.)
IntrinsicViscosity Huggins No. of
Enzyme Solvent (ml gm- l ) Constant Points
CTogen 6 M GuHCl 25.9 + 0.3 0.40 4-pH 6.90.1 M EtSH
CTogen 6 M GuHCl 26.3 + 0.6 0.36 4pH 6.9 -0.1 M EtSH

68
ratio of dialysate to enzyme solution was 250), zinc
analyses presented in Table XI were obtained. Dialysis
against 1 M GuHCl caused a loss of only 11 per cent of the
zinc from LADH. However, all zinc was removed when
exhaustive dialysis was carried out in 2 M or 3 M GuHCl.
The effect of EDTA on zinc removal from LAnH in 1 M
GuHCl was measured by sedimentation experiments, followed
by zinc analysis of the supernatant and the bottom layer
after all the protein had sedimented to the bottom of
the cell. See Table XII. Under the conditions of these
experiments, about 65 per cent of the zinc was removed.
Eventually aggregation of LADH was observed, even in the
presence of reducing agent. Since DTT and DTE are quite
reactive and consequently unstable (Cleland, 1964), their
effectiveness decreases as a function of time. Calculated
sedimentation coefficients indicate that no subunit was
formed during these experiments.
When LADH in 3 M GuHCI was dialyzed to equilibrium
against GuHCI dialysate (volume ratio of dialysate to
enzyme solution was 8), 80 per cent of the zinc remained
bound to the enzyme. An analogous experiment with the
addition of EDTA resulted in complete zinc removal from
LADH. See Table XIII. These results indicate that zinc
is weakly bound to LADH in 3 M GuHCl and that the addition
of EDTA or exhaustive dialysis removes all zinc. Similar
data were obtained by Drum and coworkers for LADH in 8 M

TABLE XI
Zinc Removal from LADH ByExhaustive Dialysis
Solvent
0.05 M tris, pH 7.5
1 M GuHCl, pH 7.4
2 M GuHCl, pH 7.3
3 M GuHCl, pH 7.2
% Zinc Bound
100
89
o
o
69

70
\ TABLE XII
Zinc Removal from LADH in 1 M GuHC1 Containing EDTA
Time % Zinc(Hr) Bound
Experiment A* 0 100
2 80
21 48
49 37
S20,w
4.68
4.67
4.81,14.4,37.9
Experiment B** o
2
20
49
100
70
48
34
4.65
4.70
4.71, 46.3
*Solution composition: LADH, 3.85 mg/m1; enzyme zinc,2.02 x 10- 4 M; EDTA, 2.49 x 10- 3 M; DTE, 1.08 x 10⁻² M;tris, 0.05 M, pH 7.4; GuHC1, 1.0 M.
*"'Solution composition: LADH, 4.51 mg/m1; enzyme zinc,2.20 x 10- 4 M; EDTA, 4.98 x 10- 3 M; DTT, 216 x 10- 2 M;tris, 0.05 M, pH 7.4; GuHC1, 1.0 M.

TABLE XIII
Zinc Removal from LADH ByEquilibrium Dialysis
71
Solvent
0.05 M tris, pH 7.S
3 M GuHCl, pH 7.2.-,---- ..
3 M GuHCl, ~H 7.2,1.9 x 10-3 M EDTA
% Zinc Bound
100
80
o
urea (Drum et a1., 1967).
72

73
DISCUSSION
Though the kinetics of LADH have been thoroughly
studied (Theorell, 1967), relatively little is known
about LAnH structure. The number of subunits in LADH
is in dispute, and only preliminary investigations have
been made concerning the role of zinc in structure and
catalysis. The object of the present work was to deter
mine the number of subunits in LADH and to further
elucidate the function of nnc in the enzyme.
The LAnH prepared by Boehringer exhibited a high
degree of homogeneity as shown by chromatography and
starch gel electrophoresis. Sephadex G-IOO chromatogra
phy revealed about 3 per cent of low molecular weight
material. See Figure 1. Carboxymethyl cellulose chro
matography indicated a minor component (7 per cent) which
had the same specific activity as the major component.
See Figure 2. Starch gel electrophoresis (Figure 3)
confirmed the presence of minor components presumed to
be isozymes. Since the LAnH prepared by Boehringer
appeared to be well above 90 per cent homogeneous by all
criteria, it was used without further purification.
The molecular weight of Boehringer LADH was deter
mined by equilibrium sedimentation in tris buffer and
in tris buffer containing 0.2 M NaCl. See Table IX.
Since no significant change was observed when NaCl was

74
present, charge effects on measurements of LADH in dilute
neutral tris buffer appear to be negligible. Averaging
the results for the two conditions gives a Z average
molecular weight of 78,200 for LADH in dilute neutral
buffer. This value is in good agreement with Hamburg
who found 78,700 and with Vallee and coworkers who found
80,000 (Hamburg, 1966; Drum et a1., 1967).
Figure 6 shows that the effect of 1 M GuHCl on the
kinetics of LADH is reversible. When LADH was assayed
for activity in the presence of 1 M GuHC1, its activity
was 33 per cent of activity measured when no GuHC1 was
present in the assay mixture. After being treated with
1 M GuHCl at 00 C for one hour, enzymatic activity of
LADH was measured in the absence of GuHC1. This condi
tion represents a 1 to 250 dilution of the GuHCl. Nine
ty-six per cent of the enzymatic activity was recovered
indicating complete reversibility of the effect of 1 M
GuHC1. Lineweaver-Burk plots (Figure 5) indicate that
guanidinium ion competitively inhibits LADH activity
by interfering with NAD binding. With limiting ethanol,
the inhibitory effect of GuHC1 is mixed (Figure 4). Such
results suggest that the primary kinetic event is the
addition of NAD or NADH to the enzyme and that the rate
limiting step may be the dissociation of the cofactor
enzyme complex. Similar conclusions have been made by
others (Theorel1 and Chance, 1951; Theorel1 and
75
Bonnichsen, 1951; Dalziel, 1962).
Addition of GuHCl to the 2 M level resulted in ir
reversible denaturation. After 2 M GuHC1 treatment,
enzymatic activity was not recovered when LADH was assayed
in the absence of GuHC1 (Figure 6). Although the GuHCl
was diluted 1 to 250, recovery of activity was only 1 per
cent. The two components observed by sedimentation
velocity (Figure 7) also suggest irreversibility. If
the system were reversible, the Schlieren pictures would
be expected to show only one peak. When compared to LADH
in tris buffer, this peak should have a lower sedimenta
tion coefficient in the case of reversible denaturation
or dissociation and a higher sedimentation coefficient in
the case of aggregation. Although reversibility was not
observed in these experiments, some reversibility should
be possible if suitable conditions were found. One lab
oratory has reported reversibility of activity after 8 M
urea denaturation of LADH when reducing agent and excess
zinc were present (Drum et al., 1967) .'"'=--"'-
A molecular weight calculation from sedimentation
and diffusion coefficients gave a value of 82,500 for
LADH in 1 M GuHC1. See Table VIII. Although this result
is slightly higher than the molecular weight of 79,100
found for LADH in tris buffer by the same method, the
error analysis shown in Table VIII shows that both results
are within experimental error. The apparent small increase

--
76
of molecular weight in 1 M GuHCl is not surprising,
since LADH is unstable in this environment and tends to
aggregate. Clearly, LADH does not dissociate in 1 M
GuHCl, though there appears to be some loosening of the
structure which results in instability and leads to a~gre
gation. The formation of intermolecular disulfide bonds
may be a factor in LADH aggregation.
The effect of EDTA on LADH in-! M GuHCl is shown in
Table XII. About 65 per cent of the zinc in LADH was
removed in 48 hours. At that time, some aggregation was
observed which mayor may not be due to zinc removal.
Sedimentation velocity calculations indicate that no sub
units were formed at any time during these experiments.
The sedimentation coefficient (SZO,w) did not drop below
4.7, the value for native LADH. Since exhaustive dialysis
of LADH in tris buffer, pH 7.5, against· EDTA solution
causes no zinc removal (Akeson, 1964), the loss of zinc
from LADH in 1 M GuHCl when EDTA is present again suggests
that the enzyme structure is loosened in this environment.
Zinc does not seem to play an important role in subunit
association, because the removal of zinc in 1 M GuHC1, a
structure-loosening environment, does not result in dissoc
iation.
Sedimentation equilibrium studies of LADH in 3 M
GuHC1, with and without EDTA, revealed information about
subunit association. The curvature of molecular weight
77
data shown in Figures 8 and 9 s~ggests a reversible
association-dissociation system (Adams, 1967). Irrever
sible aggregation, a possible alternative hypothesis,
does not explain the large negative slope near the menis
cus. If aggregation of subunit were the only process
occurring in 3 M GuHCl, the molecular weight data should
be concave down rather than concave up as shown in
Figures 8 and 9. The best explanation for this data is a
mUltiple equilibrium between subunit, dimer, and trimer
with the possibility of some irreversible aggregation at
the bottom of the cell. The extrapolated molecular weight
values for LADH in 3 M GuHCl, with and without the presence
of EDTA, are shown in Table IX. These values (61,000 to
69,000) are somewhat artificial since points near the
meniscus were arbitrarily chosen for the extrapolation.
Curvature near the meniscus would cause the molecular
weight at zero concentration to be lower than the extra
polated values and would result in a molecular weight
approaching that of the subunit. Figures 8 and 9 indicate
that the presence or absence of EDTA has no effect on the
molecular weight distribution of LADH in 3 M GuHCI.
Table XIII shows that the addition of EDTA to a solution
of LADH in 3 M GuHCI causes all bound zinc to be removed.
Since zinc removal had no effect on the molecular weight
distribution, zinc appears to have little or no role in
subunit association. This conclusion is at variance with

78
the results of Vallee and coworkers who found that the
molecular weight of LADH in 8 M urea, when treated with
EDTA or mercaptoethanol, decreased from 40,000 to 20,000
(Drum et al., 1967).
Quite different sedimentation equilibrium data were
obtained for alkylated LADH in 3 M GuHCl. The straight
line relationship with a large positive slope shown in
Figure 10 is typical for a homogeneous protein subunit
in concentrated GuHCl. The molecular weight of alkylated
LADH in 3 M GuHCl is 54,500, an average of three deter
minations. See Table IX. Apparently alkylation destroyed
the reversible system observed previously and resulted
in the presence of subunit and perhaps some dimer. The
large difference in sedimentation equilibrium behavior
of LADH before and after alkylation indicates that sulf
hydryl groups have a role in subunit association. This
role may include hydrogen bonding between sulfhydryl groups
and other residues or ionic sulfur bonding to regions of
positive charge in adjacent peptide chains. The presence
of mercaptoethanol or the alkylation of cysteine residues
would destroy such associations.
The data in Table IX indicate a slight decrease in
molecular weight for alkylated LADH when the environment
was changed from 3 M to 5 M GuHCl. This decrease in
molecular weight from 54,500 in 3 M GuHC1 to 49,100 in
5 M GuHCl suggests that some additional dissociation has

79
occurred. The best molecular weight results were obtained
when LAnH was dissolved in 5 M GuHCl containing mercap
toethanol. The average value for the Z average molecular
weight of LADH in 5 M GuHCl containing 0.1 M mercaptoe
thanol is 45,700. This value is in reasonable agreement
with the result of Hamburg who reported a molecular weight
of 42,000 in 7 M urea containing reducing agent. He
assumed a vof 0.735 (Hambu~,-1966). Casti1lino and
Barker have reported a molecular weight of 41,000 for
LADH dissolved in 6 M GuHC1 containing reducing agent.
They assumed that v is 0.74 (Casti11ino and Barker, 1968).
If a v of 0.735 is assumed for LADH in 5 M GullC1 contain
ing 0.1 M mercaptoethano1, the molecular weight calculated
from data of this thesis would be lowered to 40,200. The
fact that the molecular weight, calculated with the measured
v of 0.754, was about 10 per cent higher than expected
may be due to incomplete dissociation, to solvent binding
to the enzyme, or to an error in the measurement of v.
It is tempting to question v, since its value measured in
5 M GuHCI is slightly higher than the value observed in
dilute buffer solution. See Table IV. Other laboratories
have reported no change or a slight decrease of v when
proteins were dissolved in concentrated GuHCl (Kie11ey
and Harrington, 1960; Woods ~ al., 1963; Reithel and
Sakura, 1963; Marler et al., 1964; Seery ~ al., 1967).
On the other hand, binding of solvent can account for 5

80
to 10 per cent of the molecular weight according to the
results obtained when myosin was dissolved in 5 M GuHCl
(Kielley and Harrington, 1960).
The molecular weight of LADH decreases approximately
10 per cent when the GuHCl concentration is increased
from 3 M to 5 M. Such a small decrease when the denatur
ing agent was nearly doubled implies that further increase
in denaturant will not significantly change the molecular
weight of LADH. Consequently, these data indicate that
there are no more than two subunits in LADH. This conclu
sion does not agree with the results of other workers who
have reported that LADH is composed of four subunits
(Drum et al., 1967; Cheng et al., 1968).
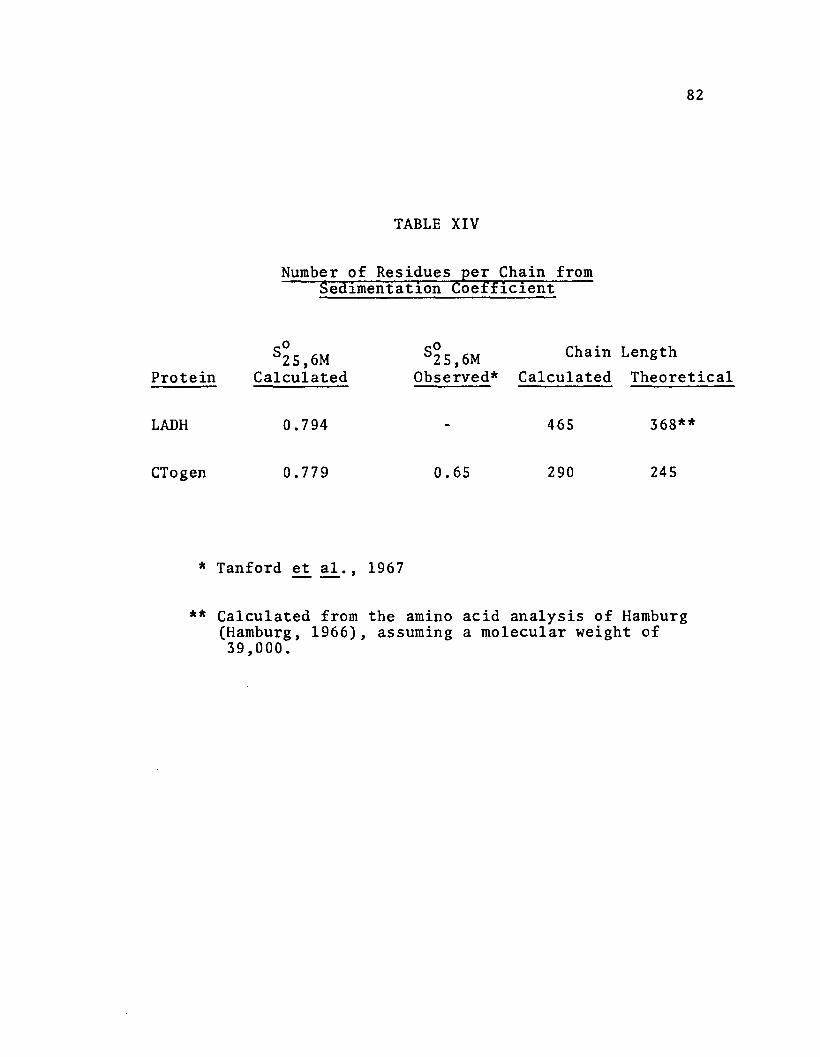
The constants of Tanford's equations for sedimentation
velocity and viscosity were determined empirically in 6 M
GuHCl and 0.1 M mercaptoethanol at 25° C by measuring the
sedimentation coefficient and intrinsic viscosity of
twelve proteins (Tanford et al., 1967). These equations
are given below.
[n]
=
=
(1 - vp) 0.286 NO. 473
0.716 NO. 66
SO = sedimentation coefficient at zero
concentration

81
p = solvent density
v = apparent partial specific volume
N = number of residues per chain
[n] = intrinsic viscosity
The average sedimentation data from Table VI for LADH and
chymotrypsinogen A in 5 M GuHCl were corrected to 6 M
GuHCl containing 0.1 M mercaptoethanol at 25 0 C by the
method outlined by Schachman (Schachman, 1957). The cal
culated number of residues per chain is compared with the
expected chain lengths in Table XIV. Both LADH and chymo
trypsinogen A appear to be longer than the theoretical
chain lengths. Table XV shows calculations of the number
of residues per chain from the average intrinsic viscosity
data obtained for the two proteins in 5 M GuHCl (Table X).
These results indicate chain lengths less than expected
for LADH and chymotrypsinogen A. In both sedimentation
velocity results and viscosity results, the difference
between expected and calculated number of residues per
chain for LADH and chymotrypsinogen A may be attributed to
a small conformational change when the solvent containing
0.1 M mercaptoethanol, is changed from 5 M to 6 M GuHCl.
Table X shows that the intrinsic viscosity of chymotryp
sinogen A increases from 22.0 to 26.1 for this solvent
change reflecting a difference in protein conformation.
82
TABLE XIV
Number of Residues per Chain fromSedimentation Coefficient
Protein
oS25,6M
CalculatedS~5,6M
Observed*
Chain Length
Calculated Theoretical
LADH
CTogen
0.794
0.779 0.65
465
290
368**
245
* Tanford et a1., 1967
** Calculated from the amino acid analysis of Hamburg(Hamburg, 1966), assuming a molecular weight of39,000.

83
TABLE XV
Number of Residues per Chain fromIntr1ns1c Viscosity
Intrinsic Intrinsic*Viscosity Viscosity
in 5 M GuHCI in 6 M GuHCI Chain LengthProtein eml gm- 1 ) (ml gm- 1) Calculated Theoretical
LADH 27.9 257 368**
CTogen 22.5 26.8 186 245
* Tanford et al., 1967
** Calculated from the amino acid analysis of Hamburg(Hamburg, 1966), assuming a molecular weight of39,000.

84
The latter value agrees with the result obtained by Tanford
and coworkers for chymotrypsinogen A in 6 M GuHCl contain-
ing 0.1 M mercaptoethanol (Tanford, 1967). If the calcu
lated number of residues per chain for LADH are corrected
for the apparent conformational change due to different
GuHCl concentrations, the molecular weight of LADH in 5 M
GuHCl would be about 40,000. From sedimentation equilibrium,
sedimentation velocity, and viscosity data, the molecular
weight of LADH in 5 M GuHCl is between 40,000 and 45,000.
Thus from three criteria, LADH has a structure composed of
two subunits.

85
APPENDIX
FORTRAN Programs for Calculations
Programs 1 and 2 are for use on an IBM 360 computer.
The other programs are for use on a Digital Equipment Company
PDP-SiS computer.
1. Sedimentation Coefficient - The first data card should
have only one number which corresponds to the number
of groups of data. For example, if five sedimentation
velocity runs were made, then the first data card should
have the number as. The second data card should have the
ten numbers indicated in statement #12 of the program
with the format of statement #13, where CONC is the ini
tial concentration, EN is the number of photographic
frames read, RO is the distance from the center of
rotation to the first reference hole (approximately
5.7 cm), REFH is the distance between the left and right
reference holes in the counterweight (approximately 1.6
cm), RPM is the revolutions per minute of the rotor,
VBAR is the apparent partial specific volume, VISS is
the relative viscosity of the solvent to water, DENS is
the relative density of the solvent to water, VISW is
the ratio of viscosity of water at the temperature of the
run to the viscosity of water at 20 0 C., DENW is the den
sity of water at the temperature of the run. Following
the second data card there should be N cards each contain
ing the four numbers indicated in statement #15 of the

86
program with the format of statement #16, where T is the
time in minutes of each set of variables after the rotor
has reached the rpm of the run, ELF is the left refer
ence line, XM is the observed position in the x direction
of the Schlieren maximum, and RT is the right reference
line. The last data card of each group should have the
three numbers indicated in statement #36 of the program
with the format of statement #37, where EL is the left
reference line, XONE is the meniscus, and R is the right
reference line. It would be best to measure these
numbers on the first and last photographic frames, then
calculate XONE minus EL of both frames to see if the
meniscus did not change. Average the R's, XONE's, and
ELls of the first and last frames for the data of this
card. If a synthetic boundary cell was used, use the
left reference line, the Schlieren maximum, and the right
reference line of the first frame for the three numbers
of this data card. Then put in the data cards of the
second group of data with one card like statement #12,
N cards like statement #15, and one card like statement
#36, and so forth until all groups of data are inserted.
Readout will be S observed, l/S observed, SZOw'
l/SZOw' the delta y's (residuals) of each set of data
for the least squares straight line plot of log radius
versus time, the standard deviation of the residuals,
the standard deviation of SZOw' the radius of the
meniscus, the radius of the Schlieren maximum in the

first frame, and the average concentration during the
run (the concentration of the plateau region at the
half time of the run).
87
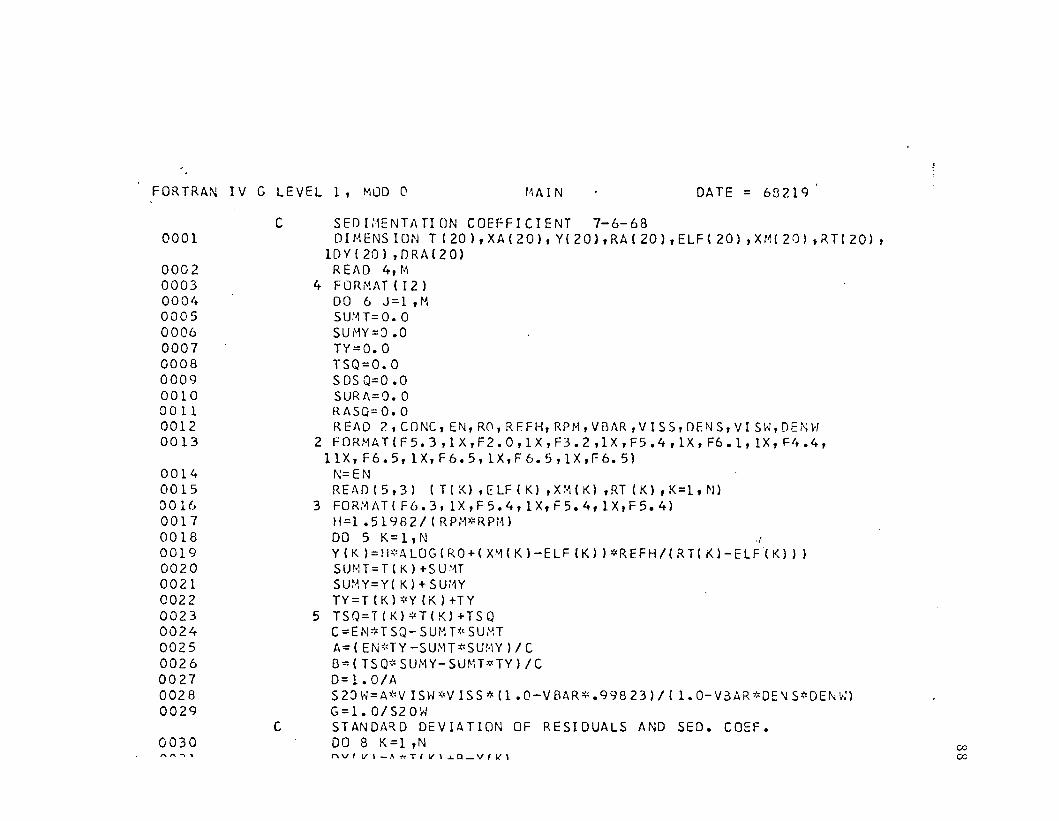
FORTRAN IV G LEVEL 1, MuD 0 r~A I N DATE = 68219
C0001
00020003OOO't000500060007000800090010001100120013
0014001500160017001800190020002100220023002400250026002700280029
C0030
SEDH1ENTIITION COEFFICIENT 7-6-68[) I MENS ION T ( 20 ) , XA ( 2 0 ) , Y( 2 0 ) , RA ( 20 ) , ELF ( 20 l ,X r~ ( 20) t RT ( 20) ,
lOY(20) ,ORA(ZO)REll 0 4,1-1
4 FuR 1'\ IIT ( I Z )D06J=1,MSU~~T=O.O
SUI'1Y=O .0TY=O.OTSQ=O.OSOS Q=O.OSURA=O.ORASQ=O.OREAD 2,CDNC,EN,RO,REFH,RPM,VBAR,VISS,DENS,VISW,DENW
2 FORMAT(F5.3,lX,F2.0,1X,F3.2,lX,F5.4,lX,F6.1,lX,F4.4,11X, F6.5, lX,F6.5, lX,F6.5,lX,r-6. 5)
N=ENREAO(5,3l (T(K),ELF(K) ,X,'·\CK) ,RT(K),K=l,N)
3 FOR:-1I1T( F6.3, lX,F5.4,lX,F5.4,lX,F5.4)H=1.51982/(RPM*RPM)DO 5 K=l,N .r·Y ( K ) = H~: ALOG ( R0 + ( XM( K ) - ELF (K) ) * REF H /( RT( K) - ELF( K) ) )Surn= T ( K ) + SU~n
SU~W=Y( K)+SUiWTY=T(K)*Y{K)+TY
5 TSQ=T(K)*T(K)+TSQC=EN*TSQ-SUMT*SUMTA=(EN*TY-SU~T*SUMY)/C
B=(TSQ*SUMY-SUMT*TY)/CD=l.O/AS20W=A*VISW*VISS*(1.0-VBAR*.99823)/(1.0-V3AR*DE~S*DENW)
G=l. 0/S20WSTANDA~D DEVIATION OF RESIDUALS AND SED. COEF.DO 8 K =1 ,NnVIV'-~~Tlv,~n_Vlv'
coCXJ

002400250026002700280029
003000310032003300340035003600370038003901)40004100428043004400(. ~00't60047004 R00490050005100520053005400550(,560057005800590060
C=EN*rSQ-SUMT*SUMTA=(EN*TY-SU~T*SUMY)/C
B=(TSQ*SUMY-SUMT*TY)/CD=l.O/AS28W=A*VISW*VISS*(1.0-VBAR*.99823)/(1.0-V3AR*DE~S*DENW)
G=1.0/S20WC STANDA~D DEVIATION OF RESIDUALS AND SED. CDEF.
DO 8 K=1 ,NDY(K)=A*T(K)+B-Y(K)
8 SOSQ=DY(K)*OY(K)+SOSQSY=SQRT(SOSQ/(EN-l.0) )F=C*(EN-Z.O)SA=SQRT( EN*SDSQ/F}*SZOw/AREAD 28,EL,XONF.,R
20 FORMAT(F5.4,1X,F5.4, 1;{,F5.4)AVRA=RO+(XONE-EL)*REFH/(R-EL)RB=R0 + ( XtH 1 ) - ELF (l ) ) * REFHI (RT (1 )- EL F ( 1 ) )AVER=EXP(A*TCN} /H+El/H)AV EC= CONC*AV RA*AVR A/ ( AV ER *AV ER )PRINT 1
1 FORMAT(T3,'SEDI~ENTATION COEFFICIENT',/)PRINT 7,A,D
7 F0 1,1·\ 1\ T <T 3, ' SO [\= , , r 8 , E1S .7 , TZ4, ' 11 SO [3"= I, T31 , E 1 5. 7, /)PRI NT 12 , S? OYJ , G
12 FOR:'~AT(T3, 'S20~J=',T9,EI5.7,TZ5,'I/S20w=' ,T33,E15.7,/)viR I TE (6 ,9) (DY (K ) , K= 1 , N )
9 FOR ;" A T ( T 3 , ' DEL TA Y=' ,T 1 2 , E1 5. 7 , I )PRINT 10,SY
10 FORi1ATlT3,'SD OF Y=',T12,EI5.7,1lPR I NT 11, SA
1 1 FOR iJ, AT (T 3, ' SD nF S20 W=, , T 15, F 15 • 7 , I )PRI NT 21 ,AVRA, P.B
21 FORiJ,I\T{T3,'RA=',T7,EI5.7,T23,'R1=' ,T27,E15.7,/)PRJ NT 16, AV F.C
16 FORi'\AT(T3,'AVE CONC=' ,TI3,E15.7,1/)6 CON T INUE
STOPEND
coCXJ

89
2. ! Average Molecular Weight From Sedimentation
Equilibrium - After sedimentation equilibrium has been
reached and the Schlieren optical system has been
photographed, read a frame having good contrast by a
microcomparator. That is, place the photographic frame
on the table of the microcomparator so that the reference
lines are parallel to the y direction. Read the x posi
tion of the left and the right reference line·s. Then
read the solvent line and the solution line at 0.04 cm
intervals in the x direction from meniscus to cell bottom.
Each set of numbers will correspond to x, yo, and y in
the program. There should be abbut 20 sets of these
numbers for a column of 4 mm. Two adjacent sets will be
equivalent to one trapezoid. The total number of trape
zoids will be the number of sets plus one if the meniscus
and cell bottom are included.
The first data card s~uld have only one number
which corresponds to the number of groups of data. For
example, if five frames were read each giving about 20
sets of x, yo, and y, then the first data card should
have the number 05. The seco-nd data card should have
the eight numbers indicated in statement #6 of the pro
gram with the format of statement #7, where N is the num
ber of trapezoids plus one, CO is the initial concen
tration, ELF is the left reference line, RT is the right
reference line, REFH is the distance between reference

90
holes in the counterbalance (approximately 1.6 cm), VBAR
is apparent partial specific volume, RPM is the revolu-
tions per minute of the rotor, and T is the absolute
temperature. Following the second data card there should
be N cards each containing the four numbers indicated in
statement #8 of the program with the format of statement
#9 (D is the solvent density of each trapezoid which is
usually constant). The second group of data will follow
the N'th card where its first card has the eight numbers
described on statement #6 of the program followed by N
cards as described on statement #8 of the program and so
forth until all groups of data are inserted.
Readout wiil be concentration, ~ ave. M.W., and reci-
procal square root of lave. M.W. for each trapezoid.
The following equations are used in the calculations,
where r is radius, n is index of refraction, M is mole-
cular weight, p is density of solvent, w is the angular
velocity, R is the gas constant, T is absolute tempera-
ture, Co is initial concentration, c is concentration of
each trapezoid, A is area of trapezoid, r a and rb are
meniscus and cell bottom respectively.
~ln (l/r . dn/dr)
~r2
Ac =
=
2Co (rb
rvl (1 - v p)
2 RT
2w
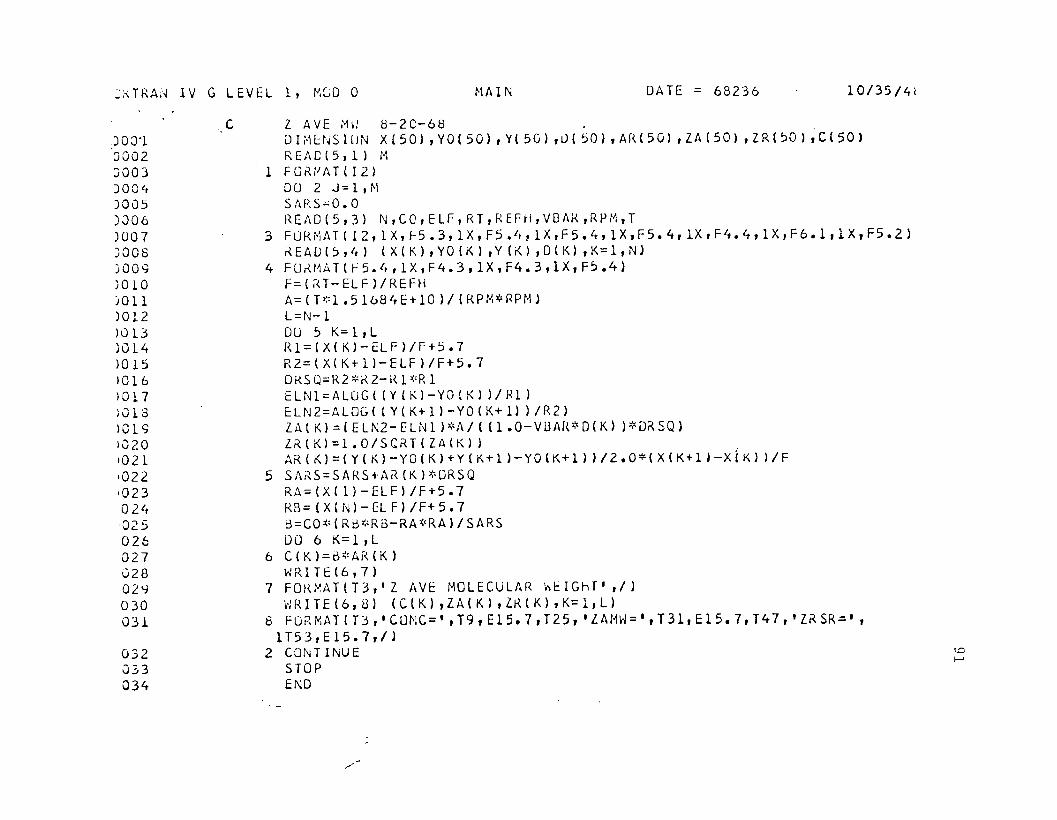
,:;;~ TRA;-~ 1V G LEVEL 1, v,eo 0 ~lA 1N DATE = 68236 10/35/41
JOO"lJ002:J003J004)005)006)007J008)009)010j011)012)() 13)014)0151016l017lO 18l0191020'021,022,023024,025026027028029030031
032033034
c Z AVE 1"1\! S-2C-6f3 .DHI Et~ S IlJ N X( 50) , V0 ( 50) , YI 50) , l)( 50 ) , AR(50 I , l A( 50 I , ZR( ~0 ) , C( 50 )REA C ( 5 , 1 l 1-1
1 FOKIJAT(I2l00 2 J=l,l-lSARS=O.OHE AD ( 5 , 3) N, CO, ELF, RT , REF Ii , VBAK , RPM, T
3 FUKMATI12,lX,f5.3,lX,F5.4,lX,F5.4,lX,F5.4,lX,F4.4,lX,F6.1,lX,F5.2)KEAO(S,4) (X(K),VO(Kl,V (Kl ,D(Kl ,K=l,N)
4 FU~MAT(~5.4,lX,F4.3,lX,F4.3,lx,F~.4)
F=(;n-ELF)/REFHA=(T*1.51684E+IOl/(RPM*RPM)L=N-lOU :> K=I,LRl=(X(K)-ELFl/F+5.7R2=(X(K+Il-ELF)/F+5.7OKS Q=R2 *K 2-!{ 1~'R 1ELN1=ALOG( (Y(Kl-YO(K) l/81)ELN2=ALOG ( (Y (K+ 1 l -YO (K+ 1) ) /R2)ZA ( Kl =(EU,2- ELN1 ) *A / ( ( 1 • 0- VUArl. *0 ( K) )*0~ SQ)l~(Kl=I.0/SCKT(lA(K) lAK(K)=(Y(Kl-YO(K)+Y(K+l)-YO(K+1ll/Z.0*(X(K+1l-X(K) I/F
5 SA~S=SARS+AK(Kl*ORSQ
RA=(X(ll-ElF)/F+5.7RB=(X(Nl-ElF)/F+5.7B=CO*(R~*RB-RA*RA)/SARS
00 6 K=l,l6 C(Kl=tP:'AR(Kl
WRITE(6,7l7 F0 H. t~ AT ( T :3 , I Z AV f:. r~ 0 LEe ULA R ..... t I GHr' ,/ )
I': RI TE ( 6 , U) ( C ( K ) , ZA ( K ) , Ii{ ( K ) , K= 1 , l )8 FORMAT(Tj,'CONC=',T9,ElS.7,T2S,'lAMW=',T31,E1S.7,T47,1ZRSR=',
1T53,E15.7,/)2 CONTINUE
STOPEND
/~
<.Cf--I

92
3. Standard Deviation - The average and standard deviation
can be determined for up to SO numbers by the following
equation.
a =2
x.1
Enter n, then the numbers.
Reado~t will be the average and standard deviation,
then each number \-lith its deviation from the average.

?p . -c;sr~~1~~q Q~VI~TION PROG~~M 8-26-68QU~::,\lS IQ'\lXCS'1 ~
l )FO~ ~<c\T (/ .."STt1N)A~1) l)SV tn.T IO~ PRQG~t\r,,"1/)
2 ;70~ :.;.\1: C" E:NTE~ N.. T H2N T H2 N'HV3 E~ S" ,,/)3;,;.'0,\ t'~H (/)4;r:·O~.1'-~~T (I::)
S'J:·1X::'~j .0>;:;; ,:) :::] •.qTY~E ,IT,(~ E~ ..ACCI::PT4 .. ENN=SN ...0031{:=I .. NTY?S~ .,~c;CE::=':r4 .. X (1.<)St r:·jX=:=x 00 -:.. SIH-'X . _ .>::S'l =X ( 1< ) ,'::< ( K ) + Xo) 'l5JCONt pnc:1i\J2.~:='3U:'lX~Si:J " _ ., _ . ,~i) :=SgTF' ( n~,:;') -5 U ~·'X*S IJ r·1X/E N) / (EN -1 .'i] ) )
T'!?E6 .. AV::':X .. SI) .6;.F 01 :.:;T (/ .. " AV E. ,N!H1=" .. E: .... Sf) =" I E I)
7 J F' O~.t·.:AT (/ .. It NIJ t·1=" .. E .. " I) =" .. E .. )D8GI<=1 .. N.Q::=~: (Ie ) :-;IJ S XT)?E7 .. Xc:.qID8;CO:-lT IN'JE:STO;~
ENI)
J
\.0~

.. "- .. :"
."(,1r"(" -~. ~ -' --r' .:- -l- .;. ... + 1-
I, I..J [-I {,I if] ;tl w
, In C:' C' c , r. F' r0.' C" C~ c-:: r:::-- c--, G
• i.:. ~" l~ t: (:-> C' l~
r.... r:- C' C·'.... C'" r?, .
'.7" l ~-, C::- C' C",.
i: (\" n C" I~ (\I (')
• . • .. • •, , cO, C'
'r .~
.~
+t,l
• (',1, (\\
It'-CcCt"'c:'RCS',.--+++.(.,,+, "'- IL' r,~ t.~ (,J hI l.l1 11"' C":' l~ G G'" G' G
• c::-- C' G' :=..... {:::' a. \' ,-.~. l:~ C C"" c' c-
'.. r, c~ c.~ 0' c-:- ~: II C";-::O C" l":"- r. c::o. C' if' If}' !f" !r.' trf l/'l
'tn • • • • • •C" 2" <:-~ (.' r. C2I ~ I + , or
~ II: II: II: II: II: IIOQCClOCl
: II: II'(.J '0-
I -:- -I
'0 (\)' ("") N ('") N ("") <~ ~~ :~
:;;:<!'(/)
, C(' crl~ Wo~, cr ..':.
'Q...' ::'lZ
Zo ".1, .... :.c
'(-' Ie:!..... z
, -- It)&J ;x:ot-
\
93
"":-.
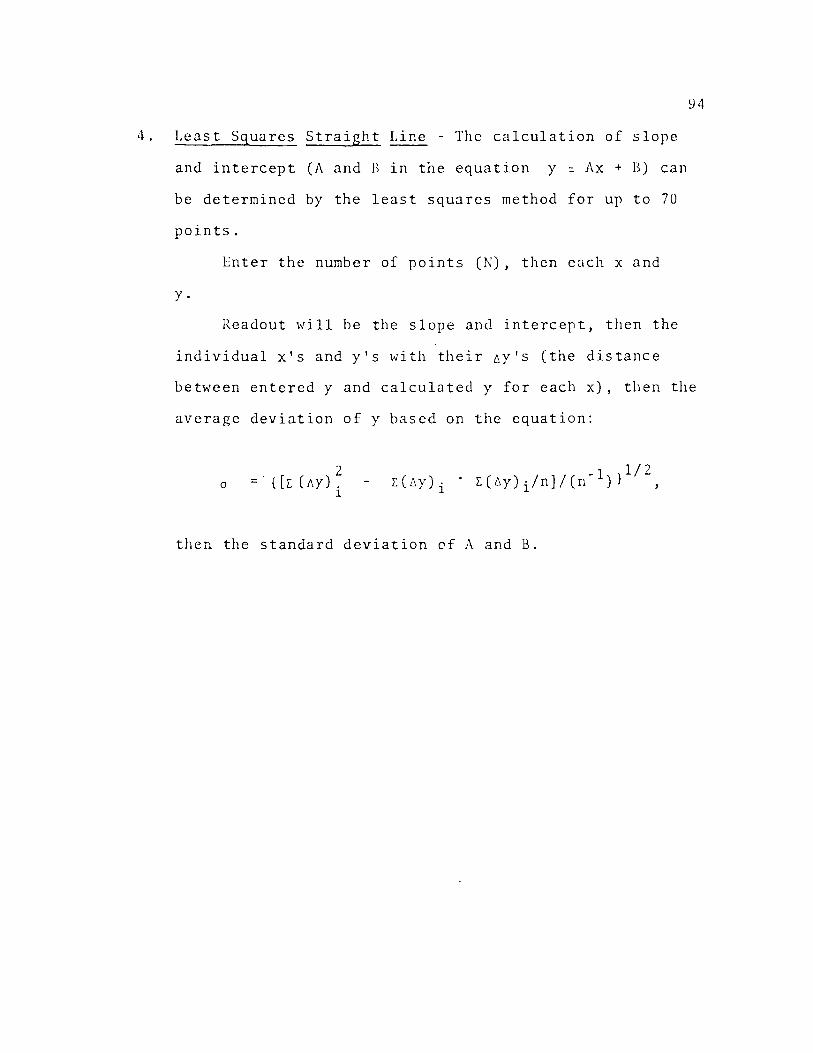
94
4. Least Squares Straight Line - The calculation of slope
and intercept (A and H in the equation y = Ax + B) can
be determined by the least squares method for up to 70
points.
Enter the number of points (N), then each x and
y.
Readout Hill be the slope and intercept, then the
individual x's and y's with their 6Y'S (the distance
between entered y and calculated y for each x), then the
average deviation of y based on the equation:
then the standard deviation of A and B.
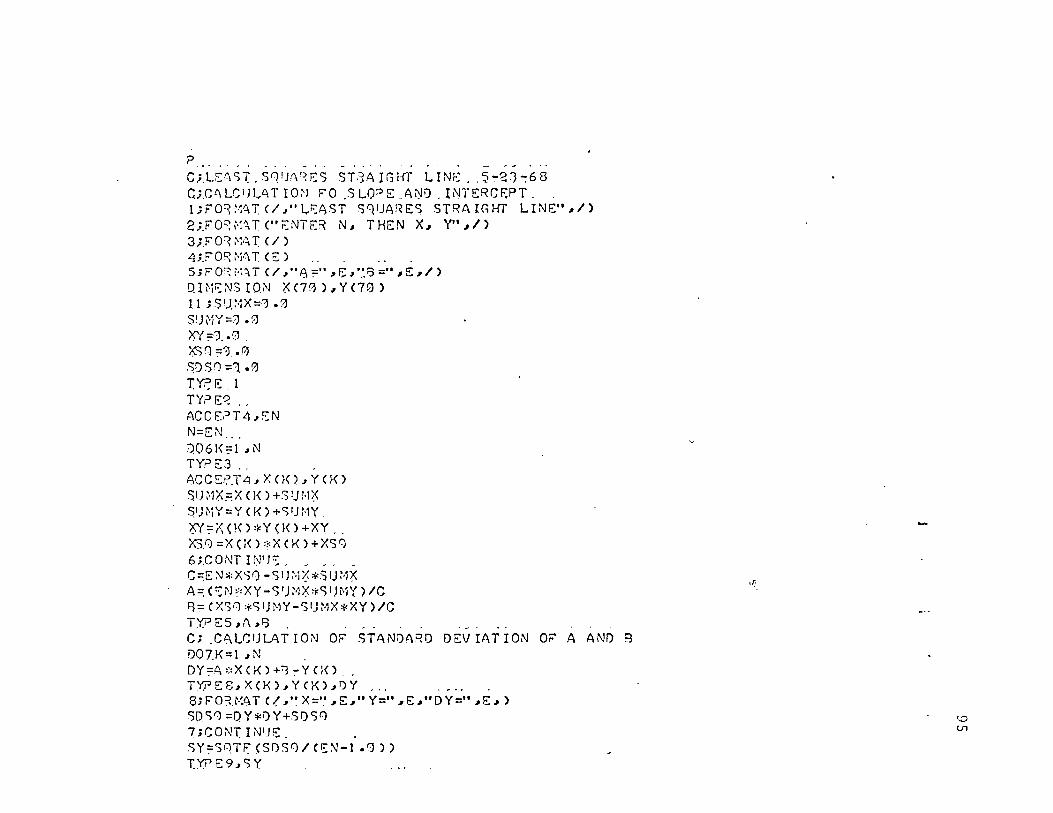
p .... . , .. -" _ .. ' ., - • ~ ...C;.U::.'-;ST.S0IJ,'\~r::c; ST:"?,AIGHT LINE .. 5,:",~1-:68Ci.CC\LCIJlAT IO:-J F'O .SLO~E .A~D. INTERCF.PT.l;F'O~~·:-;T(/.I"I.,.St',ST SqlJAf<Ec; STRAIGtIT LINE""/)2iFO::-:i'~;T ("r.:NTf.~ N.. THEN X" Y" ,1)3;.F0~ i'~i;T (/)4;.F0~t·iC\T (E)S;FOC:: to'; T C/ .I"f:j:=" "f;: .. ·.·.8 =",E,/)QHiSNSro.i'J X<7(,3)"Y<70)1.1 ; C)').t·~X=';) .!.lS!) ~iY =:) .:.JXY:='J.•0X')() ='J.r;,.~DS'1 =1,.0TYr:' E . 1TYPE~ ..AG.C [,:>T 4 .. ENN=EN ...Q06!<::1 .. NTY.:>E3 ..ACC EP.1' 4 .. X 00 .. Y CK)SU ~1X.=:X (K ) +S IJ t'l~<
S')i'iY=Y 0<) +SIJiW.0Y~X(K)*Y(K)+XY..;<3.1:) =X (1<) *X (K) +XSI:)6;.CONT IN')::: _ _ _ _ _C=.E N ~:XSI) -$ I ) :·1;:'*$ Ut·1XA=. (SN :;,xy -s r;:1~*S1)1'-iY) IC9 = (XS'l *s IJ i'1Y -S lJ :·1 X *XY ) ICTX? E5 .. A .. 8C; .CL\LCIJLAT ION OF' STANDARD DEV IAT ION OF' A AND 9D07.K=1 .. NDY :=4 ,;: X ( K ) +l ':'" Y 00 .TX? E 8 .. X (K ) .. Y CK ) .. f) Y8; F' OR}'-:l\ T (~ .. " X=" .. E .... Y=" .. E,," DY =" "E" )SDS'l =QY*i)Y+SDSI:)7;CONT IN'JS _ .SY=S(.)TF:' CSD$I:)I CEN-l .1;))
T'(?E9"SY
t~
'.DV1

8 =+0 • 1 9Ln 91 r:: + 1
TX? E 8 ~ X <K ) ~ Y (K ) ~ f) Y _'.8; F'O~}'-:l\T c~ ~u X=" ~ E~" Y=" ~E~"DY=" ~ E ~ )<;iDS!) =QY*QY+SI)S07;i:;ONT IN'JS.SY=S(.)TF' <Sf)S0/ C~N-I .1;))
T'(?E9~SY
9;F·0:H~L\T(I "uS IGi'-16. ,OF' Y=" ~E:,,)
1)=(;,* CE"J-~.1) ,.C)t'\ =S':1TF' (S~l *')I)S'1 (i) )
S'3 =S'1Tr <XS'l *SDSf:) /D )Ty?,E:I'';J~SA~Sg _.I'l;,FQ~~'~~T(/~"SIGr--1A OF A="~E,,"SIGMl\ OF' 8=""E,,//)GOTOI 1EN!)IF.I\Sr S(')UI\~ES $TRA IGHT LINEENTER N~ THEN X~ YI?l "7.13.I.1~
2.6.1 •. 89,5.51 .1.732.61,85,4.~2 .1 .7~
2..6,1 •. 8'27. • 1.1 1.• '1 8~. 1 7. 1.• 71. IJ 5 .1 .876.,9 1. r:.,r)A =-'!j • 3 7 G,:) 53 E - 1
~
'.DV1
S IGM6. O~ 8=+0 .411 859E-I
X=. +:) .7 131 t;)!] ~ + 1. Y =: +1 • 1. 7/111 I) ;;: + 1.X=.+':j .~~,"l,l·Fir::+1. Y~.+'J. 1.89";)10S+I.15=: +:) .55 1Ii) :) 1 1:: + 1. Y =: +'7) • 1.71'1 'YJ E + 1.X=+') .~r;-:;1(0)E+l. Y=.+8.1.8S'YV1S+I.X=.+'J ./j~~7J012+1. Y=:+'1.I,7~';J'iJ8S+l
X=.+1 .~ 6"'.11 ':) r.: + I. Y=:+'l • I. ~~ 11 ~ + 1.X= +') .7,1, J'1j 'J E + 1. Y=.+8 .1.'581 WJ E + I.X=.+'J .S17'lCJ1r.:+I. Y=:+'IJ .1.7f.JTl'1S+I.X=+) .3fjS'J0~):::+I. Y=:+'). U369992+1.x= +1 .6 9') W) 8.2 + 1 . __ . Y=+1 .. 1 6 6i) '1 ".) E +1SI(;~·~,'\ OF\ Y~.+~ .4~?4?';S-1
SIG~·-:·; OF A=+1J.81343IE-2
f)Y=:-'l • 1)/j'?1 r)I)t::-I.I)Y=:-0 .(n.86'1~E-t
DY~.+'!j .67'1117S-2f) Y =, -0 • 3 8h 'i8 Lj E - 8f)Y=:+'!) .6581.~t;S-I.
f) Y=, +0 • '-?, 6 1.1 [11/ ::: - tI)Y=:-'J dSI7.l~r:-8
f) y =: +1 • 'I 9. /j 8 9 ~ F: - 1.f)Y=,-~ .'558881 S-I.I)Y=+1.~44326E-I
,..
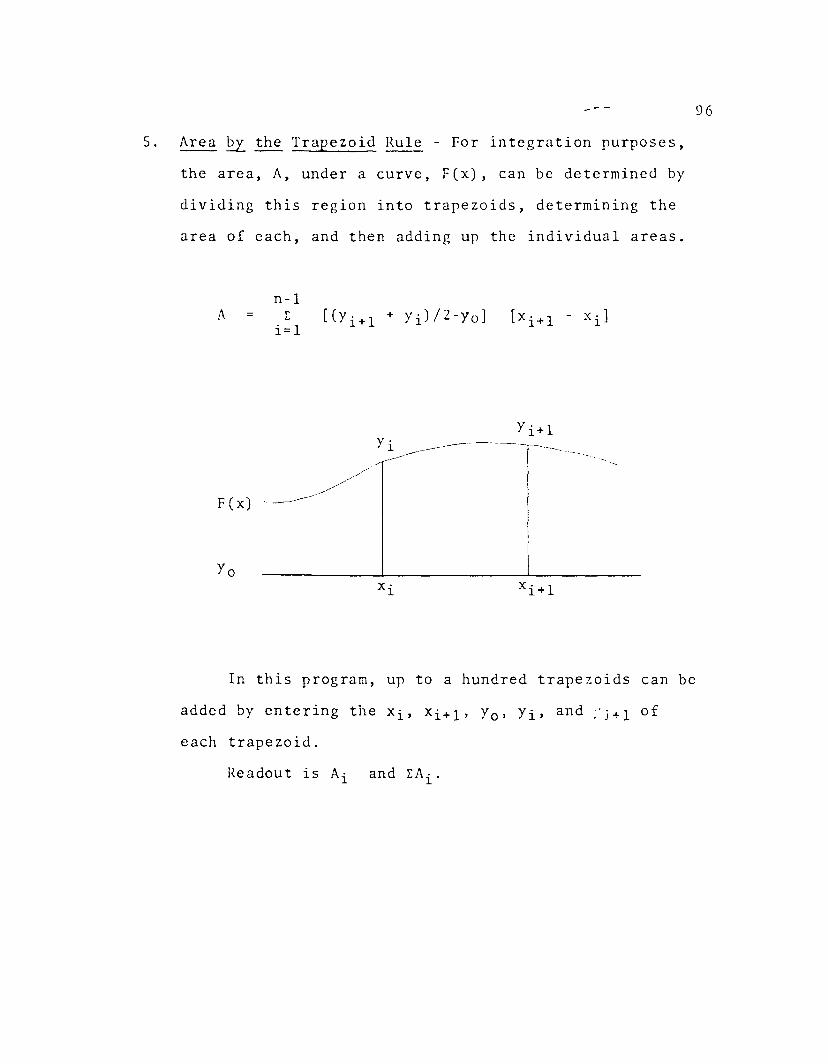
5. Area ~ the Trapezoid Rule - For integration purposes,
the area, A, under a curve, F(x), can be determined by
dividing this region into trapezoids, determining the
area of each, and then adding up the individual areas.
96
n-lA = l:: [(Yi+l + Yi)/2-yo]
i= 1
Y1" ----~-------------_._. ----------
F (x)
Yox"1
In this program, up to a hundred trapezoids can be
added by entering the xi, xi+l' Yo' Yi, and ;'j+l of
each trapezoid.
Readout is Ai and l::A i .
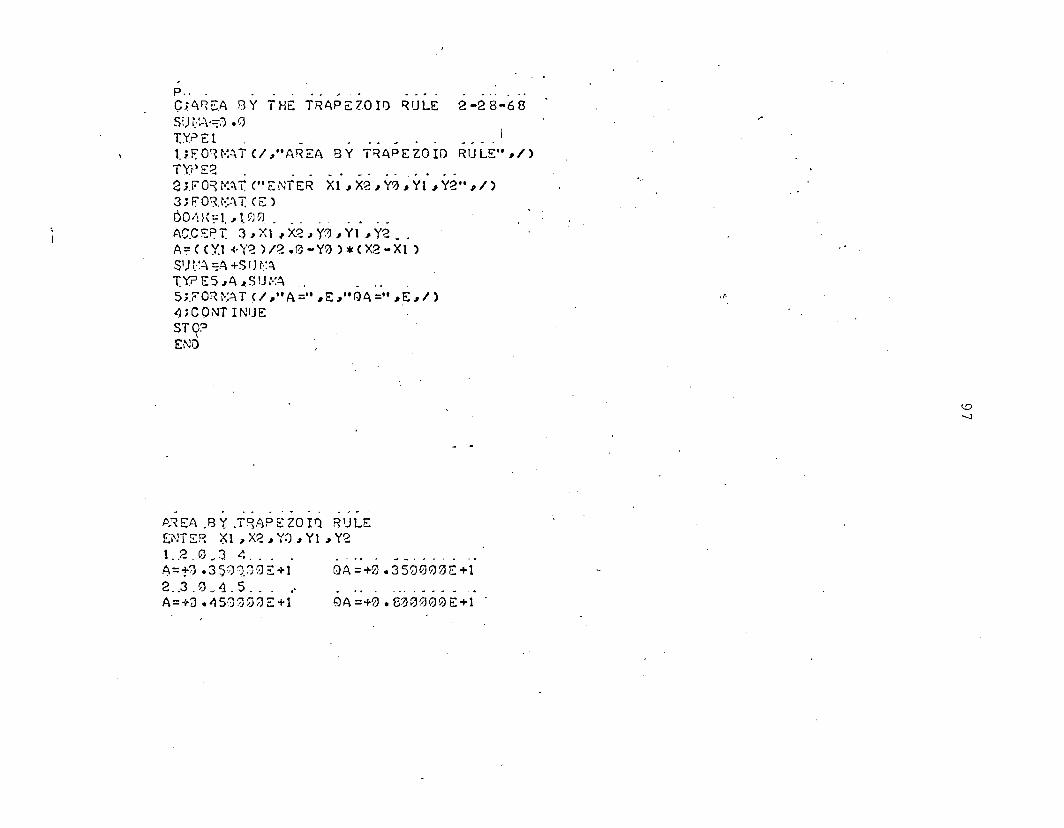
QA=+0 .35000'1)E+1
QA =+0 • 8~ 0000 E +1
p ..C;4P,S.A BY THE TRf\PEZOIl) ~ULE 2-28-68SU t·~c\':::1 • .;:,T.Y? E t1. H:O'H-:.;T (/ ,,"AREA BY T~APEZOlf) RULE" ~/)TYPE2 . __ , ., .' , ...8;.FO~~;T ("ENTER Xl ~X~~Y0"YI ,Y~"~/>3JF08J,.AT, (E)60/:i(;;I."t~JYJ. _, ....AC.CEPT. 3"Xl ,X~"Y0"Yl ~Y2 _.A=((Y.l 0(''(8 )/2.Q-Y0 >*(X2-Xl >SIJ t·~.; ~A +5 IJ~:~;
lY?ESA~5U:-:~
5;.rOR~·;~T (/ ~"A=" ~E~"Qf\="~E~/>~);CONT INIJESTO?,END
~.~EA ,BY .Tq.<;PSZOI!1 RULEENT SR ~1 "X2 " Y:J " Y1 " Y~1..2. 0 ~:3 4 ...A=t1 .3 )'.J 'J.?; 8 2 +12 ..3 . 0 ~ 4 . 5 _ _. "A=+;) .45!YJ08E+I
,f.
\D-..J

98
6. Calculator Program - If constant, first number, and
second number are C, 1, and 2 respectively, then the
following operation symbols will give the following
readout.
Operation Symbol
1
2
3
4
5
6
7
8
9
10
Readout
sum and cumulative sum
product and quotient
C x prod. and C x quot.
C x 1 and C x 2
l/C and 2/C
Log 1 and Log 2
Sq. root 1 and Sq. root 2
sine 1 and sine 2
cosine 1 and cosine 2
exponential 1 and exponential 2

,To
P . -C~';AL.CIJLATO"1 PROGRAM 4-6-688.SU'·I=;l.(.)IYP.S 1~ .• _". _1.8 ;FO~~·j;T (/ ,,"CALCUL4TOQ PROGRAM" ,I)T.Y?E 131.3;.F01'·~'i-r:("ENTER CONSTANT" THEN T~JO NUM3ERS AND O?ERATION SYtf30~',/)
14 ; F OR '·nT (E )ACCEP.r 14"CliP.E 151.5 ;FO~ ~~~ T U)16;ACC5Y.Tl 'l"A .. 8ACC.SF>T1 1 ~ "jODE11 ;FO~'.I/H~I) _GQTO(l ... 2 .. 3 .. 4 .. 5 .. 6,7,8"9,10),,MODEl;SUt'l=A+~ .(51) '·1:;~S 'J ,;1+5!) 'J_T.Yi~.E 1 7. "s U,'1" QSIJ t1 .. . J _ ••
17 ;rORi·:t\T (I ,,"SU,'l=" "E,,"t:}SlJM=" ,E"/)GOT016 ..2; p R 0.0 =A *3au OT:;L'd~. .T.Y?E1 S"PROi.> .. QUOT _..18;F 0~ t-1 C\ T ( I .. "? ROD =" , E ," () IJ OT =" "E , I )GOTOI6 ..3;CP~.O=C:;:A *13C..) l) () =:C *A t9T.'r?E} ? "C~R 0 "C(.)I)O .t 9; r OR t·~4 T ( I .. " C X? ROD =" , E ," C XI) UOT =" , E , I )GOTQl6.4~C x.C\ =C *ACX"', =C '!'S _TY?E:80. ,C ~,C >8 _.•..28 ; F' O~ ~'~'i T (I ," CXt =" , E ,," CX2 =" , E " / )GO-TOt 6'"5;QUAC =A/CQU~C=9./C ,T'l.?,E21,'1 1JAC ,,'1{J3C ..21 JFO~ l'-i.'\T (I,," 1 IC =",E ,"2 IC =" IE,/)GOTO} 6 ...61ELNL\=LOGF (A)
EL0-'J =LOGF.' (8) _.TY?E88 "El,.NA"ELi'l8 ."
- - - --. --. ... - ... "'-,.... _.. ""'" ~"
'-D'-D

T.Yi.".E 1 'r ,::> U ~-; .. l:J:::i I.) l'1 .. . J _ ••
17 ;.rQRi·;AT (I ""SUi.,=,, "E,,"t:}SlJM=" "E"/)GOT01 6 ..2; p R0.0 =A *3au OT:;I\ I~. .T.,(2.E 1 S,PR 0;) "QUOT , .,18;FQ~r"C\T(/ .. "?ROD=" "E,,"()UOT=" "E"/)GOT016 ..3;CP~.0=C:;:A *13C..) l) () =:C *A t9T.'r?E I ? .. C~R 0 ,C(.)I)O .19 ;rQR ~.:C\T (I ,,"C XPROD =" "E ,,"C X(.}UOT =" IE I I)
GOTQI6.It ~ C x.1\ =C *ACX"', =C '!'S _r)?E~0. .. C~"C >8 0 ••••
28 ; F QR ~.~6, T (I " .. CXl =" "E ,," CX2 =" "E" I )GO-TOI 6-"5JQUAC=A/CQU~C=9./C .T'l.?,E21 ,,'1 1JAC ,'1{J3C ..21 JrQRl'-~.'\T(/ .."l IC="IE""2/C=""E,,/)Go.TOI 6 ...6; E LNL\ =LOGr (A )EL0-'J =LOGF.' (8) _.rY?E~8 "El,.NA,ELi'l3 ."22 ;,r;'QR :·riT (I,," LOG 1 =" "E," LOG2 =" "E" I)GOT016 ..•..7;S')~.I\?St:)TF(A)
S.')~8 =SQTF (8 ) ...TY?E23 ,,'3'1~A .. S')RB23 J,rQ~:·:·~T (I .."SO~T 1 =" .. E,"St:}RT 2=" "E"/)
GOT016 ....6; S H~; =S I iF (A )S H8 =5 I NF (8 ) .TY?E~ 6 .. S I Nc\" S ! N8 .26;FQRi/AT(/ .... SINf:: 1 =""E"ftSINS 2=""E"/)GOT016 ..9;COS; =~OSr (A)CO'3=3 =:(;OS;;' n)TY::',E24 ,CQSC\ .. COS824; r Q'1 :.:;Tel," C OS 1 =" "E ,," C OS 2 =" "E ,,1 )GOrol I) .. __10 ;~;<?t'\=:::X?r (A)
O?8=SX?F(3) ...TY?E?~ .. E;y>A ..E~C) ... . -- .,.25 ;F'QR ~~T (I ,,"EX? 1 =" "E,,"EXP2 =""f:: II)
r.rlT rl 1 I..
,To
'-D'-D
-. ~.,:'~•.',.",\\.'"1'\:o.......~:_.."s.
, .
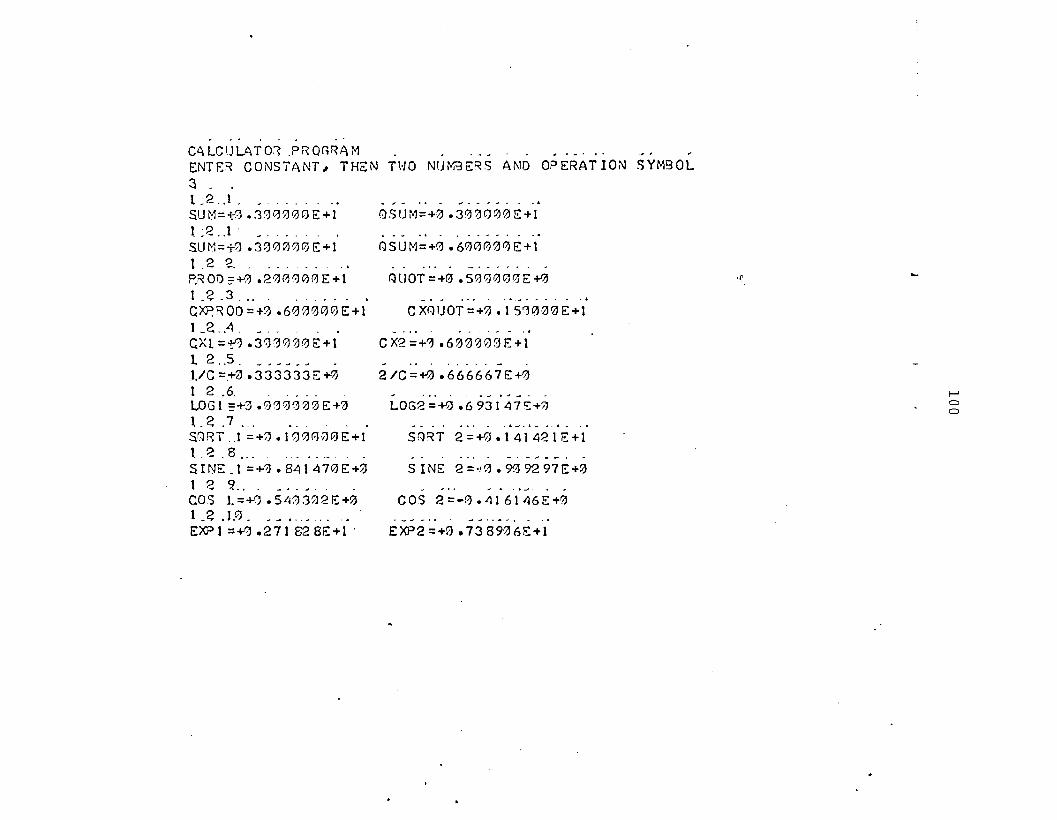
C';LCULATO~ PRQGRAMENTER CONSTANT I THEN3 _l ~2 ..1. , .......•S.'JM=t0 .380~0c)E+l
1.2 . .1' , .SUt~1=-j-~ .300~~CiJ E+l1 .2 .~. . _.. ..P.RO!):;:+0 .200000 E+l1 _2.3 .... . .... _ •CxPROD =+~ .60~00CiJ E+lL~.A. _ ..eXt =~ .300000 E+ll 2 ..5. _. _l.IC=.+~ .333333E+~
1 2 .6. . .....LOG 1 =+0 .010000 E+31.2 .7 ...SORT .1 =+0.1008·"0 E+lt,2.8... ,_ .. _ ..SINE:.1 =+0 .841470 E+IJ1 8 ':f.. . __ . , .COS 1.=+0.5Lj~3~2E+0
1 .2 . J,0. _ _ .. " ' .. '.EX? 1 =+0. 27182BE+l,
T\o10 NlJ1'8ERS Ar,..1D OPERAT ION SYMBOL
QSUM=+~.30~c)00E+l
(,)SUM=+CiJ .600000E+1
QlIOT=+CiJ .500000E+0
C XIlUOT =+~ • 15'3000 E+l
C X2 =+0 • 60 0~ 0 3 E+1
2 /c =+0 • 666667 E +0- - . .; .... -
LOG2 =+0 .6 931 47~+~
SQRT 2=+0.141421E+l
SINS 2 =·!0. 90 92 97E+0
COS 2=-0.416146E+0
E XP 2 =+0 • 73 890 6 E + 1
.f
f-'oo
IDl
7. Apparent Partial Specific Volume - The pycnometric
calculation of v is by the following equation where Po
and p are the densities of solvent and solution respec
tively, and c is concentration in mg/ml.
v == IDDDlc [l/po lip]
Enter concentration, gms of solvent, mls of
solvent, gms of solution, and mls of solution.
Readout is Po' p , and v.

p.. - - - .. -CIA?PA~ENT SPECI~IC VOLUME 4-6-68T.Y? E 1 J • • _ _ _ __
Ul:ORt-j.;T(/ .... APPARENT SPECIF'IC VOUJt.1S.... /)TY?E~
'2;.FO~~~.~T ("ENTER CONC .. GM~ .. ML0 .. GM .. ML" .. /)7;.T~E3 .4JF"ORt-j,;T(E:) . _3;F"O~i·.1~T ("OATA:")ACCE~T 4 .. CO~C .. GMO .. VOLO .. GM .. VOLRHOo.=G i·jO/I/OLORtlO=GM~\}OL .TY?E:5 .. RHOO .. RHO _" _ ..5; F.'OJ1t':AT (/ .."RHQ~ ='.' .. E .. "RHO=" .. E: .. /) _ .• __~HI=J .0/RHOO-CI000.0/CONC)*C1.0/~HOO-l.0/RHO)
n?E6 .. p}-J! _6;F:01~~T C"PHI=" .. E .. /)GOTO?ENO
J'" -'
PP?A~ENT SPEC IF' IC VOLUi'lSE:NTE~.CONC z Gi'n,(. ML'iJ _L Gr·~~ ~1I... ~ - .• ' _. ~
Ql\T A .:.7 .66 . 3 ~ 38 Lj 5 .3.0 97. 'i) 7 ..3 .31'13 J 3. ~ 0.981 7BHO'J.=+'J •. 1'17341:::~1 RHO=+0.1'i)749'-2E+lPHI=-t1.763']16S+0. - .... _~ - ~_.,- ~ .. '" ~
P.'\TA.:.7.6Q 3 !1'267 ,3.09897 ..3 .331 ~ _3!0 9867BHOJ.=+1 d 81348:::+1 RHO=+0.107513E+l
PHI=t~.744546S+'i)
DATA:
.f.
I--'oN

103
8. R square and ln (y/R) from Sedimentation Equilibrium
Enter two identification numbers (e.g. date and concen
tration of sample), then the observed left reference
line (EL), the magnification factor (Rt-EL/l.6), then
observed x, Yo' and y from Schlieren readout.
+
The typeout will be ln (y/R) and R2 .

,~
-'
,
-1.')0.;F O~ t·;:; T (I,," t-;'../- Z~VG - L~ t~:~r.· ,,/)
~NTER DATE,CONC,EL" r.ll X,YO,Y".-/)1.r) 1 ;.F'O~ :'~~T {"TO .CflLC LOG~RSg,
1.08 ;.F'O~ ;-:6.T ("OATA: ")·1.03 ;F O~ ;.:-\T. (F.:) •
104;FO\t·~-\T.(/,"LOG= ",E,"RSf.}= ",E,/)J.T. y~ s 1.8 i1
. _;,T.~E: 1.911~5;.T\'?E. I.';):?, _.' ;.ACCE:?T ,1.0'3" QATE" CO~JC, EL, F'106;~C~EPT. 103, X, YO~_Y
;. ~ = .0<- S L ) I;: oJ- 5. ·U:,io<i l,.OG.::LOGf «Y-YO )/R);.~Sl) =R :1:*8
.... JoT y;~ E 1.04, A LOG" RS·:)13 8;.T yo E: 10:2
;oGO TO 1'/:J 6SEND
.....a..,.
•.I
.'"
/
,J
I

105
9. ! Average Molecular Weight from Sedimentation Equilibrium
(Constant Solvent Density) - (NOTE: The program for
varying solvent density is the same as the program
below except that the density of each trapezoid is
entered as a variable) ...~.- '.
After sedimentation equilibrium ha~ been reached,
and the Schlieren optical system has been photographed,-;...- ---
read a frame having good contrast by a microcomparator.
At observed intervals of 0.04 cm in the radial direction
from meniscus to cell bottom, read both the solvent line
and the solution line. These three numbers will corres-
pond to x, Yo' and y in the program. There should be
about 20 sets of these numbers for a column of 4 mm. Two
adjacent sets will be equivalent to one trapezoid. The
total number of trapezoids will be the number of sets
plus one if the meniscus and cell bottom are included.
meniscus~
+- cellbottom

106
Into the program, enter the following constants:
the number of trapezoids (N), the macromolecular concen-
tration, the left reference line (LF), the meniscus (XA) ,
the cell bottom (XB), the distance between reference
holes in the counter weight which is approximately 1.6
cm (REFI!), i (VBAR), solvent density (D), the rpm (RPN) ,
and absolute temperature (T). Then enter the variables
for each trapezoid including the first and last trape
zoids formed by the meniscus and the cell bottom. These
variables must be entered in the form xi' xi+l' Yo' Yi'
Yi+l· Then the program will loop for x i +l ' x i +2 ' Yo'
Yi+l' Yi+2 and so forth until N trapezoids are entered.
Readout after each loop will be ~ ave. N.W., reci
procal sq. root of ~ ave. M.W., and the area of the
trapezoid (A). At the end of the program a constant
(D) will be printed out which when multiplied by the area
of each loop (each trapezoid) will give the macromolecu-
lar concentration of each trapezoid. Thus molecular
weight versus concentration can be plotted for extra-
polation to zero concentration.
The following equations are used in the calcula-
tions, where r is radius, n is index of refraction, M is
molecular weight, P is density of solvent, w is the angu
lar velocity, R is gas constant, T is absolute tempera-
ture, c is initial concentration, c is concentration ofo
each trapezoid, A is area of trapezoid, r a and r b are
meniscus and cell bottom respectively.
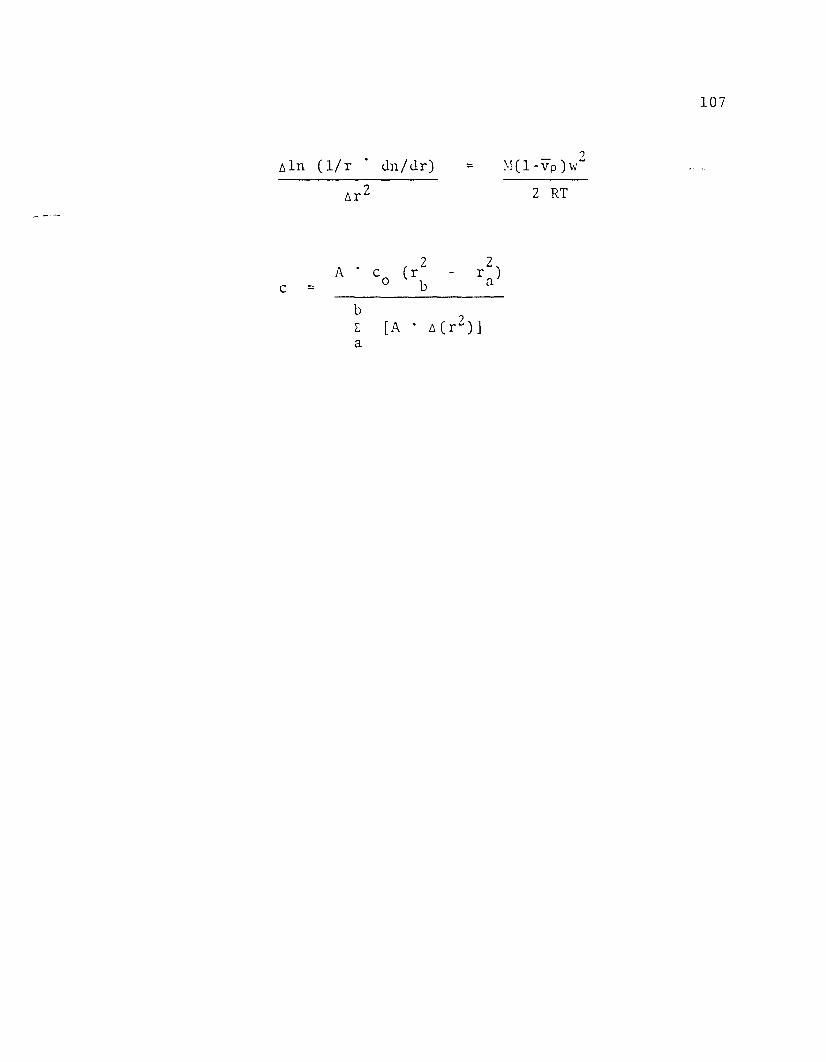
tiln (1/ r . dn / d r )
tlr 2
= - 2~l(l-vp )w
2 RT
107
A (r2
r2
)c= 0 b ac
bL: [A . lI(r2)]a

-,
108
';:
,...,..:I-..~
c.'CY..
C -I-.. ..'cY ~
<r ('Irr 0' ,...::::- .. .... C Lt':r: .. ,... ..Lt. ('Y ~
Lt' C' 0 /I,....... CY C'" (Y <r>-. .. :; * :i.J I- .. 2: ..'M '(Y ,... :r. (I Lt.'til .. , Lt (Y ..,~ ~
.. l!' *<ll : 0',... /I
'lj .. ('I' .. C 0',... <r >- l- i(- Lt. cri.J
, ><. .. (Y ~, O'
~ .. .. .. <r ,..._:.
(l) : Lt. >- ('" rr (" :l': If'
>- -:- -J .. X - t'" X <l" ~'
r-i i .. ,.,.. .. I 0-' I ro..: <r0 c..' >- <'" I? (\' e C" : If'til !.T' 'Z .. X >- ,... ,... ...... ><. .. ,
tC C (\' .. - .. (\' ..... '-' (r' ,...i.J <f c.' X Lt. '" ,....- (V ('Y (' r- * .. <f ..~ (Y .. .. -J '" : >- , ,
* - '..... '. ' (" &'
('j Lt.' 7- tz' , .. l"- f"- ,... ,... ..... ~ r <f II l"- f"- ,J(- ..i.J :; X .. ,... Cr .- r r' <f >- .. ::.(" . <ftil <r (Y t' ro :r: 1->- If"' IJ tv >- >- 7 f',. I ry :? U' If"' If"' C'. ;1~ lJ' 7- Z h <f .. + + -)( I I ....! '-' r CJ <f (}' + + I l.'0 f',.' I- lr' C + Lt' C, (\' [I. I. - -' (\' [r' I, . (" l'- e- ft II. rr :u : 7. :r: t.' Ir' 0' : >: ...... , r·· >- >- I I- (\' I'- : -l( ...... , 0' ..
'--J .. Lt' I- ..... .. -<; , .. .. ,..., ,..., I '-' (I' e- ...... .. .. <f ..... ,... -j(- ,...... : : [" 7 cc ,.., "- r, (I. (\' '-' '-' 7 t" ..... - , + [,1 I, k cr '"'-' '-' '" V' -e h '-' >< -J -J (.... It (. .J ...... ('I' ~ '" cr -J-J ('I' ,-
ro l- I- I- 1- .. -J7 I- .. (,' u' ,X c:-' Ie [,' r >- <fl- C'. ;;- 1-,-' u· C' <I'<:T' <f ~ <I' <::: tr u' .. <r ~ I I ('I' C 0 '-' . + f',.- <:T' <1' ..... I I -J( .. >:
~ ~ >: >-= >: >- l- I >-= I- ('II C" -J -J '" - .. ? cr I- <f~
t' rY,'- II (I' ('I' 0' (I' (\' ('I l- II If' ('Y Q X X II II /I \I \I >- f"- (V /I 7. ><- 7. 0<r r.r G' C G' C e'" 00 tz' * '2 CY Y u' 0 (" '-' '-' r C" (Y '-' [,l C If' 0 '" 0 I,' II.f',. CY (l lr_ n Ir.
~lr Ir t.' I- 1:' '-'
~~[,- t.' II \I rr 7. 7- L If' '-'
~h r.' L' /I II C' ~
.., C<!' >- 0' >- (.' '-' /I II (.' C" C" -J -J <r g:- \I 0, <C <f rr \I Z
0. ~ If' I- - I- ('I' e'" <:I C Qr 2 It.. C l- ll" <T (Y CY c- r.' u' t'-! <fl- f"- If' a n' (1' Cl- u' ('.

(variable solvent density)p
c; 7.'-'\ I'J:-iSC\~ S ='1 .1Ty=>r;:t1;1='O~i'1!'\T(/ .. "7. L\1't::~L\r,r.: MIA""/)TY·:l "=~~ ; "' 0'< i'~'-'\ T (It::::'-JT S~ \l" C 0 :\lr; .. U .... XL\ .. Xq .. t'?T .. q"=;;, H" 1/111\q .. qP M" T" , I )TJ'=> ~1'1 ; F" 0 '< ~t, C\ T (" T H::: 'J XI" X~ .. Y'l .. Y1 .. Y~ .. r)" 1 I )Il .; ;;' 01 M!\ T (:::: )~SC~~T4 .. ~N .. r;O'J~I~L~ .. X~ .. XI1 .. ~TI~~;;'H ..VgL\~lq~M .. Tc= (T :I: 1 • ') 1 ~ 8/j S + 11 ) I n p M*~:> M )N=~.'J
F'= nT -:"=L;;' ) I~~;;" Hno C):< =1 .. 'JT'(!"'l r.: '1').;::- O~ Mt\ T ( I .I" I") ~ T ex :" ~
.;r;r;SPT/I,Xl ,Y~,Yl,Yl .. Y~ .. f)
~1=(YI-::::L::-)/~+').7
~~ =(x::: - ~ L 1=' ) I,,": + '1 •. 7f)~')'1 =~?, *~~ -11 *~ 1~L\Jl =L(V;;;- «YI -Yl )/~ 1 )~L\l~ =L(Yi;;- «Y~ -Yl )/~~)('~ ~·11..) =( (::: L 'J~ -.:;: 1-:\11 ) *C ) I ( (I • '1 -I/~!,\ ~ *1") ) *1) ~ <:; ') )q3~ =1 .l/S')T1=' (!L\ ~1j"1 )u. = ( (Y 1 + Y~ ) I~ • ';) - Yl ) '" ( X~ - Xl) I""TY~ r.:7 .. 7'\ ,<1"'/1 7.< c;~ I!\
7 ; ~ O~ ~.IC\ T (I .I" I:f'\ M',./ =" .. S I" 7.1:\ M")~ S~ =" .. r:: 1 "0. =" .. ~ .. )C:;1:\~ c:; =c; C\~ c; +1:\ *i)~ c; ')9.;r,O:-.JTPl~l~
~~=(XC\-~L;;-)/",+,).7
~~ =(X'=l - ~ L"" ) /'r:' + S .71)='::; O\l:; '" ng *~~ -~u. *~ 0. ) I::;L\~::;
TY;':)::: 11 , I)
11 ;,... O~ ~.~r; T (I 1 "I) =" .. r.: .. )S:-.J i)
,~
f--'o\.0

110
BIBLIOGRAPHY
Adams, E. T. (1967), Fractions, No.3, 1) Beckman-Spinco.
Akeson, A. (1964), Biochem. Biophys. Res Commun., 1I, 211.
Baird, D. C. (1962), Experimentation, Prentice-Hall, Inc.,
Englewood Cliffs, New Jersey.
Blomquist, C. II., Smith, D. A., and Martinez, A. M. (1967),
Arch. Biochem. Biophys., 122, 248.
Bonnichsen, R. K., and Wassen, A. M. (1948), Arch. Biochem.
Biophys., ~, 361.
Branden, C. I. (1965), Arch. Biochem. Biophys., 112,
215.
Castil1ino, F. J., and Barker, R. (1968), Biochemistry, ~,
2207.
Cheng, L. Y., McKinley-McKee, J. S., Greenwood, C. T.,
and Hourston, D. J. (1968), Biochem. Biophys. Res.
Commun., ~, 761.
Cleland, W. W. (1964), Biochemistry, l, 480.
Creeth, J. M. (1967), Progress in Biophysics, !I, 217.
Dalziel, K. (1962), Biochem. J., ~, 244.
Dewar, M. J. S., and Pao1oni, L. (1957), Trans. Faraday
Soc., ~, 261.
Drum, D. E., IIarrison, J. H., Li, T. K., Bethune, J. 1.,
and Vallee, B. L. (1967), Proc. Natl. Acad. Sci.,
~, 1434.
III
Druyan, R., and Vallee, B. L. (1964), Biochemistry, l,
944.
Eadie, G. S. (1952), Science, 116, 688.
Ehrenberg, A. (1957), Acta Chern. Scand., !l, 1257.
Ehrenberg, A. and Dalziel, K. (1958), Acta Chern. Scand.,
1:2, 465.
Flory, J. F. (1953), Principles of Polymer Chemistry,
Cornell University Press, New York, page 310.
Hamburg, R. D. (1966), Thesis, University of California,
Berkeley.
Harris, J. I. (1964), Nature, 203, 30.
Hexner, P. E., Radford, L. E., and Beams, J. W. (1961),
Proc. Nat1. Acad. Sci., ~' 1848.
Huggins, M. L. (1942), J. Am. Chern. Soc., .§i, 2716.
Jo1y, M. (1965), A Physico-Chemical Approach to the
Denaturation of Proteins, Academic Press, London and
New York.
Kegeles, G., and Gutter, F. J. (1951), J. Am. Chern. Soc.,
72., 3770.
Kie11ey, W. W., and Harrington, W. F. (1960), Biochim.
Biophys. Acta, il, 401.
Li, T. K., and Vallee, B. L. (1964), Biochemistry, l, 869.
Lineweaver, H., and Burk, D, (1934), J. Am. Chern. Soc.,
~' 658.
Lamm, O. (1929), Arkiv. ~1at. Astron. Fysik., 21B, No.2

112
Marler, E., Nelson, C. A., and Tanford, C. (1964), Bio
chemistry, ~, 279.
McKinley-McKee, J. S. (1964), Progress in Biophysics, ~,
225.
McKay, R. H. (1962), Unpublished results.
Monod, J., Changeux, J. P., and Jacob, F. (1963), J.
Molecular BioI., ~, 306.
Oppenheimer, H. L., Green, R. W., and McKay, R. H. (1967),
Arch. Biochem. Biophys., 119, 552.
Piette, L. H., and Rabold, G. P. (1967), Magnetic Resonance
in Biological Systems, Pergamon Press, Oxford and
New York, page 351.
Reithel, F. J., and Sakura, J. D. (1963), J. Phys. Chern.,
~, 2497.
Schachman, H. K. (1957), Methods in Enzymology, (Edited
by Co1owick, S. P., and Kaplan, N. 0.), Volume IV,
Academic Press, New York, page 55.
Schwert, G. W. (1951), J. BioI. Chern., 190, 799.
Seery, V. L., Fischer, E. H., and Teller, D. C. (1967),
Biochemistry, ~, 3315.
Sigman, D. S. (1967), J. BioI. Chern., 242, 3815.
Sund, H., and Theore11, H. (1963), The Enzymes, 2nd Edi
tion (Edited by Boyer, P. D., Lardy, H., and Myrback,
K.), Academic Press, New York, London, ~, 25.
Tanford, C., Kawahara, K., and Lapanje, S. (1967), J. Am.
Chern. Soc., ~, 729.

113
Theore11, H., and Chance, B. (1951), Acta Chern. Scand.,
~, 1127.
Theore11, H., and Bonnichsen, R. K. (1951), Acta Chern.
Scand., ~, 1105.
Theore11, H. (1967), The Harvey Lectures, ~, 17.
Vallee, B. L., and Coombs, T. L. (1959), J. BioI. Chern.
234, 2616.
Vallee, B. L., Williams R. J. P., and Hoch, F. L. (1959),
J. BioI. Chern., 234, 2621.
Van Holde, K. E. (1967), Fraction, No.1, 1, Beckman-Spinco.
Witter, A. (1960), Acta Chern. Scand., ~, 1717.
Woods, E. F., Himme1farb, S., and Harrington, W. F. (1963),
J. BioI. Chern. 238, 2374.
Yonetani, T. (1963), Biochem. Z., 338, 300.
Sund, H., and Weber, H. (1966), Agnew. Chern. Internat. Edit.,
~, 231.