Embed Size (px)
Citation preview
Green River Basin
New Verification Tool 7 Forecast Points Selected Five Major Inquires
William B. ReedWilliam B. Reed
Green River BasinGreen River Basin
November 2008November 2008

Five Major Inquires
Climate Indices ESP Distributions Anomalous Years
Basic Hydrology ESP vs. SWS Joes Valley

Green River BasinGreen River Basin
WBRW4WBRW4 (Green – Warren Bridge
GBRW4 GBRW4 (Green – Fontenelle Res)
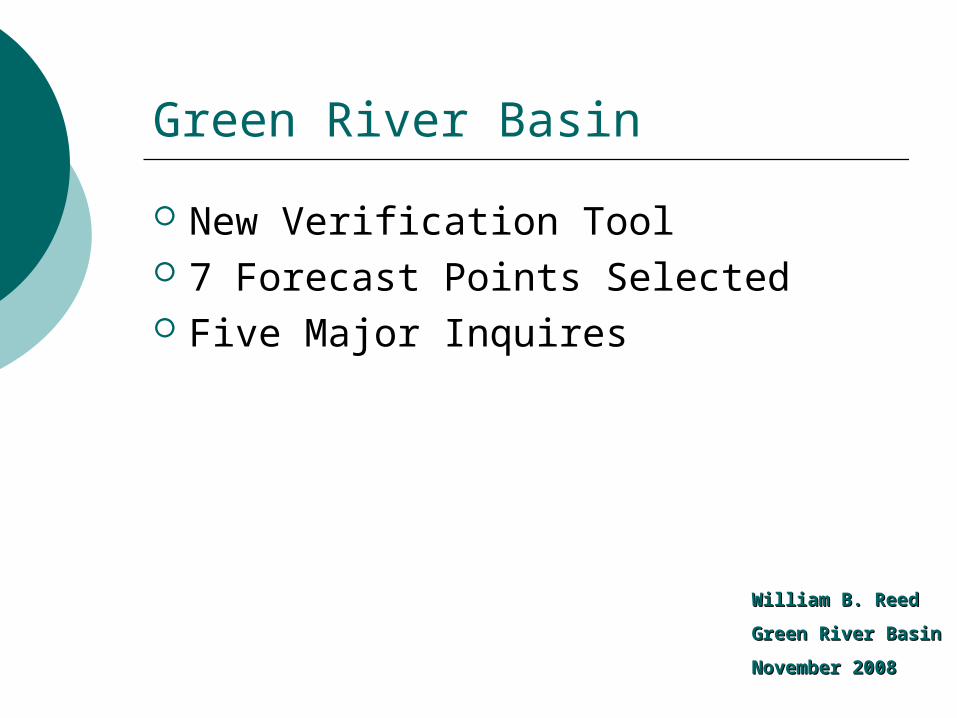
Green River BasinGreen River Basin
• GBRW4 GBRW4 (Green – Fontenelle Res)
MBLC2MBLC2 (Yampa nr Maybell)
LILC2LILC2 (Little Snake nr Lily
GRVU1 GRVU1 ( Green at Green River)
GBRW4

Green River BasinGreen River Basin
USTU1USTU1 (Upper Stillwater Res)
JOVU1JOVU1 (Joes Valley Res)
• GRVU1 GRVU1 ( Green at Green River)

Climate Indices
Is there a Signal? Answer 1: Looking at 3 El Nino indices
there were no significant correlations. Answer 2: Best correlation was with PDO
but still likely not significant.

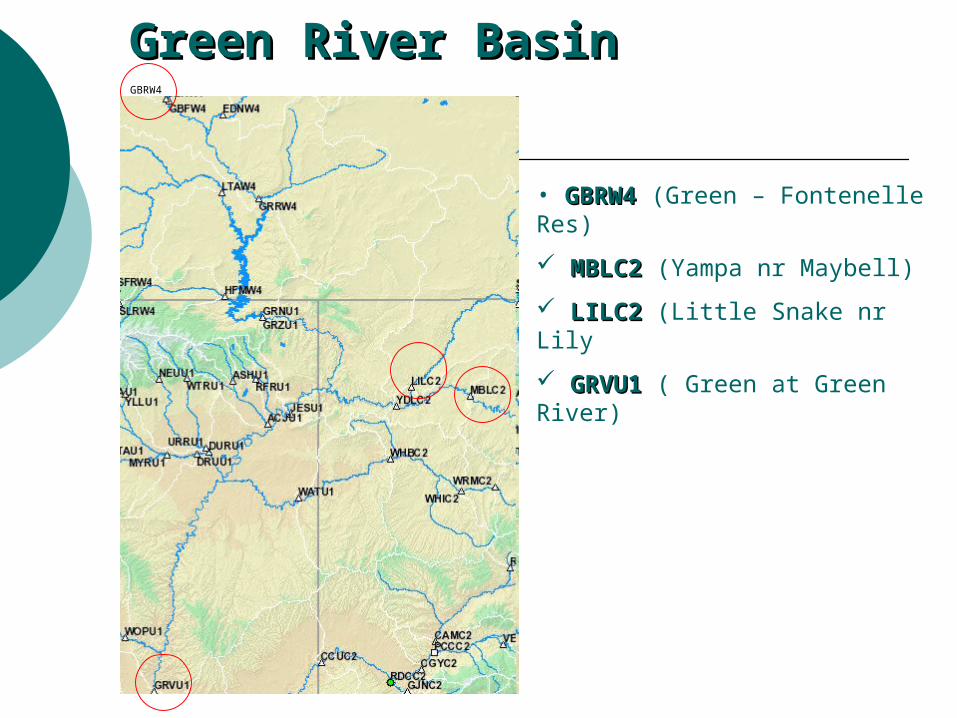
Climate Indices: Green – Fontenelle Reservoir.
Looked at SST, MEI and ONI with essentially the same results: no significant correlation.
Climate Indices: Green – Fontenelle Reservoir.
Best R*2 = 0.0679 but still likely not significant.
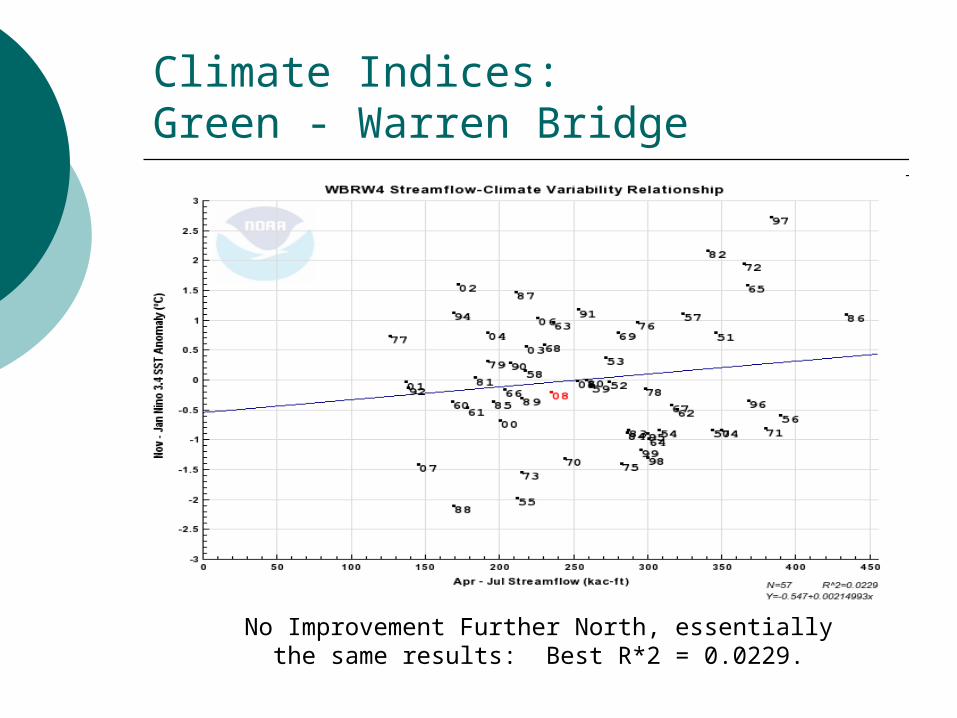
Climate Indices: Green - Warren Bridge
No Improvement Further North, essentially the same results: Best R*2 = 0.0229.

ESP Distributions
Is there a major difference between using one ESPADP distribution over the others. Answer: For the Green River at Green
River the Normal and Wakeby distributions may be best to use in January.
However, on average there is really no difference between the top six.
Never use the Loglogistic distribution.
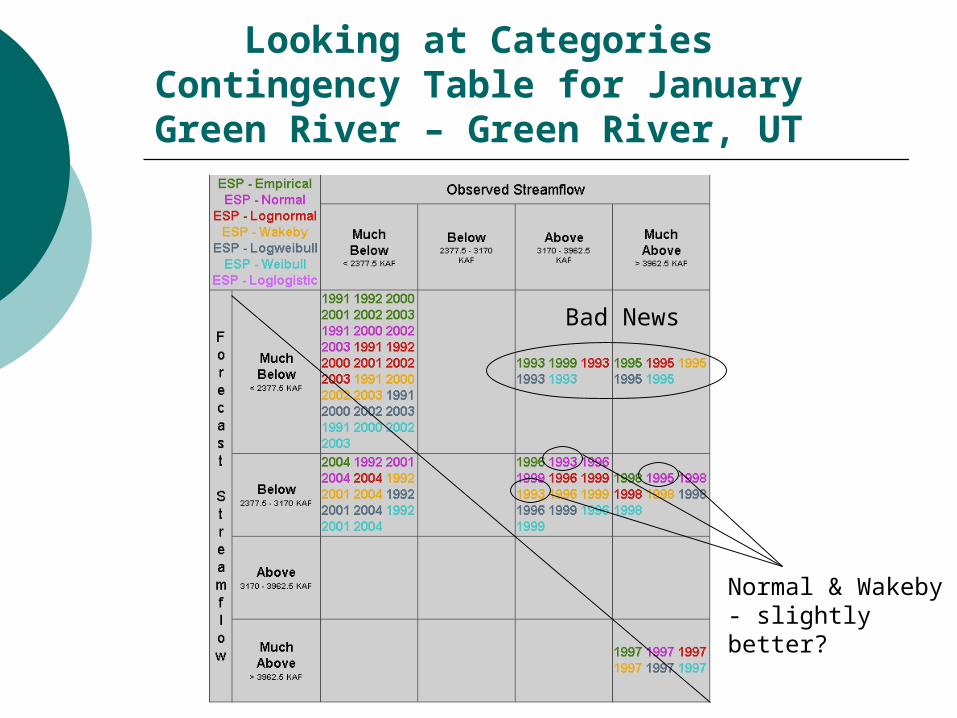
Looking at CategoriesContingency Table for JanuaryGreen River – Green River, UT
Bad News
Normal & Wakeby - slightly better?

Contingency Table for April(All Distributions OK)
Green River – Green River, UT
In April these In April these five all look five all look okay okay categorically.categorically.
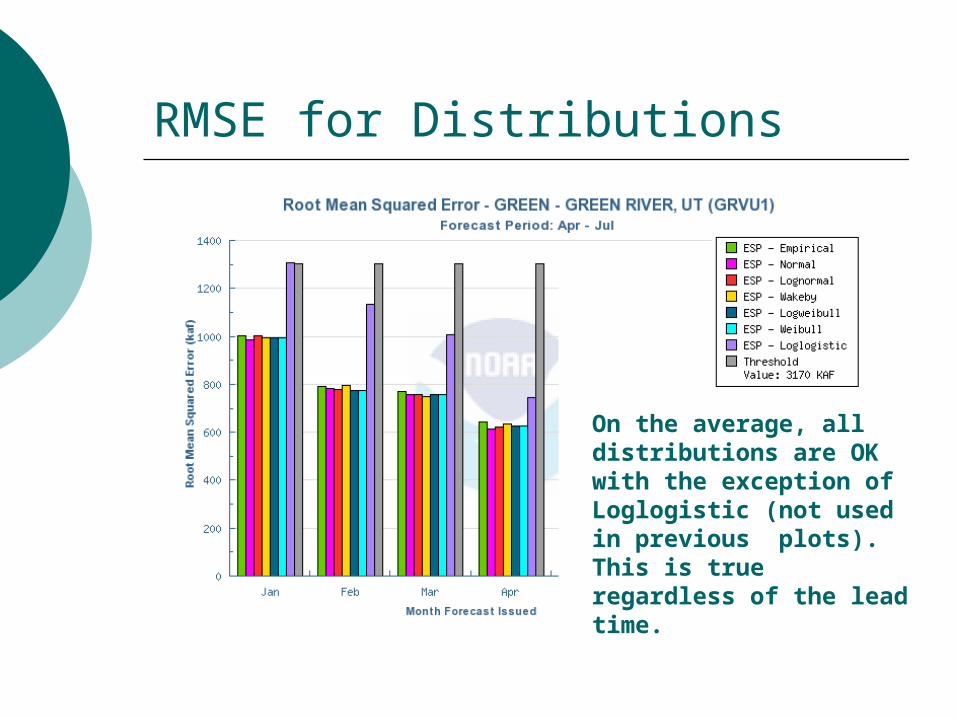
RMSE for Distributions
On the average, all distributions are OKwith the exception of Loglogistic (not used in previous plots). This is true regardless of the lead time.
Anomalous Years
Contingency Table Historical Plot Cause of Forecast Error Due To
Seasonal Change Basic Hydrology
Low to High/High to Low Above Record

Looking at CategoriesContingency Table for JanuaryGreen River – Green River, UT
1993, 1995, & 1998
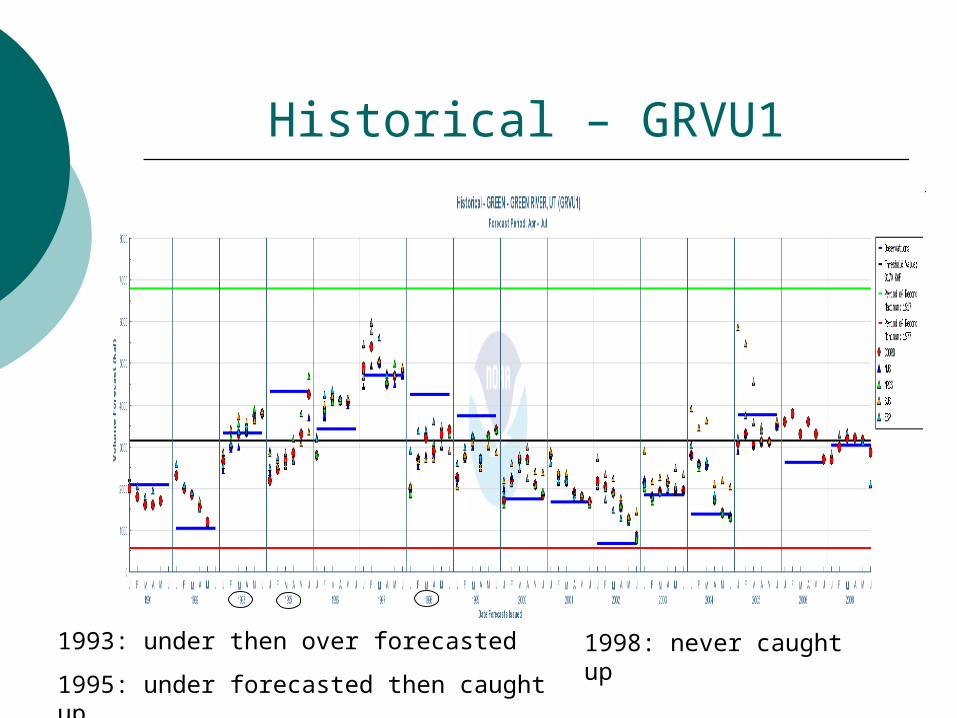
Historical – GRVU1
1993: under then over forecasted
1995: under forecasted then caught up
1998: never caught up
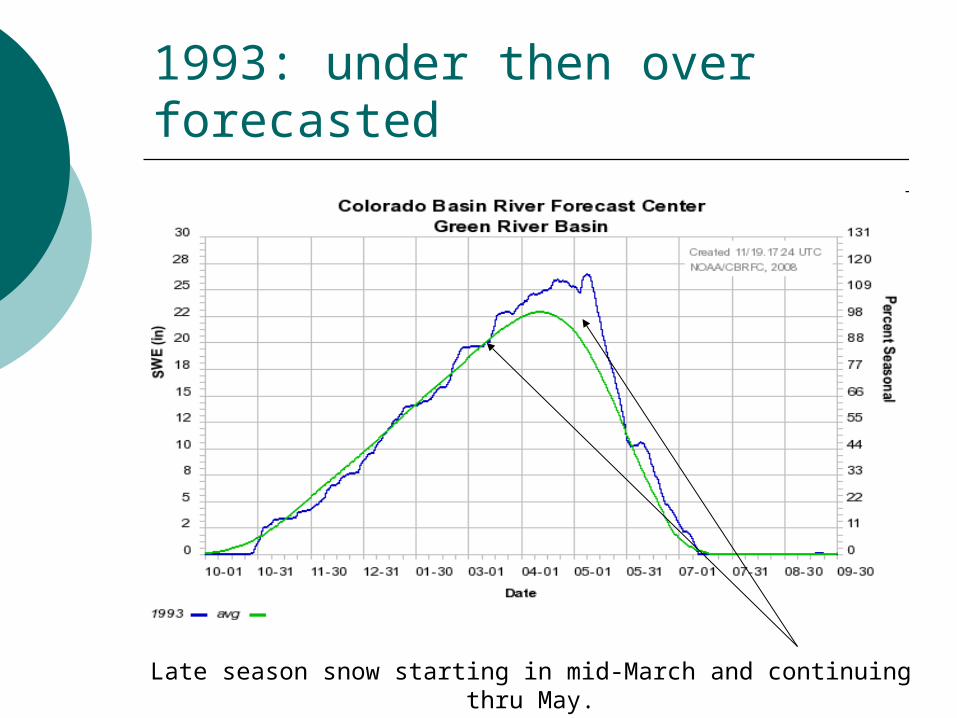
1993: under then over forecasted
Late season snow starting in mid-March and continuing thru May.

1995: under forecasted then caught up
Late season snow staring in mid-April with late seasonal peak.
1993 happened two years prior.

1998: never caught up
Dry thru late January.
Then peaks slightly above average.

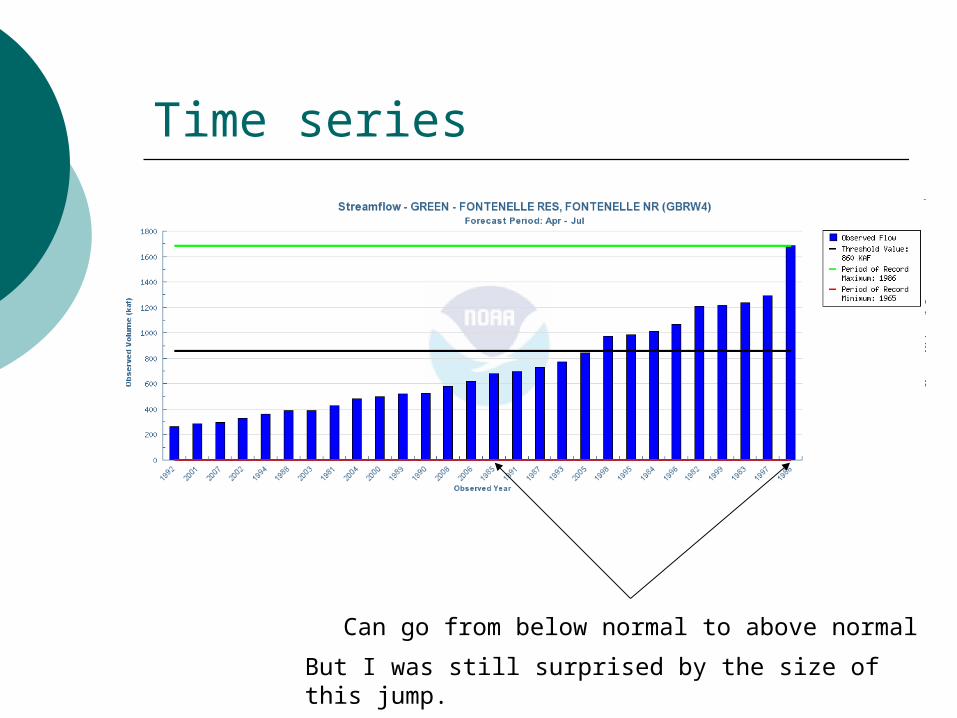
Time series
Can go from below normal to above normal
Can go from above normal to below normal
Basic Basin Hydrology
Time series
Can go from below normal to above normal
But I was still surprised by the size of this jump.

ESP vs. SWS
Is One Better? Answer: In the Green Basin for the 6
Forecast Points investigated, on average ESP was better.
Is it Always Better? Answer: Yes, on average, for the sites
investigated.

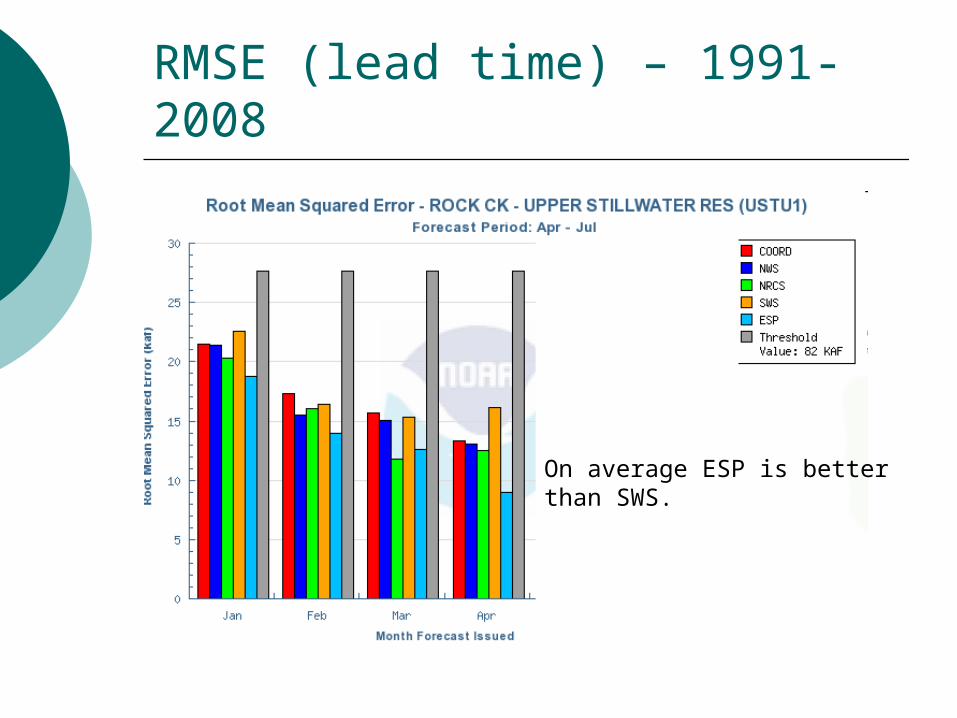
RMSE (lead time) – 1991-2008
On average ESP is better than SWS.
RMSE (lead time) – 1991-2008
On average ESP is better than SWS.

RMSE (lead time) – 1991-2008
On average ESP is better than SWS.

Joes Valley
Joes Valley is consistently under-forecasted.
Low flows are forecasted okay but high flows are a problem.

Rank histogram (1993-2008)
General Tendency To Be Under-Forecasted.

Rank histogram by LT (1993-2008)
General Tendency To Be Under-Forecasted regardless of Month.
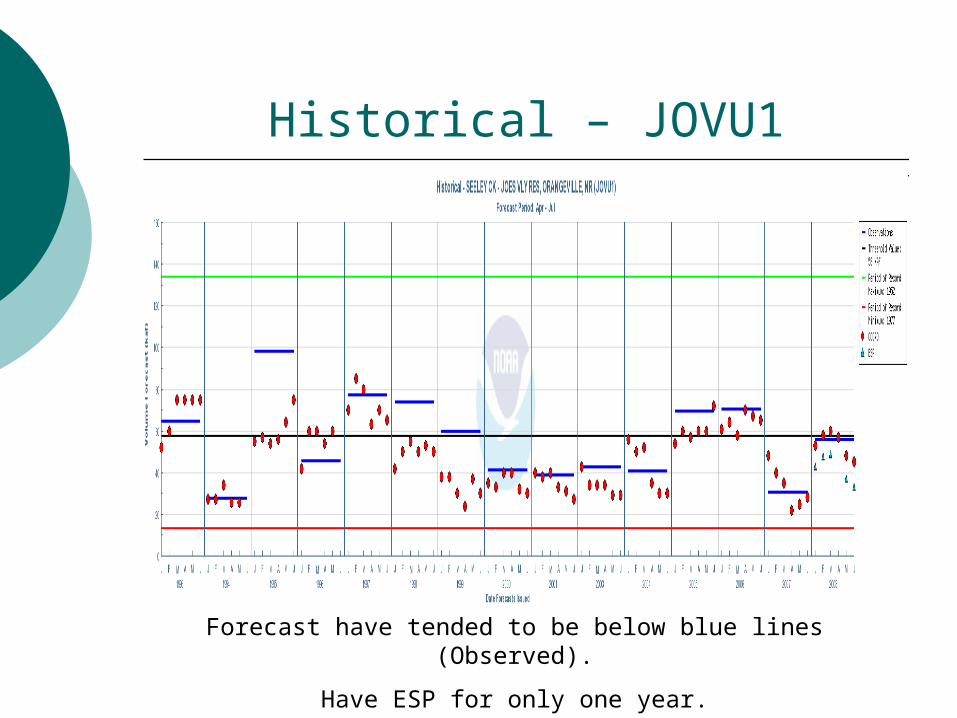
Historical – JOVU1
Forecast have tended to be below blue lines (Observed).
Have ESP for only one year.

POD below mean
Good Job of Detecting Volumes Below Mean.

POD above mean
Poor Job of Detecting Volumes Above Mean. Very Little Improvement Thru Season.

Error Doesn’t Improve

Time series (short time series 2002 missing)
Further Investigation Required.

SUMMARY
• With regard to climate indices, no significant signals were found.• With regard to ESPADP distributions, on average there is really no difference between the top six. However, never use the Loglogistic distribution.• Anomalous forecasts can often be explained by looking at what climate occurred within the basin during the anomalous year.• For the sites investigated within the Green Basin, on average ESP is better than SWS as a tool.• Joes Valley requires further investigation.