Embed Size (px)
Citation preview
Green Innovation and Green Manufacturing:
Links between Environmental Policies, Innovation and Production
Claire Brunel
Georgetown University
April 22, 2016
Abstract
This paper addresses the claim that environmental policies stimulate domestic economies. I
parse the claim into two sequential parts: the effect of policies on innovation and the effect of
that innovation on resulting manufacturing production. Each of these activities - innovation and
manufacturing - can either take place at home or abroad, and where they take place determines
the consequences for the domestic economy. The empirical evidence is based on measures of pol-
icy, patent activity, and trade in the renewable energy sector (solar, wind, geothermal, biomass
and waste) of 27 OECD countries between 1988 and 2003. The results suggest that an additional
policy promoting the development or use of renewable energies is associated with a significant
rise in the adoption of existing foreign technologies, but few new inventions at home. These
results are robust to different measures of policies. In turn, however, the increase in (mostly
foreign) patent filings is associated with a significant growth in manufacturing production prox-
ied by exports, suggesting that at least some portion of the inputs into renewable technologies
are produced domestically. Therefore, there is evidence that renewable energy policies stimulate
domestic economies through manufacturing, but less through innovation.
1
1 Introduction
As countries attempt to grow and compete in an increasingly global economy while tackling envi-
ronmental challenges, the so-called “green economy” has become an appealing way of addressing
both concerns. Policy discussions regarding the relationship between the environment and growth
until recently focused on the trade-off between environmental protection and economic growth.
However, in many countries these discussions now emphasize the potential complementarities be-
tween addressing environmental issues and stimulating economic growth. Politicians make grand
claims about a ‘win-win’ scenario where environmental policies contribute not only to improving the
environment but also to encouraging firms to innovate and produce green technologies.1 In March
2009, then-Director of the National Economic Council Lawrence Summers stated: “The evidence
is clear: we can choose to lead [green] industries, with all the commensurate economic and political
and environmental benefits, or we can choose to lose out on these jobs and these opportunities”
(White House, 2009). On multiple occasions, President Obama has addressed the need to switch
to renewable energy sources claiming that “America cannot resist this transition, we must lead it”
(White House, 2013), and that he expected “those new energy sources to be built right here in the
United States” (White House 2012). These claims represent just a few examples of a widespread
rhetoric which asserts that a country that implements environmental policies will benefit from in-
creased output and job creation at home, and will then export environmental technologies to other
countries that adopt similar policies later on.
While the environmental goal is laudable, the link between environmental policies and domestic
economic stimulus remains uncertain. In fact, this link relies crucially on green technologies be-
ing developed domestically and inputs into those technologies being manufactured at home. But
economists are skeptical that environmental policies will necessarily lead to domestic innovation
and manufacturing. On the one hand, trade theory suggests that green technologies should be
produced in countries that have a comparative advantage, be it through policies or other inherent
characteristics of their economy. On the other hand, empirical work documents a home bias in
production and trade which suggests that environmental technologies might be disproportionately
produced at home.
1This argument is related to the Porter Hypothesis (Porter 1991).
2
To evaluate the claim that environmental policies stimulate the domestic economy through inno-
vation and the production and trade of technologies, I provide empirical evidence focusing on the
renewable energy sector of OECD countries. The results suggest that environmental policies lead
to a rise in the adoption of foreign technologies but few new inventions at home. Through this
innovation channel, policies are in turn associated with a significant rise in the domestic production
of renewable technologies. Therefore, renewable energy policies appear to boost domestic economic
activity through the manufacturing of renewable energy technologies, but much less through inno-
vation.
I identify four potential outcomes of policies. These outcomes are combinations of two activities
– innovation and manufacturing – and two locations where activities can take place – domestic or
foreign (Figure 1). To be adopted on the domestic market, a technology can either be developed
by a domestic firm (‘domestic technology’), or developed abroad and patented in the domestic
market (‘foreign technology’). Foreign technologies can be new technologies created in response to
a domestic policy, or transfers of existing technologies that were previously developed perhaps in
response to a policy change in a foreign country. In either case, the domestic market is adopting
a foreign technology rather than innovating at home. To be sure, adoption of foreign technologies
is beneficial for growth (Eaton and Kortum 1999), but the domestic innovation industry is not
directly stimulated in the sense that it does not experience increased output or jobs if it does not
develop technologies.
The link between environmental policies and innovation has been studied, but the literature that
touches on the differences between domestic and foreign technologies is limited. In the first part of
this paper, using patent data as a measure of innovation and technology adoption, I present evidence
of the degree to which environmental policies stimulate the development of domestic technologies
compared to the licensing of foreign technologies. I test the robustness of my results with different
measures of policies: an overall measure, a measure by policy type, and a measure which quantifies
differences across countries for one of the more widely used policies.
When a technology is patented in a country, the technology and its inputs can either be produced
at home or imported from other countries. If the technologies are produced at home, manufacturing
output increases. If the equipment and inputs are produced abroad and imported, environmental
policies could potentially have little effect on manufacturing output. To identify renewable energy
3
technologies and their inputs requires data using a detailed classification of manufacturing produc-
tion, which is not available for all the countries in my dataset. Therefore, I proxy manufacturing
production with exports to examine whether technological innovation led to an increase in the do-
mestic production of renewable technologies or the inputs into those technologies. Examining the
effect of innovation on exports also allows me to address the part of the claim which suggests that
environmental policies and increased innovation will improve competitiveness. To fully address the
competitiveness angle, I compare the effect of innovation on exports to the effect on imports.
To date, few papers examine the effect of environmental policies on trade, and no paper attempts
to estimate whether environmental policies can stimulate the trade of environmental technologies
through innovation. Hence, the second part of this project fills an important gap in the literature
by estimating how exports and imports of technology-specific inputs respond to a change in envi-
ronmental patents. Policies could also affect the production of technologies directly without going
through innovation, and I test this direct channel as well. Finally, examining the effect of innova-
tion on production allows me to address a potential concern of patents as a measure of innovation
and technology adoption. Patents could be filed for strategic rather than commercial reasons in
order to stifle competition. If that was the case, I should observe no effect of a rise in innovation
on manufacturing production.
Combining the two steps allows me to identify the relative importance of each of four scenarios
that might occur as a result of additional environmental policies. 1) The technology was developed
at home, and the inputs were manufactured at home. This scenario would provide strong evidence
that enacting environmental policies stimulates the economy in environmental sectors. 2) The
technology was licensed from abroad, and the inputs imported from abroad. This channel would
imply that policies create little direct domestic stimulus, despite the environmental benefits and
potential positive spillovers from foreign innovation and imports. 3) The technology was developed
domestically but the inputs were imported. 4) Or the technology was developed abroad and the
imports were manufactured at home. The last two channels would provide only partial evidence
that environmental policies stimulate the economy and differ importantly in what sector and types
of occupations benefit.
The questions I pose can be answered by examining the renewable energy sector, which includes
4
solar, wind, biomass, and geothermal, for 27 OECD countries from 1988 to 2003.2 OECD coun-
tries offer an interesting sample because they provide ample variation in environmental policies,
renewable energy capacity, innovative activity, and level of economic development. Focusing on one
sector allows me to identify specific technologies, the inputs into their production, and the policies
that regulate the sector, all of which are necessary to complete the proposed analysis.
While this study focuses on the renewable energy sector, the framework is easily replicable and the
conclusions may contribute to the wider debate on the effect of policies on innovation, production
and trade. However, renewable energy policies and environmental policies generally differ from other
types of policies aimed at promoting the development of local industries. Because the deterioration
of the environment is a global and long-term concern, the trend towards environmentally sustainable
production practices will only intensify. Countries that move first and develop the technologies early
may have a competitive advantage to export these technologies once other countries follow suit.
This competitiveness gain is an important element of the green economy strategy.
Finally, it is worth noting the limits of this study. I do not provide a welfare analysis of environ-
mental policies. There could be substantial spillovers of foreign innovation and foreign production
into the domestic economy. Or innovation and manufacturing in renewables could be crowding out
activity in other sectors. Neither channel is captured in this analysis. Moreover, I am not making a
judgment on the environmental benefits of these policies. The renewable energy policies I study in
this paper could succeed or fail in achieving their environmental goals. My objective in this paper
is to evaluate the policy claims that renewable energy policies will lead to increased domestic inno-
vation and manufacturing of renewable energy technologies. These claims are abundant in policy
debates, and in fact the supposed economic benefits are sometimes presented as the primary goal
of environmental policies,3 yet empirical evidence of the veracity of the claims is limited.
The paper is organised as follows. Section 2 describes the links to existing theories and the literature.
Section 3 examines whether policies drive innoation and technology adoption. Section 4 studies
how manufacturing production and trade respond to a rise in the adoption of technologies. Both
sections 3 and 4 are divided into subsections describing the data, the estimation strategy, and the
2Some OECD countries are excluded because they did not implement any renewable energy policies over theperiod: Estonia, Luxembourg, Slovenia, Turkey.
3For example, Economic Report of the President 2015 (White House 2015) states that the first element of theAll-of-the-Above strategy for a cleaner energy future is “to support economic growth and job creation”.
5
results. Section 5 concludes.
2 Context and Existing Literature
2.1 Links to the Porter Hypothesis
The question I pose in this paper is related to the Porter Hypothesis. In its “weak” version, the
Porter Hypothesis claims that properly-designed environmental regulation may spur innovation, be
it in the form of new technologies or changes to production processes. This version does not take a
stance on whether the innovation will make firms more competitive, it simply states that some poli-
cies could lead to increased innovation. In the first portion of the paper, I contribute to the evidence
on the “weak” Porter Hypothesis by asking how innovation responds to environmental policies de-
pending on the origin of the inventor. Determining the origin of innovation allows me to specifically
address claims that innovation spurred by environmental regulation will be domestic.
In the “strong” version, the Porter Hypothesis suggests that the benefits from policy-induced
innovation will offset the cost of regulation and increase the competitiveness of companies. If firms
are unaware of profit-maximizing opportunities in pollution reductions, environmental regulation
might help them identify inefficiencies and encourage them to address these inefficiencies through
the production and dissemination of technologies. Firms might not identify or implement profitable
pollution abatement opportunities if managers have motivations and objectives other than profit-
maximization. Similarly, asymmetric information, R&D spillovers, and imperfect competition may
lead to sub-optimal investment in innovation (Ambec et. al. 2013). In the second portion of the
paper, I ask whether a rise in innovation translates into increased domestic production or imports,
which addresses the global competitiveness portion of the hypothesis at the country-level.
2.2 Incorporating the Origin of Inventions into a Vast Literature
A policy could potentially affect three types of technology adoption: innovation in the country where
the policy is implemented, innovation in other countries, and the transfer of existing technologies
6
across countries. The first channel has been studied extensively using various measures of policy and
innovation. For example, Lanjouw and Mody (1996), Jaffe and Palmer (1997), and Brunnermeier
and Cohen (2003) use pollution abatement costs as a measure of policy to study the effect of
policies on innovation. The results suggest that environmental policies do not have an effect on total
R&D expenditure (Jaffe and Palmer 1997), but do significantly increase filings of environmental
patents (Lanjouw and Mody 1996, Brunnermeier and Cohen 2003). Other papers use energy prices
as a measure of policy and find that higher energy prices induce innovation in energy-efficient
technologies (Newell et al. 1999; Popp 2002; Crabb and Johnson, 2010). Alternatively, Johnstone
et al (2010) studies the effect of different policy types on innovation and generally shows that
more stringent environmental public policies spur patenting activity in renewables. These papers,
however, look at total patent filings in a country without distinguishing between innovation that is
developed by domestic or foreign inventors. Therefore, they cannot address the policy claim that
policies will spur innovation by domestic inventors.
Patents owned by foreign inventors can represent a very large proportion of total patent filings in a
country, even in highly innovative economies. For example, in Germany foreign patents represent
on average over 65 percent of total patent filings between 1988 and 2003. Yet relatively few papers
examine the links between domestic policies and either new foreign innovation or transfers of existing
foreign technologies. Evidence on whether foreign inventors respond to domestic policies is mixed.
Comparing the patterns of policy enactment with the patterns of patenting activity, Popp (2006)
does not find that domestic regulation on air pollution control encourages patenting in foreign
countries. Peters et al. (2012) suggests that some types of regulation spur foreign innovation in the
solar industry. Dechezlepretre and Glachant (2012) concludes that domestic regulation can spur
innovation filed abroad, but the effect of domestic regulation on patents filed at home is 25 times
higher than on patents filed abroad.
Still, if some countries have already developed relevant technologies, perhaps in response to their
own regulation, other countries can license these technologies or build on this innovation. Popp
(2006) finds US pollution control innovation was more likely to build on earlier Japanese and
German patents when the United States introduced emissions standards later than Japan and
Germany. Dechezlepretre et al. (2013) finds that the strength of renewable energy policies -
proxied by installed capacity of renewable energies - has a small but positive effect on the transfers
7
of patents across countries.
Only one paper distinguishes patents based on the origin on the inventor. Lee et. al. (2011)
studies the effect of US automobile performance standards on firm-level innovation, where the
level of regulation is proxied by regulatory expenditures for the industry. In this context, the
authors interact the policy measure with a dummy for domestic firms and find mixed results. In
the beginning of their time period, domestic firms appear to be more responsive to regulation
than foreign firms, while at the end there is no significant difference between domestic and foreign
patenting responses. The broader applicability of their study may be limited, however, due to data
constraints that require the authors to restrict the analysis to the top 15 innovative auto companies
in the US patent office.
In the first part of this paper, I provide the first cross-country study of the effect of environmental
policies on patent filings comparing the effect on patents filed by domestic inventors to those filed
by foreign inventors. In sum, this portion combines existing branches of the literature on the effect
of policies on different kinds of innovation to create a framework which allows me to test the claim
that environmental policies will increase domestic innovative output.
My approach has several advantages over existing work. First, the number of environmental policies
enacted in one country in one year in one industry is low, and thus limiting the analysis to one
country may not provide enough identifying variation. I exploit variation across time and countries
to identify the effect of policies on innovation. Second, most existing work - with the exception of
Lanoie et al. (2008) - only examines the contemporaneous effects of policies. Since firms might
respond to policies with a lag, I estimate the longer-term effects of policies on innovation. Finally,
the literature to date generally does not address the endogeneity of environmental policy measures.
For example, political economy factors such as the rise of a green party to power could be the source
of simultaneous causality. In some robustness checks, I examine the consequences of treating the
policy measure as endogenous.
8
2.3 Sparse Evidence on the Links between Environmental Innovation and Trade
Empirical studies of the links between environmental policies and the competitiveness of firms
or industries can be divided into two groups. On the one hand, most papers interested with
country-level competitiveness investigate the opposite of the Porter Hypothesis: the claims that
environmental policies will impose on companies costs that are high enough to lead them to offshore
production to countries with laxer environmental standards (Clark, Marchese, and Zarrilli 2000,
Xing and Kolstad 2002, Copeland and Taylor 2004, Brunnermeier and Levinson 2004). On the other
hand, evidence of the “strong” version of the Porter Hypothesis focuses on firm-level analysis of the
effect of policies on productivity and business performance (see for example Gollop and Roberts
1983, Berman and Bui 2001, Greenstone 2002). But few of these studies identify the source of the
change in business performance (Ambec et. al. 2013). In the second part of the paper, I study
specifically whether the effect of environmental policies on manufacturing production and trade
occurs through innovation or other sources.
Lanoie et. al. (2011) stands out as the only paper to examine the channels through which en-
vironmental policies affect firm performance. Using a survey of firms in seven OECD countries
which includes perceived environmental policy strength and estimated environmental R&D expen-
ditures as a measure of innovation, Lanoie et. al. (2011) provides a comprehensive analysis of the
different versions of the Porter Hypothesis. The authors find that policies spur innovation, and
policy-induced innovation has a positive effect on business performance. Given the cross-sectional
nature of the data, the authors are not able to control for unobservable firm heterogeneity and are
restricted to binary measures of environmental innovation and business performance.
I focus on country-level competitiveness. Having identified the domestic and foreign innovation
responses to environmental policies in the first section, I then turn to evaluating the links between
environmental innovation and trade. Generally, studies of the relationship between environmental
innovation and trade focus on the potential for trade as a vehicle for technology transfer (for a
review, see Keller 2004). In a more recent example, Bloom et al. (2011) establishes that EU sectors
that were most affected by import competition from China were more innovative. Batrakova and
Dechezlepretre (2013), on the other hand, finds that “dirty” imports from China decreases firms’
propensity to innovate in Ireland. However, to the best of my knowledge no paper attempts to
9
estimate how environmental innovation stimulates the trade of environmental technologies. I fill
that gap in the literature by examining the links between innovation and the trade of renewable
energy technologies. Combining the two sections of my paper will provide evidence of the causal
chain between renewable energy policies and trade.
3 Environmental Regulation and the Origin of Technologies
To estimate the links between environmental policies and the adoption of technologies, I need a
measure of innovation and a measure of environmental policies. The next subsections describe how
those variables are created. I then explain the estimation procedure and present the results.
3.1 Policy Measure
For this analysis, I need a measure of the policies specific to renewable energies which varies across
countries and time. As shown in Brunel and Levinson (2015), there are many obstacles to measuring
policies and all currently used measures have their own drawbacks. For example, many previous
studies use pollution abatement costs, but countries or states with more polluting industries will
spend more on pollution abatement even if each has implemented the same policy. Few measures are
available across countries, vary over time, and are technology specific. As a result, and consistent
with a number of papers in the literature (e.g. Johnstone, Hascic and Popp 2010), I start with a
simple count of the number of policies enacted in country i at time t that are aimed at developing
renewable energy sources.4
The IEA/IRENA Global Renewable Energy Policies and Measures Database provides a compre-
hensive record of such measures for all OECD countries. These measures can be research and
development (R&D) incentives, investment incentives, taxes, tariffs, tradable permits, voluntary
programs, and obligations. Apart from R&D policies, most policies do not explicitly provide in-
centives for innovation. However, the policies decrease the relative price of the use of renewables
compared to fossil fuels, or increase demand for renewable energy. In doing so, the policies supply
implicit incentives for innovation.
4European Union countries get an extra count for each policy implemented at the European Commission level.
10
The simple count has the advantage of being transparent, simple, and easily interpretable but
by no means is it an ideal measure. Chief among its drawbacks is that it weighs each policy type
equally. To address that issue, I also present results breaking down the total count into six different
counts, one for each policy type to allow for, say, tax incentives and voluntary programs to have
different effects. Figure 3 presents a graphical representation of the introduction of relevant policy
measures in the OECD until 2003. Each point on the graph represents the time of introduction of
a measure in a particular country. Clearly, countries vary both in the timing and the type of policy
instruments used. Table 3 presents the summary statistics of the policy variable. On average,
countries enact 0.635 policies aimed at promoting the use of renewable energies each year. Most
of these policies are economic instruments and, to a lesser extent, policy support and regulatory
instruments.
However, even the breakdown by policy is an imperfect measure. The same policy can vary signifi-
cantly across countries. For example, in 2000 Denmark implemented a feed-in-tariff (FIT) for wind
production of 0.058 euros per kilowatt-hour. In the same year, Germany set up a feed-in-tariff
of 0.091 euros per kilowatt-hour of wind. The count measure assigns the same weight to both.
In an attempt to quantify these differences across countries, I use data on wind feed-in-tariffs for
seven countries in my dataset: Austria, Denmark, France, Germany, Slovak Republic, Spain, and
Switzerland.5
3.2 Innovation and Adoption of Technologies
In addition to the measure of policies, for this analysis I need a measure of innovation. I use patent
data to measure innovation and adoption of new technologies in each OECD country. The data
come from the PATSTAT database (EPO 2012) which includes all patent applications filed at the
national patent offices of the 27 OECD countries as well at the European Patent Office (EPO).6 A
patent grants protection for a technology only in the country where it is filed, so inventors will file
in as many countries as they desire protection. Domestic patents in country i are defined as the
5The data were compiled by Fan Zhang and Louis Preonas for a project sponsored by the World Bank. AlthoughFITs generally differ across countries in terms of which technologies are eligible or the mix of energy sources mandated,because in the EU rules are governed by the Commission FITs are more comparable across EU countries than anyother set.
6Data extracted from EPO World Patent Statistical Database (PATSTAT) based on extractions developed byIvan Hascic and colleagues at the OECD Environment Directorate and used in Popp, Hascic and Mehdi (2011).
11
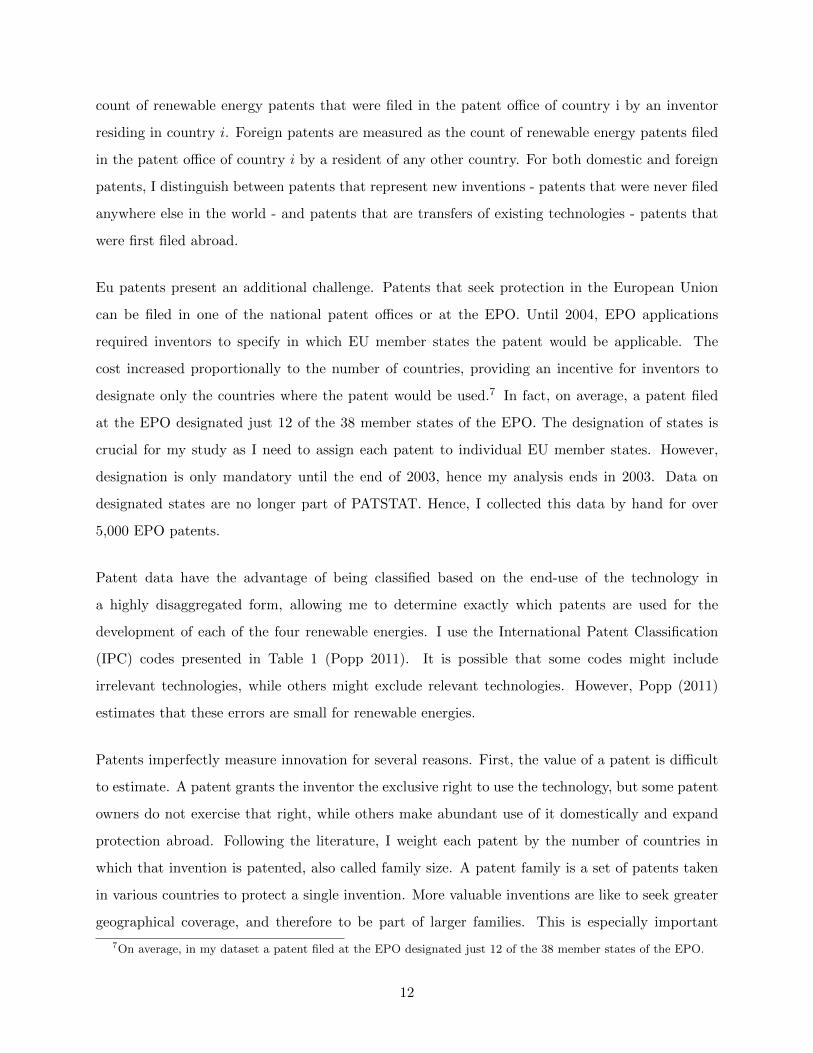
count of renewable energy patents that were filed in the patent office of country i by an inventor
residing in country i. Foreign patents are measured as the count of renewable energy patents filed
in the patent office of country i by a resident of any other country. For both domestic and foreign
patents, I distinguish between patents that represent new inventions - patents that were never filed
anywhere else in the world - and patents that are transfers of existing technologies - patents that
were first filed abroad.
Eu patents present an additional challenge. Patents that seek protection in the European Union
can be filed in one of the national patent offices or at the EPO. Until 2004, EPO applications
required inventors to specify in which EU member states the patent would be applicable. The
cost increased proportionally to the number of countries, providing an incentive for inventors to
designate only the countries where the patent would be used.7 In fact, on average, a patent filed
at the EPO designated just 12 of the 38 member states of the EPO. The designation of states is
crucial for my study as I need to assign each patent to individual EU member states. However,
designation is only mandatory until the end of 2003, hence my analysis ends in 2003. Data on
designated states are no longer part of PATSTAT. Hence, I collected this data by hand for over
5,000 EPO patents.
Patent data have the advantage of being classified based on the end-use of the technology in
a highly disaggregated form, allowing me to determine exactly which patents are used for the
development of each of the four renewable energies. I use the International Patent Classification
(IPC) codes presented in Table 1 (Popp 2011). It is possible that some codes might include
irrelevant technologies, while others might exclude relevant technologies. However, Popp (2011)
estimates that these errors are small for renewable energies.
Patents imperfectly measure innovation for several reasons. First, the value of a patent is difficult
to estimate. A patent grants the inventor the exclusive right to use the technology, but some patent
owners do not exercise that right, while others make abundant use of it domestically and expand
protection abroad. Following the literature, I weight each patent by the number of countries in
which that invention is patented, also called family size. A patent family is a set of patents taken
in various countries to protect a single invention. More valuable inventions are like to seek greater
geographical coverage, and therefore to be part of larger families. This is especially important
7On average, in my dataset a patent filed at the EPO designated just 12 of the 38 member states of the EPO.
12
in my case because domestic and foreign patents could have different values. Figure 2 however
shows that although the number of foreign patents is higher overall, the distribution of family
size follows the same shape for domestic and foreign patents.8 Second, it is possible that some
valuable innovation are not patented. Filing a patent involves publicly disclosing information on
the technology. To maintain the secrecy of their innovations, inventors could opt to refrain from
patenting their products. Dernis and Khan (2004) show, however, that few valuable innovations
are not patented. In spite of these downsides, patents have been found to be an accurate indicator
of the knowledge available in a country (Griliches 1990).
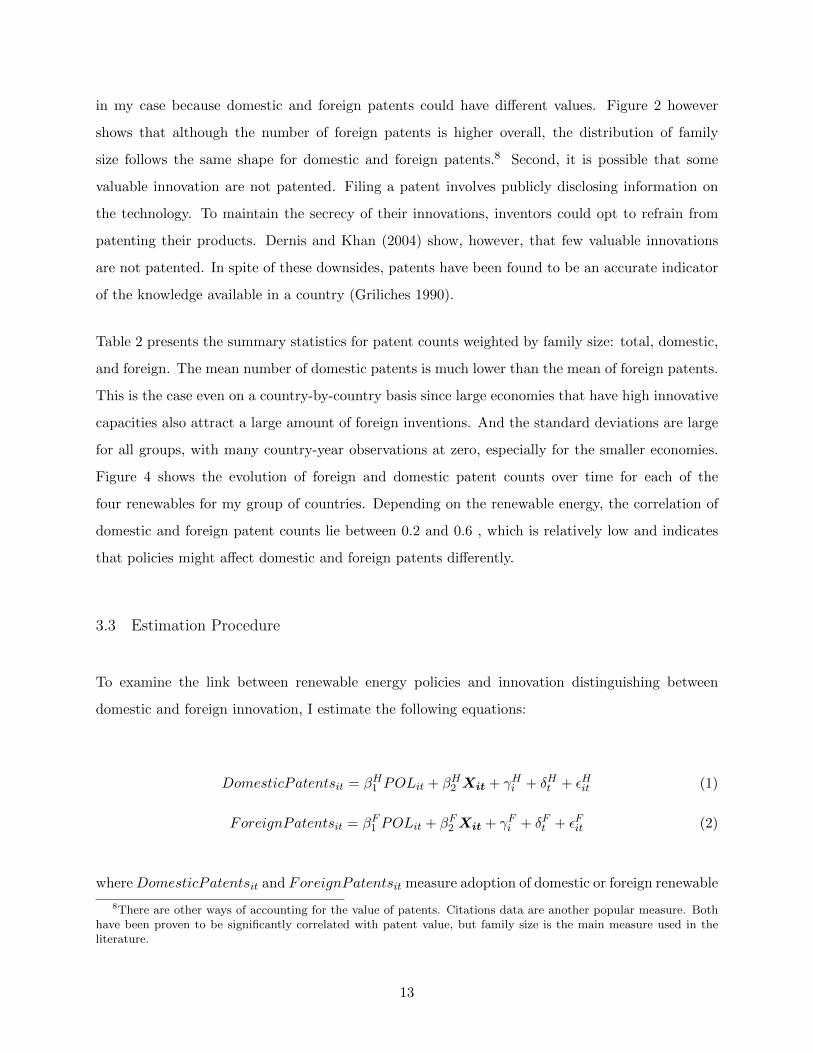
Table 2 presents the summary statistics for patent counts weighted by family size: total, domestic,
and foreign. The mean number of domestic patents is much lower than the mean of foreign patents.
This is the case even on a country-by-country basis since large economies that have high innovative
capacities also attract a large amount of foreign inventions. And the standard deviations are large
for all groups, with many country-year observations at zero, especially for the smaller economies.
Figure 4 shows the evolution of foreign and domestic patent counts over time for each of the
four renewables for my group of countries. Depending on the renewable energy, the correlation of
domestic and foreign patent counts lie between 0.2 and 0.6 , which is relatively low and indicates
that policies might affect domestic and foreign patents differently.
3.3 Estimation Procedure
To examine the link between renewable energy policies and innovation distinguishing between
domestic and foreign innovation, I estimate the following equations:
DomesticPatentsit = βH1 POLit + βH2 Xit + γHi + δHt + εHit (1)
ForeignPatentsit = βF1 POLit + βF2 Xit + γFi + δFt + εFit (2)
whereDomesticPatentsit and ForeignPatentsit measure adoption of domestic or foreign renewable
8There are other ways of accounting for the value of patents. Citations data are another popular measure. Bothhave been proven to be significantly correlated with patent value, but family size is the main measure used in theliterature.
13
energy technologies in country i at time t, POLit is one of the three policy measures for country
i in year t, Xit contains other controls detailed below, and γi and δt are country and time fixed
effects respectively. The key parameters are βH1 and βF1 , which represent the effect of policies on
domestic and foreign patent filings respectively. I am interested in comparing these two effects
to determine whether environmental policies boost domestic innovation or the licensing of foreign
technologies.
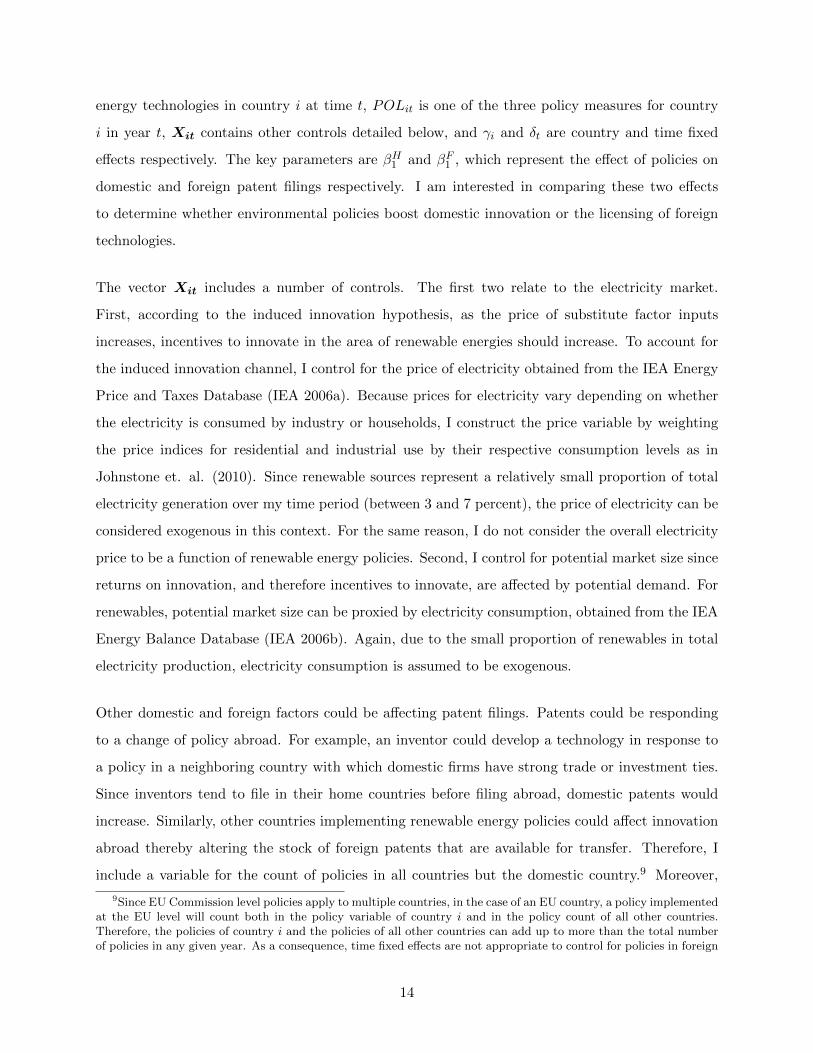
The vector Xit includes a number of controls. The first two relate to the electricity market.
First, according to the induced innovation hypothesis, as the price of substitute factor inputs
increases, incentives to innovate in the area of renewable energies should increase. To account for
the induced innovation channel, I control for the price of electricity obtained from the IEA Energy
Price and Taxes Database (IEA 2006a). Because prices for electricity vary depending on whether
the electricity is consumed by industry or households, I construct the price variable by weighting
the price indices for residential and industrial use by their respective consumption levels as in
Johnstone et. al. (2010). Since renewable sources represent a relatively small proportion of total
electricity generation over my time period (between 3 and 7 percent), the price of electricity can be
considered exogenous in this context. For the same reason, I do not consider the overall electricity
price to be a function of renewable energy policies. Second, I control for potential market size since
returns on innovation, and therefore incentives to innovate, are affected by potential demand. For
renewables, potential market size can be proxied by electricity consumption, obtained from the IEA
Energy Balance Database (IEA 2006b). Again, due to the small proportion of renewables in total
electricity production, electricity consumption is assumed to be exogenous.
Other domestic and foreign factors could be affecting patent filings. Patents could be responding
to a change of policy abroad. For example, an inventor could develop a technology in response to
a policy in a neighboring country with which domestic firms have strong trade or investment ties.
Since inventors tend to file in their home countries before filing abroad, domestic patents would
increase. Similarly, other countries implementing renewable energy policies could affect innovation
abroad thereby altering the stock of foreign patents that are available for transfer. Therefore, I
include a variable for the count of policies in all countries but the domestic country.9 Moreover,
9Since EU Commission level policies apply to multiple countries, in the case of an EU country, a policy implementedat the EU level will count both in the policy variable of country i and in the policy count of all other countries.Therefore, the policies of country i and the policies of all other countries can add up to more than the total numberof policies in any given year. As a consequence, time fixed effects are not appropriate to control for policies in foreign
14
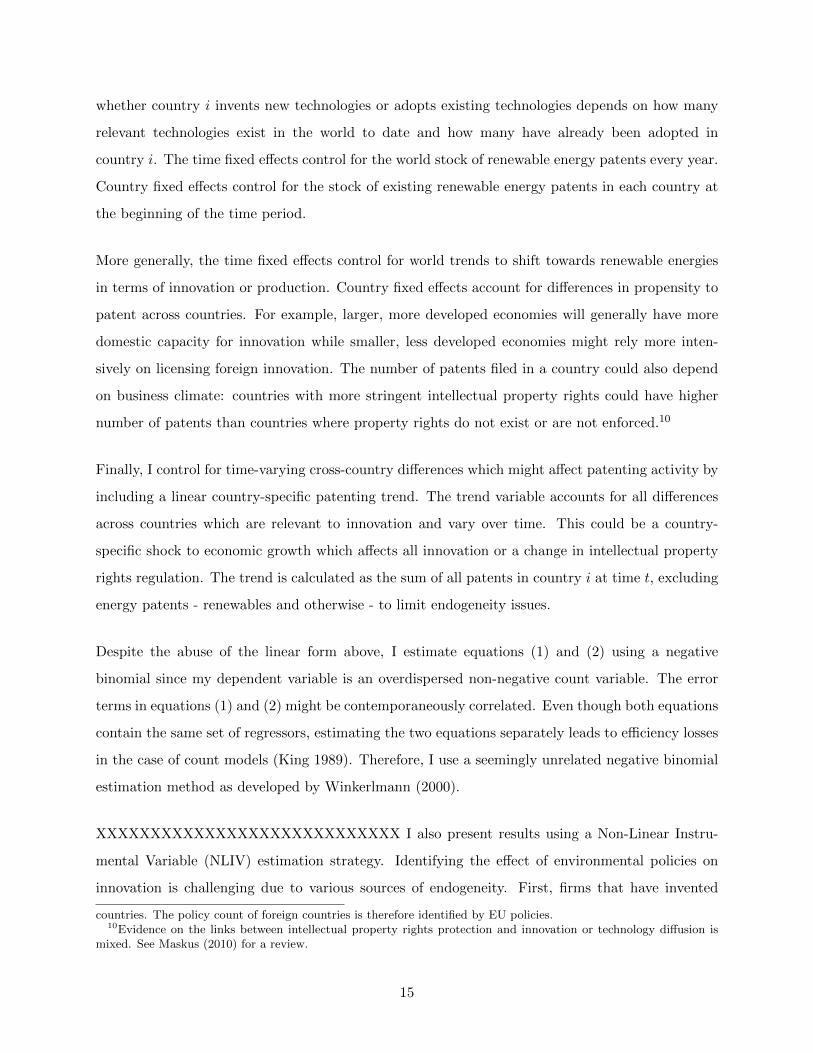
whether country i invents new technologies or adopts existing technologies depends on how many
relevant technologies exist in the world to date and how many have already been adopted in
country i. The time fixed effects control for the world stock of renewable energy patents every year.
Country fixed effects control for the stock of existing renewable energy patents in each country at
the beginning of the time period.
More generally, the time fixed effects control for world trends to shift towards renewable energies
in terms of innovation or production. Country fixed effects account for differences in propensity to
patent across countries. For example, larger, more developed economies will generally have more
domestic capacity for innovation while smaller, less developed economies might rely more inten-
sively on licensing foreign innovation. The number of patents filed in a country could also depend
on business climate: countries with more stringent intellectual property rights could have higher
number of patents than countries where property rights do not exist or are not enforced.10
Finally, I control for time-varying cross-country differences which might affect patenting activity by
including a linear country-specific patenting trend. The trend variable accounts for all differences
across countries which are relevant to innovation and vary over time. This could be a country-
specific shock to economic growth which affects all innovation or a change in intellectual property
rights regulation. The trend is calculated as the sum of all patents in country i at time t, excluding
energy patents - renewables and otherwise - to limit endogeneity issues.
Despite the abuse of the linear form above, I estimate equations (1) and (2) using a negative
binomial since my dependent variable is an overdispersed non-negative count variable. The error
terms in equations (1) and (2) might be contemporaneously correlated. Even though both equations
contain the same set of regressors, estimating the two equations separately leads to efficiency losses
in the case of count models (King 1989). Therefore, I use a seemingly unrelated negative binomial
estimation method as developed by Winkerlmann (2000).
XXXXXXXXXXXXXXXXXXXXXXXXXXXX I also present results using a Non-Linear Instru-
mental Variable (NLIV) estimation strategy. Identifying the effect of environmental policies on
innovation is challenging due to various sources of endogeneity. First, firms that have invented
countries. The policy count of foreign countries is therefore identified by EU policies.10Evidence on the links between intellectual property rights protection and innovation or technology diffusion is
mixed. See Maskus (2010) for a review.
15

new technologies could be lobbying the government to implement policies that encourage the use
of those new technologies. Second, some omitted sources of variation that are difficult to control
for in this context could introduce bias. Each of these channels is discussed in more detail in the
next section. To
3.4 Results
First, I run equations (1) and (2) on a contemporaneous measure of policy which is the total
count of policies enacted in country i in year t (Table 4, columns 1 and 2). Before diving into the
interpretation of the main coefficient of interest, note that the coefficients on the covariates generally
comport with intuition. An increase in the price of electricity or in the demand for electricity have
a positive and significant relationship to patent filings. More policies in other countries will increase
the number of patent filings at home. This could be because domestic inventors create technologies
in response to foreign policies but file at home before transferring their inventions abroad, or it could
be that foreign policies spur innovation abroad and thereby boost the number of potential inventions
that can be transferred to country i following a policy in country i. Later specifications will shed
some light on this question. The coefficient on the patenting trend is negative and significant. One
explanation might be that higher innovation in other sectors crowds out innovation in renewables
since investment resources are limited.
More central to the question of interest, I find that an additional domestic renewable energy policy
is associated with positive but not statistically significant increases of 4.5 percent and 2.3 percent
in patent filings by domestic and foreign inventors respectively. However, a couple of facts might
explain the lack of significance. First, inventors could need some time to file a patent in response
to a policy if they develop brand new technologies. Second, contemporaneous policies could be
endogenous as firms that have already innovated could lobby for additional environmental policies
to promote the use of their technologies. Since firms cannot lobby for past policies and to account
for the potential lag in response, I run the same regressions with environmental policies at time
t− 1 (Table 4 columns 3 and 4).
I find that the coefficient on renewable energy policies is positive and significant for foreign patents,
but small and not statistically significant for domestic patents. An additional environmental policy
16
at time t − 1 is associated with a 36.8 percent increase in patent filings by foreign inventors, and
only 2.2 percent by domestic inventors. Given the mean of the policy count is 0.673, one additional
policy represents a large increase, which explains the large magnitude of the foreign effect and
impresses further the lack of effect on the domestic inventor side. Evaluated at the mean, these
figures translate into 209 additional value-weighted patents owned by foreign inventors, and less
than one additional patent held by domestic inventors. Given the average family size over the
period, 50 new patents are filed following the implementation of a new renewable energy policy in
the OECD, and these patents are owned by foreign inventors. The results suggest at this point
that there is no effect on domestic inventors. The remainder of this sections uses the lagged policy
as the main regressor of interest.
Despite the current controls and lagged variable, some endogeneity might remain. If there is
persistence in the number of policies enacted each year, the lagged policy measure does not entirely
remove the previously mentioned source of endogeneity whereby firms that have innovated lobby
for more policies. Moreover, omitted political economy variables such as the rise of the green
party to power could be positively affecting both the enactment of additional renewable energy
policies and the development of the renewable energy industry, leading to a positive bias. And
some shocks to economic growth might affect environmental technologies differently than other
types of innovation so they would not be controlled for by the patenting trend. Such a shock might
lead to more environmental policies being implemented in the hopes of stimulating the economy
but less innovation as firms are financially constrained, thus creating a negative bias.
To account for these additional sources of endogeneity, I employ the Hausman and Taylor (1981)
method which makes use of the panel dimension of the data to instrument for the endogenous
variable using lagged values of the variable. Consistent with the literature, I remove the first
two lags from the instruments to avoid further issues related to the persistence of policies. Table
4 shows that accounting for endogeneity, an additional policy at time t − 1 is associated with
a 9.8 percent increase in foreign patents (column 6), but also a 14.9 percent increase in domestic
patents (column 5). In line with intuition, the increase in the domestic patents coefficients indicates
that the negative bias from omitted economic shocks affected domestic inventors more so than
foreign inventors. On the other hand, foreign patents appeared to suffer from the positive bias
due to omitted political economy variables. Since most foreign patents are transfers of existing
17
technologies, foreign inventors can respond immediately to a rise in the influence of environmentally
conscious parties in anticipation of more environmental policies.
The coefficients are both significant and not statistically different from one another. Environmental
policies stimulate patent filings by both domestic and foreign inventors. In fact, in terms of per-
centage magnitude, the effect on filings by domestic inventors (14.9 percent) is stronger than the
effect on filings by foreign inventors (9.8 percent). Nonetheless, since the majority of patents are
foreign, the economic magnitude of the coefficients differ significantly: these percentages evaluated
at the mean and accounting for family size represent only 8 additional domestic patents but 54 new
foreign patent filings. Still, the effect on patent filings by domestic inventors is strongly statistically
significant.
Table 5 provides evidence that the results are robust to using alternative measures of policy.
Columns (1) and (2) present results for the count of policies separated by policy types. For the
main type of policy - economic instruments - the results remain: both domestic and foreign patent
filings are positively and significantly affected by policies. Other types, such as regulatory instru-
ments and R&D incentives, show a strong effect on filings by foreign inventors but no statistical
response of domestic inventors. Voluntary contributions, on the other hand, only have an effect on
domestic inventors, and the other policy types do not ellicit a significant response of patent filings
by either domestic or foreign inventors. Columns (3) and (4) use a stock of policies rather than
a flow and the last two columns are run on a subset of data for wind policies and technologies in
seven OECD countries. All confir that policies significantly stimulate adoption of domestic and
foreign technologies alike.
The large number of foreign patents filings does not imply that foreign inventors are developing
new technologies in response to domestic policies. This figure could instead represent adoption of
existing technologies. Table 6 separates patent counts between transfers of existing technologies
measured as patents that were previously filed in another country, and new inventions which are
patents that were not previously filed elsewhere. Columns (1) and (2) show that policies do not
spur new inventions by foreign inventors, but rather incentivize foreign inventors to transfer their
existing technologies to the country in question. Foreign transfers represent over three quarters of
total foreign patents, so the effect of policies on patent transfers is large.
18
Finally, a country-by-country analysis shows that only in Japan and Germany, two countries that
have high levels of innovation in the economy overall, do policies significantly stimulate mainly
domestic innovationwith no significant effect on foreign patent filings (Table 7). These results would
support the idea of the first-mover advantage since Germany is also the first country in my dataset
to have implemented policies favoring the use or development of renewable energy technologies.
The case of Japan, that implemented policies later, might suggest that overall innovative capacity
played a key role in positioning Japan as a center of innovation for renewables.
The next few tables provide some additional results and checks. Table 8 includes multiple lags of
the policy variable and finds that patents respond to policies up to 3 years after enactment. Table 9
shows that the conclusion that foreign patent filings respond more to policies than domestic patent
filings are robust to specifications including different sets of controls.
In sum, I find that policies which aim to foster the development and use of renewable energies are
associated with a significant increase in patent filings of around 10 percent, but outside of highly
innovative economies such as Germany or Japan, the vast majority of these patents are transfers of
existing foreign technologies rather than new domestic inventions or even new foreign inventions.
This result holds with different measures of policy and accounts for potential endogeneity issues.
The claim that renewable energy policies stimulate innovation in renewable energy technologies
therefore does not appear to be substantiated in OECD countries between 1988 and 2003. However,
policies could still stimulate the domestic economy if these foreign transferred technologies spur
manufacturing production.
4 Technology Adoption and the Production of Technology-Specific Inputs
An inventor will file a patent to protect his invention in a country because he plans to market the
invention in that country. On the one hand, the technology or the inputs into that technology
can be produced in the country where the patent was filed: a domestic inventor could produce
locally, a foreign inventor could engage in foreign direct investment to produce the technology in
the country where he filed, or a domestic manufacturer could license the right from the foreign
innovator to produce the good locally. On the other hand, the technology or the inputs can be
19
produced abroad and imported to be sold in the country where the patent is filed. Environmental
policies will only directly increase domestic manufacturing if technology-specific goods and inputs
are produced domestically, not if they are imported. In this section, I examine how the rise in patent
filings discussed above - both domestic and foreign - affected the production of the technologies,
comparing the effect on the domestic manufacturing of technologies to the effect on the imports of
technologies.
Manufacturing production data are not available for all countries at a level of detail which would
allow me to identify inputs used exclusively for renewable technologies. As a result, I use exports
as a proxy for domestic production. While exports are an imperfect proxy for manufacturing
production, they do allow me to examine the competitiveness portion of the claim. As mentioned
in the introduction, policymakers state that the technologies that are developed and manufactured
in response to environmental policies will then be exported to other countries that implement
similar policies later on. But if the rise in exports is trumped by a large inflow of imports, there
could be little gains in competitiveness. To test whether policies do in fact improve competitiveness,
I examine how innovation affects both exports and imports. This section therefore compares the
effect of patents on exports and imports to determine whether adopted technologies are primarily
produced at home or abroad, and whether the domestic economy experiences a gain in global
competitiveness. The following subsections describe the data sources, estimation procedure, and
results.
4.1 Data
The measure of technology adoption is patents as in the first part of the paper, but I no longer need
to distinguish between domestic and foreign inventors. I assume that a firm in country i that wants
to make use of a renewable technology will chose from the set of available technologies as proxied
by the technologies which have been patented in this country, regardless of the country of residence
of the inventor. Moreover, available technologies are not only the technologies patented in year t
but all technologies patented up until year t. Thus, while the first part of the paper focused on the
flows of new patents, this section requires a measure of the stock of knowledge accumulated in each
country in renewable energies. Here I assume that patents provide an opportunity to manufacture
and sell a technology. If instead patents are filed strategically to impose a barrier on domestic
20
production, then I should observe no effect in this section.
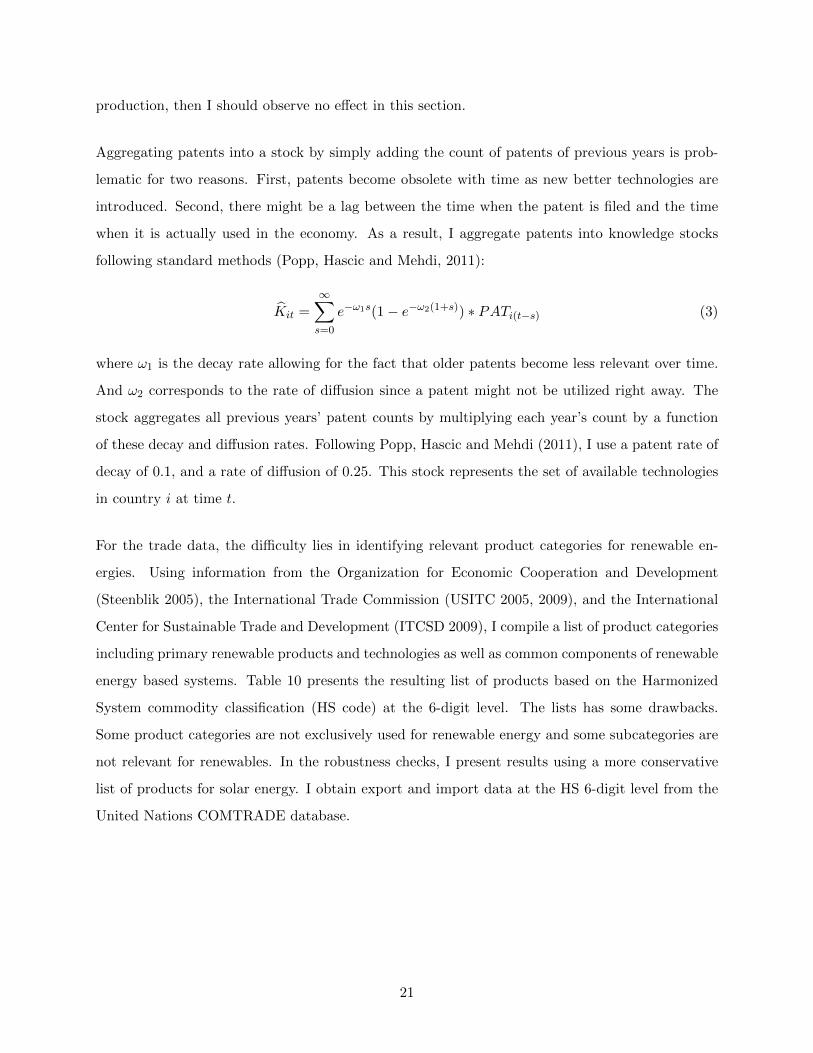
Aggregating patents into a stock by simply adding the count of patents of previous years is prob-
lematic for two reasons. First, patents become obsolete with time as new better technologies are
introduced. Second, there might be a lag between the time when the patent is filed and the time
when it is actually used in the economy. As a result, I aggregate patents into knowledge stocks
following standard methods (Popp, Hascic and Mehdi, 2011):
Kit =
∞∑s=0
e−ω1s(1 − e−ω2(1+s)) ∗ PATi(t−s) (3)
where ω1 is the decay rate allowing for the fact that older patents become less relevant over time.
And ω2 corresponds to the rate of diffusion since a patent might not be utilized right away. The
stock aggregates all previous years’ patent counts by multiplying each year’s count by a function
of these decay and diffusion rates. Following Popp, Hascic and Mehdi (2011), I use a patent rate of
decay of 0.1, and a rate of diffusion of 0.25. This stock represents the set of available technologies
in country i at time t.
For the trade data, the difficulty lies in identifying relevant product categories for renewable en-
ergies. Using information from the Organization for Economic Cooperation and Development
(Steenblik 2005), the International Trade Commission (USITC 2005, 2009), and the International
Center for Sustainable Trade and Development (ITCSD 2009), I compile a list of product categories
including primary renewable products and technologies as well as common components of renewable
energy based systems. Table 10 presents the resulting list of products based on the Harmonized
System commodity classification (HS code) at the 6-digit level. The lists has some drawbacks.
Some product categories are not exclusively used for renewable energy and some subcategories are
not relevant for renewables. In the robustness checks, I present results using a more conservative
list of products for solar energy. I obtain export and import data at the HS 6-digit level from the
United Nations COMTRADE database.
21
4.2 Estimation Procedure
Using trade data and the stock of patented technologies, I explore the effect of technology adoption
on renewable technology exports and imports using a standard gravity model modified to include a
measure of technology. Gravity models predict bilateral trade flows based on country characteristics
and trade costs between country pairs. These costs are related to distance as well as common
features such as a border, language, or trade agreement. Although the gravity model originated
as an empirical exercise, trade theorists have since established the theoretical underpinnings of the
model, and evidence suggests that gravity models have been successful in predicting trade flows
(Frankel 1997, Head and Mayer 2013).
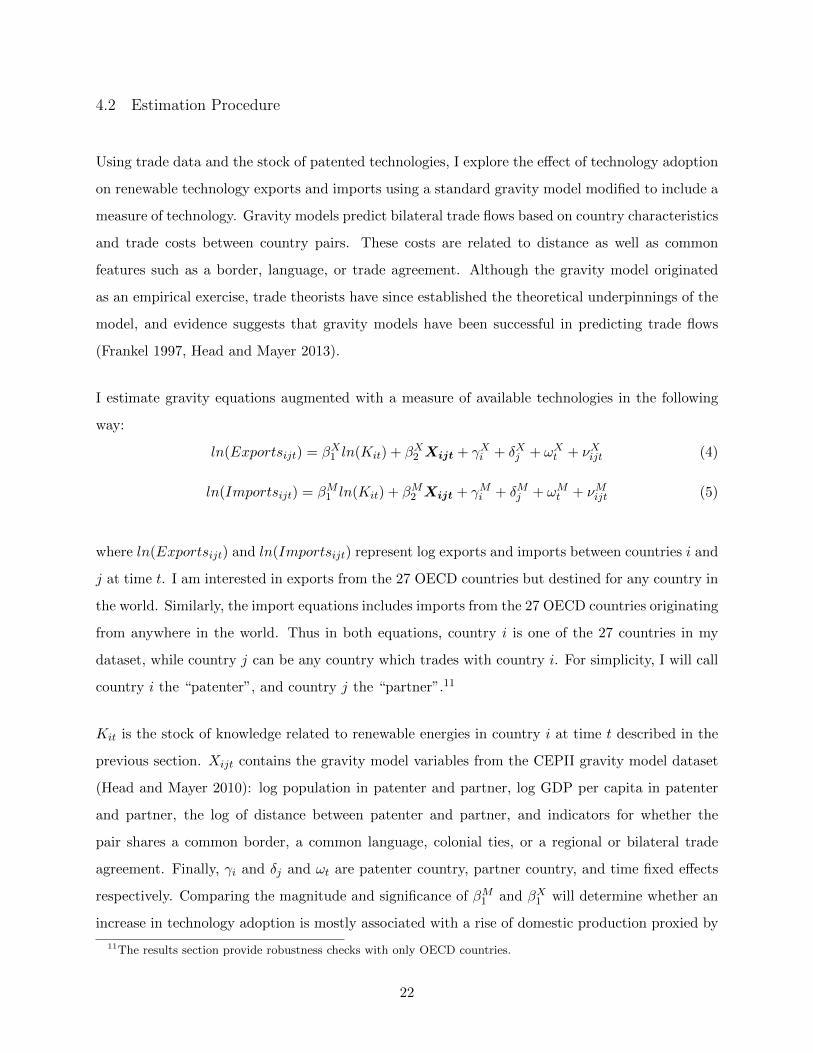
I estimate gravity equations augmented with a measure of available technologies in the following
way:
ln(Exportsijt) = βX1 ln(Kit) + βX2 Xijt + γXi + δXj + ωXt + νXijt (4)
ln(Importsijt) = βM1 ln(Kit) + βM2 Xijt + γMi + δMj + ωMt + νMijt (5)
where ln(Exportsijt) and ln(Importsijt) represent log exports and imports between countries i and
j at time t. I am interested in exports from the 27 OECD countries but destined for any country in
the world. Similarly, the import equations includes imports from the 27 OECD countries originating
from anywhere in the world. Thus in both equations, country i is one of the 27 countries in my
dataset, while country j can be any country which trades with country i. For simplicity, I will call
country i the “patenter”, and country j the “partner”.11
Kit is the stock of knowledge related to renewable energies in country i at time t described in the
previous section. Xijt contains the gravity model variables from the CEPII gravity model dataset
(Head and Mayer 2010): log population in patenter and partner, log GDP per capita in patenter
and partner, the log of distance between patenter and partner, and indicators for whether the
pair shares a common border, a common language, colonial ties, or a regional or bilateral trade
agreement. Finally, γi and δj and ωt are patenter country, partner country, and time fixed effects
respectively. Comparing the magnitude and significance of βM1 and βX1 will determine whether an
increase in technology adoption is mostly associated with a rise of domestic production proxied by
11The results section provide robustness checks with only OECD countries.
22
exports or an increase in imports.
Santos Silva and Tenreyro (2006) shows that under heteroskedasticity, log linearized gravity models
can lead to substantial biases. The authors propose using a Poisson pseudo maximum likelihood
(PPML) estimation instead to obtain consistent estimates. This method is also more appropriate
for dealing with zero values in the dependent variable, which are common and create additional
issues in log linearized models. I estimate the gravity equations using PPML and provide robustness
checks using two other popular methods: ordinary least squares (OLS) dropping pairs with zero
trade flows, and OLS with a transformed dependent variable (“OLS+1”): ln(Importsijt + 1) and
ln(Exportsijt + 1).
Table 11 provides the summary statistics for trade flows and the renewable patent stock. On
average across OECD countries and years, imports of renewable energy technology inputs total $11
million and exports $12 million between 1988 and 2003. The range varies greatly across countries.
Germany is the largest exporter with an average of $63 million per year. Not far behind, Japan
and the United States export on average $45 million per year. The United States is not only one
of the top exporters but also by far the main importer of renewable technology inputs: its mean
import value across the time period is $56 million.
4.3 Results
As can be seen in Table 12, the coefficients on the standard gravity model variables are in line with
intuition. Across all specifications, all controls have positive and significant effects on trade, except
distance. The coefficient on the variable of interest, the stock of renewable technologies, is also
positive and significant for both imports and exports in all three functional forms. In the PPML
regressions - the preferred specificiation - a 1 percent increase in the stock of renewable energy
patents is associated with a 0.232 percent rise in imports, and a 0.352 percent rise in exports.
Hence, the evidence suggests that while some technologies are imported, some technologies are at
least partly produced domestically.
However, it could be that inventors build on the technology embodied in imports to create new
technologies, which would lead to an overestimation of the import-elasticity of innovation. Or a high
23
level of the trade of renewable technologies might mean that existing technologies are appropriate
in which case there would not be the need to innovate further, which would negatively bias the
coefficients. To address these concerns, I instrument for the stock of knowledge in renewable
technologies with the stock of knowledge in all other non-energy technologies. The instrument is
relevant since there is a common patenting trend in each country. And it is exogenous because non-
energy patents are unlikely to be directly related to the trade of renewable technologies. I estimate
equations (4) and (5) using an instrumental variable approach. The results from the linear first
stage are presented in Table 13 and show that the instrument is highly relevant. Accounting for
endogeneity (Table 14, columns 1 and 2), a 1 percent increase in the stock of renewable energy
patents is associated with a 0.679 percent increase in exports and a 0.627 percent increase in
imports. Again, the results are robust to using OLS or OLS+1.
Still, exports are an imperfect proxy for domestic production. Since the results show that exports
and imports both increase, it is possible that there would be no net effect on domestic production.
Production of exported goods could be increasing at the expense of production of goods that are
now imported. This would indicate a classic trade theory specialization story and would generate
gains from trade, but would not represent an increase in manufacturing output. Column 7 there-
fore examines the effect of the patent stock on net exports. The coefficient on the patent stock is
positive and significant, indicating that the rise in patent filings does boost net exports. This spec-
ification confirms that increased patents will be associated with a rise in domestic manufacturing
production.
Table 15 provides some robustness checks. Since the majority of exports of renewable energy
technologies from my sample originate in Germany, Japan or the United States, the positive and
significant coefficient on exports could be driven only by these three countries, which are highly
innovative nations in all industries. Columns (1) and (2) present the regressions removing Japan,
Germany and the United States from the sample. For simplicity, only PPML estimates are reported.
The coefficients on imports and exports remain significant and roughly of the same magnitude.
Therefore, the rise in exports following an increase in the knowledge stock is not limited only to the
main exporters. In all countries, some components of the technologies are produced domestically
and exported.
As mentioned previously, the set of product codes identified as renewable energy technology inputs
24
is not exact.12 In Table 15 columns (3) and (4), I restrict the solar trade data to photovoltaic cells
and modules only. The results remain that the stock of knowledge has a positive and significant
effect on exports, although the effect on imports is twice as large.
The above results allow the 27 OECD countries to trade with any country in the world. As a result, I
include only the knowledge stock of the patenter and not the knowledge stock of the trading partner
since I do not have that data for non-OECD countries. My estimation strategy therefore deviates
from standard gravity models which includes all variables in both origin and destination countries.
As a check, I restrict trading partners to OECD countries only TTable 16). In a first instance,
columns (1) and (2) present the same regression as above but limited to OECD countries. An
increase in the patenting stock in country i has a positive and significant effect on export, but no
effect on imports. Comparing these results to those in Table 14 suggests that the effects on imports
originates mostly from non-OECD countries. In a second step, columns (3) and (4) include the
stock of available technologies in the partner country as well. The results show that after controlling
for the patent stock in the partner country j, the higher the patent stock in country i the larger
the exports from country i to j and the lower the imports from country j to i. This suggests that
increased technology adoption at home will stimulate exports at the expense of imports, which
could indicate that imports are being replace by domestic manufacturing production.
Therefore, the results show that renewable energy innovation lead to a rise in exports so that at
least some inputs and technologies are produced domestically. In the first part of the paper, the
results suggested that one environmental policy was associated with a 10 percent increase in patents.
Combining the two sections of the paper, I conclude that an environmental policy is associated with
a 6.79 percent increase in exports of renewable energy technologies.13 These figures represent only
the effect of policies on trade through the technology adoption channel. Table 17 includes the policy
count from part I of the paper in the gravity model regression to examine whether policies have
an additional direct effect on trade. The coefficient on the policy variable does not appear to be
significant in either regression, suggesting that there is little additional effect of policies on trade
beyond the technology adoption channel.
12For example, the two codes for solar energy are: 8541.40 - photovoltaic cells and modules, and 8504.40 - staticconverters. The first is exclusively solar PV technologies; the second includes both inverters for solar panels andother kinds of converters not used in renewables.
13These “back of the envelope” figures are calculated multiplying the effect of the first part (10 percent) by theeffect of the second part (0.679 percent for exports).
25
5 Conclusion
The sheer magnitude of the political and monetary capital being invested into greening the econ-
omy around the world suggest the need for academic research on the links between environmental
regulation, green innovation, and green manufacturing. However, the theory is inconclusive so the
question of whether environmental policies stimulate the domestic economy is mainly an empirical
one.
The framework I devise to identify those links is straightforward. Environmental policies affect two
main levels of economic activity: innovation and manufacturing. These activities can take place
at home or abroad, allowing for four possible scenarios: both innovation and manufacturing occur
domestically, both happen abroad, only innovation is domestic, or only manufacturing is produced
at home. I identify which scenario is most prominent in two steps, each posing a different question
and requiring different data and estimation techniques.
In the first step, using patent data as a proxy for innovation and a measure of policy strength
specific to renewable energies, I find that renewable energy policies result in a 10 percent increase
in patent filings, but very few of these are developed by domestic inventors. Only in historically
innovative economies such as Japan and Germany do domestic inventors respond significantly to
the implementation of a policy. In the rest of the OECD, including in the United States, adopted
technologies are largely licensing of foreign technologies rather than new technologies developed
at home. In the estimation, I account for the endogeneity of environmental policies and test the
robustness of the results to different measures of policies.
In the second step, I ask whether the increase in technology adoption led to a spike in domestic
manufacturing production or to a rise in imports. I find that domestic production - proxied by
exports - increase significantly following technology adoption. At least some of the technologies
or the inputs into these technologies are manufactured domestically. Combining the two steps of
the paper, an additional renewable energy policy in the OECD is associated with a 6 percent rise
in domestic production. Therefore, the evidence suggests that renewable policies in the OECD
stimulate the economy through manufacturing in the renewable energy sector but have little effect
on the innovative sector outside of Germany and Japan.
26
6 References
Ambec, S., M. A. Cohen, S. Elgie, and P. Lanoie, 2013. The Porter Hypothesis at 20: Can
Environmental Regulation Enhance Innovation and Competitiveness? Review of Environmental
Economics and Policy, 7(1), pp.2-22.
Batrakova, S. and A. Dechezlepretre, 2013. Is there a trade-off between ’dirty’ imports and ’clean’
innovation? Mimeo.
Berman, E. and L. T. M. Bui, 2001. Environmental regulation and productivity: Evidence from
oil refineries. Review of Economics and Statistics, 83(3), pp.498–510.
Bloom, N., M. Draca, and J. Van Reenen, 2011. Trade Induced Technical Change? The Impact of
Chinese Imports on Innovation, IT and Productivity. NBER Working Papers 16717.
Brunel, C. and A. Levinson. 2015. Evaluating Measures of Environmental Regulatory Stringency.
Forthcoming in the Review of Environmental Economics and Policy.
Brunnermeier, S.G. and M. A. Cohen, 2003. Determinants of environmental innovation in US
manufacturing industries. Journal of Environmental Economics and Management, 45(2), pp.278-
293.
Brunnermeier, S.G. and A. Levinson, 2004. Examining the Evidence on Environmental Regulations
and Industry Location. Journal of Environment and Development, 13(6), pp.6–41.
Clark, D., M. Serafino, and Z. Simonetta, 2000. Do Dirty Industries Conduct Offshore Assembly
In Developing Countries? International Economic Journal, 14(3), pp.75-86.
Copeland, B.R., and M.S. Taylor, 2004. Trade, Growth and the Environment. Journal of Economic
Literature, 42, pp.7–71.
Crabb, J.M. and D.K.N. Johnson, 2010. Fueling innovation: The impact of oil prices and cafe
standards on energy-efficient automotive technology. The Energy Journal, 31(1), pp.199-216.
27
Dechezlepretre, A. and M. Glachant, 2012. Does Foreign Environmental Policy Influence Domestic
Innovation? Evidence from the Wind Industry. Grantham Research Institute on Climate Change
and the Environment. Working Paper No. 44.
Dechezlepretre, A., M. Glachant, and Y. Meniere, 2013. What Drives the International Transfer of
Climate Change Mitigation Technologies? Empirical Evidence from Patent Data. Environmental
and Resource Economics, 54(2), pp.161-178.
Dernis, H. and M. Khan, 2004. Triadic Patent Families Methodology, OECD Science, Technology
and IndustryWorking Papers, 2004/02, OECD Publishing.
Eaton and Kortum 1999
EPO (European Patent Office), 2012. Worldwide Patent Statistical Database (PATSTAT). Octo-
ber.
EPO, 2001. Agreement on the application of Article 65 of the Convention on the Grant of European
Patents. Official Journal EPO.
Gollop, F. M., and M. J. Roberts, 1983. Environmental regulations and productivity growth: The
case of fossil-fuelled electric power generation. Journal of Political Economy, 91(4), pp.654–74.
Greenstone, M., 2002. Impacts of Environmental Regulations on Industrial Activity: Evidence
from the 1970 and 1977 Clean Air Act Amendments and the Census of Manufacturers. Journal of
Political Economy, 110(6), pp.1175-1219.
Griliches, Z., 1990. Patent Statistics as Economic Indicators: A Survey. Journal of Economic
Literature, American Economic Association, 28(4), pp. 1661-1707, December.
Hausman, J.A and W.E. Taylor, 1981. Panel Data and Unobservables Individual Effects. Econo-
metrica, 49(6), pp.1377-1398.
Head, K., T. Mayer, and J. Ries, 2010. The erosion of colonial trade linkages after independence.
Journal of International Economics, 81(1), pp.1-14.
28
Head, K. and T. Mayer, 2013. Gravity Equations: Workhorse,Toolkit, and Cookbook. Working
Papers 2013-27, CEPII research center.
ITCSD, 2009. HS Codes and the Renewable Energy Sector, International Centre for Trade and
Sustainable Development, Geneva.
International Energy Agency (IEA), 2004. Renewable Energy – Market and Policy Trends in IEA
Countries. IEA, Paris, France.
International Energy Agency, 2006a. Energy balances of OECD countries. IEA, Paris, France.
International Energy Agency, 2006b. Energy prices and taxes. IEA, Paris, France.
International Energy Agency, 2008. Renewables Information. OECD/IEA, Paris, France.
International Energy Agency, 2011. Renewable Energy – Markets and Prospects by Region. IEA,
Paris, France.
International Energy Agency, 2012. Policy and Measures Database. IEA, Paris, France.
International Energy Agency, 2012. Energy Balances of OECD Countries. IEA, Paris, France.
Jaffe, A.B. and K. Palmer, 1997. Environmental Regulation and Innovation: A Panel Data Study.
The Review of Economics and Statistics, 79(4), pp. 610-619.
Johnstone, N., I. Hascic, and D. Popp, 2010. Renewable Energy Policies and Technological In-
novation: Evidence Based on Patent Counts. Review of Environmental Resource Economics, 45,
pp.133–155.
Keller, W., 2004. International Technology Diffusion. Journal of Economic Literature, 42(3),
pp.752-782.
King, G., 1989. A Seemingly Unrelated Poisson Regression Model. Sociological Methods and
Research, 17(3), pp. 235-255.
29
Lanjouw, J.O. and A. Mody, 1996. Innovation and the International Diffusion of Environmentally
Responsive Technology . Research Policy, 25, pp.549-571.
Lanoie, P., M. Patry, and R. Lajeunesse, 2008. Environmental Regulation and Productivity: New
Findings on the Porter Hypothesis. Journal of Productivity Analysis, 30, pp.121–128.
Lanoie, P., J.L. Lucchetti, N. Johnstone, and S. Ambec, 2011. Environmental Policy, Innovation
and Performance: New Insights on the Porter Hypothesis. Journal of Economics & Management
Strategy, Wiley Blackwell, vol. 20(3), pages 803-842, 09.
Lee, J., F. M. Veloso, and D. A. Hounshell, 2011. Linking induced technological change, and
environmental regulation: Evidence from patenting in the U.S. auto industry. Research Policy,
40(9), pp.1240-52.
Maskus, K., 2010. Differentiated Intellectual Property Regimes for Environmental and Climate
Technologies. OECD Environment Working Papers, No. 17, OECD Publishing. doi: 10.1787/5kmfwjvc83vk-
en.
Newell R., A. Jaffe, and R. Stavins, 1999. The Induced Innovation Hypothesis and Energy-Saving
Technological Change. Quarterly Journal of Economics, 114, pp.941–975.
Peters, M., M. Schneider, T. Griesshaber, and V. H. Hoffmann, 2012. The impact of technology-
push and demand-pull policies on technical change –Does the locus of policies matter? Research
Policy 41, pp. 1296-1308.
Popp, D., 2002. Induced Innovation and Energy Prices. American Economic Review, 92, pp.160-
180.
Popp, D., 2006. International Innovation and Diffusion of Air Pollution Control Technologies: the
Effects of NOX and SO2 Regulation in the US, Japan, and Germany. Journal of Environmental
Economics and Management, 51, pp. 46–71.
Popp, D., I. Hascic, and N. Medhi, 2006. Technology and the Diffusion of Renewable Energy.
Energy Economics, 33, pp. 648-662.
30
Porter, M.E., 1991. America’s Green Strategy. Scientific American, 264( 4).
Steenblik, R., 2005. Liberalisation of Trade in Renewable-Energy Products and Associated Goods:
Charcoal, Solar Photovoltaic Systems, and Wind Pumps and Turbines. OECD Trade and Envi-
ronment Working Paper No. 2005-07.
The White House, Office of the Press Secretary, 2009. Remarks of Lawrence H. Summers, Direc-
tor of the National Economic Council, Responding to an Historic Economic Crisis: The Obama
Program [Press release]. Retrieved from https://www.whitehouse.gov/the-press-office/remarks-
lawrence-summers-director-national-economic-council-brookings-institution
The White House, Office of the Press Secretary, 2012. Remarks by the President and Governor Rom-
ney in Second Presidential Debate [Press release]. Retrieved from https://www.whitehouse.gov/the-
press-office/2012/10/17/remarks-president-and-governor-romney-second-presidential-debate
The White House, Office of the Press Secretary, 2013. Inaugural Address by President Barack
Obama [Press release]. Retrieved from https://www.whitehouse.gov/the-press-office/2013/01/21/inaugural-
address-president-barack-obama
The White House, 2015. Economic Report of the President Chapter 6, p. 242.
USITC, 2005. Renewable Energy Services: An Examination of US and Foreign Markets, United
States International Trade Commission, Publication 3805.
USITC, 2009. Wind Turbines: Industry and Trade Summary. United States International Trade
Commission, Publication ITS-02.
Winkelmann, R., 2000. Seemingly Unrelated Negative Binomial Regression. Oxford Bulletin of
Economics and Statistics, 62(4), pp.553-560.
Xing, Y. and C. Kolstad, 2002. Do Lax Environmental Regulations Attract Foreign Investment?
Environmental and Resource Economics, 21(1), pp.1-22.
31
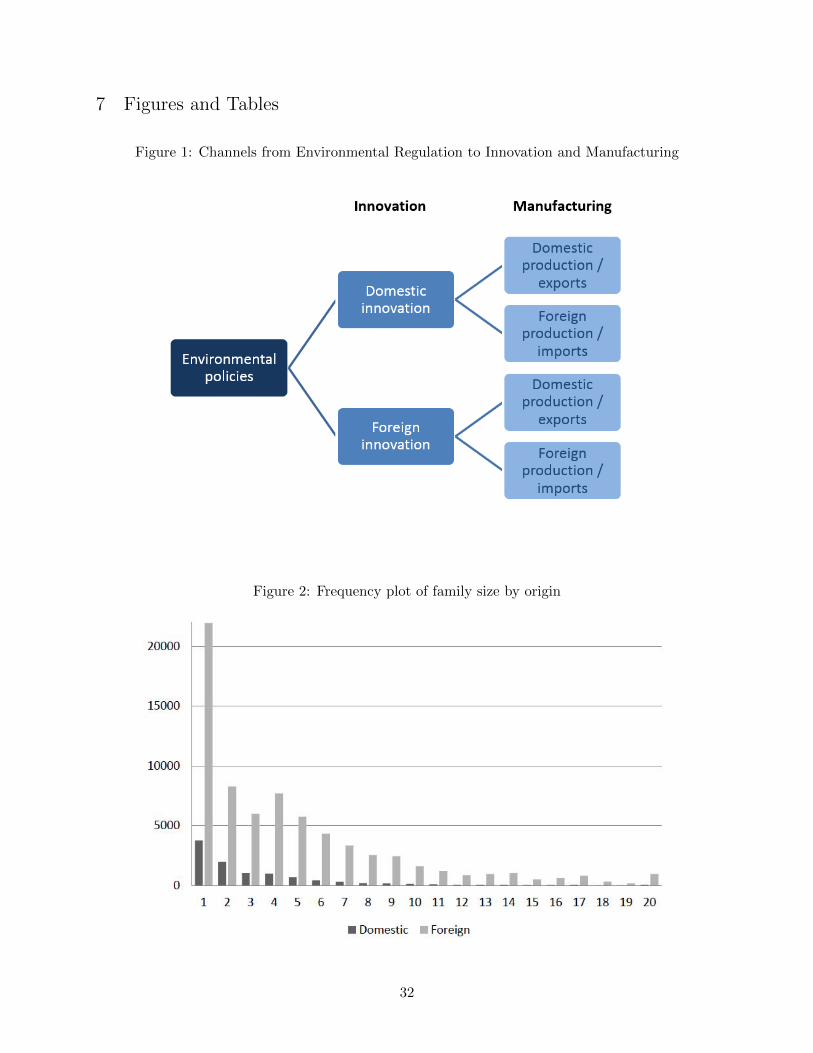
7 Figures and Tables
Figure 1: Channels from Environmental Regulation to Innovation and Manufacturing
Figure 2: Frequency plot of family size by origin
32
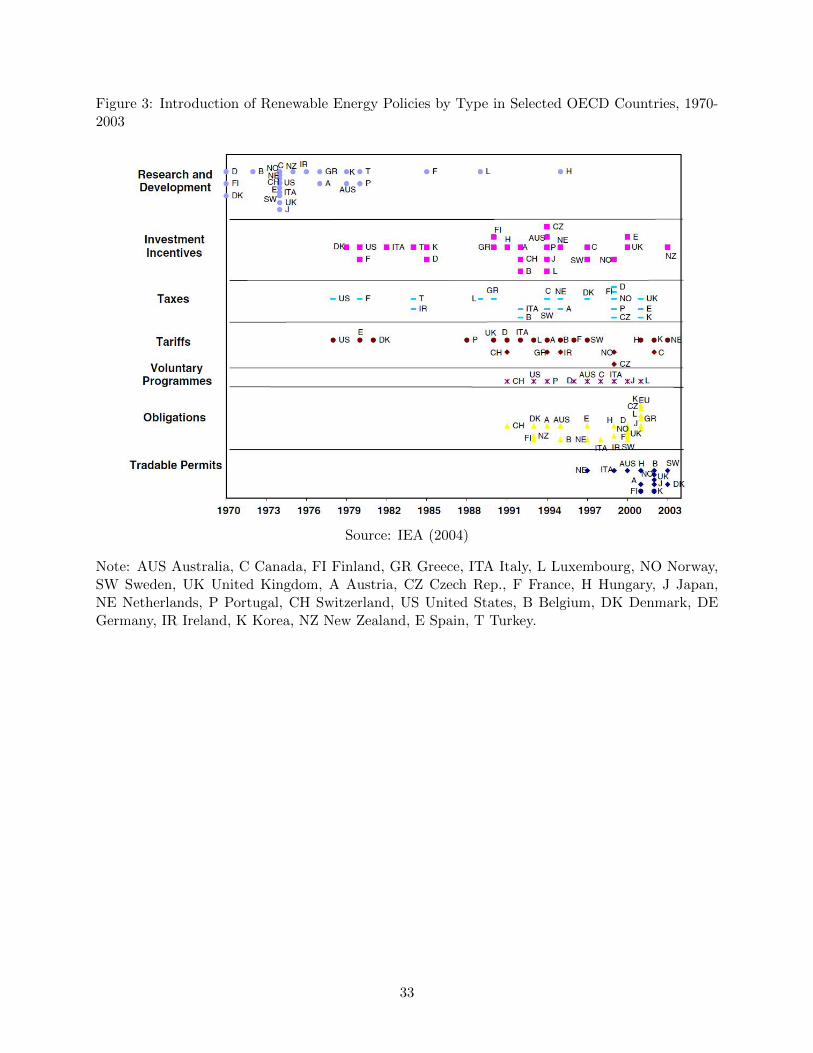
Figure 3: Introduction of Renewable Energy Policies by Type in Selected OECD Countries, 1970-2003
Source: IEA (2004)
Note: AUS Australia, C Canada, FI Finland, GR Greece, ITA Italy, L Luxembourg, NO Norway,SW Sweden, UK United Kingdom, A Austria, CZ Czech Rep., F France, H Hungary, J Japan,NE Netherlands, P Portugal, CH Switzerland, US United States, B Belgium, DK Denmark, DEGermany, IR Ireland, K Korea, NZ New Zealand, E Spain, T Turkey.
33
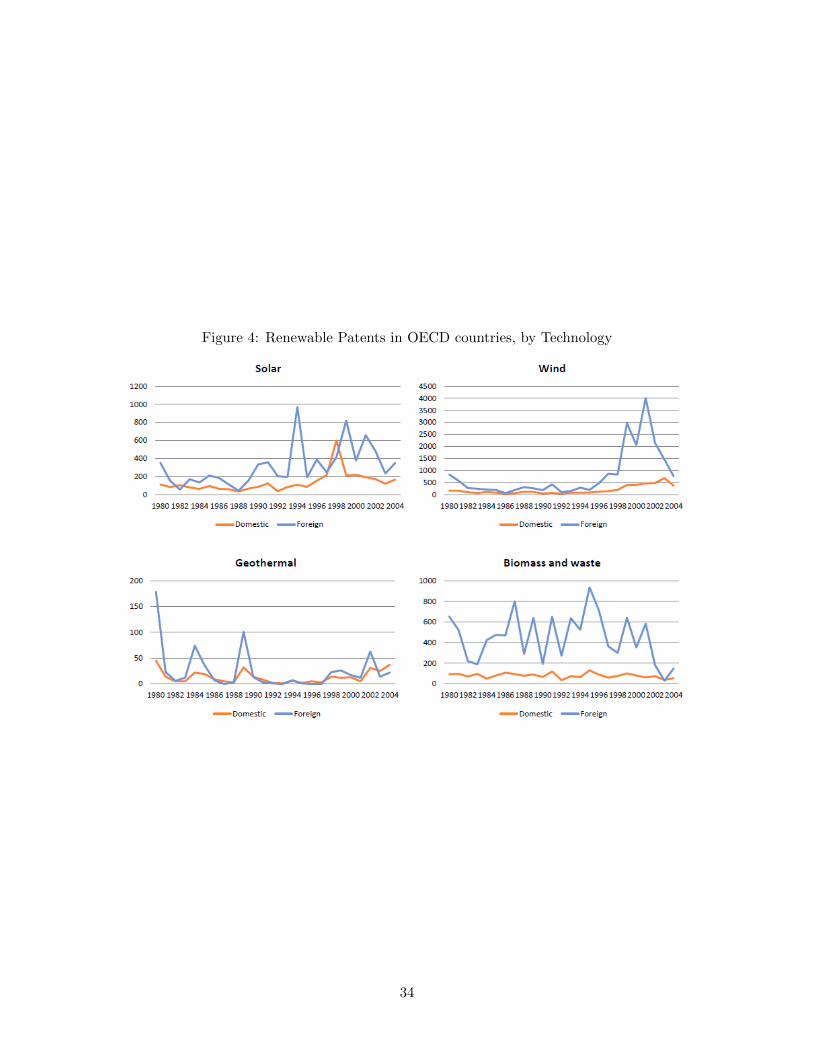
Figure 4: Renewable Patents in OECD countries, by Technology
34
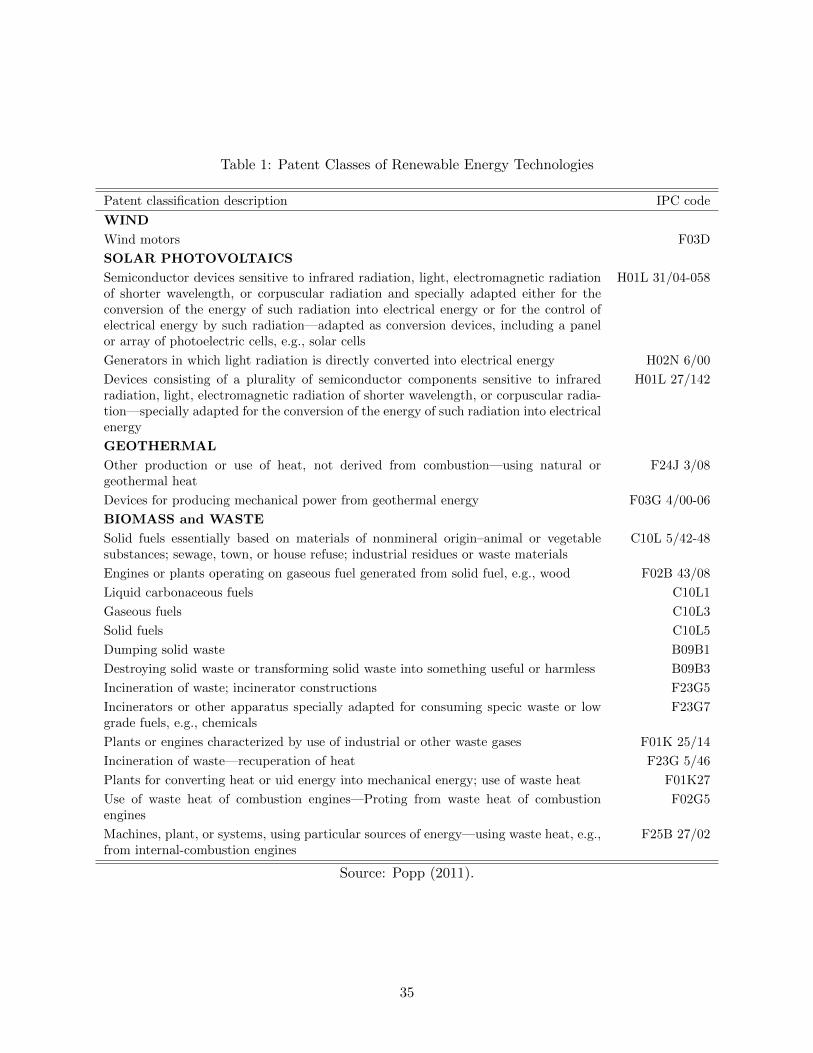
Table 1: Patent Classes of Renewable Energy Technologies
Patent classification description IPC code
WIND
Wind motors F03D
SOLAR PHOTOVOLTAICS
Semiconductor devices sensitive to infrared radiation, light, electromagnetic radiationof shorter wavelength, or corpuscular radiation and specially adapted either for theconversion of the energy of such radiation into electrical energy or for the control ofelectrical energy by such radiation—adapted as conversion devices, including a panelor array of photoelectric cells, e.g., solar cells
H01L 31/04-058
Generators in which light radiation is directly converted into electrical energy H02N 6/00
Devices consisting of a plurality of semiconductor components sensitive to infraredradiation, light, electromagnetic radiation of shorter wavelength, or corpuscular radia-tion—specially adapted for the conversion of the energy of such radiation into electricalenergy
H01L 27/142
GEOTHERMAL
Other production or use of heat, not derived from combustion—using natural orgeothermal heat
F24J 3/08
Devices for producing mechanical power from geothermal energy F03G 4/00-06
BIOMASS and WASTE
Solid fuels essentially based on materials of nonmineral origin–animal or vegetablesubstances; sewage, town, or house refuse; industrial residues or waste materials
C10L 5/42-48
Engines or plants operating on gaseous fuel generated from solid fuel, e.g., wood F02B 43/08
Liquid carbonaceous fuels C10L1
Gaseous fuels C10L3
Solid fuels C10L5
Dumping solid waste B09B1
Destroying solid waste or transforming solid waste into something useful or harmless B09B3
Incineration of waste; incinerator constructions F23G5
Incinerators or other apparatus specially adapted for consuming specic waste or lowgrade fuels, e.g., chemicals
F23G7
Plants or engines characterized by use of industrial or other waste gases F01K 25/14
Incineration of waste—recuperation of heat F23G 5/46
Plants for converting heat or uid energy into mechanical energy; use of waste heat F01K27
Use of waste heat of combustion engines—Proting from waste heat of combustionengines
F02G5
Machines, plant, or systems, using particular sources of energy—using waste heat, e.g.,from internal-combustion engines
F25B 27/02
Source: Popp (2011).
35
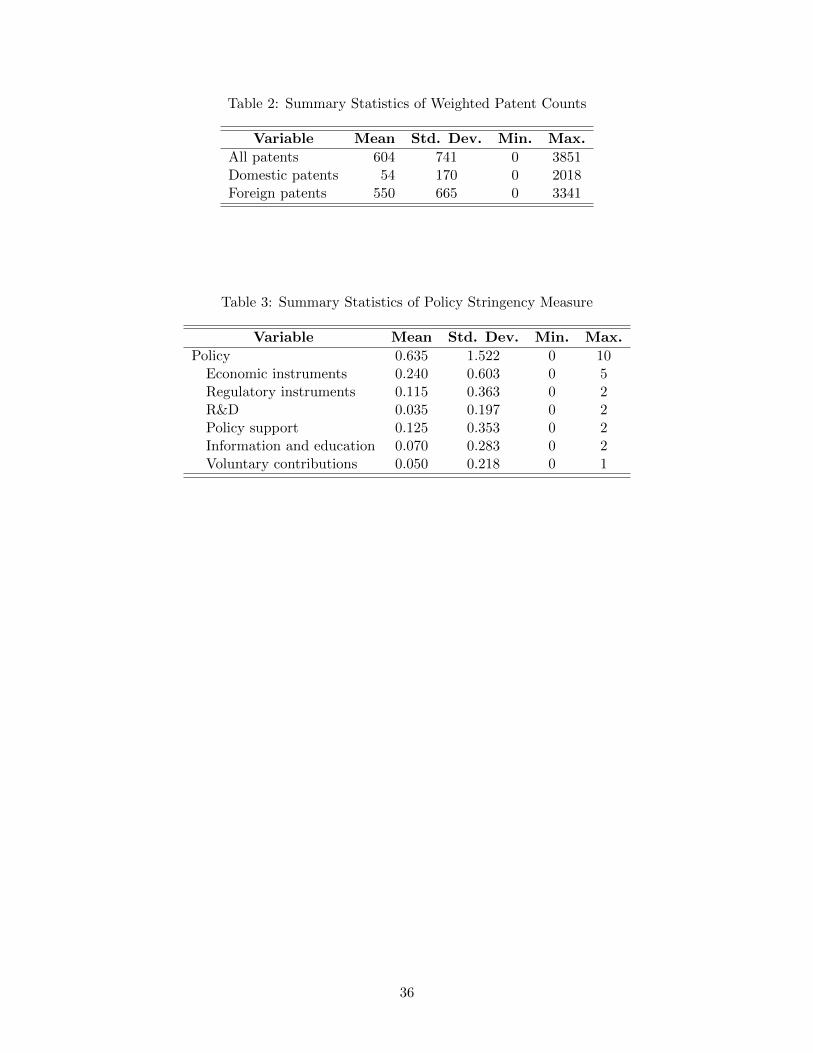
Table 2: Summary Statistics of Weighted Patent Counts
Variable Mean Std. Dev. Min. Max.
All patents 604 741 0 3851Domestic patents 54 170 0 2018Foreign patents 550 665 0 3341
Table 3: Summary Statistics of Policy Stringency Measure
Variable Mean Std. Dev. Min. Max.
Policy 0.635 1.522 0 10Economic instruments 0.240 0.603 0 5Regulatory instruments 0.115 0.363 0 2R&D 0.035 0.197 0 2Policy support 0.125 0.353 0 2Information and education 0.070 0.283 0 2Voluntary contributions 0.050 0.218 0 1
36
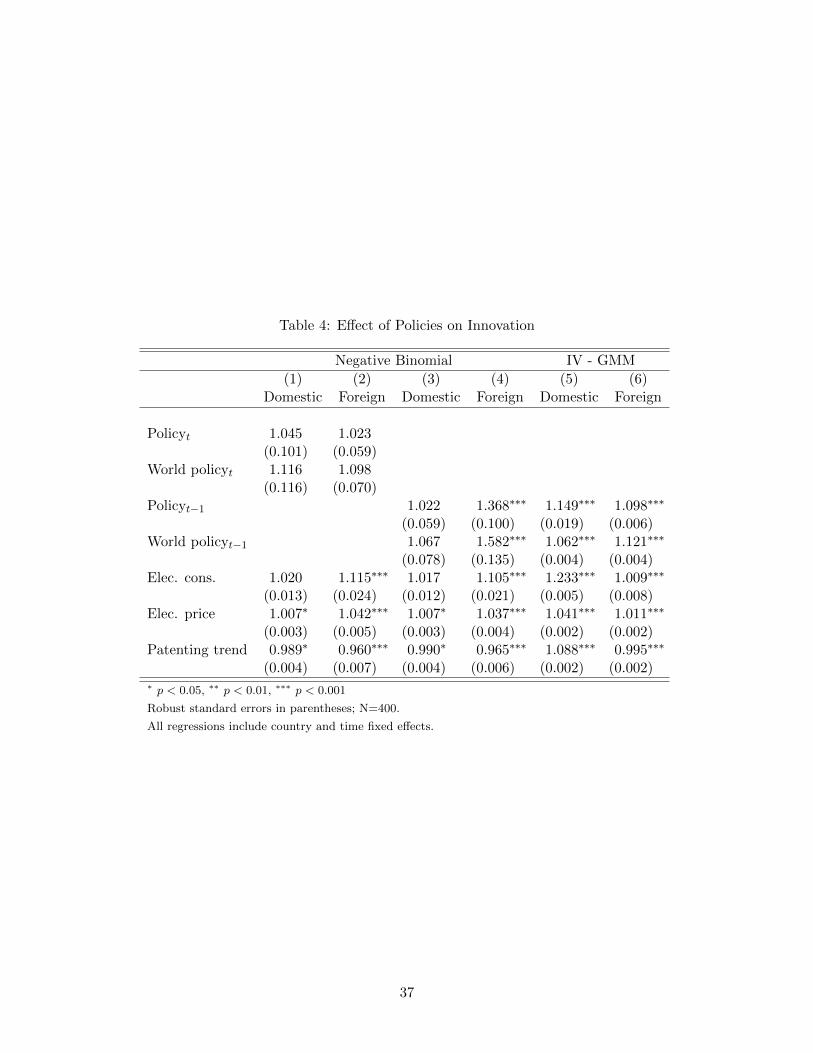
Table 4: Effect of Policies on Innovation
Negative Binomial IV - GMM
(1) (2) (3) (4) (5) (6)Domestic Foreign Domestic Foreign Domestic Foreign
Policyt 1.045 1.023(0.101) (0.059)
World policyt 1.116 1.098(0.116) (0.070)
Policyt−1 1.022 1.368∗∗∗ 1.149∗∗∗ 1.098∗∗∗
(0.059) (0.100) (0.019) (0.006)World policyt−1 1.067 1.582∗∗∗ 1.062∗∗∗ 1.121∗∗∗
(0.078) (0.135) (0.004) (0.004)Elec. cons. 1.020 1.115∗∗∗ 1.017 1.105∗∗∗ 1.233∗∗∗ 1.009∗∗∗
(0.013) (0.024) (0.012) (0.021) (0.005) (0.008)Elec. price 1.007∗ 1.042∗∗∗ 1.007∗ 1.037∗∗∗ 1.041∗∗∗ 1.011∗∗∗
(0.003) (0.005) (0.003) (0.004) (0.002) (0.002)Patenting trend 0.989∗ 0.960∗∗∗ 0.990∗ 0.965∗∗∗ 1.088∗∗∗ 0.995∗∗∗
(0.004) (0.007) (0.004) (0.006) (0.002) (0.002)∗ p < 0.05, ∗∗ p < 0.01, ∗∗∗ p < 0.001
Robust standard errors in parentheses; N=400.
All regressions include country and time fixed effects.
37
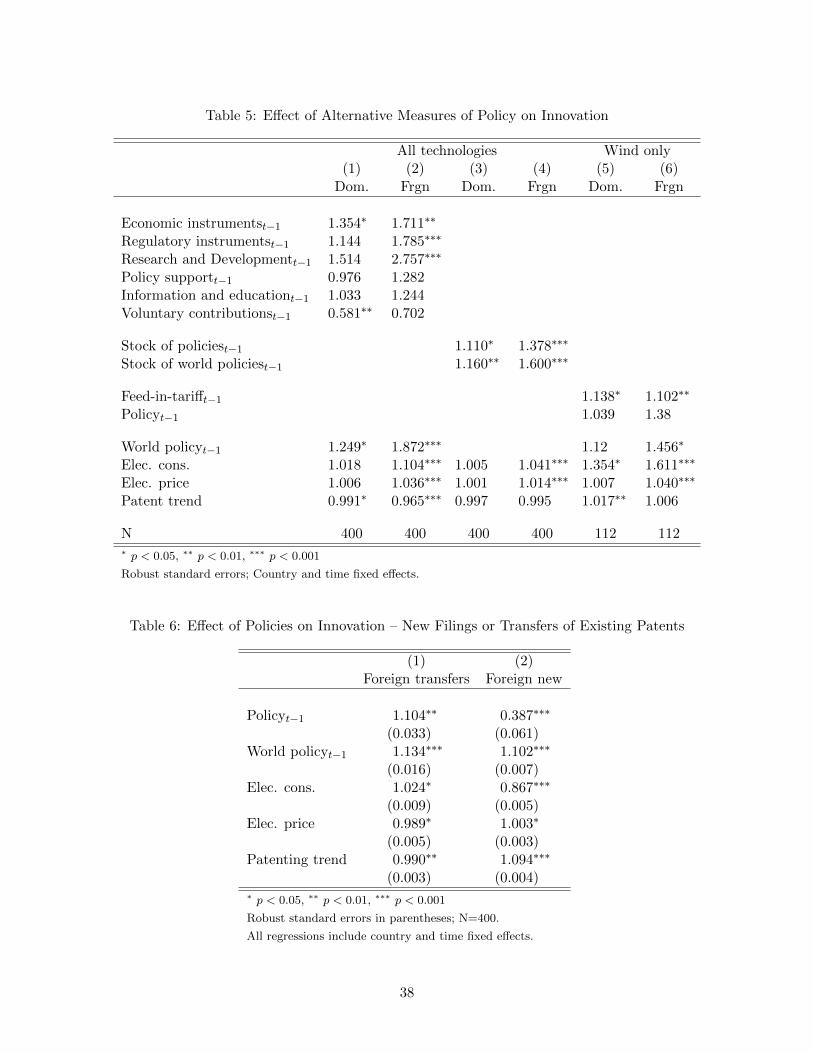
Table 5: Effect of Alternative Measures of Policy on Innovation
All technologies Wind only(1) (2) (3) (4) (5) (6)
Dom. Frgn Dom. Frgn Dom. Frgn
Economic instrumentst−1 1.354∗ 1.711∗∗
Regulatory instrumentst−1 1.144 1.785∗∗∗
Research and Developmentt−1 1.514 2.757∗∗∗
Policy supportt−1 0.976 1.282Information and educationt−1 1.033 1.244Voluntary contributionst−1 0.581∗∗ 0.702
Stock of policiest−1 1.110∗ 1.378∗∗∗
Stock of world policiest−1 1.160∗∗ 1.600∗∗∗
Feed-in-tarifft−1 1.138∗ 1.102∗∗
Policyt−1 1.039 1.38
World policyt−1 1.249∗ 1.872∗∗∗ 1.12 1.456∗
Elec. cons. 1.018 1.104∗∗∗ 1.005 1.041∗∗∗ 1.354∗ 1.611∗∗∗
Elec. price 1.006 1.036∗∗∗ 1.001 1.014∗∗∗ 1.007 1.040∗∗∗
Patent trend 0.991∗ 0.965∗∗∗ 0.997 0.995 1.017∗∗ 1.006
N 400 400 400 400 112 112∗ p < 0.05, ∗∗ p < 0.01, ∗∗∗ p < 0.001
Robust standard errors; Country and time fixed effects.
Table 6: Effect of Policies on Innovation – New Filings or Transfers of Existing Patents
(1) (2)Foreign transfers Foreign new
Policyt−1 1.104∗∗ 0.387∗∗∗
(0.033) (0.061)World policyt−1 1.134∗∗∗ 1.102∗∗∗
(0.016) (0.007)Elec. cons. 1.024∗ 0.867∗∗∗
(0.009) (0.005)Elec. price 0.989∗ 1.003∗
(0.005) (0.003)Patenting trend 0.990∗∗ 1.094∗∗∗
(0.003) (0.004)∗ p < 0.05, ∗∗ p < 0.01, ∗∗∗ p < 0.001
Robust standard errors in parentheses; N=400.
All regressions include country and time fixed effects.
38
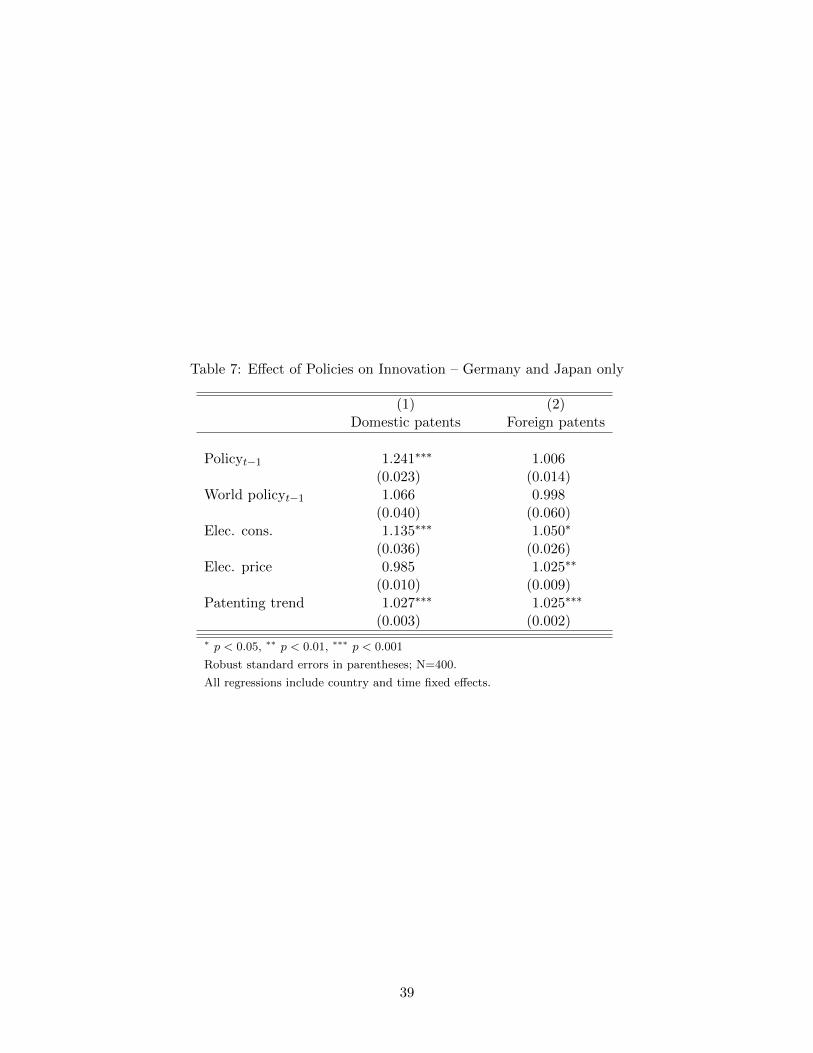
Table 7: Effect of Policies on Innovation – Germany and Japan only
(1) (2)Domestic patents Foreign patents
Policyt−1 1.241∗∗∗ 1.006(0.023) (0.014)
World policyt−1 1.066 0.998(0.040) (0.060)
Elec. cons. 1.135∗∗∗ 1.050∗
(0.036) (0.026)Elec. price 0.985 1.025∗∗
(0.010) (0.009)Patenting trend 1.027∗∗∗ 1.025∗∗∗
(0.003) (0.002)
∗ p < 0.05, ∗∗ p < 0.01, ∗∗∗ p < 0.001
Robust standard errors in parentheses; N=400.
All regressions include country and time fixed effects.
39
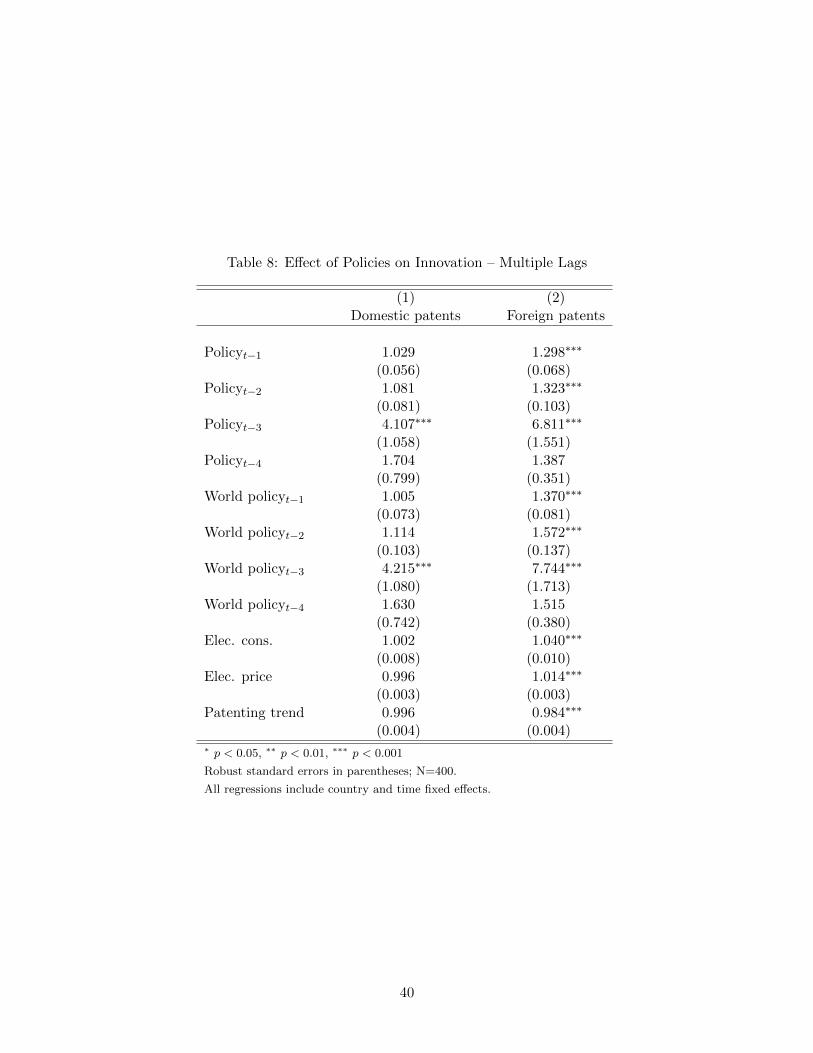
Table 8: Effect of Policies on Innovation – Multiple Lags
(1) (2)Domestic patents Foreign patents
Policyt−1 1.029 1.298∗∗∗
(0.056) (0.068)Policyt−2 1.081 1.323∗∗∗
(0.081) (0.103)Policyt−3 4.107∗∗∗ 6.811∗∗∗
(1.058) (1.551)Policyt−4 1.704 1.387
(0.799) (0.351)World policyt−1 1.005 1.370∗∗∗
(0.073) (0.081)World policyt−2 1.114 1.572∗∗∗
(0.103) (0.137)World policyt−3 4.215∗∗∗ 7.744∗∗∗
(1.080) (1.713)World policyt−4 1.630 1.515
(0.742) (0.380)Elec. cons. 1.002 1.040∗∗∗
(0.008) (0.010)Elec. price 0.996 1.014∗∗∗
(0.003) (0.003)Patenting trend 0.996 0.984∗∗∗
(0.004) (0.004)∗ p < 0.05, ∗∗ p < 0.01, ∗∗∗ p < 0.001
Robust standard errors in parentheses; N=400.
All regressions include country and time fixed effects.
40
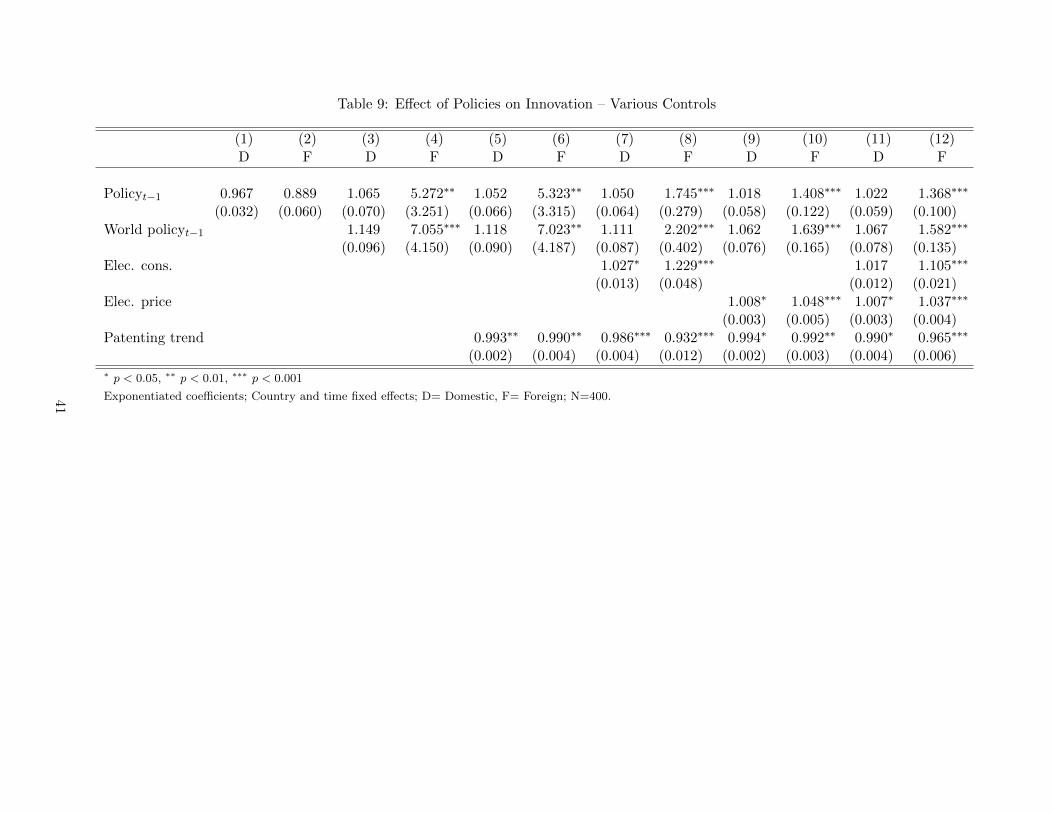
Table 9: Effect of Policies on Innovation – Various Controls
(1) (2) (3) (4) (5) (6) (7) (8) (9) (10) (11) (12)D F D F D F D F D F D F
Policyt−1 0.967 0.889 1.065 5.272∗∗ 1.052 5.323∗∗ 1.050 1.745∗∗∗ 1.018 1.408∗∗∗ 1.022 1.368∗∗∗
(0.032) (0.060) (0.070) (3.251) (0.066) (3.315) (0.064) (0.279) (0.058) (0.122) (0.059) (0.100)World policyt−1 1.149 7.055∗∗∗ 1.118 7.023∗∗ 1.111 2.202∗∗∗ 1.062 1.639∗∗∗ 1.067 1.582∗∗∗
(0.096) (4.150) (0.090) (4.187) (0.087) (0.402) (0.076) (0.165) (0.078) (0.135)Elec. cons. 1.027∗ 1.229∗∗∗ 1.017 1.105∗∗∗
(0.013) (0.048) (0.012) (0.021)Elec. price 1.008∗ 1.048∗∗∗ 1.007∗ 1.037∗∗∗
(0.003) (0.005) (0.003) (0.004)Patenting trend 0.993∗∗ 0.990∗∗ 0.986∗∗∗ 0.932∗∗∗ 0.994∗ 0.992∗∗ 0.990∗ 0.965∗∗∗
(0.002) (0.004) (0.004) (0.012) (0.002) (0.003) (0.004) (0.006)∗ p < 0.05, ∗∗ p < 0.01, ∗∗∗ p < 0.001
Exponentiated coefficients; Country and time fixed effects; D= Domestic, F= Foreign; N=400.41
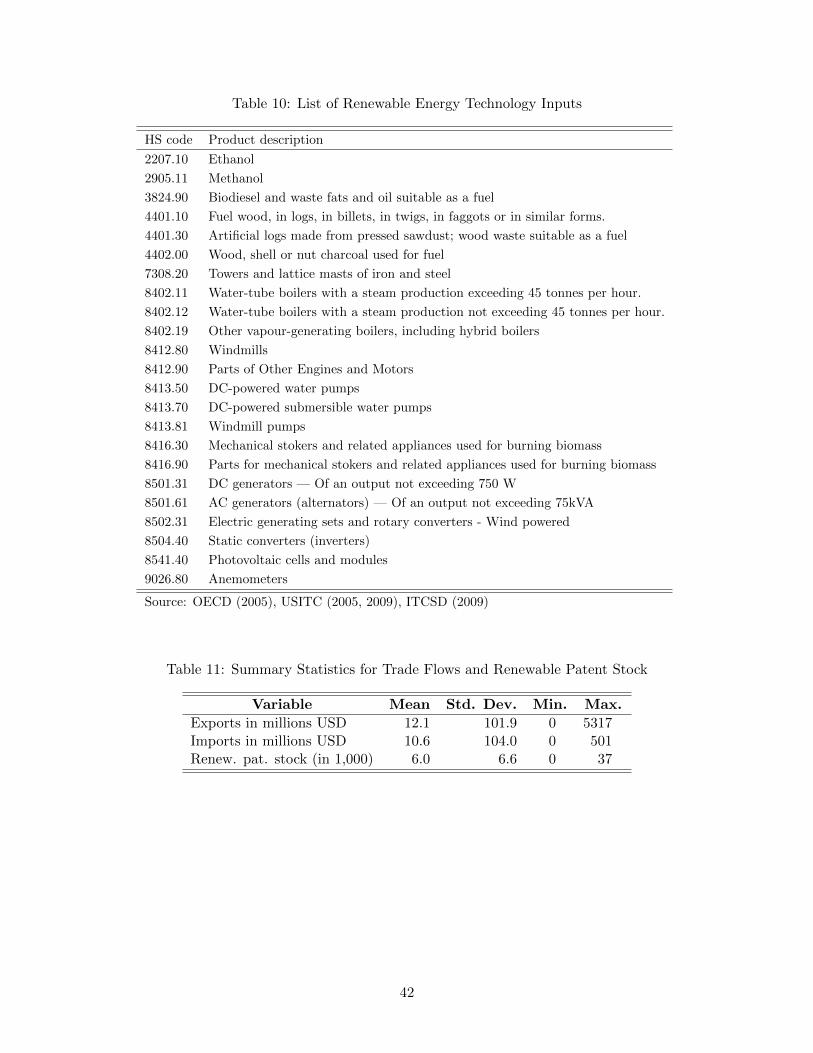
Table 10: List of Renewable Energy Technology Inputs
HS code Product description
2207.10 Ethanol
2905.11 Methanol
3824.90 Biodiesel and waste fats and oil suitable as a fuel
4401.10 Fuel wood, in logs, in billets, in twigs, in faggots or in similar forms.
4401.30 Artificial logs made from pressed sawdust; wood waste suitable as a fuel
4402.00 Wood, shell or nut charcoal used for fuel
7308.20 Towers and lattice masts of iron and steel
8402.11 Water-tube boilers with a steam production exceeding 45 tonnes per hour.
8402.12 Water-tube boilers with a steam production not exceeding 45 tonnes per hour.
8402.19 Other vapour-generating boilers, including hybrid boilers
8412.80 Windmills
8412.90 Parts of Other Engines and Motors
8413.50 DC-powered water pumps
8413.70 DC-powered submersible water pumps
8413.81 Windmill pumps
8416.30 Mechanical stokers and related appliances used for burning biomass
8416.90 Parts for mechanical stokers and related appliances used for burning biomass
8501.31 DC generators — Of an output not exceeding 750 W
8501.61 AC generators (alternators) — Of an output not exceeding 75kVA
8502.31 Electric generating sets and rotary converters - Wind powered
8504.40 Static converters (inverters)
8541.40 Photovoltaic cells and modules
9026.80 Anemometers
Source: OECD (2005), USITC (2005, 2009), ITCSD (2009)
Table 11: Summary Statistics for Trade Flows and Renewable Patent Stock
Variable Mean Std. Dev. Min. Max.
Exports in millions USD 12.1 101.9 0 5317Imports in millions USD 10.6 104.0 0 501Renew. pat. stock (in 1,000) 6.0 6.6 0 37
42
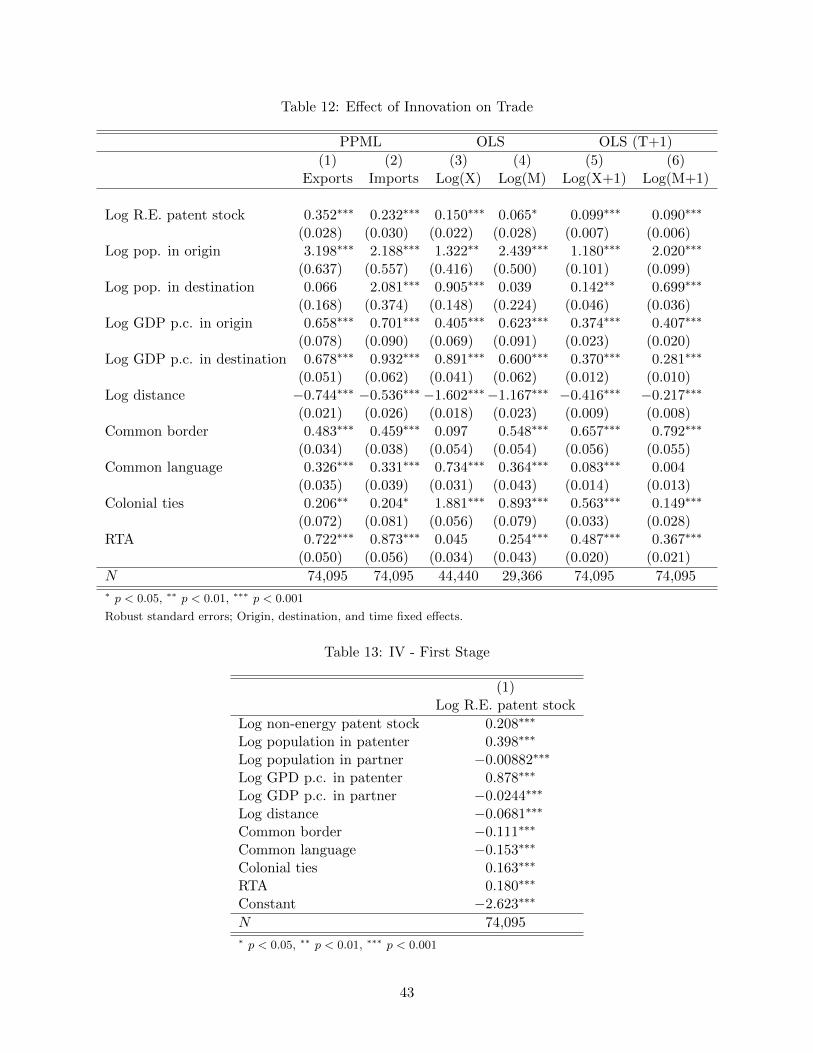
Table 12: Effect of Innovation on Trade
PPML OLS OLS (T+1)
(1) (2) (3) (4) (5) (6)Exports Imports Log(X) Log(M) Log(X+1) Log(M+1)
Log R.E. patent stock 0.352∗∗∗ 0.232∗∗∗ 0.150∗∗∗ 0.065∗ 0.099∗∗∗ 0.090∗∗∗
(0.028) (0.030) (0.022) (0.028) (0.007) (0.006)Log pop. in origin 3.198∗∗∗ 2.188∗∗∗ 1.322∗∗ 2.439∗∗∗ 1.180∗∗∗ 2.020∗∗∗
(0.637) (0.557) (0.416) (0.500) (0.101) (0.099)Log pop. in destination 0.066 2.081∗∗∗ 0.905∗∗∗ 0.039 0.142∗∗ 0.699∗∗∗
(0.168) (0.374) (0.148) (0.224) (0.046) (0.036)Log GDP p.c. in origin 0.658∗∗∗ 0.701∗∗∗ 0.405∗∗∗ 0.623∗∗∗ 0.374∗∗∗ 0.407∗∗∗
(0.078) (0.090) (0.069) (0.091) (0.023) (0.020)Log GDP p.c. in destination 0.678∗∗∗ 0.932∗∗∗ 0.891∗∗∗ 0.600∗∗∗ 0.370∗∗∗ 0.281∗∗∗
(0.051) (0.062) (0.041) (0.062) (0.012) (0.010)Log distance −0.744∗∗∗ −0.536∗∗∗ −1.602∗∗∗−1.167∗∗∗ −0.416∗∗∗ −0.217∗∗∗
(0.021) (0.026) (0.018) (0.023) (0.009) (0.008)Common border 0.483∗∗∗ 0.459∗∗∗ 0.097 0.548∗∗∗ 0.657∗∗∗ 0.792∗∗∗
(0.034) (0.038) (0.054) (0.054) (0.056) (0.055)Common language 0.326∗∗∗ 0.331∗∗∗ 0.734∗∗∗ 0.364∗∗∗ 0.083∗∗∗ 0.004
(0.035) (0.039) (0.031) (0.043) (0.014) (0.013)Colonial ties 0.206∗∗ 0.204∗ 1.881∗∗∗ 0.893∗∗∗ 0.563∗∗∗ 0.149∗∗∗
(0.072) (0.081) (0.056) (0.079) (0.033) (0.028)RTA 0.722∗∗∗ 0.873∗∗∗ 0.045 0.254∗∗∗ 0.487∗∗∗ 0.367∗∗∗
(0.050) (0.056) (0.034) (0.043) (0.020) (0.021)
N 74,095 74,095 44,440 29,366 74,095 74,095∗ p < 0.05, ∗∗ p < 0.01, ∗∗∗ p < 0.001
Robust standard errors; Origin, destination, and time fixed effects.
Table 13: IV - First Stage
(1)Log R.E. patent stock
Log non-energy patent stock 0.208∗∗∗
Log population in patenter 0.398∗∗∗
Log population in partner −0.00882∗∗∗
Log GPD p.c. in patenter 0.878∗∗∗
Log GDP p.c. in partner −0.0244∗∗∗
Log distance −0.0681∗∗∗
Common border −0.111∗∗∗
Common language −0.153∗∗∗
Colonial ties 0.163∗∗∗
RTA 0.180∗∗∗
Constant −2.623∗∗∗
N 74,095∗ p < 0.05, ∗∗ p < 0.01, ∗∗∗ p < 0.001
43
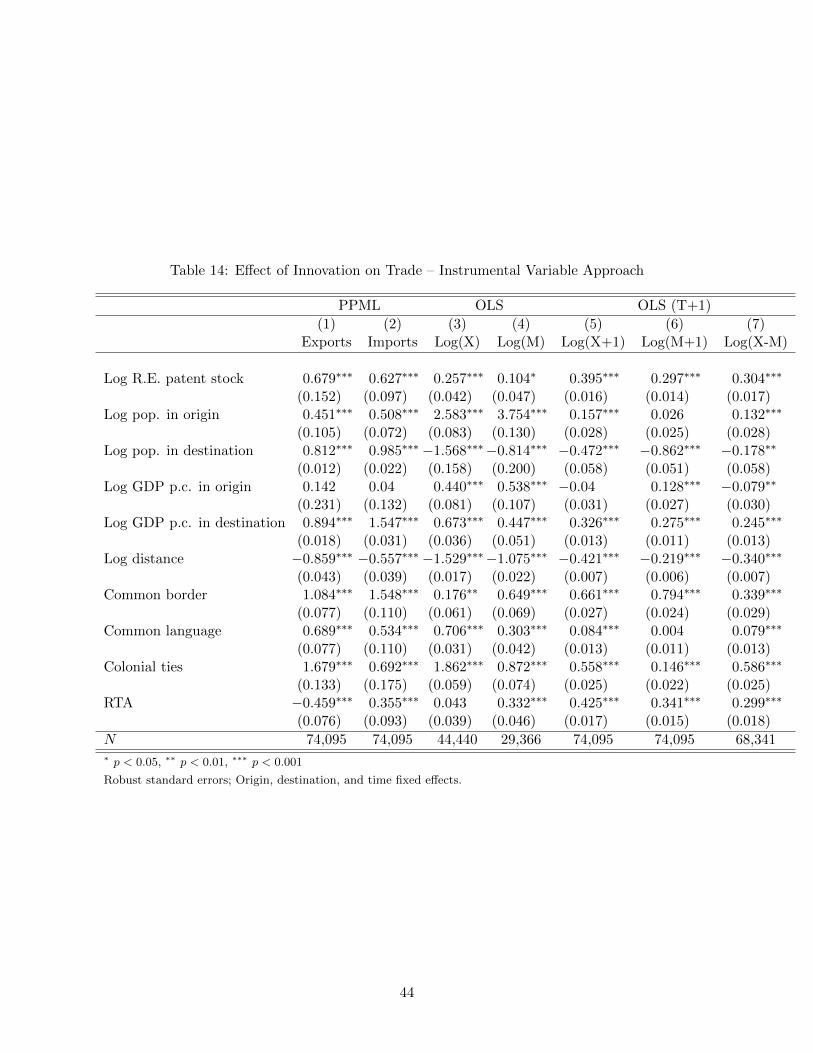
Table 14: Effect of Innovation on Trade – Instrumental Variable Approach
PPML OLS OLS (T+1)
(1) (2) (3) (4) (5) (6) (7)Exports Imports Log(X) Log(M) Log(X+1) Log(M+1) Log(X-M)
Log R.E. patent stock 0.679∗∗∗ 0.627∗∗∗ 0.257∗∗∗ 0.104∗ 0.395∗∗∗ 0.297∗∗∗ 0.304∗∗∗
(0.152) (0.097) (0.042) (0.047) (0.016) (0.014) (0.017)Log pop. in origin 0.451∗∗∗ 0.508∗∗∗ 2.583∗∗∗ 3.754∗∗∗ 0.157∗∗∗ 0.026 0.132∗∗∗
(0.105) (0.072) (0.083) (0.130) (0.028) (0.025) (0.028)Log pop. in destination 0.812∗∗∗ 0.985∗∗∗ −1.568∗∗∗−0.814∗∗∗ −0.472∗∗∗ −0.862∗∗∗ −0.178∗∗
(0.012) (0.022) (0.158) (0.200) (0.058) (0.051) (0.058)Log GDP p.c. in origin 0.142 0.04 0.440∗∗∗ 0.538∗∗∗ −0.04 0.128∗∗∗ −0.079∗∗
(0.231) (0.132) (0.081) (0.107) (0.031) (0.027) (0.030)Log GDP p.c. in destination 0.894∗∗∗ 1.547∗∗∗ 0.673∗∗∗ 0.447∗∗∗ 0.326∗∗∗ 0.275∗∗∗ 0.245∗∗∗
(0.018) (0.031) (0.036) (0.051) (0.013) (0.011) (0.013)Log distance −0.859∗∗∗ −0.557∗∗∗ −1.529∗∗∗−1.075∗∗∗ −0.421∗∗∗ −0.219∗∗∗ −0.340∗∗∗
(0.043) (0.039) (0.017) (0.022) (0.007) (0.006) (0.007)Common border 1.084∗∗∗ 1.548∗∗∗ 0.176∗∗ 0.649∗∗∗ 0.661∗∗∗ 0.794∗∗∗ 0.339∗∗∗
(0.077) (0.110) (0.061) (0.069) (0.027) (0.024) (0.029)Common language 0.689∗∗∗ 0.534∗∗∗ 0.706∗∗∗ 0.303∗∗∗ 0.084∗∗∗ 0.004 0.079∗∗∗
(0.077) (0.110) (0.031) (0.042) (0.013) (0.011) (0.013)Colonial ties 1.679∗∗∗ 0.692∗∗∗ 1.862∗∗∗ 0.872∗∗∗ 0.558∗∗∗ 0.146∗∗∗ 0.586∗∗∗
(0.133) (0.175) (0.059) (0.074) (0.025) (0.022) (0.025)RTA −0.459∗∗∗ 0.355∗∗∗ 0.043 0.332∗∗∗ 0.425∗∗∗ 0.341∗∗∗ 0.299∗∗∗
(0.076) (0.093) (0.039) (0.046) (0.017) (0.015) (0.018)
N 74,095 74,095 44,440 29,366 74,095 74,095 68,341∗ p < 0.05, ∗∗ p < 0.01, ∗∗∗ p < 0.001
Robust standard errors; Origin, destination, and time fixed effects.
44
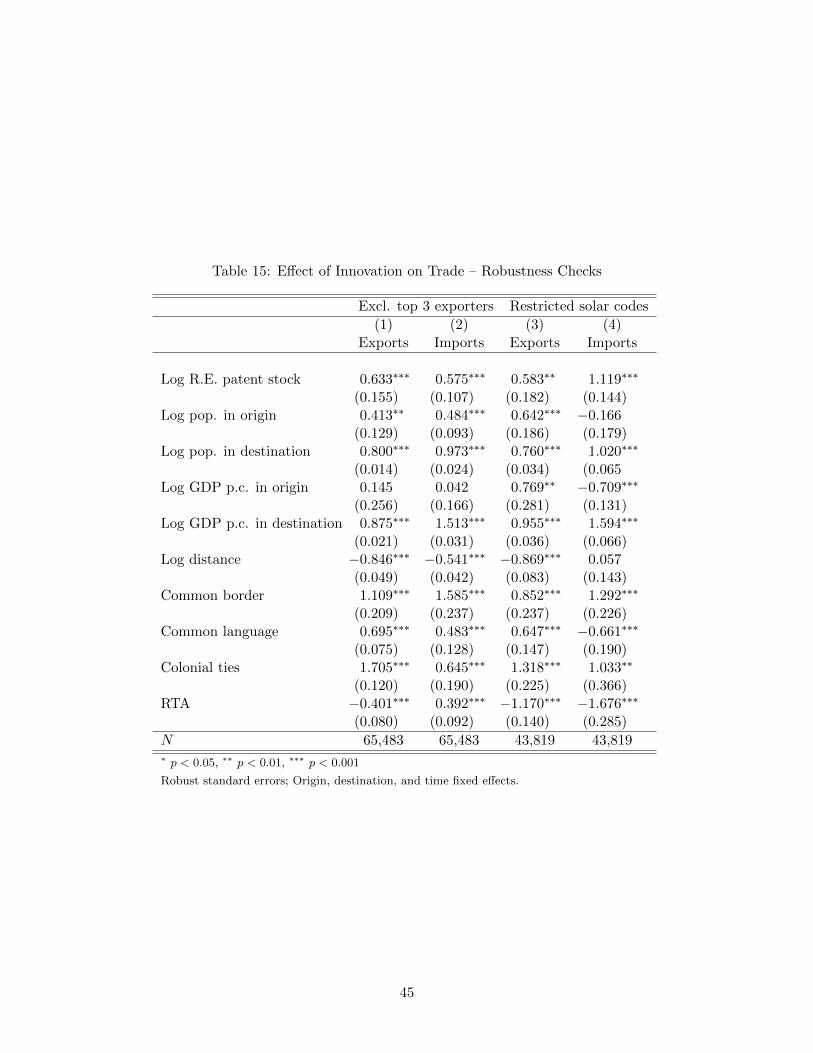
Table 15: Effect of Innovation on Trade – Robustness Checks
Excl. top 3 exporters Restricted solar codes
(1) (2) (3) (4)Exports Imports Exports Imports
Log R.E. patent stock 0.633∗∗∗ 0.575∗∗∗ 0.583∗∗ 1.119∗∗∗
(0.155) (0.107) (0.182) (0.144)Log pop. in origin 0.413∗∗ 0.484∗∗∗ 0.642∗∗∗ −0.166
(0.129) (0.093) (0.186) (0.179)Log pop. in destination 0.800∗∗∗ 0.973∗∗∗ 0.760∗∗∗ 1.020∗∗∗
(0.014) (0.024) (0.034) (0.065Log GDP p.c. in origin 0.145 0.042 0.769∗∗ −0.709∗∗∗
(0.256) (0.166) (0.281) (0.131)Log GDP p.c. in destination 0.875∗∗∗ 1.513∗∗∗ 0.955∗∗∗ 1.594∗∗∗
(0.021) (0.031) (0.036) (0.066)Log distance −0.846∗∗∗ −0.541∗∗∗ −0.869∗∗∗ 0.057
(0.049) (0.042) (0.083) (0.143)Common border 1.109∗∗∗ 1.585∗∗∗ 0.852∗∗∗ 1.292∗∗∗
(0.209) (0.237) (0.237) (0.226)Common language 0.695∗∗∗ 0.483∗∗∗ 0.647∗∗∗ −0.661∗∗∗
(0.075) (0.128) (0.147) (0.190)Colonial ties 1.705∗∗∗ 0.645∗∗∗ 1.318∗∗∗ 1.033∗∗
(0.120) (0.190) (0.225) (0.366)RTA −0.401∗∗∗ 0.392∗∗∗ −1.170∗∗∗ −1.676∗∗∗
(0.080) (0.092) (0.140) (0.285)
N 65,483 65,483 43,819 43,819∗ p < 0.05, ∗∗ p < 0.01, ∗∗∗ p < 0.001
Robust standard errors; Origin, destination, and time fixed effects.
45
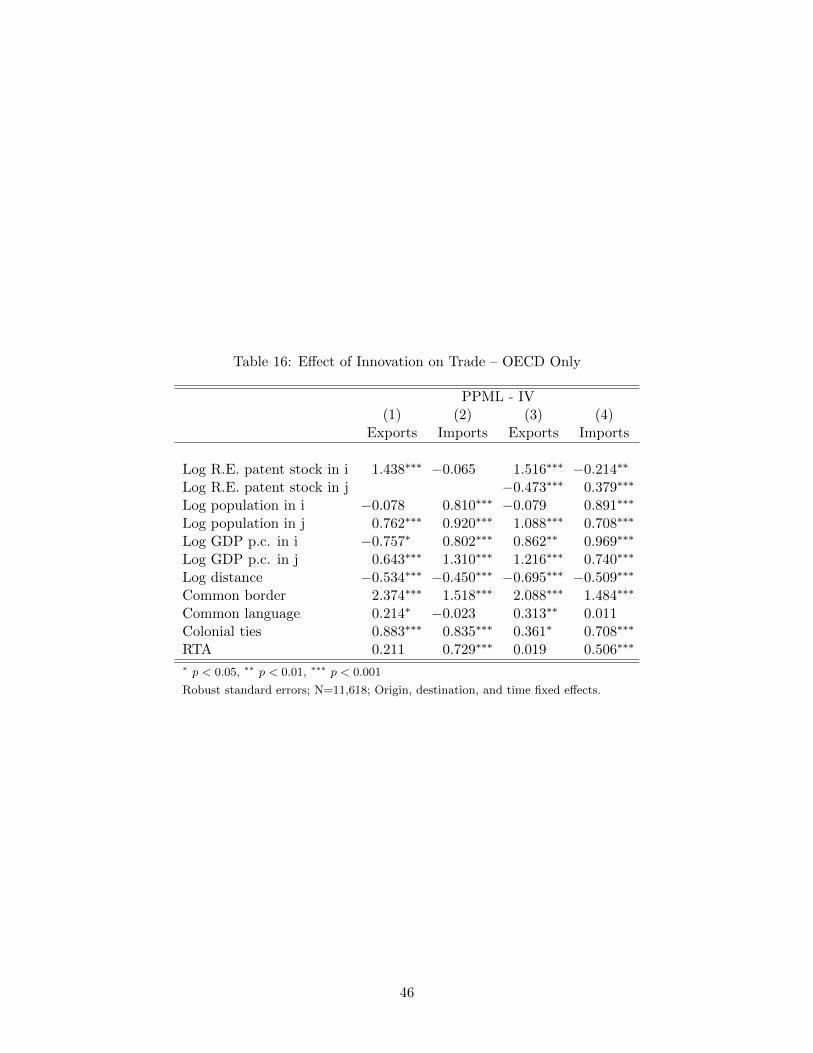
Table 16: Effect of Innovation on Trade – OECD Only
PPML - IV(1) (2) (3) (4)
Exports Imports Exports Imports
Log R.E. patent stock in i 1.438∗∗∗ −0.065 1.516∗∗∗ −0.214∗∗
Log R.E. patent stock in j −0.473∗∗∗ 0.379∗∗∗
Log population in i −0.078 0.810∗∗∗ −0.079 0.891∗∗∗
Log population in j 0.762∗∗∗ 0.920∗∗∗ 1.088∗∗∗ 0.708∗∗∗
Log GDP p.c. in i −0.757∗ 0.802∗∗∗ 0.862∗∗ 0.969∗∗∗
Log GDP p.c. in j 0.643∗∗∗ 1.310∗∗∗ 1.216∗∗∗ 0.740∗∗∗
Log distance −0.534∗∗∗ −0.450∗∗∗ −0.695∗∗∗ −0.509∗∗∗
Common border 2.374∗∗∗ 1.518∗∗∗ 2.088∗∗∗ 1.484∗∗∗
Common language 0.214∗ −0.023 0.313∗∗ 0.011Colonial ties 0.883∗∗∗ 0.835∗∗∗ 0.361∗ 0.708∗∗∗
RTA 0.211 0.729∗∗∗ 0.019 0.506∗∗∗
∗ p < 0.05, ∗∗ p < 0.01, ∗∗∗ p < 0.001
Robust standard errors; N=11,618; Origin, destination, and time fixed effects.
46
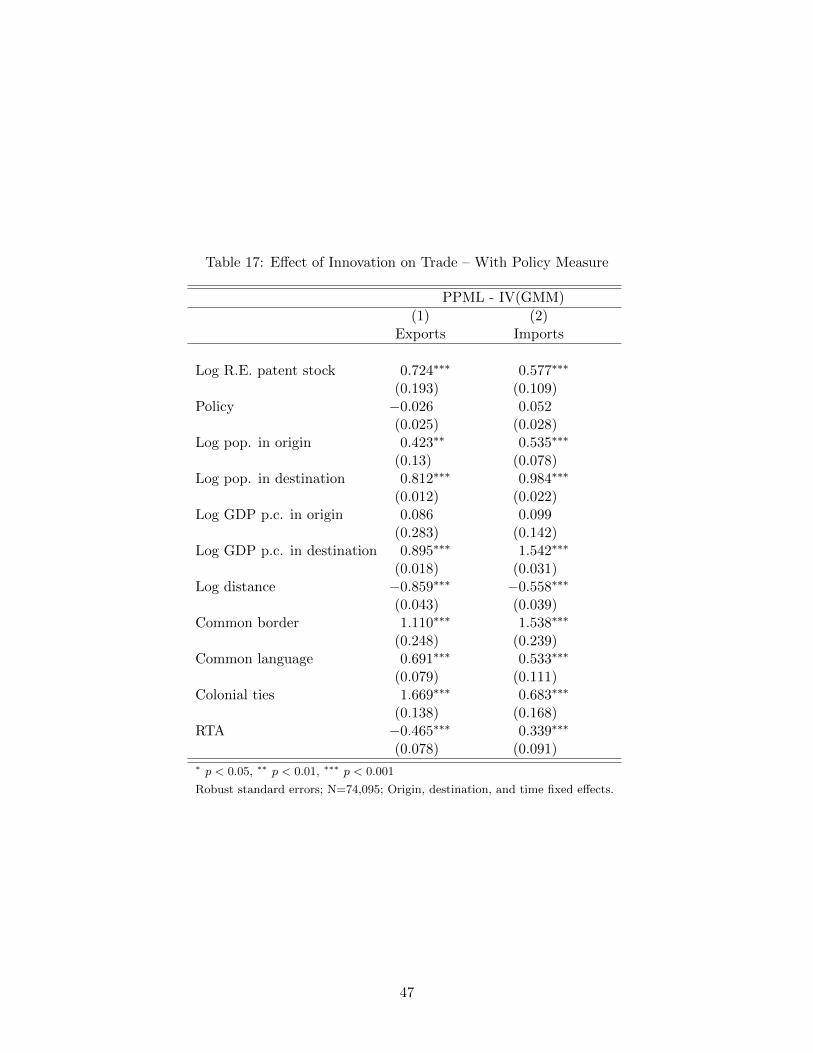
Table 17: Effect of Innovation on Trade – With Policy Measure
PPML - IV(GMM)
(1) (2)Exports Imports
Log R.E. patent stock 0.724∗∗∗ 0.577∗∗∗
(0.193) (0.109)Policy −0.026 0.052
(0.025) (0.028)Log pop. in origin 0.423∗∗ 0.535∗∗∗
(0.13) (0.078)Log pop. in destination 0.812∗∗∗ 0.984∗∗∗
(0.012) (0.022)Log GDP p.c. in origin 0.086 0.099
(0.283) (0.142)Log GDP p.c. in destination 0.895∗∗∗ 1.542∗∗∗
(0.018) (0.031)Log distance −0.859∗∗∗ −0.558∗∗∗
(0.043) (0.039)Common border 1.110∗∗∗ 1.538∗∗∗
(0.248) (0.239)Common language 0.691∗∗∗ 0.533∗∗∗
(0.079) (0.111)Colonial ties 1.669∗∗∗ 0.683∗∗∗
(0.138) (0.168)RTA −0.465∗∗∗ 0.339∗∗∗
(0.078) (0.091)∗ p < 0.05, ∗∗ p < 0.01, ∗∗∗ p < 0.001
Robust standard errors; N=74,095; Origin, destination, and time fixed effects.
47