Embed Size (px)
Citation preview

3rd International Workshop on Measurement and Metrics for Green ans Sustainable Software Systems (MeGSuS’16)
GREEN INDEXES USED IN CAST TO MEASURE
THE ENERGY CONSUMPTION IN CODEMarco Bessi
Solution delivery consultant @ CAST
September 7th, 2016

3rd International Workshop on Measurement and Metrics for Green ans Sustainable Software Systems (MeGSuS’16) 1
Marco Bessi
Solution delivery consultant
CAST green evangelist
Computer science PhD on software energy
efficiency estimation and optimization through
Java bytecode reengineering
Collaborations with:

3rd International Workshop on Measurement and Metrics for Green ans Sustainable Software Systems (MeGSuS’16)
GREEN ICT FOR A SUSTAINABLE WORLD

3rd International Workshop on Measurement and Metrics for Green ans Sustainable Software Systems (MeGSuS’16)
Introduction
Gartner [1] said that 2% of total CO2 emissions is related to ICT
Energy in Datacenter [2]:
[1] Gartner Symposium/ITxpo, 2007.
[2] S.Pelley, D.Meisner, T.F.Wenisch, and J.W.VanGilder. Understanding and abstracting total datacenter power. In WEED2009.
3
56% server
30% cooling
14% others
(network, light, ...)

3rd International Workshop on Measurement and Metrics for Green ans Sustainable Software Systems (MeGSuS’16) 4
Introduction
In the last 10 years, IT systems become bigger and bigger, with a consequent growth of
the IT energy consumptions
Energy costs have dramatically increased
Energy requirements represent one of the scalability issues of datacenters
IT contributes strongly to the CO2 emissions
1
2
3

3rd International Workshop on Measurement and Metrics for Green ans Sustainable Software Systems (MeGSuS’16)
Energy efficiency of Datacenters
Servers are rarely idle or working at full capacity [3]
– Most of the time are between 10-50%
– Idle or low capacity is a waste of energy
[3] Luiz André Barroso and Urs Holzle. The case for energy-proportional computing. Computer, 40, 2007.
0
10
20
30
40
50
60
70
80
90
100
0% 10% 20% 30% 40% 50% 60% 70% 80% 90% 100%
Serv
er
po
wer
usag
e p
erc
en
tag
e
CPU utilization
PERCENTAGE OF POWER PEAK USAGE
Power
Energy efficiency
0
0,02
0,04
0,06
0,08
0,1
0,12
0%
5%
10%
15%
20%
25%
30%
35%
40%
45%
50%
55%
60%
65%
70%
75%
80%
85%
90%
95%
100
%
Tim
e P
erc
en
tag
e
CPU Utilization
TYPICAL SERVER CPU UTILIZATION
5

3rd International Workshop on Measurement and Metrics for Green ans Sustainable Software Systems (MeGSuS’16)
Device choice Software
optimization &
power
mngt
Green computing
San Murugesan [4] define the «Green computing» as:
«the study and practice of designing, manufacturing, using, and disposing of computers,
servers, and associated subsystems efficiently and effectively with minimal or no impact
on the environment»
[4] San Murugesan. Harnessing green it: Principles and practices. IT professional, 2008.
6

3rd International Workshop on Measurement and Metrics for Green ans Sustainable Software Systems (MeGSuS’16)
Green computing
[4] San Murugesan. Harnessing green it: Principles and practices. IT professional, 2008.
7
Hardware
Energy consumption
Software

3rd International Workshop on Measurement and Metrics for Green ans Sustainable Software Systems (MeGSuS’16) 8
Select the right «path»: the automotive analogy.
Fixed the car, and then its unit
consumption (litres/km)
Fixed two point A and B
Select the right path!
A
B
Fixed the server tha run your
application
Fixed the functional behavior
Wrote the most efficient algorithm

3rd International Workshop on Measurement and Metrics for Green ans Sustainable Software Systems (MeGSuS’16)
Choosing a «good» software enables energy savings
INFRASTRUCTURE
Energy Overhead on
Datacenters
PUE(Power Usage Effectiveness)= ൗTotalPowerITPower
Infrastructure amplifies server efficiency and inefficiency by a factor
equal to the PUE (Italy best-in-class = 1.2; Italy mean = 1.8)
SOFTWARE
Guides the Energy
Consumption of the
Servers
APR(ApplicationPowerRatio)= ൗServerPowerServerIdle
Applications that satisfies the same functional requirements may
consume significantly different amounts of energy (on average 30%)
(CPU intensive = 1.7; Transactional application = 1.4)
100140
252
Idle Server total Total DC
Un-efficient software
100128
230
Idle Server total Total DC
APR optimized
40
112
22
APR = 1,4 APR – 30%
28
PUE = 1,8
94
PUE = 1,8
9

3rd International Workshop on Measurement and Metrics for Green ans Sustainable Software Systems (MeGSuS’16)
Know your enemy
10
86% 80%
It is hardly impossible to optimize what it is NOT monitored
NOT
companiesICT departments
NOT
[5] T. Restorick. “An inefficient truth”. Global Action Plan, 2007.

3rd International Workshop on Measurement and Metrics for Green ans Sustainable Software Systems (MeGSuS’16)
CAST

3rd International Workshop on Measurement and Metrics for Green ans Sustainable Software Systems (MeGSuS’16)
CAST company overview
CAST is an independent software vendor that is a pioneer and world
leader in Software Analysis and Measurement (SAM)
Founded in 1990, CAST is listed on Euronext (CAS.PA) and serves
IT-intensive Global 2000 enterprises and public sector institutions
worldwide. CAST has a presence in the Americas, EMEA, and India.
CAST introduces fact-based transparency into software asset
management, application development, maintenance and sourcing to
transform it into a management discipline.
SAM
1990
FACT
BASED
Our mission is to provide a standard unit of measure for those who build, buy or sell
software
Measure what can be measured, and make measurable what cannot be measured.Galileo Galilei (1564-1642)
12

3rd International Workshop on Measurement and Metrics for Green ans Sustainable Software Systems (MeGSuS’16)
CAST and its ecosystem
13
250+ ENTERPRISE CUSTOMERS
COUNT ON CAST GLOBAL SYSTEM INTEGRATORS
RELY ON CAST
GLOBAL PRESENCE
USA, Germany, UK, France,
Belgium, Italy, Spain, India
MARKET LEADER, PURE
PLAYER, GLOBAL
NYSE Euronext
THE UNIT OF MEASURE FOR
THOSE WHO BUILD, BUY OR
SELL SOFTWARE

3rd International Workshop on Measurement and Metrics for Green ans Sustainable Software Systems (MeGSuS’16)
Enterprise-grade analysis requires a 3-tier approachA
rch
ite
ctu
re C
om
pli
an
ce
Intra-technology architecture
Intra-layer dependencies
Module complexity & cohesion
Design & structure
Inter-program invocation
Security Vulnerabilities
Module Level
Integration quality
Architectural compliance
Risk propagation
simulation
Application security
Resiliency checks
Transaction integrity
Function point & EFP
measurement
Effort estimation
Data access control
SDK versioning
Calibration across
technologies
System Level
Data FlowTransaction Risk
Code style & layout
Expression complexity
Code documentation
Class or program design
Basic coding standards
Program Level
Propagation Risk
Java
JSP
EJB
PL/SQ
L
ASP.NET
Oracle
SQL
Server
DB2
T/SQL
Hibernate
Spring
Struts.NET
C#VB
COBOL
C++
COBOL
Sybase IMS
Messaging
JavaWeb
Services
APIs
1
2
3
14
3rd International Workshop on Measurement and Metrics for Green ans Sustainable Software Systems (MeGSuS’16)
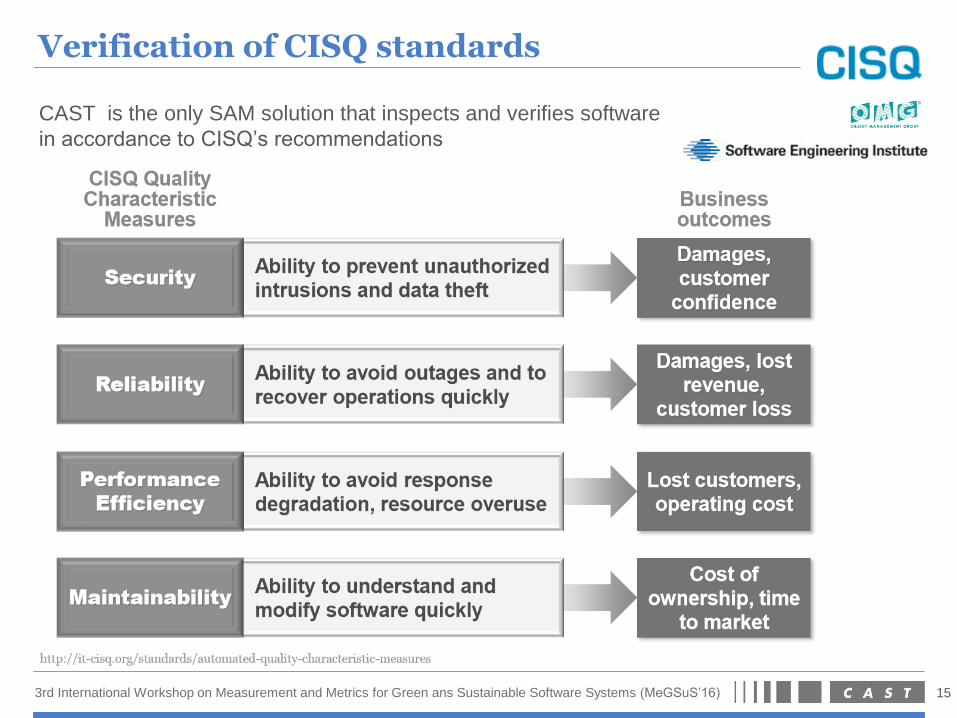
Verification of CISQ standards
CAST is the only SAM solution that inspects and verifies software
in accordance to CISQ’s recommendations
15

3rd International Workshop on Measurement and Metrics for Green ans Sustainable Software Systems (MeGSuS’16)
CISQ focuses on the software flaws that matter
Software Risk Prevention:
Focus on critical violations that matter
Focus resources on areas of highest
impact not highest number of flags
“Tracking programming practices at the
Unit Level alone may not translate into the
anticipated business impact,…most
devastating defects can only be detected at
the System Level.”
- OMG
16

3rd International Workshop on Measurement and Metrics for Green ans Sustainable Software Systems (MeGSuS’16) 17
CAST Application Intelligence Platform (AIP)
Deep Insight into Critical Applications:
2. Best practices & industry Standards Checks
Architectural integrity and critical violations
3. Accurate Analytics & Benchmarks
1. System-Level* Analysis
Source code, transactions, data
structure
LOGIC
DATA ACCESS
APP ENGINEERING DASHBOARD
Critical Structural Flaws, Action Plans and eLearning
APP ANALYTICS DASHBOARD
Business relevant Analytics
* “Architectural software flaws lead to
90% of the production issues.”
Dr. R. Soley, OMG/ PhD MIT

3rd International Workshop on Measurement and Metrics for Green ans Sustainable Software Systems (MeGSuS’16)
Risk analytics, a management scorecard
Portfolio-level risk and
saving opportunities
Likelihood of outage,
data integrity or
reliability issues
Resource consumption,
scalability and
performance issues
Security issues and high
likelihood of breaches
Adaptability to
changing regulations
and business needs
Ramp up difficulties
for newcomers
Standardized units of ADM work with consistent
technical and functional sizing for productivity
measurement
Cost to restore
applications back
to healthy state
Hard-to-find structural
flaws that may lead to
software catastrophes
18

3rd International Workshop on Measurement and Metrics for Green ans Sustainable Software Systems (MeGSuS’16) 19
Metric calculation
For each rule a grade is computed.
The grade is between [1,4], where 1 represent the very high risk and 4 the low risk.
– Below 3, risks and costs increase.
Each rule has different thresholds accordingly to its risk importance

3rd International Workshop on Measurement and Metrics for Green ans Sustainable Software Systems (MeGSuS’16) 20
Quality Model, a key for unbiased measurement
Transferability
Changeability
Robustness
Efficiency
Size
Naming
Conventions
Documentation
Architecture
Complexity
Package naming
Class naming
Interface naming
Package comment
Class comment
Method comment
Package size
Class size (methods)
Interface size
Class complexity (Inh. depth)
Class complexity (Inh. width)
Artifacts having recursive calls
Method complexity (control flow)
Maintainability
Security
Programming
Practices
File conformity
Dead code
Controled data access
Structuredness
Modularity
Encapsulation conformity
Empty code
Inheritance
Risk drivers
Cost drivers
150
0+
arc
hit
ectu
ral a
nd
la
ng
uage-s
pec
ific
cod
e ch
eck
s
Health FactorsCriteriaQuality Metrics Subset Application Quality
Multiple artifacts inserting data on the same SQL table
Coupling Distribution
SQL Complexity Distribution
Green IT Index

3rd International Workshop on Measurement and Metrics for Green ans Sustainable Software Systems (MeGSuS’16)
CAST GREEN IT INDEX

3rd International Workshop on Measurement and Metrics for Green ans Sustainable Software Systems (MeGSuS’16)
The problem is simple, the solution is less so
CAST has developed a four-pronged approach to guiding action based on simple
components
– Efficiency in operations – do the most with the least effort
– Complexity – Simple tends to take less time, less power, less support
– Programming – make the right choices
– Security – Prevent intrusion
CAST
Complexity
Programming Security
Energy can be saved by making software more efficient
Efficiency
22

3rd International Workshop on Measurement and Metrics for Green ans Sustainable Software Systems (MeGSuS’16)
The problem is simple, the solution is less so
Lack of EFFICIENCY in IT operations waste energy
– Unnecessary CPU cycles means unnecessary kWh consumption
– IT operations run on electricity
– kWh production leads to CO2 emission (or equivalent)
Efficiency
23

3rd International Workshop on Measurement and Metrics for Green ans Sustainable Software Systems (MeGSuS’16)
The problem is simple, the solution is less so
COMPLEXITY adds time, consumes power and delivers dubious improvements
EfficiencyEfficiency Complexity
24

3rd International Workshop on Measurement and Metrics for Green ans Sustainable Software Systems (MeGSuS’16)
The problem is simple, the solution is less so
PROGRAMMING makes it so
– People have been used to ever-growing computing resources, omitting the impact on
the environment through the energy consumption
• Resulting in software that is far from optimized
EfficiencyEfficiency Complexity
Programming
25

3rd International Workshop on Measurement and Metrics for Green ans Sustainable Software Systems (MeGSuS’16)
The problem is simple, the solution is less so
SECURITY should be a pervasive thought in all
EfficiencyEfficiency Complexity
Programming Security
26

3rd International Workshop on Measurement and Metrics for Green ans Sustainable Software Systems (MeGSuS’16)
How CAST support energy efficient software
CAST offers a solution based on his Assessment Model
– The Green IT Index is a Business Criterion that aggregates Quality
Rules from existing high-impact Efficiency-related Technical Criteria
– as well as from most-severe Robustness-related Technical Criteria to
account for wasted resources when application functioning has been
compromised and require a restart/recovery
CAST released this first version of this Green IT Index to leverage the
expertise and experience of select customers in order to fine-tune its
exact composition. Our experience has shown that it is more relevant
than ever.
CAST can show how to make software more efficienct and save both
“Green” and ($) “Green”
27

3rd International Workshop on Measurement and Metrics for Green ans Sustainable Software Systems (MeGSuS’16)
Energy can be saved with software more efficient
CAST support energy efficient software to identify pieces of software that could be optimized to require less CPU resources.
But:
– This is NOT about software pieces that require a lot of CPU resources
– This is about software pieces that WASTE a lot CPU resources
28
Many other factors intervene in Software energy consumption
Current indicator only covers the aspects that can be solved by evolving the
Software code
It excludes Software design, deployment, …
This indicator does not try to provide a CO2eq
CO2eq kWh is still a disputed and volatile ratio
E.g.: 0.09 kg CO2eq French kWh / 0.46 kq CO2eq European kWh / …
CPU cycle kWh is a volatile ratio
E.g.: running Unix environment on a z/Architecture / on IA-32 / on IA-64…

3rd International Workshop on Measurement and Metrics for Green ans Sustainable Software Systems (MeGSuS’16) 29
AAD Demo: Green IT Index
http://demo-eu.castsoftware.com/AAD/

3rd International Workshop on Measurement and Metrics for Green ans Sustainable Software Systems (MeGSuS’16) 30
Green IT Index detail
Select the application that you want to investigate

3rd International Workshop on Measurement and Metrics for Green ans Sustainable Software Systems (MeGSuS’16)
Green IT Index detail
Investigate which rules impact the Green IT Index
31
3rd International Workshop on Measurement and Metrics for Green ans Sustainable Software Systems (MeGSuS’16)
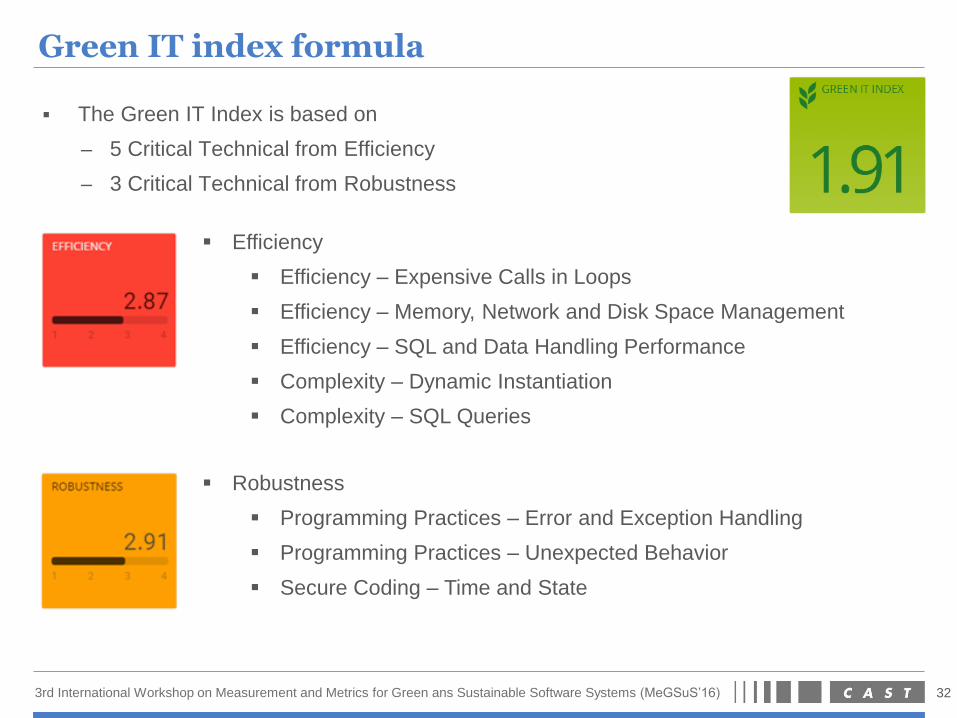
Green IT index formula
The Green IT Index is based on
– 5 Critical Technical from Efficiency
– 3 Critical Technical from Robustness
32
Efficiency
Efficiency – Expensive Calls in Loops
Efficiency – Memory, Network and Disk Space Management
Efficiency – SQL and Data Handling Performance
Complexity – Dynamic Instantiation
Complexity – SQL Queries
Robustness
Programming Practices – Error and Exception Handling
Programming Practices – Unexpected Behavior
Secure Coding – Time and State
3rd International Workshop on Measurement and Metrics for Green ans Sustainable Software Systems (MeGSuS’16)
Questions
Marco Bessi
Solution Delivery Consultant
CAST Italia
Via San Vittore 49
20123 Milano (Italy)
CAST wants to continue to investigate into this approach.
You want to share your experience?