Embed Size (px)
Citation preview
Green Harbor River Project
Holly Williams
Independent Study
Whitman-Hanson Regional High School
May 2008
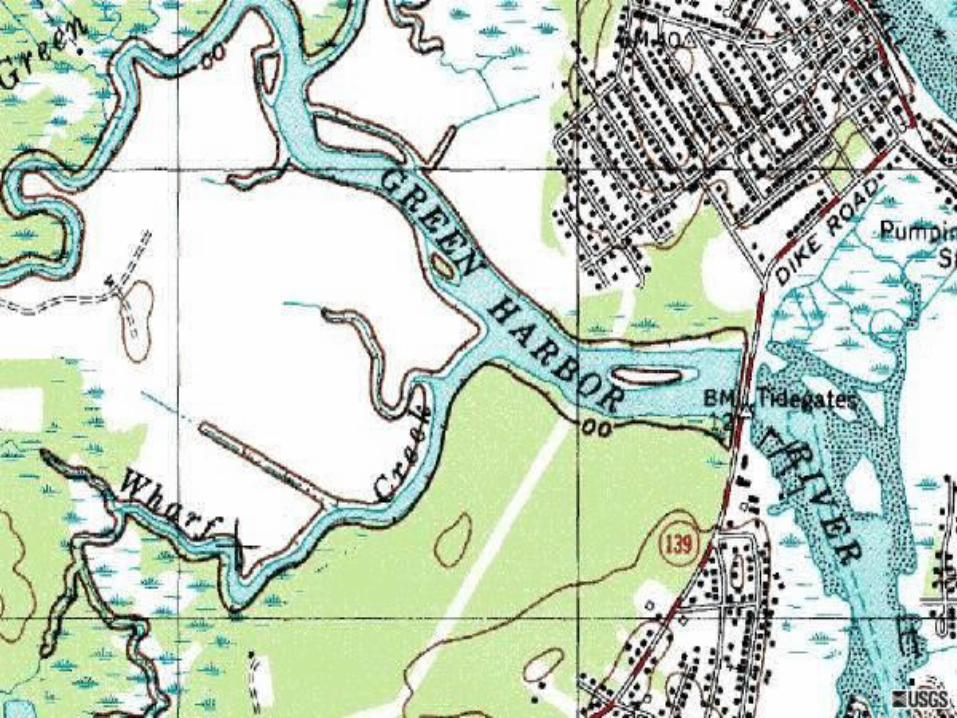
The Green Harbor River is currently being studied to see how the tidal restriction affects the ecosystem. It is important to keep our rivers clean. You can help us out and take part in a great effort to protect our local areas.
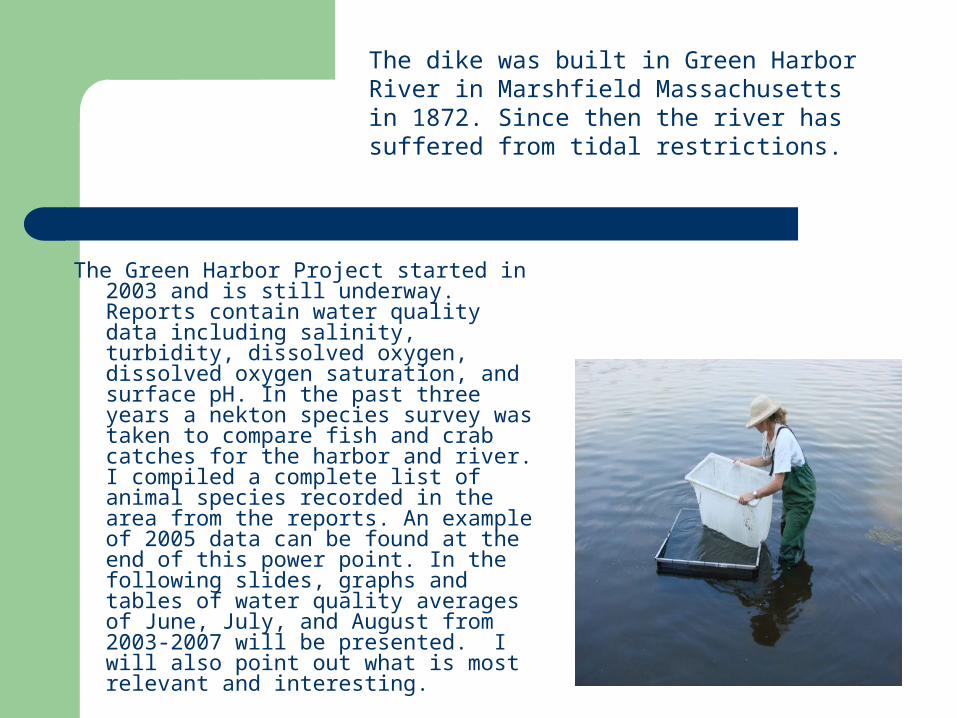
The Green Harbor Project started in 2003 and is still underway. Reports contain water quality data including salinity, turbidity, dissolved oxygen, dissolved oxygen saturation, and surface pH. In the past three years a nekton species survey was taken to compare fish and crab catches for the harbor and river. I compiled a complete list of animal species recorded in the area from the reports. An example of 2005 data can be found at the end of this power point. In the following slides, graphs and tables of water quality averages of June, July, and August from 2003-2007 will be presented. I will also point out what is most relevant and interesting.
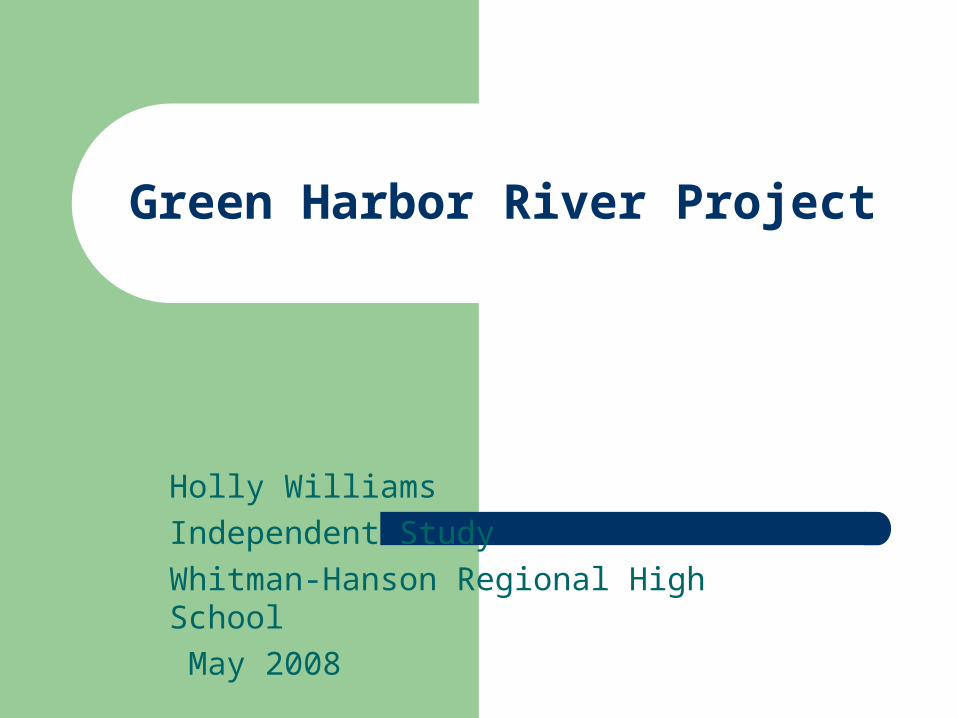
The dike was built in Green Harbor River in Marshfield Massachusetts in 1872. Since then the river has suffered from tidal restrictions.
What are these graphs and tables for?
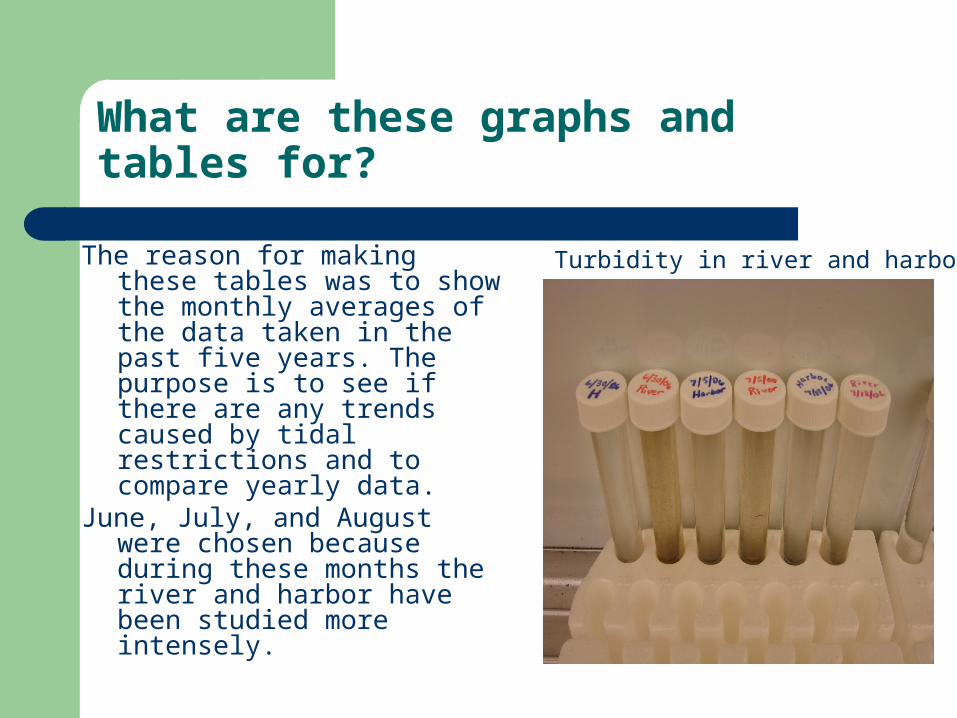
The reason for making these tables was to show the monthly averages of the data taken in the past five years. The purpose is to see if there are any trends caused by tidal restrictions and to compare yearly data.
June, July, and August were chosen because during these months the river and harbor have been studied more intensely.
Turbidity in river and harbor
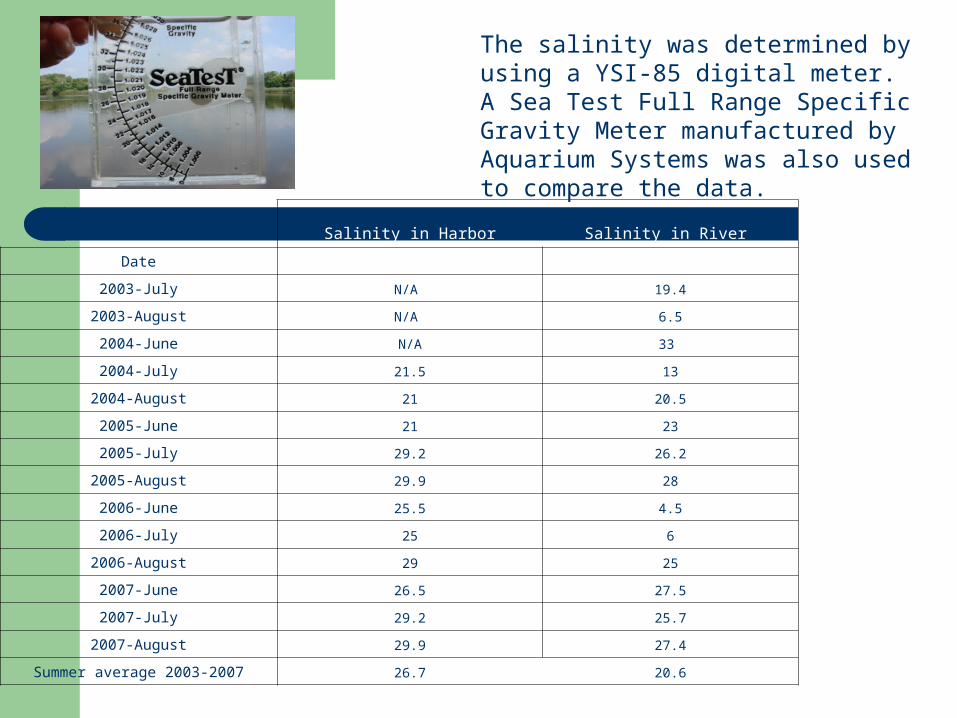
Salinity in Harbor Salinity in River
Date
2003-July N/A 19.4
2003-August N/A 6.5
2004-June N/A 33
2004-July 21.5 13
2004-August 21 20.5
2005-June 21 23
2005-July 29.2 26.2
2005-August 29.9 28
2006-June 25.5 4.5
2006-July 25 6
2006-August 29 25
2007-June 26.5 27.5
2007-July 29.2 25.7
2007-August 29.9 27.4
Summer average 2003-2007 26.7 20.6
The salinity was determined by using a YSI-85 digital meter. A Sea Test Full Range Specific Gravity Meter manufactured by Aquarium Systems was also used to compare the data.
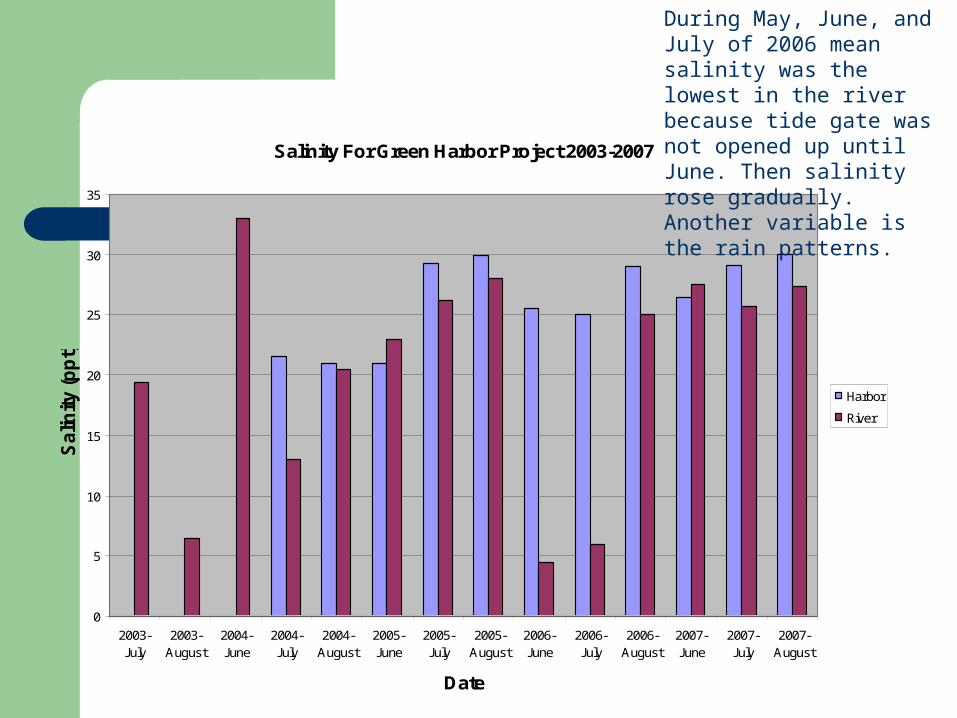
Salinity For Green Harbor Project 2003-2007
0
5
10
15
20
25
30
35
2003-July
2003-August
2004-June
2004-July
2004-August
2005-June
2005-July
2005-August
2006-June
2006-July
2006-August
2007-June
2007-July
2007-August
Date
Salin
ity (p
pt)
Harbor
River
During May, June, and July of 2006 mean salinity was the lowest in the river because tide gate was not opened up until June. Then salinity rose gradually. Another variable is the rain patterns.
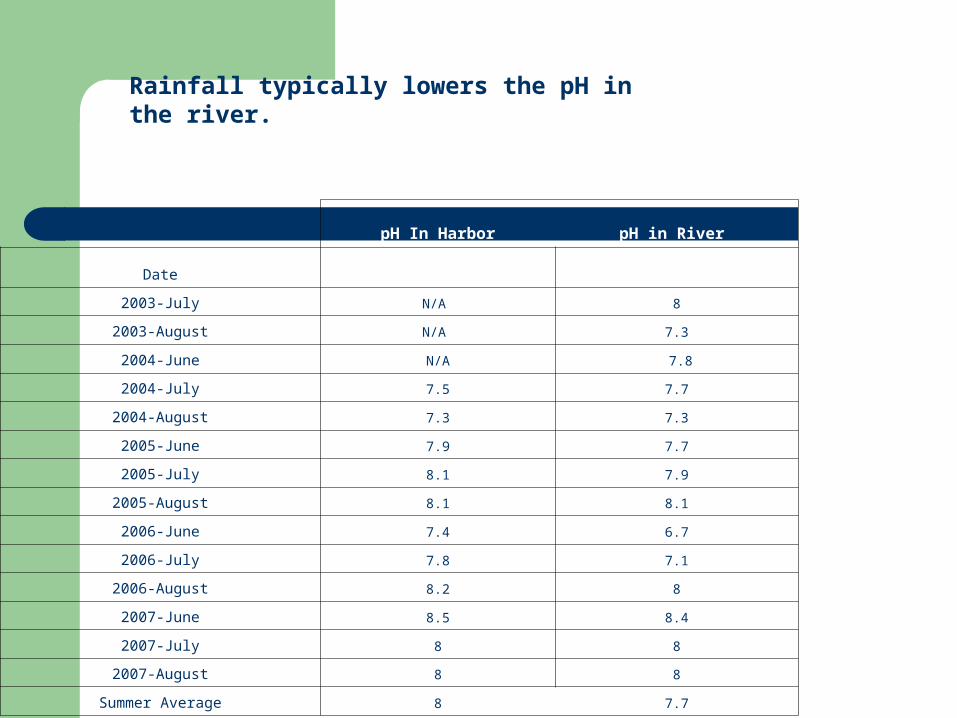
pH In Harbor pH in River
Date
2003-July N/A 8
2003-August N/A 7.3
2004-June N/A 7.8
2004-July 7.5 7.7
2004-August 7.3 7.3
2005-June 7.9 7.7
2005-July 8.1 7.9
2005-August 8.1 8.1
2006-June 7.4 6.7
2006-July 7.8 7.1
2006-August 8.2 8
2007-June 8.5 8.4
2007-July 8 8
2007-August 8 8
Summer Average 8 7.7
Rainfall typically lowers the pH in the river.
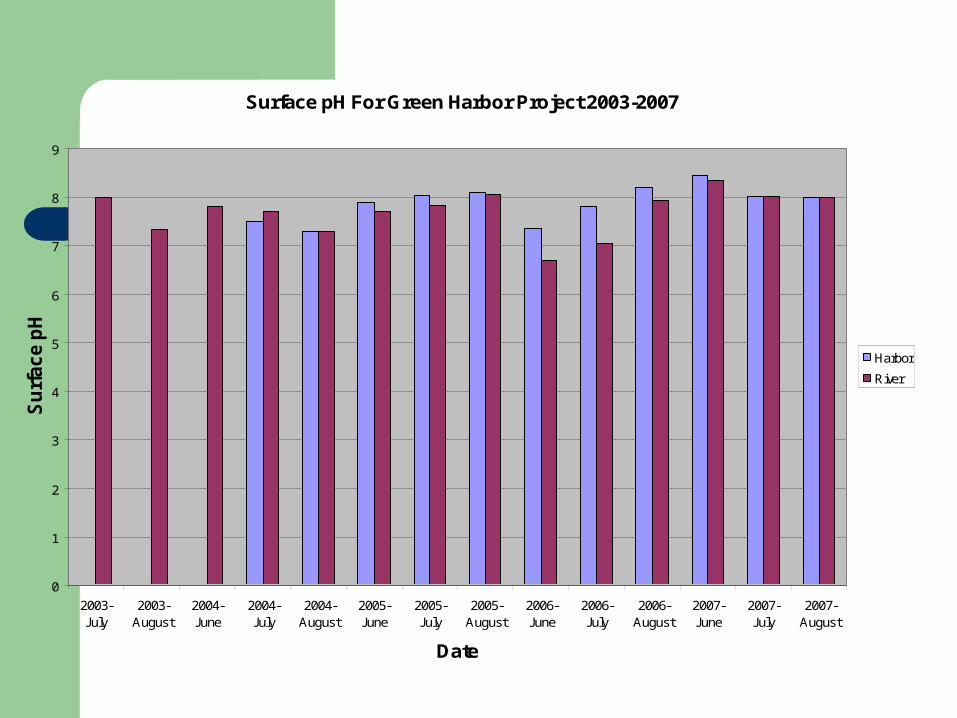
Surface pH For Green Harbor Project 2003-2007
0
1
2
3
4
5
6
7
8
9
2003-July
2003-August
2004-June
2004-July
2004-August
2005-June
2005-July
2005-August
2006-June
2006-July
2006-August
2007-June
2007-July
2007-August
Date
Su
rface p
H
Harbor
River
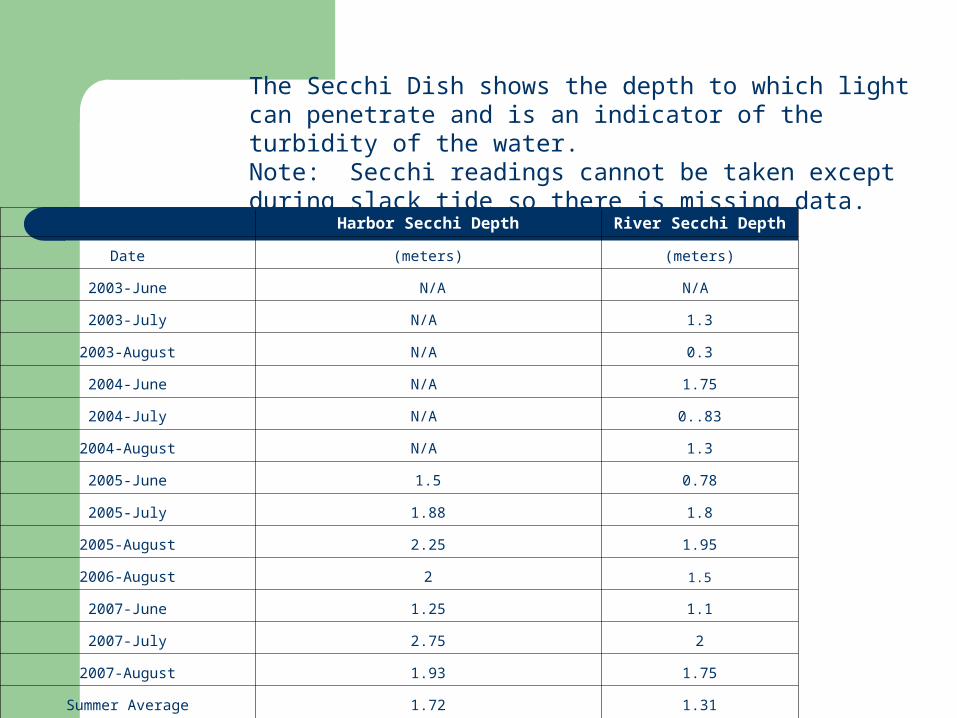
Harbor Secchi Depth River Secchi Depth
Date (meters) (meters)
2003-June N/A N/A
2003-July N/A 1.3
2003-August N/A 0.3
2004-June N/A 1.75
2004-July N/A 0..83
2004-August N/A 1.3
2005-June 1.5 0.78
2005-July 1.88 1.8
2005-August 2.25 1.95
2006-August 2 1.5
2007-June 1.25 1.1
2007-July 2.75 2
2007-August 1.93 1.75
Summer Average 1.72 1.31
The Secchi Dish shows the depth to which light can penetrate and is an indicator of the turbidity of the water. Note: Secchi readings cannot be taken except during slack tide so there is missing data.
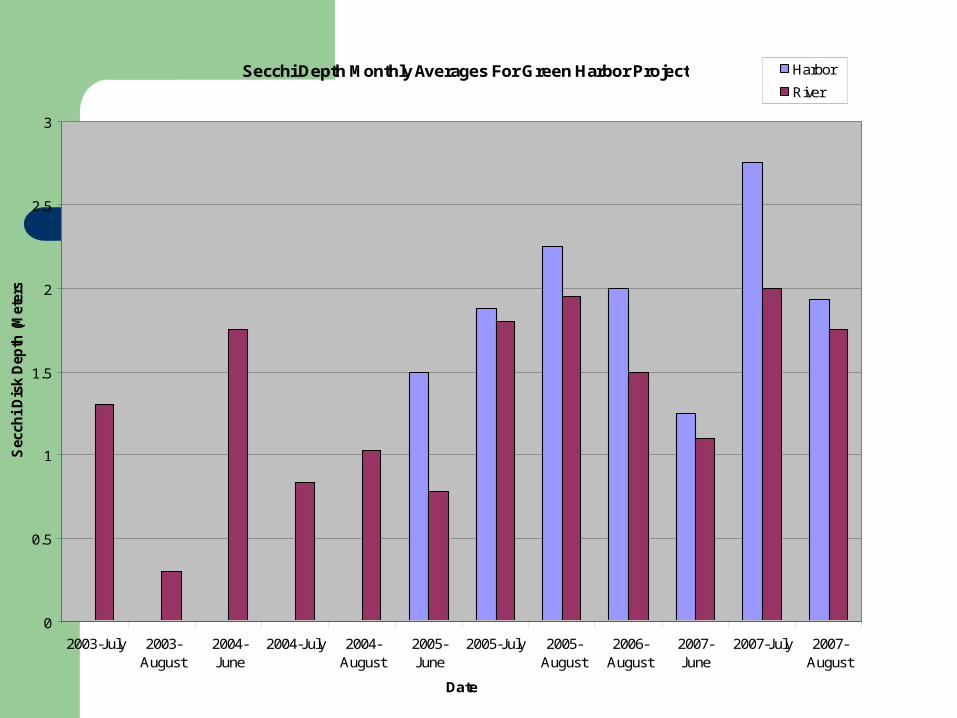
Secchi Depth Monthly Averages For Green Harbor Project
0
0.5
1
1.5
2
2.5
3
2003-July 2003-August
2004-June
2004-July 2004-August
2005-June
2005-July 2005-August
2006-August
2007-June
2007-July 2007-August
Date
Sec
chi
Dis
k D
epth
(M
eter
s)
Harbor
River
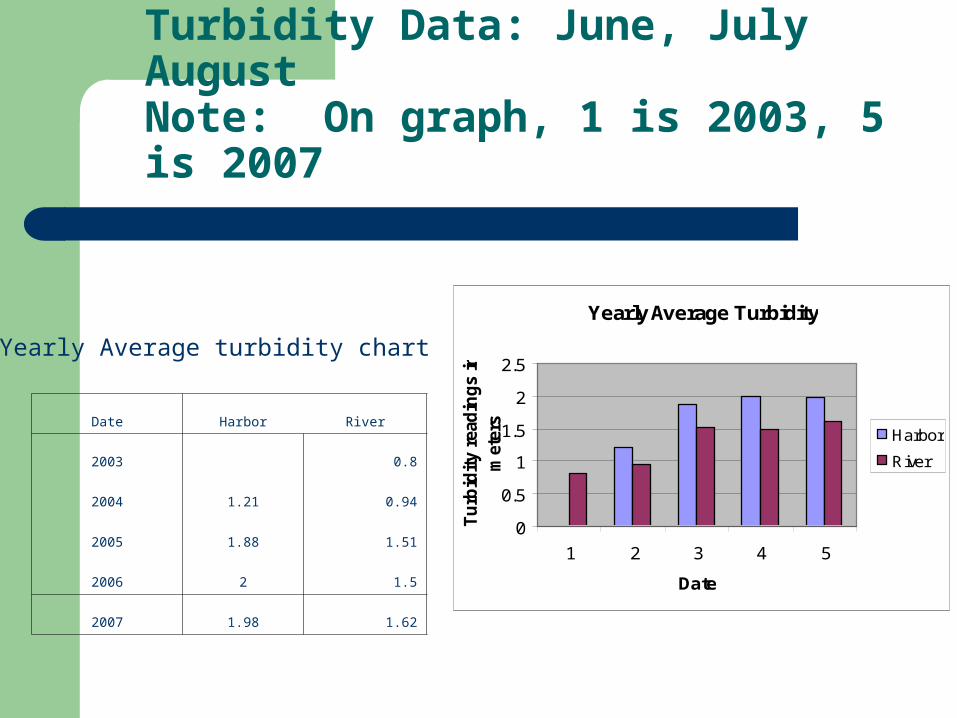
Turbidity Data: June, July AugustNote: On graph, 1 is 2003, 5 is 2007
Date Harbor River
2003 0.8
2004 1.21 0.94
2005 1.88 1.51
2006 2 1.5
2007 1.98 1.62
Yearly Average Turbidity
0
0.5
1
1.5
2
2.5
1 2 3 4 5
Date
Tu
rbid
ity
read
ing
s in
m
eter
s
Harbor
River
Yearly Average turbidity chart
Analyzing Turbidity.
It is no surprise that in 2003 and 2004 the river was extremely turbid. During June, July, and August the tide gates were barely open. The river bottom is very muddy. Any disturbance to the mud such as rain or water flow disrupts the water making it dirtier. The river often looks like a brown coffee color. At times, after rain or when the gates are closed, you can see two to three meters down in the harbor. The harbor consistently has clearer water.
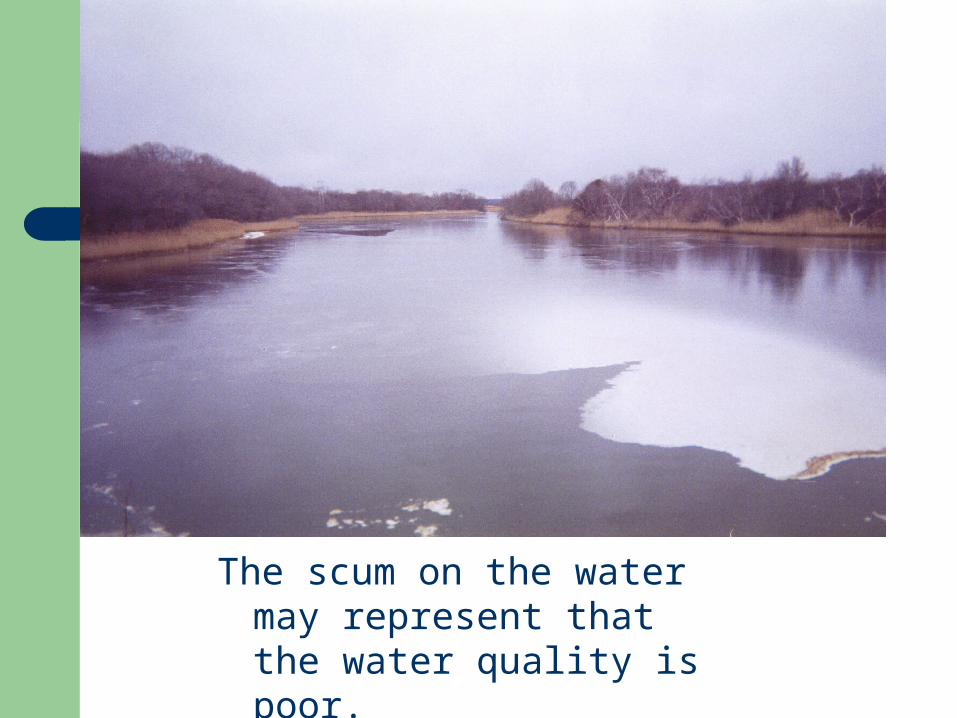
The scum on the water may represent that the water quality is poor.
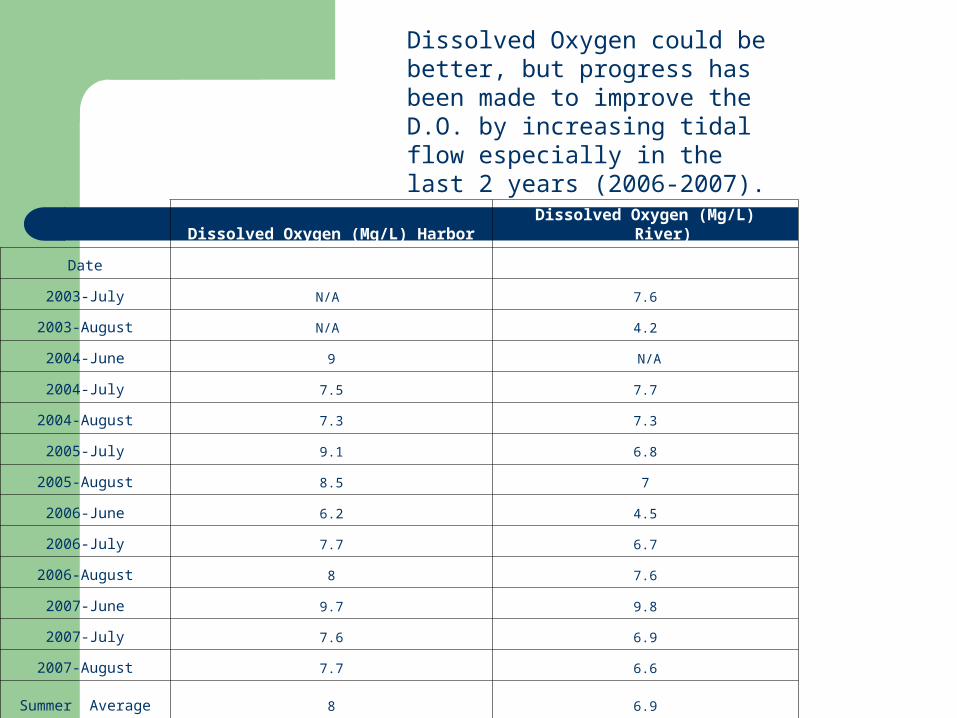
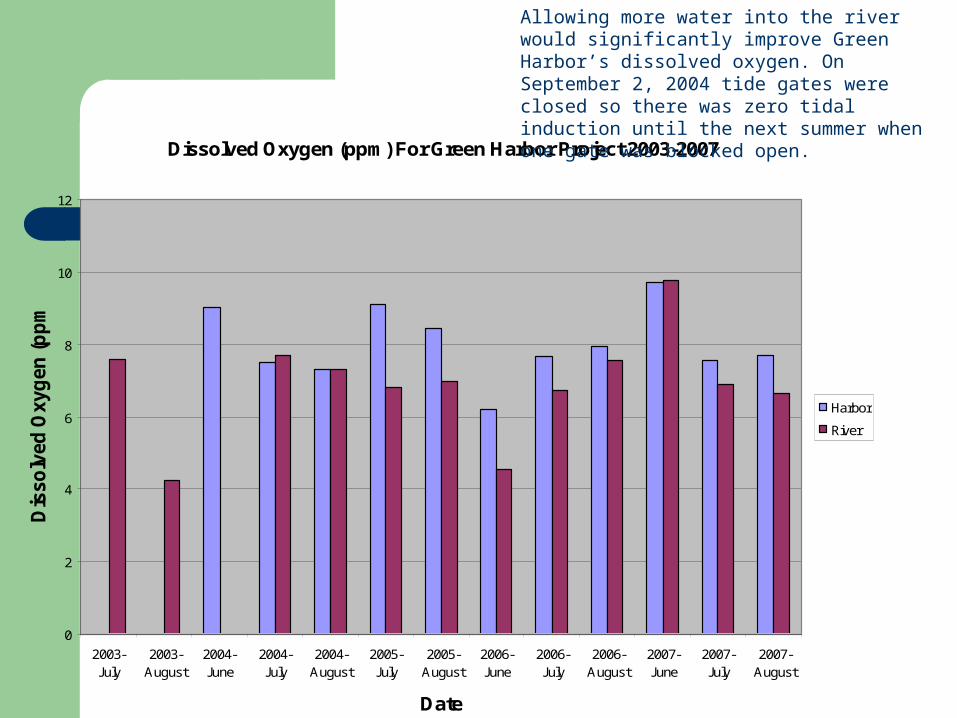
Dissolved Oxygen (Mg/L) Harbor Dissolved Oxygen (Mg/L) River)
Date
2003-July N/A 7.6
2003-August N/A 4.2
2004-June 9 N/A
2004-July 7.5 7.7
2004-August 7.3 7.3
2005-July 9.1 6.8
2005-August 8.5 7
2006-June 6.2 4.5
2006-July 7.7 6.7
2006-August 8 7.6
2007-June 9.7 9.8
2007-July 7.6 6.9
2007-August 7.7 6.6
Summer Average 8 6.9
Dissolved Oxygen could be better, but progress has been made to improve the D.O. by increasing tidal flow especially in the last 2 years (2006-2007).
Dissolved Oxygen (ppm) For Green Harbor Project 2003-2007
0
2
4
6
8
10
12
2003-July
2003-August
2004-June
2004-July
2004-August
2005-July
2005-August
2006-June
2006-July
2006-August
2007-June
2007-July
2007-August
Date
Dis
so
lved
Oxyg
en
(p
pm
)
Harbor
River
Allowing more water into the river would significantly improve Green Harbor’s dissolved oxygen. On September 2, 2004 tide gates were closed so there was zero tidal induction until the next summer when one gate was blocked open.
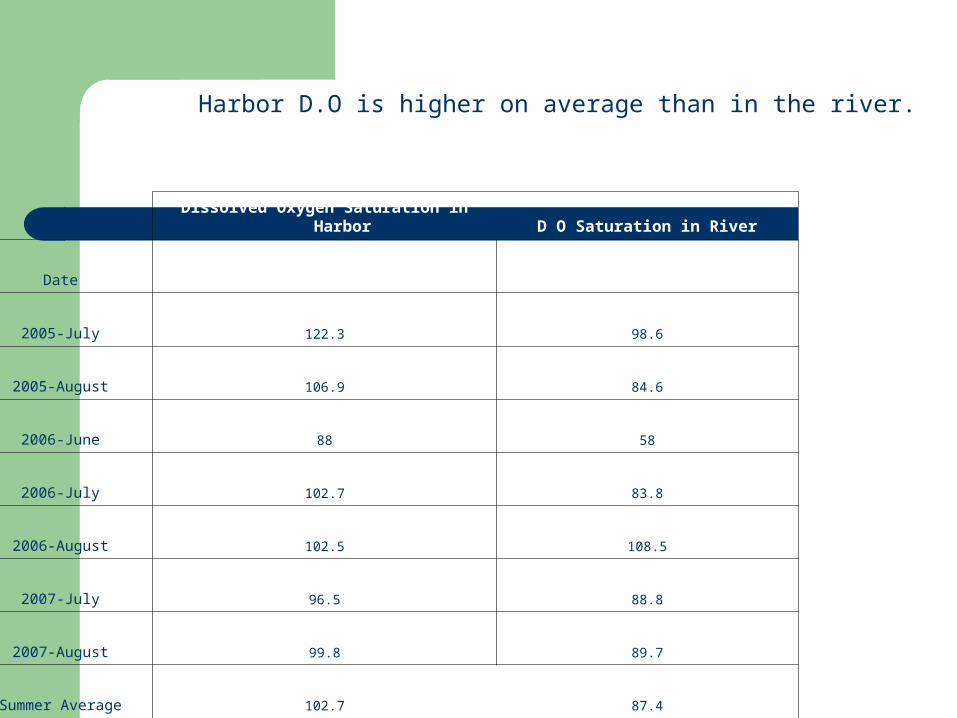
Dissolved Oxygen Saturation in Harbor D O Saturation in River
Date
2005-July 122.3 98.6
2005-August 106.9 84.6
2006-June 88 58
2006-July 102.7 83.8
2006-August 102.5 108.5
2007-July 96.5 88.8
2007-August 99.8 89.7
Summer Average 102.7 87.4
Harbor D.O is higher on average than in the river.
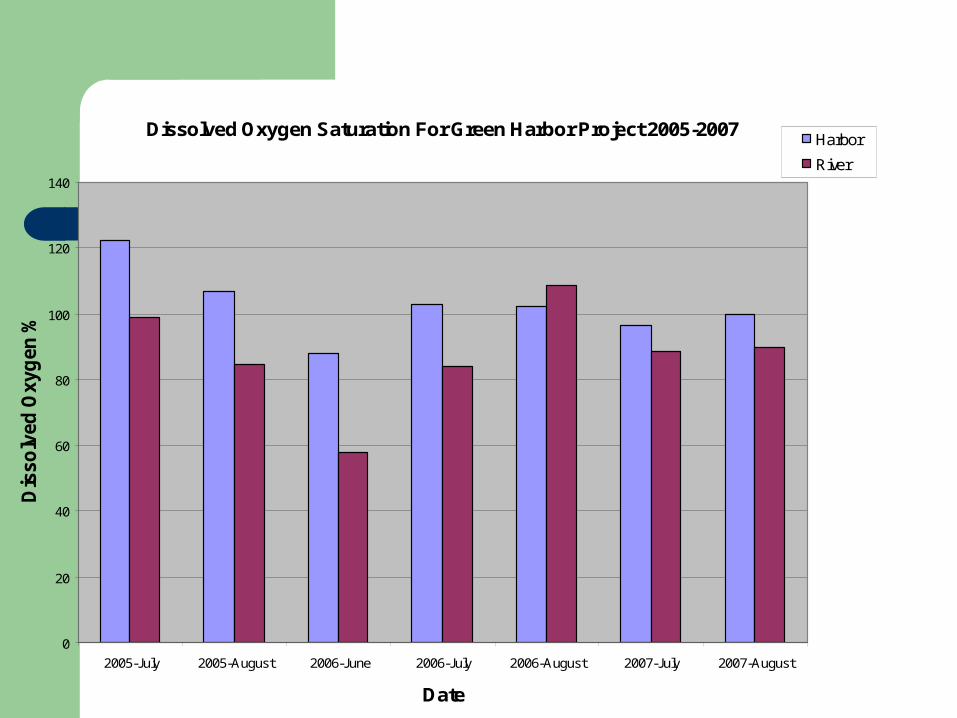
Dissolved Oxygen Saturation For Green Harbor Project 2005-2007
0
20
40
60
80
100
120
140
2005-July 2005-August 2006-June 2006-July 2006-August 2007-July 2007-August
Date
Dis
so
lved
Oxyg
en
%
Harbor
River
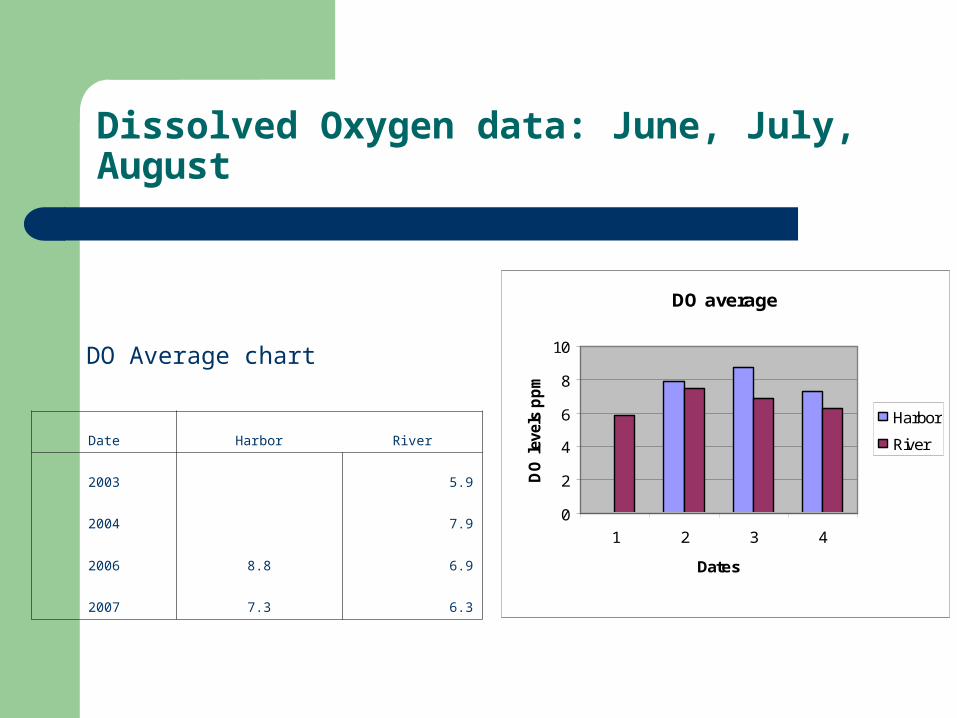
Dissolved Oxygen data: June, July, August
Date Harbor River
2003 5.9
2004 7.9
2006 8.8 6.9
2007 7.3 6.3
DO average
0
2
4
6
8
10
1 2 3 4
Dates
DO
leve
ls p
pm
Harbor
River
DO Average chart
Analyzing Dissolved oxygen
Dissolved oxygen levels were probably low during the summer months in 2003 and 2006 because the water was extremely turbid with a brownish/red color which was most likely caused by the limited tidal flow. Suspended sediments block out sunlight that vegetation needs to photosynthesize: Without photosynthesis the oxygen levels will be low. Also, the warmer the water, the less oxygen there will be, and the temperatures were high because there was less mixing of cool ocean water in the river due to limited tidal induction.
The brownish coloration of the water absorbs radiation at a higher rate then clearer waters which can cause the temperatures to rise.
Dissolved oxygen was also effected because there is little rainfall in July and August. The gates were also barely open, allowing slight inflow of water.
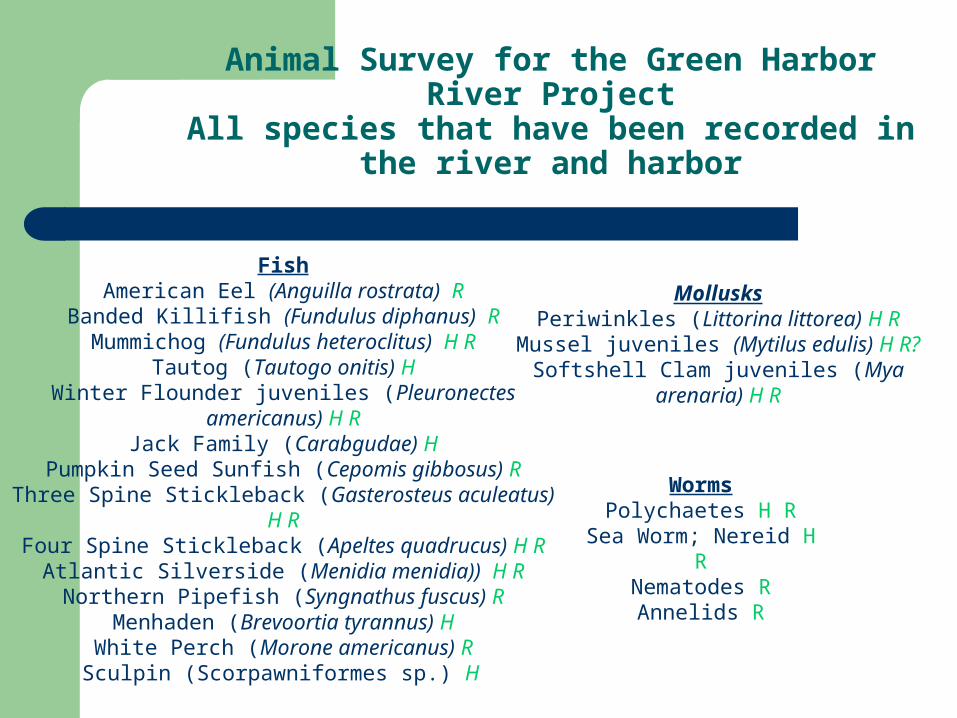
Animal Survey for the Green Harbor River Project
All species that have been recorded in the river and harbor
FishAmerican Eel (Anguilla rostrata) R
Banded Killifish (Fundulus diphanus) RMummichog (Fundulus heteroclitus) H R
Tautog (Tautogo onitis) HWinter Flounder juveniles (Pleuronectes americanus) H R
Jack Family (Carabgudae) HPumpkin Seed Sunfish (Cepomis gibbosus) R
Three Spine Stickleback (Gasterosteus aculeatus) H RFour Spine Stickleback (Apeltes quadrucus) H R
Atlantic Silverside (Menidia menidia)) H RNorthern Pipefish (Syngnathus fuscus) R
Menhaden (Brevoortia tyrannus) HWhite Perch (Morone americanus) R
Sculpin (Scorpawniformes sp.) H
MollusksPeriwinkles (Littorina littorea) H R
Mussel juveniles (Mytilus edulis) H R?Softshell Clam juveniles (Mya arenaria) H R
WormsPolychaetes H R
Sea Worm; Nereid H RNematodes R
Annelids R
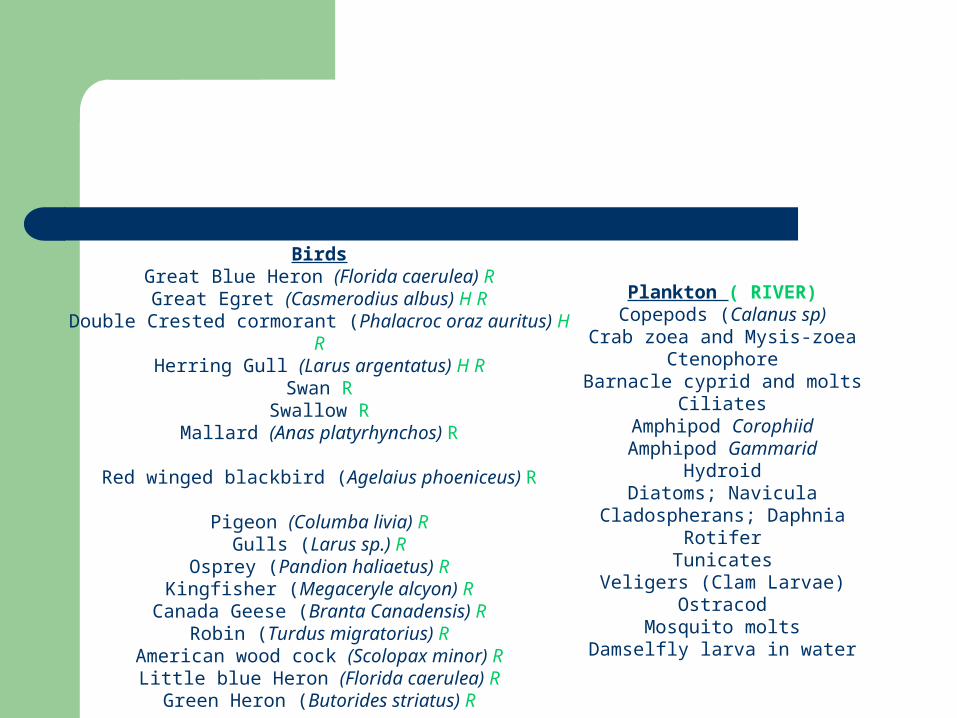
Plankton ( RIVER)Copepods (Calanus sp)
Crab zoea and Mysis-zoeaCtenophore
Barnacle cyprid and moltsCiliates
Amphipod CorophiidAmphipod Gammarid
HydroidDiatoms; Navicula
Cladospherans; DaphniaRotifer
TunicatesVeligers (Clam Larvae)
OstracodMosquito molts
Damselfly larva in water
BirdsGreat Blue Heron (Florida caerulea) RGreat Egret (Casmerodius albus) H R
Double Crested cormorant (Phalacroc oraz auritus) H RHerring Gull (Larus argentatus) H R
Swan RSwallow R
Mallard (Anas platyrhynchos) R
Red winged blackbird (Agelaius phoeniceus) R
Pigeon (Columba livia) RGulls (Larus sp.) R
Osprey (Pandion haliaetus) RKingfisher (Megaceryle alcyon) R
Canada Geese (Branta Canadensis) RRobin (Turdus migratorius) R
American wood cock (Scolopax minor) RLittle blue Heron (Florida caerulea) RGreen Heron (Butorides striatus) R
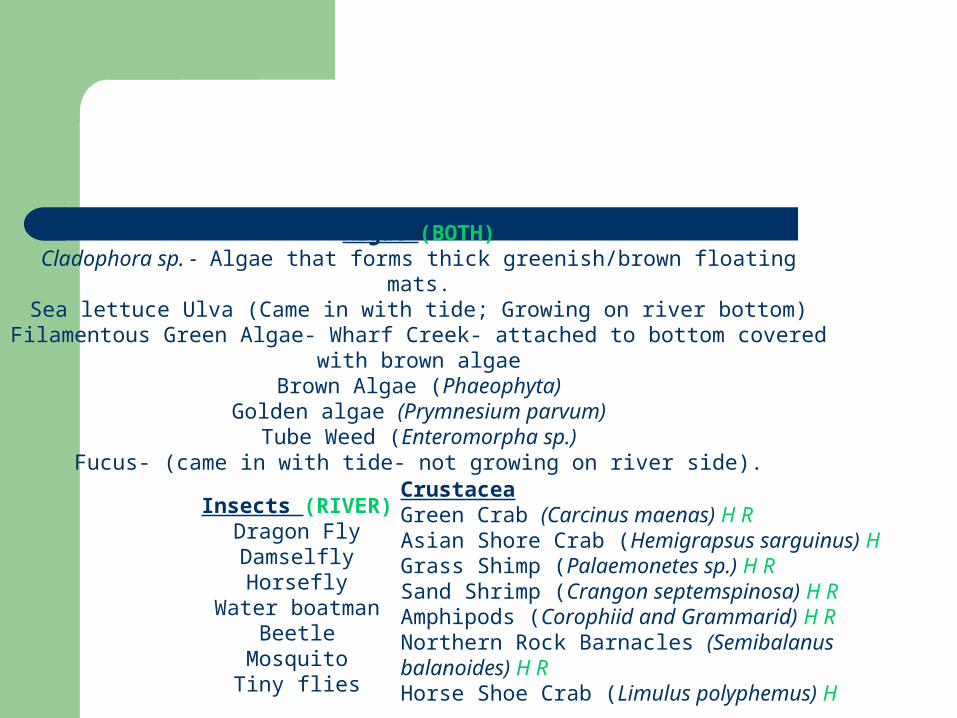
Algae (BOTH)Cladophora sp. - Algae that forms thick greenish/brown floating mats.
Sea lettuce Ulva (Came in with tide; Growing on river bottom)Filamentous Green Algae- Wharf Creek- attached to bottom covered with brown algae
Brown Algae (Phaeophyta)Golden algae (Prymnesium parvum)
Tube Weed (Enteromorpha sp.)Fucus- (came in with tide- not growing on river side).
Insects (RIVER)Dragon FlyDamselflyHorsefly
Water boatmanBeetle
MosquitoTiny flies
CrustaceaGreen Crab (Carcinus maenas) H RAsian Shore Crab (Hemigrapsus sarguinus) H Grass Shimp (Palaemonetes sp.) H RSand Shrimp (Crangon septemspinosa) H RAmphipods (Corophiid and Grammarid) H RNorthern Rock Barnacles (Semibalanus balanoides) H RHorse Shoe Crab (Limulus polyphemus) H