Embed Size (px)
Citation preview

8∫
Green growth in
the Netherlands2012

Green growth in the Netherlands
2012

Explanation of symbols
. Data not available
* Provisional figure
** Revised provisional figure (but not definite)
x Publication prohibited (confidential figure)
– Nil
– (Between two figures) inclusive
0 (0.0) Less than half of unit concerned
empty cell Not applicable
2012–2013 2012 to 2013 inclusive
2012/2013 Average for 2012 to 2013 inclusive
2012/’13 Crop year, financial year, school year, etc., beginning in 2012 and ending in 2013
2010/’11–2012/’13 Crop year, financial year, etc., 2010/’11 to 2012/’13 inclusive
Due to rounding, some totals may not correspond to the sum of the separate figures.
PublisherStatistics NetherlandsHenri Faasdreef 312, 2492 JP The Haguewww.cbs.nl
Prepress: Statistics Netherlands, GrafimediaPrinted by: Tuijtel, Hardinxveld-GiessendamDesign: Edenspiekermann
InformationTelephone +31 88 570 70 70, fax +31 70 337 59 94 Via contact form: www.cbs.nl/information
Where to [email protected] +31 45 570 62 68Price € 15.50 (excluding postage) ISBN 978-90-357-2053-4
© Statistics Netherlands, The Hague/Heerlen 2013. Reproduction is permitted, provided Statistics Netherlands is quoted as the source.
60227 201301 P-44

3
Foreword
Green growth is high on the national and international agenda. It was one of the central
themes at the United Nations Conference on Sustainable Development (Rio+20) in June
2012. The Dutch government is committed to realising economic growth while not
depleting nature’s resources. As part of the green growth policy, the recently initiated
Green Deal Program aims to involve the private sector in the green transition. A national
energy agreement was negotiated in the summer of 2013 between the social partners,
environmental organisations and the government. The agreement covers energy, clean
technology and climate policy, and should contribute to ‘green growth’ in the Netherlands.
This new policy initiative also calls for an objective measurement of the green economy.
In 2011, Statistics Netherlands published its first edition of ‘Green growth in the
Netherlands’. It included four different themes reviewing twenty OECD indicators. It
provided a first coherent overview of the Dutch Green Economy. This second edition
provides an update of the ‘old twenty’ and introduces several new indicators. The indicators
are broken down into six themes and the Netherlands is placed in an international
perspective. The report also includes the summary of two studies that will be published
simultaneously, namely on top sectors and on carbon footprints. A summary for policy-
makers of the scientific research on the causal relation between micro-productivity and
green investments of enterprises (Porter-hypothesis) is included as well.
The main conclusion is that the Dutch economy is turning ‘greener’ but at a very moderate
pace. For example, greenhouse gas emissions have fallen, but only by 7 percent since
2000. The share of renewable energy in total energy consumption has risen, but only from
1.4 to 4.4 percent. The share of the environmental goods and services sector (EGSS) in
employment and value added has been increasing, but slowly. There are negative domestic
developments as well. For example, the decreasing share of green taxes, the lower energy
reserves and the deteriorating Farmland Bird Index. In an international perspective, the
Netherlands has one of the highest shares of green taxes in Europe (in spite of the domestic
decrease) and has a very high implicit tax rate for energy. Yet the Netherlands performs
worse than other countries in terms of nutrient surpluses in agriculture and the quality of
the surface water.
Green growth in the Netherlands 2012 is published simultaneously with the Environmental
Accounts of the Netherlands 2012. In this publication Statistics Netherlands (CBS) presents a
broad quantitative overview of the most important recent developments in the relationship
between the environment and the economy.
Director General of Statistics
G. van der Veen
Heerlen/The Hague, November 2013


Contents 5
Contents
Foreword 3
Summary 7
Samenvatting 10
1. Introduction 13
1.1 Green growth in the Netherlands 14
1.2 The OECD measurement framework for green growth 15
1.3 Selection and scoring of the indicators 18
1.4 More information 20
2. Green Growth in the Netherlands 21
2.1 Overview 22
2.2 Production-based greenhouse gas emissions 25
2.3 Consumption-based greenhouse gas emissions 26
2.4 Emissions to water, heavy metals 27
2.5 Nutrient surpluses 28
2.6 Waste generation 29
2.7 Groundwater abstraction 30
2.8 Domestic biomass consumption 31
2.9 Domestic metal consumption 32
2.10 Domestic mineral consumption 33
2.11 Net domestic energy use 34
2.12 Renewable energy 35
2.13 Waste recycling 36
2.14 Energy reserves 37
2.15 Stocks of standing timber 38
2.16 Stocks of fish 39
2.17 Land conversion into built-up land 40
2.18 Farmland birds 41
2.19 Urban exposure to particulates 42
2.20 Chemical quality of surface waters 43
2.21 Ecological quality of surface waters 44
2.22 Nitrate in groundwater 45
2.23 Level of concern 46
2.24 Willingness to pay 47
2.25 Environmental subsidies and transfers 48
2.26 Implicit tax rate for energy 49
2.27 Mitigation expenditure by the government 50
2.28 Environmental taxes and fees 51
2.29 Environmental protection expenditures 52
2.30 Green patents 53
2.31 Employment in the environmental goods and services sector (EGSS) 54
2.32 Employment sustainable energy sector 55
2.33 Value added environmental goods and services sector (EGSS) 56
2.34 Environmental investments 57
6 Green growth in the Netherlands 2012
3. Green growth, position of the Netherlands in the OECD and Europe 58
3.1 Overview 59
3.2 Environmental efficiency 61
3.3 Resource efficiency 62
3.4 Natural asset base 63
3.5 Environmental quality of life 64
3.6 Green policy responses 64
3.7 Economic opportunities 65
4. Summaries of theme articles 66
4.1 Benchmark green growth for top sectors 67
4.2 Towards a MRIO based national accounts consistent carbon footprint 71
4.3 Testing the Porter Hypothesis on firm-level data for the Netherlands 73
References 80
Authors 83

Summary 7
Summary
The notion of ‘greening the economy’ is receiving more and more attention from policy
and decision makers. Green growth is the transition towards a sustainable economy that
promotes economic growth, while reducing pollution, ensuring efficient use of resources
and maintaining the natural assets. In addition, investment, competition and innovation
in greener technologies may give rise to new economic opportunities. This publication
presents an overview of the state of green growth in the Netherlands, using the OECD
measurement framework.
The Dutch economy generally has become ‘greener’ since 2000. However, this development
takes place gradually and is not yet observed for all aspects of green growth. This becomes
clear when looking at the different themes of the green growth framework shown in the
figure (summary table).
Overall, the Dutch economy exerts less direct pressure on the environment than in 2000.
All environmental efficiency indicators for emissions and waste improved. For example,
the emissions of greenhouse gases and the emissions to water of heavy metals have
decreased since 2000 while GDP increased (absolute decoupling). It is striking however, that
while the environmental efficiency within the Netherlands has improved significantly, the
international position of the Netherlands is still average compared to other EU and OECD
countries. Greenhouse gas emissions from consumption activities (the carbon footprint)
have also decreased, although less than the emissions from production. In depth research,
summarized in this publication, reveals that the carbon footprint (CO2 only) in 2009
Environmental e�ciency
Resource e�ciency
Natural asset base
Environmental quality of life
Green policy instruments
Economic opportunities
Trend in NL Position NLin EU or OECD
Summary table for green growth in the Netherlands
Negative trend or low international ranking
Neutral trend or average international ranking
Positive trend or high international ranking
No data available to determine the trend or for comparison to other countries

8 Green growth in the Netherlands 2012
amounted to 202 Mton CO2 which equals 12.2 ton on a per capita basis. This is slightly lower
than the production based greenhouse gas emissions. Of all CO2 emissions emitted abroad
due to final consumption in the Netherlands, China contributed most with 19 percent.
All indicators for resource use efficiency show that fewer resources are required to generate
an equal amount of value added. However, the absolute level of most resources needed is
still increasing (relative decoupling). For example, energy use and domestic use of biomass,
inorganic minerals and metals for economic production are still rising, but less than the
GDP growth rate. Internationally, the Netherlands scores averagely for resource efficiency.
The percentage of renewable energy production increases, but is still very low compared to
other countries.
Although environmental and resource efficiency is improving, it does not mean that the
economic growth imposes no damage to the environment in the Netherlands. The group of
indicators for the natural asset base shows a rather negative picture. This is mainly caused
by a deteriorating biodiversity (farmland bird index), a high rate of conversion into built up
land and decreasing energy reserves. The stocks of timber and the quality of fish stocks are
improving. However, fish stocks in the North Sea are still close to threat levels.
Indicators for the environmental quality of life show a rather mixed picture. This theme
measures the direct impact of air, water and soil emissions on the quality of life and
perception. The urban exposure to particulates (PM10) is improving, but very few water
bodies comply with the ecological quality standards defined by the European Water
Framework Directive. Although the environmental quality of life and natural assets score
rather negative, indicators for perception (environmental concern and willingness to pay
for the environment) show a sharp decline over the past decade. In 2012, 40 percent of the
respondents believed that the environment was strongly polluted and only 24 percent had
the willingness to pay extra taxes to protect the environment.
Indicators for green policy instruments also show a varied picture. The share of
environmental taxes in total tax revenues has been constant for several years and
recently shows a decline. Also, the share of environmental subsidies in total government
expenditures has been constant since 2005. Environmental expenditure as a share of
GDP has decreased in recent years, indicating that fewer financial resources have been
committed for the protection of the environment. Although the trend of greening policy
instruments stabilized or declined in the recent years, the Netherlands scores very high
on these indicators when compared internationally. For instance, it possesses one of the
highest shares of green taxes and has a very high implicit tax rate for energy.
All indicators show that the economic opportunities that arise from greening the economy
increase. For instance, the share, but also the absolute number of green patent applications
has grown significantly since 2000. Furthermore, the share of the environmental goods and
services sector (EGSS) with respect to employment and value added in the Dutch economy
is increasing steadily. The question whether other enterprises in the manufacturing
industry also benefit from the economic opportunities from greening the growth has
been researched at the micro-level. Eco-innovation at enterprises seems to show a strong
synergy with other types of innovation within the investigated firms. It was also found
that environmental regulations were most sizable for the ecological innovation adoption
decision. These results together imply a strong corroboration of the weak version of the
Porter Hypothesis. For the Dutch manufacturing industry, there is no significant positive

9
direct contribution of environmental regulation to productivity, but the testing of synergy
effects of innovation modes shows that eco-innovation is a complementary factor in the
sense that firms that combine eco-innovations with other types of innovation show a better
productivity performance.
In this report the findings concerning green growth within the nine so-called ‘top sectors’
in the Netherlands’ economy are presented using a selection of relevant indicators. The
top sectors play a central role within government business and corporate policy aimed
at promoting innovation and strengthening the Netherlands’ economic competitiveness.
Together, the top sectors are responsible for approximately 70 percent of air emissions and
materials usage, while providing only 21 percent of the employment and 27 percent of
the value added in the Dutch economy. The top sectors are taxed relatively less in terms
of environmental taxation. Fifty-six percent of all environmental tax levied is paid by the
top sectors, even though they produce most of the environmental pollution. Top sectors
contribute significantly to employment in the environmental goods and services sector. The
most polluting businesses within the top sectors are active in manufacturing. However, it
was also found that the environmental pressure caused by industries that are part of the
top sectors has decreased significantly during the past decade, whereas their economic
output has increased during the same period.

10 Green growth in the Netherlands 2012
Samenvatting
Het idee van ‘vergroening van de economie’ krijgt meer en meer aandacht van politici
en beleidsmakers. Groene groei is de transitie naar een duurzame economie en het
bevorderen van economische groei, terwijl de vervuiling afneemt, efficiënter gebruik wordt
gemaakt van grondstoffen en de beschikbaarheid van natuurlijke hulpbronnen op niveau
blijft. Investeringen, competitie en innovatie in groenere technologieën bieden daarbij
ruimte aan nieuwe economische kansen. Deze publicatie presenteert een overzicht van
de staat van groene groei in Nederland, waarbij gebruik wordt gemaakt van het OECD-
raamwerk voor het meten van groene groei.
In het algemeen geldt dat de Nederlandse economie groener is geworden sinds 2000.
Echter, deze ontwikkeling vindt geleidelijk aan plaats en geldt niet voor alle aspecten van
groene groei. Dit wordt duidelijk wanneer er gekeken wordt naar de verschillende thema’s
van het groene groei raamwerk zoals getoond in de figuur hierboven.
Over het algemeen oefent de Nederlandse economie minder directe druk uit op het
milieu dan in 2000. Alle milieu-efficiënte indicatoren voor emissies en afval zijn verbeterd.
Bijvoorbeeld, de emissies van broeikasgassen en de emissies naar water van zware metalen
zijn gedaald sinds 2000 (absolute ontkoppeling). Het is opvallend dat ondanks de significante
verbetering van de milieu-efficiëntie, de internationale positie van Nederland nog steeds
gemiddeld is vergeleken met andere EU en OECD landen. Broeikasgasemissies veroorzaakt
door consumptieactiviteiten (de carbon footprint) zijn gedaald, hoewel iets minder dan
de broeikasgasemissies door productie. Nader onderzoek, samengevat in deze publicatie,
Milieu-e�ciëntie
Grondsto�ene�ciëntie
Natuurlijke hulpbronnen
Milieukwaliteit van het leven
Groene beleidsinstrumenten
Economische kansen
Trend van NL Positie van NLin EU of OECD
Overzichtstabel groene groei in Nederland
Negatieve trend of lage internationale positie
Neutrale trend of gemiddelde internationale positie
Positieve trend of hoge internationale positie
Geen data beschikbaar om de trend te bepalen of voor de vergelijkingmet andere landen

11
laat zien dat de carbon footprint (alleen CO2) 202 Mton CO2 bedroeg in 2009. Dit is gelijk
aan 12,2 ton per hoofd. Dat is iets lager dan de broeikasgasemissies door Nederlandse
productieactiviteiten. Van alle CO2 emissies uitgestoten in het buitenland en veroorzaakt door
finale consumptie in Nederland, draagt China met 19 procent het meeste bij.
Alle indicatoren voor efficiënt gebruik van grondstoffen laten zien dat er minder
grondstoffen worden verbruikt om een gelijke hoeveelheid toegevoegde waarde te
creëren. Echter, het absolute niveau van de meeste grondstoffen die nodig zijn, neemt toch
toe (relatieve ontkoppeling). Bijvoorbeeld, energiegebruik en binnenlands gebruik van
biomassa, anorganische mineralen en metalen voor economische productie nemen toe,
maar minder dan de groei van het BBP. Internationaal gezien scoort Nederland gemiddeld
voor het efficiënt gebruik van hulpmiddelen. Het percentage hernieuwbare energie neemt
toe maar is erg laag in vergelijking met andere landen.
Ofschoon de milieu-efficiëntie en de grondstoffenefficiëntie toenemen, betekent dit niet
dat de economische groei geen schade toebrengt aan het milieu in Nederland. De groep
van indicatoren voor de natuurlijke hulpbronnen laat eerder een negatief beeld zien. Dit
wordt vooral veroorzaakt door een verslechterende biodiversiteit (index van weidevogels),
een hoge conversiegraad van ‘groen’ gebied naar bebouwd gebied en afnemende
energiereserves. De houtvoorraad en de kwaliteit van de visbestanden in de Noordzee
verbeteren wel. Echter, de visbestanden in de Noordzee bevinden zich nog dicht bij de
bedreigingsniveaus.
Indicatoren voor milieukwaliteit van het leven laten een gevarieerd beeld zien. Dit thema
omvat de directe invloed van lucht, water en bodememissies op de kwaliteit van leven
en de mate van perceptie. De stedelijke blootstelling aan fijn stof verbetert, maar weinig
waterlichamen voldoen aan de kwaliteitsstandaarden zoals voorgeschreven in de
Europese Kaderrichtlijn Water. Ofschoon de milieukwaliteit van het leven en de natuurlijke
hulpbronnen vooral negatief scoren, laten de indicatoren voor perceptie en de bereidheid
om te betalen voor het milieu een scherpe daling zien. In 2012 was slechts 40 procent van
alle respondenten van mening dat het milieu sterk vervuild was en slechts 24 procent was
bereid meer te betalen voor het milieu.
Ook de indicatoren voor groene beleidsinstrumenten laten een gevarieerd beeld zien. Het
aandeel van groene belastingen in de totale belastingopbrengst neemt gedurende de
laatste jaren iets af. Het aandeel van milieusubsidies in de totale overheidsuitgaven is
constant sinds 2005. Milieukosten als aandeel in het bbp daalden de afgelopen jaren. Dit
betekent dat er minder financiële middelen aangewend worden voor milieubescherming.
Ofschoon de trend van groene beleidsinstrumenten stabiliseerde of daalde de afgelopen
jaren, scoort Nederland internationaal gezien erg hoog voor deze indicatoren. Nederland
heeft bijvoorbeeld één van de hoogste aandelen groene belastingen en een hoog impliciet
belastingtarief op energie.
Alle indicatoren laten zien dat de economische kansen die voortkomen uit groene groei
toenemen. Bijvoorbeeld, het aandeel, maar ook het absolute aantal van groene patenten
is significant gegroeid sinds 2000. Verder groeit het aandeel van de milieusector in de
toegevoegde waarde en werkgelegenheid gestaag. De vraag of andere bedrijven in
de maakindustrie ook profiteren van de economische mogelijkheden van vergroening
is onderzocht op bedrijfsniveau. Eco-innovatie bij bedrijven lijkt een sterke synergie
te vertonen met andere vormen van innovatie. Tevens werd geconcludeerd dat de

12 Green growth in the Netherlands 2012
milieuregulering het meest belangrijk is voor ecologische innovatie beslissingen. Deze
resultaten impliceren een bevestiging van de zwakke versie van de Porter hypothese.
Voor de Nederlandse industrie is er geen significante positieve directe bijdrage van
milieuregulering aan een hogere productiviteit, maar het testen van de synergie-effecten
van innovatie laat wel zien dat eco-innovatie een aanvullende factor is, in de zin dat
bedrijven die eco-innovaties combineren met andere vormen van innovatie een hogere
productiviteit hebben.
Sommige relevante groene groei indicatoren zijn ook onderzocht voor de zogeheten
topsectoren binnen de Nederlandse economie. Er zijn negen topsectoren. Topsectoren
spelen een centrale rol op het gebied van innovatie en concurrentiekracht. Ongeveer
70 procent van de luchtemissies en het gebruik van materialen kan toegewezen worden
aan deze topsectoren, terwijl zij slechts 21 procent bijdragen aan de werkgelegenheid
en 27 procent aan de toegevoegde waarde. De topsectoren betalen relatief ook weinig
milieubelasting. Slechts 56 procent van de milieubelastingen worden betaald door de
topsectoren, terwijl het merendeel van de vervuiling daar plaatsvindt. Topsectoren dragen
significant bij aan de werkgelegenheid in de milieusector. De meest vervuilende bedrijven
binnen de topsectoren komen uit de maakindustrie. Wel kan opgemerkt worden dat de
bedrijfstakken gerelateerd aan topsectoren een dalende druk op het milieu laten zien,
terwijl de economische output het laatste decennia is toegenomen.

Introduction 13
1.Introduction

14 Green growth in the Netherlands 2012
‘Growing green’ is receiving much attention, both nationally and internationally. This chapter introduces the monitoring of green growth in the Netherlands. In section 1.1 the international and national context for measuring green growth is discussed. In section 1.2 In OECD measurement framework for green growth and its underlying themes are presented which form the basis for monitoring green growth in the Netherlands. In section 1.3 the selection and scoring of the indicators for the Dutch is explained in more detail. Finally, section 1.4 explains where more background information on the indicators can be found.
1.1 Green growth in the Netherlands
The performance of an economy is usually measured in terms of changes in its gross
domestic product (GDP). Economic growth, i.e. the increase of GDP, offers benefits such
as welfare, but it also has negative side effects. So there are various reasons to look at
the nexus of the environment and economy. Non-renewable resources such as fossil fuels
and some metals are becoming scarce, and renewable stocks, such as fish and forests, are
vulnerable to over-exploitation. In turn, these developments can hamper future growth.
In addition, there is substantial scientific evidence that the quality of our environment is
degrading to a critical level. For instance, global boundaries such as the concentration
of greenhouse gases in the atmosphere, water extraction and biodiversity losses have
exceeded their tipping points (Rockström et al. 2009; IPCC 2013). There is international
consensus that more action is required (e.g. OECD, 2008; UNEP, 2009; UN, 2012a).
As a result of these concerns, the notion of ‘greening the economy’ is receiving more
attention from policy and decision makers. It was one of the central themes on the United
Nations Conference on Sustainable Development (Rio+20) in June 2012. According to
the declaration of Rio+20, “a green economy in the context of sustainable development
and poverty eradication is considered one of the important tools available for obtaining
sustainable development” (UN, 2012a, par. 56).
Consequently, a proper measurement framework is required to guide and evaluate policy
decisions and to evaluate current policies with respect to greening growth. In 2011
the OECD green growth strategy was adopted by the OECD Ministerial Council (OECD,
2011a). Green growth provides both a policy strategy for implementing this economic
transformation and a monitoring framework with a proposed set of indicators.
In the Netherlands green growth is high on the political agenda. The government is
committed to realizing economic growth that does not deplete nature’s resources (EZ,
2013). As part of the green growth policy, the Green Deal programme aims to involve
the private sector in the green transition. It includes agreements with the Dutch Dairy
Organisation and the Dutch Agricultural and Horticultural Organisation to have zero-
carbon emissions in dairy chains by 2020. Green Deals aim to strengthen private initiatives
by removing harmful regulations. The Netherlands will also pursue greener production
outputs by switching to a bio-based economy. Sustainable Public Procurement is another
field in which the Netherlands tries to green the economy. The national energy agreement,
which was negotiated in the summer of 2013 between the social partners, environmental

Introduction 15
organizations and the government and includes agreements on energy, clean technology
and climate policy, is key to contributing to ‘green growth’ in the Netherlands (SER, 2013).
In order to monitor and evaluate its policies, the Dutch government has asked Statistics
Netherlands to develop monitoring frameworks for sustainability and green growth.
Statistics Netherlands in cooperation with the national assessment agencies has published
the sustainability monitor (Statistics Netherlands, 2011c). In 2011 Statistics Netherlands
published its first edition on green growth (Statistics Netherlands, 2011a). The present
edition provides an update. In chapter 2 an overview is presented of the status of green
growth in the Netherlands based on a detailed description of 33 indicators. In chapter 3
international benchmark is provided with respect to green growth indicators. Chapter 4
includes the summary of two studies that will be published simultaneously, namely on top
sectors and on carbon footprints, and a summary for policy-makers of scientific research
on the causal relation between micro-productivity and green investments of enterprises
(Porter-hypothesis).
1.2 The OECD measurement framework for green growth
The concept of “greening the economy” is still relatively new. Two important recent
initiatives focus on the economic and ecological aspects of sustainability, namely the green
growth strategy of the OECD and the green economy of UNEP. Although both initiatives
broadly encompass the same topics, there are some conceptual differences.
According to the definition formulated by the OECD (OECD, 2011a), green growth is about
“fostering economic growth and development while ensuring that the quality and quantity
of natural assets can continue to provide the environmental services on which our well-
being relies. It is also about fostering investment, competition and innovation which will
underpin sustained growth and give rise to new economic opportunities”. UNEP defines a
green economy as one that results in “improved human well-being and social equity, while
significantly reducing environmental risks and ecological scarcities” (UNEP, 2011). Statistics
Netherlands has chosen to apply the OECD framework to measure green growth as this
currently provides the most elaborate measurement framework1).
Indicators for green growth focus on the economic-environmental nexus, that is the extent
to which economic activity is being “greened”. The conceptual framework for measuring
green growth developed by the OECD is therefore based on the setup of the production
sphere of a macroeconomic model, whereby inputs are transformed into outputs (OECD,
2011b). Accordingly, the Indicators describe a) the natural asset base (natural capital) that
provides crucial inputs into production, b) the “greening” of production processes, in terms
of improving the environmental efficiency, and c) the outputs, which refers to the broad
1) Recently, the OECD, UNEP, the World Bank and GGGI have taken a first step harmonise efforts to develop an internationally agreed framework to measure green growth / green economy (Green Growth Knowledge Platform, 2013). The first outcome paper proposes an indicator framework that is very similar to the OECD conceptual framework and uses the same classification.

16 Green growth in the Netherlands 2012
notion of wellbeing that also captures aspects not reported by conceptual macro-economic
measures (i.e. certain environment-related services, environment-related health problems,
and amenities). In addition, the production function approach should be supplemented by
indicators on government policies and economic opportunities.
According to the OECD measurement framework for green growth, the indicators are broken
down into four themes (OECD, 2011b):
A. Environmental and resource productivity of the economyEconomic production and growth depend on the environment for inputs of natural
resources such as energy, water and basic materials, but also use it as a sink for outputs
in the form of waste and emissions. Therefore, environmental and resource efficiency and
its evolution over time are central measures of green growth. Environmental efficiency
is defined as creating more goods and services while using fewer resources and creating
less waste. Environmental efficiency can be monitored by the environmental or resource
intensity which is defined as the pressure caused by an economic activity (for example
CO2 emissions) divided by the economic value added of that activity (for example GDP) or
the environmental and resource productivity (which is the reciprocal of environmental /
resource intensity). Efficiency increases may coincide with displacement effects, for example
if domestic production is replaced by imports. In view of globalising supply chains as well
as the non-local nature of the problems at stake – global warming, worldwide biodiversity
losses – it is essential to also include ‘footprint’ type indicators here that estimates
worldwide environmental pressure as a result of national consumption requirements.
B. The natural asset baseIn addition to monitoring the relationship between environmental burden and economic
growth, it is equally important to ensure that the burden does not exceed nature’s carrying
capacity, so as to prevent irreversible quality losses of natural assets. It is in the interest
of an economy’s long-term stability to ensure it retains a healthy balance with its natural
resource base. The natural asset base (natural capital) is monitored by assessing the stocks
1.2.1 OECD Measurement framework for green growth
Production:– Agriculture– Manufacturing– Services etc.
Natural asset base
Naturalresources
Amenities, health& safety aspects
Waste, pollutants
Consumption:– Households– Government
Economic &social agents
Policy measures:– Taxes– Subsidies– Regulation– Innovation
outputs inputs
Economic activities
Income Goods &services Residuals
Labour CapitalResources
1. Indicators monitoring environmental e�ciency2. Indicators monitoring resource e�ciency3. Indicators monitoring the natural asset base
4. Indicators monitoring environmental quality of life5. Indicators monitoring green policy instruments6. Indicators monitoring economic opportunities
3
5
14
6
2

Introduction 17
of renewable assets, like timber, water, biodiversity, and non-renewable assets such as
fossil energy reserves, preferably in terms of quantity and quality.
C. The environmental quality of lifeAs well as being a provider of resources and an absorber of pollution, the environment
also provides ecosystem services such as recreation. Also, a less polluted local environment
leads to a healthier population. There is therefore a direct link between the environment
and quality of life, which is captured in the third set of indicators.
D. Policy responses and economic opportunitiesThis category combines two types of indicators, namely on policies that stimulate green
growth and on economic opportunities. Governments can choose between several policy
instruments such as taxes, subsidies and regulation to steer development in a preferred
direction. Monitoring the extent and effects of these ‘green’ instruments is of great interest
to policy makers. These measures will also create new opportunities for economic activities
that may generate new jobs and stimulate economic growth.
Green growth and sustainable developmentSustainable development and green growth/green economy are sometimes thought to be
the same. Although they have similar goals in preserving sufficient natural resources and
protecting the environment for future generations, there are some clear differences. The cores
of sustainable development and green growth partially overlap on the green aspects such as
environment, quality of life, natural capital and impacts on global natural capital (Figure 1.2.2).
Yet each measurement framework also focuses on specific issues that are not addressed by
the other. General human well-being, human and social capital form the core of sustainable
development while green growth focuses on environmental and resource productivity, green
policy responses and economic opportunities. Green growth can be seen as the path towards
sustainable development. In an overarching view, green growth and the core measurement of
sustainable development are conceptually not conflicting and can be regarded as part of the
broader domain of sustainability, as is illustrated in Figure 1.2.2.
1.2.2 Simpli�ed representation showing the relationship between green growth1.2.2 and sustainable development
Investments
Areas of sustainable development
‘Here and now’
‘Later’
‘Elsewhere’
Sustainable developmentGreen growth
Intensity/productivity
Environmental quality of life
Quality of life
Social capitalHuman capital
Economic capital
Natural capital/asset base
Environmental and resource e�ciency
Green policy responses
Economic opportunities
Impacts on other countries
Natural capital Other

18 Green growth in the Netherlands 2012
1.3 Selection and scoring of the indicators
The point of departure for the Dutch green growth indicator framework is the indicator
list composed by the OECD (OECD, 2011b). The first Dutch green growth edition described
twenty indicators (Statistics Netherlands, 2011a). In 2012 the indicator set was revised and
a new set of thirteen indicators was selected, based on the following criteria:
A. Coverage. All themes of green growth must be covered sufficiently by indicators.
Several new indicators were sought for the third theme of environmental quality of life.
B. Interpretability. Indicators should be clearly interpretable in relation to green growth.
C. Data quality. Indicators should meet general quality standards, namely analytical
soundness and measurability.
D. Consistency with other indicator sets. Where possible, indicators should be coherent with
the macro-economic indicators from the national. Also, consistency with indicators of
the Dutch Sustainability Monitor should be achieved.
E. Relevance for the Dutch situation. Not all indicators from the OECD list are relevant for
the situation in the Netherlands. For instance, the OECD indicator ‘access to sewage
treatment and sanitation’ is irrelevant for the Netherlands, as (almost) all households
have access to these amenities. So, this indicator was omitted in favour of highly
relevant indicators not included in the OECD list, such as indicators on water quality.
Data for the Dutch green growth indicators originate from several different sources. Many
indicators are derived from the Dutch environmental accounts (see box), which are fully
consistent with macro-economic indicators from the national accounts. Other indicators
come from a variety of statistics, including environmental statistics, energy statistics, and
innovation and technology statistics. A few indicators are obtained from sources outside
Statistics Netherlands.
All indicators are grouped in a dashboard for green growth according the themes identified in
the OECD measurement framework as described above. Two themes, namely environmental
and resource efficiency and policy responses and economic opportunities, have been further
subdivided, resulting in six different themes for green growth in total in the dashboard.
Environmental accounting and monitoring green growthThe System of Environmental-Economic Accounting (SEEA) provides a consistent, coherent and
comprehensive measurement framework for green growth, as it integrates economic and
environmental statistics (UN et al., 2012). Both UNEP and the OECD advocate that environmental
accounting is used as the underlying framework for deriving indicators. The OECD explicitly
advocates that measurement efforts should, where possible, be directly obtained from the SEEA
framework (OECD, 2011b).
A large number of the indicators from the OECD green growth monitoring framework can be
directly obtained from the accounts of the SEEA central framework. Indicators for environmental
efficiency and resource efficiency can be derived from the physical flow accounts. Combining
physical information with monetary indicators from the System of National Accounts (SNA)
provides information on the interaction between environmental pressure and economic
growth. The asset accounts provide the basis for indicators related to the natural asset base.

Introduction 19
Environmental activity accounts offer useful information on the application and efficiency of
various policy instruments, such as environmental taxes and subsidies. Finally, data from the
environmental goods and services sector (EGSS) provide indicators for evaluation of economic
opportunities that may be initiated by green growth.
A key aspect of measuring green growth is assessing the indicators. The scores are based on
the evaluation of trends in greening growth. For example, when the share of renewable
energy rises or the waste recycling percentage increases this is scored as “positive”. If
the trend is stable, such as a stable exposure to air pollution, the indicator is assessed as
“neutral”. If the trend deteriorates, such as a decline in biodiversity or decrease in energy
reserves, the indicator is assessed as “negative”. The scores for environmental and resource
efficiency indicators are based on the relationship between environmental pressure and
economic growth. When economic growth exceeds the increase of the environmental
indicator in a given period, it is called decoupling (Figure 1.3.1). Decoupling can be
absolute or relative. Absolute decoupling occurs when the environmentally relevant
variable is stable or decreasing and accordingly, the indicator has been assigned a positive
score. Decoupling is said to be relative when the growth rate of the environmentally
relevant variable is positive but less than the growth rate of the economic variable. Relative
decoupling is assigned a neutral score. No decoupling is scored as negative.
It is important to emphasise that these scores do not convey the ‘speed’ of greening
economic growth. For example, the share of renewables in energy production is growing.
But this ‘positive’ score does not express how fast the transition towards renewable energy
production is taking place. In addition, the scores of the indicators do not convey whether
these developments are sufficient to prevent irreversible damage to the environment. So,
1.3.1 Concept of decoupling
Time
Economic growthNo decouplingRelative decouplingAbsolute decoupling

20 Green growth in the Netherlands 2012
the steady decrease of nutrient and heavy metal emissions to the environment may not be
able to prevent damage to ecosystems and loss of biodiversity. Finally, the scores also do
not convey if policy targets are met. Scores and, if available, policy targets are described in
more detail in the respective indicator descriptions.
1.4 More information
More information on the underlying indicators can be found in the publication The
environmental accounts of the Netherlands 2012 (Statistics Netherlands, 2013a) and ‘het
compendium voor de leefomgeving’ (http://www.compendiumvoordeleefomgeving.
nl/). Also data for most indicators can be directly obtained from Statline, the electronic
database of Statistics Netherlands. Statistics Netherlands has also developed an interactive
infographic in 2012 to inform policymakers and the general public on the status of green
growth in the Netherlands2). This infographic is an interactive tool which enables users to
find detailed information on green growth. The infographic consists of two parts. In the
left column of the infographic there are four dashboards that each represent one of the
four themes of green growth. Consecutively, each dashboard contains a number of theme
related indicators, represented by pie charts. The colours in the pie charts illustrate the
trends of the indicators with regard to ‘greening growth’.
2) See http://www.cbs.nl/en-GB/menu/themas/dossiers/duurzaamheid/cijfers/extra/2012-groene-groei-visualisatie.htm.
Green Growth in the Netherlands 21
2.Green Growth
in the Netherlands

22 Green growth in the Netherlands 2012
This chapter provides an overview of the status of green growth in the Netherlands. Section 2.1 sums up the most important findings for each theme of green growth. The remainder of this chapter provides details on the developments of each indicator since 2000, the importance of the indicator with respect to green growth and some background information on these developments.
2.1 Overview
Environmental efficiencyOverall, the Dutch economy exerts less direct pressure on the environment than in 2000.
All environmental efficiency indicators for emissions and waste show absolute decoupling
with economic growth. Greenhouse gas emissions caused by production activities have
been reduced since 2000. Also greenhouse gas emissions from consumption activities (the
carbon footprint) have decreased, although less than the emissions from production. Energy
saving, higher imports of electricity and the financial and economic crisis are important
reasons for the decline of production-based greenhouse gas emissions. Since 2000, nutrient
surpluses by agriculture are down, while the value added by agriculture is up. Cutting
nutrient emissions to the soil has a positive influence on the quality of soil, ground and
surface water, which in turn has a positive influence on biodiversity. Heavy metal emissions
to water have fallen significantly thereby reducing the emission intensity. The volume of
waste generated also decreased.
Resource efficiencyOn the whole, indicators for resource use show that fewer resources are required to
generate an equal amount of output. However, the absolute level of most resources that
are needed is still increasing (relative decoupling). For example, energy use for economic
production is still rising, but less than the GDP growth rate. The same is true for the
domestic use of biomass, inorganic minerals and metals. The percentage of renewable
energy production is increasing steadily, but it is still low compared to fossil energy carriers.
The total amount of groundwater used has decreased since 2000. Although water is not
scarce in the Netherlands, fresh groundwater stocks are under pressure by competing uses,
particularly during the summer months. One of the major challenges in the transition to
green growth is to ensure that materials are used efficiently. The percentage of reused
waste has remained the same since 2000.
Natural asset baseAlthough environmental and resource efficiency is gaining ground, it does not mean
that the economic growth is not causing irreversible damage to the environment. This is
measured by indicators for the natural asset base. The group of indicators for the natural
asset base shows a rather negative picture. The natural asset base is measured for both
renewable and non-renewable stocks and indicators on eco-systems. The Dutch natural
gas reserves, the most economically relevant non-renewable resource, are rapidly being
depleted. A declining total stock is perceived as an indicator of unsustainable performance,
as the stocks are likely to run out in a couple of decades given the current extraction rates
and the absence of significant discoveries and revaluations. Indicators for ecosystems
show that land is still converted into built-up land. The conversion of nature, forests or

Green Growth in the Netherlands 23
agricultural land can been seen as a broad proxy for the pressure on the ecosystems
and biodiversity. The same environmental pressure is also seen in the decrease of the
European Farmland Bird Index. This is probably caused by intensive use of cultivated land,
changes in crop choices and the increase of scale in agriculture. Renewable assets, such as
stocks of standing timber (forests), are increasing. In economic terms, however, forestry is
relatively small in the Netherlands. The main benefits derived from forests are recreation
and biodiversity. The quality of marine ecosystems is measured in terms of the quality of
fish stocks in the North Sea. This is indicated by the share of six important fish species for
consumption, which are above the precaution limits for reproduction. It was found that the
fish stocks are recovering probably because of the EU catch limits, but not all fish species
are above their precaution limit.
Environmental quality of lifeIndicators for the environmental quality of life show a rather mixed picture of green growth.
This theme involves the direct impact of air, water and soil emissions on the quality of life
and perception. The human exposure to environmental pollution and environmental risks
have an impact on public awareness of environmental concerns, well-being and related
health costs. Water quality is an important environmental issue in the Netherlands as very few
water bodies comply with the ecological quality standards defined by the European Water
Framework Directive. The air quality is measured by urban exposure to particulates (PM10).
The exposure is stabilizing. The quality of the soil is measured by the nitrate concentrations
in groundwater. The nitrate concentrations are decreasing. On average, the target of 50 mg
nitrate / l has almost been reached. Indicators for perception of environmental concern and
willingness to pay for the environment show a sharp decline, expressing a decline in the
interest and concern for environmental issues by the general public.
Green policy responsesThere are several policy instruments that can be used to stimulate green growth.
Environmental taxes and subsidies provide key policy instruments that can create incentives
to reduce environmental externalities. Indicators for green policy instrument show a mixed
picture. The share of environmental taxes in total tax revenues has decreased slightly
compared to 2000, indicating no progress with regard to green tax reform. The share of
environmental subsidies in total government expenditures has been constant since 2005.
The average burden of taxes on energy use is up. A shift in taxation from labour to energy
consumption may foster initiatives to improve energy efficiency. Environmental expenditure
as a share of GDP has decreased in recent years. The development of total environmental
expenditure is an indicator of the financial resources that a country/economy has
committed for the protection of the environment. On the other hand, the climate change
mitigation expenditure of central government increased in the period 2007–2010.
Economic opportunitiesAnother way to ‘grow green’ is by innovation and creating economic opportunities. All
indicators show that there are more economic opportunities arising from greening the
economy. The share, but also the absolute number of green patent applications has grown
significantly since 2000, indicating an upward trend in the inventiveness and knowledge-
intensification of the country in the field of green technologies. The share of environmental
investments increased till 2007, but has been falling ever since. The share of employment
in the environmental goods and services sector (EGSS) in total employment is up, whereas
its share in value added in GDP has started to increase since 2005. With its contribution to
innovation and job creation, the EGSS is an important driver of the green economy.

24 Green growth in the Netherlands 2012
2.1.1 Scores of the Netherlands for green growth
Indicator Time series Trend Score-
Environmental efficiency
Production-based greenhouse gas emissions 2000–2012 absolute decoupling ●
Consumption-based greenhouse gas emissions 2003–2009 improvement ●
Emissions to water, heavy metals 2000–2010 absolute decoupling ●
Nutrient surpluses 2000–2010 absolute decoupling ●
Waste generation 2000–2010 absolute decoupling ●
Resource efficiency
Groundwater abstraction 2000–2011 absolute decoupling ●
Domestic biomass consumption 2000–2011 relative decoupling ●
Domestic metal consumption 2000–2011 relative decoupling ●
Domestic mineral consumption 2000–2011 no decoupling ●
Net domestic energy use 2000–2012 relative decoupling ●
Renewable energy 2000–2012 improvement ●
Waste recycling 2000–2010 no significant change ●
Natural asset base
Energy reserves 2000–2012 deterioration ●
Stocks of standing timber 2000–2010 improvement ●
Stocks of fish 2000–2013 no significant change ●
Land conversion into built-up land 2000–2008 deterioration ●
Farmland birds 2000–2012 deterioration ●
Environmental quality of life
Urban exposure to particulates 2000–2012 improvement ●
Chemical quality of surface waters 2009 - ●
Ecological quality of surface waters 2009 - ●
Nitrate in groundwater 2000–2010 improvement ●
Level of concern 2002–2012 improvement ●
Willingness to pay 2002–2012 deterioration ●
Green policy instruments
Environmental taxes 2000–2012 deterioration ●
Implicit tax rate for energy 2000–2012 improvement ●
Environmental subsidies and transfers 2005–2010 no significant change ●
Mitigation expenditure by government 2007–2010 improvement ●
Environmental protection expenditure 2000–2009 deterioration ●
Economic opportuinities
Contribution environmental goods and services sector (EGSS) to total employment 2000–2011 improvement ●
Contribution sustainable energy sector to employment 2008–2011 improvement ●
Contribution environmental goods and services sector (EGSS) to total value added 2000–2011 improvement ●
Green patents 2000–2009 improvement ●
Environmental investments 2000–2009 improvement ●
-

Green Growth in the Netherlands 25
2.2 Production-based greenhouse gas emissions
Since 2000, greenhouse gas emissions by Dutch production activities saw a 7 percent
decrease while GDP grew. So there has been a (slight) absolute decoupling of greenhouse
gas emissions in the Dutch economy. The greenhouse gas CO2 decoupled only relatively.
Production-based greenhouse gas emissions are equal to the total emissions of the six gases
targeted in the Kyoto Protocol caused by economic production activities (in CO2 equivalents).
This includes greenhouse gas emissions by resident production activities that occur abroad (for
example emissions by airlines or seafaring ships). Direct emissions by households are excluded.
Combustion of fossil fuels, deforestation, but also specific agricultural activities and
industrial processes are the main drivers of the increased greenhouse gas emissions.
Enhanced concentrations of greenhouse gases in the atmosphere will raise global
temperatures by radiative forcing. Climate change is of global concern because of its effect
on ecosystems and social economic development across the planet. A key aim of green
growth is therefore to improve the emission efficiency of production of industries and the
economy as a whole.
Since 2004 total greenhouse gas emissions from production activities have started to
decrease. Energy saving, higher imports of electricity and the financial and economic crisis
are important reasons for the decline of production-based greenhouse gas emissions. Also.
the on-going shift to a more service-based economy affects the emission of greenhouse
gases. Since the production of services tends to be much less emission-intensive than the
production of goods, the rise in the production of services has caused the economy as a
whole to become less emission-intensive. The Netherlands achieved the Kyoto target of a
6 percent reduction of greenhouse gas emissions in the period 2008–2012 (PBL, 2013).
2.2.1 Greenhouse gas emissions and GDP
Index (2000=100)
80
85
90
95
100
105
110
115
120
GDPGreenhouse gas emissions
* Provisional figures.
2012*2011*20102009200820072006200520042003200220012000

26 Green growth in the Netherlands 2012
2.3 Consumption-based greenhouse gas emissions
The total amount of carbon dioxide emissions as a result of Dutch consumption, the
carbon footprint, amounted to 202 Mton CO2 or 12.2 ton per capita in 2009. The per capita
footprint decreased by almost 4 percent compared to 2003. In 2009, 41 percent of the
carbon footprint was due to foreign emissions, primarily in China (19 percent), followed by
Germany (10 percent) and Russia (8 percent).
The carbon footprint consists of the total emissions that occur along the supply chain in
order to produce goods and services that are used in Dutch final demand (consumption and
investment). They consist of domestic (direct and indirect) and foreign emissions.
With increasing globalisation and complex supply chains, emissions embodied in trade are
becoming more important in the global impact of Dutch consumption. The consumption
perspective is important for green growth considerations as it indicates the extent to which
the needs of Dutch consumers contribute to increased emissions of greenhouse gases into
the atmosphere and – indirectly – to climate change.
The difference between the emissions due to Dutch production and Dutch consumption
constitutes what is called an emission trade balance. As the total emissions by the Dutch
economy of CO2– 205 Mton in 2009 – are slightly larger than the consumption emissions,
the emission trade balance for the Netherlands would be positive, although we should
be cautious as the outcome of the footprint calculation is subject to uncertainty. A positive
emission trade balance indicates that greenhouse gases emitted domestically during the
production of exported goods is larger than the greenhouse gases emitted abroad during
the production of goods and services imported by the Netherlands. This reflects both the
emission intensive as the export oriented nature of the Dutch economy.
2.3.1 Consumption-based greenhouse gas emissions
Domestic direct
Foreign
Domestic indirect
0
3
6
9
12
15
20092003
tCO2/capita

Green Growth in the Netherlands 27
2.4 Emissions to water, heavy metals
Between 2000 and 2010 emissions of heavy metals to water were halved, while the
economy grew by 14 percent. This implies that overall the Dutch economy showed a strong
environmental performance in terms of water emission intensity.
Emissions to water of heavy metals reflects the emission of a group of metals with high
toxicity, such as arsenic, cadmium, chromium, copper, mercury, lead, nickel and zinc. The
indicator is calculated in equivalents, which means that the extent of toxicity of each metal is
taken into account (Adriaanse, 1993). Emissions related to run-off and seepage are excluded.
The availability of clean water is essential for humans and nature. However, everyday
surface waters are exposed to discharges of harmful substances by industries and
households, which could cause severe damage to ecosystems in rivers, lakes and
coastal waters. Heavy metals occur naturally in the environment, but are toxic in high
concentrations. In the light of green growth, the development of emissions of heavy metals
by industries and households is relevant, because of its impact on water quality.
Emissions by manufacturing have halved since 2000 through all kinds of technical
measures. The emission intensity has greatly improved in the basic metal, the food and
the chemical industries. In addition, waste water treatment plants have improved their
purification efficiency. Between 2009 and 2010 the reduction in copper emissions was the
largest contributor to the total reduction in those years, as a big chemical polluter closed.
Cadmium, lead and chromium emissions showed the greatest improvements in those years,
while arsenic is the only metal with an increasing discharge. This is caused by a higher
discharged load from the waste water treatment plants.
2.4.1 Emissions to water of heavy metals and GDP
Index (2000=100)
0
20
40
60
80
100
120
140
2010*2009*200820072006200520042003200220012000
GDPHeavy metals to water
* Provisional figures.

28 Green growth in the Netherlands 2012
2.5 Nutrient surpluses
In spite of a continued growth of production and value added in agriculture, the surpluses
of nitrogen and phosphorous in agriculture have decreased significantly in the Netherlands
since 2000: nitrogen by 33 percent and phosphorus by 57 percent.
The nutrient surplus is calculated by subtracting the removal (e.g. uptake by crops and animal
products; manure removal) from the supply (e.g. from feed and fertiliser). Value added is used
as a measure of agricultural output.
The sustainability of agro-food systems is at the centre of green growth considerations.
One of the main challenges in agriculture is to better nutrient management. Lower nutrient
levels have a positive effect on the quality of the soil, groundwater and surface water,
which in turn has a positive effect on biodiversity. Moreover, a lower reliance on nutrients
is desirable as phosphorus is becoming increasingly scarce and the production of nitrogen
fertilisers from elemental nitrogen is very energy intensive.
Intensive livestock farming is the main generator of nitrogen and phosphorus surpluses in
the Netherlands. After effective government measures, the nutrient surpluses have fallen
ever since 2000. The most effective measures were the implementation of different levies
and the decrease of nutrients in concentrates. Although the trend – absolute decoupling –
is good, surpluses are still too high to meet policy targets (PBL, 2010).
2.5.1 Nutrient surpluses and value added in agriculture
Index (2000=100)
0
20
40
60
80
100
120
201020082006200420022000
Nitrogen Value addedPhosphorus

Green Growth in the Netherlands 29
2.6 Waste generation
During the last decade, the waste generated by industries and households fell by almost
8 percent. This can be almost completely attributed to a reduction of mineral waste, which
is the largest waste category. The generation of chemical and metal waste still increased.
At the same time the economy grew by 14 percent. So, there is absolute decoupling with
regard to waste production.
Waste includes all materials for which the generator has no further use for own purpose of
production, transformation or consumption, and which he discards, or intends or is required to
discard. Not included are materials that are directly re-used at their place of origin.
Treatment of solid waste involves recycling, incineration and disposal on landfill sites. Each
treatment method causes different kinds of environmental problems. Waste incineration
results in environmentally damaging gaseous emissions, while disposal on land takes up
space and requires years of maintenance. The main challenge is to reduce waste production
and stimulate economic growth at the same time.
Until 2008, in spite of economic growth and increased consumption, the total amount of
generated waste remained more or less stable. In 2009 and 2010 the economic crisis led
to a decrease in waste production. Waste production was reduced in the chemical industry
and the basic metal industry, but the largest reduction took place in the construction and
demolition sector as a result of reduced building activity due to the economic crisis.
2.6.1 Domestic waste production and GDP
* Provisional figures.
Index (2000=100)
80
85
90
95
100
105
110
115
120
2010*2009*200820072006200520042003200220012000
GDPWaste production

30 Green growth in the Netherlands 2012
2.7 Groundwater abstraction
The abstraction of fresh groundwater in 2011 is about 3 percent less than in 2000.
Manufacturing has reduced its groundwater abstraction from the environment by
20 percent. The abstraction by water supply companies, has gone down by 5 percent. In
agriculture groundwater use is largely dependent on the weather conditions. This caused
high abstraction levels in 2003 and 2006 and although to lesser extend, also in recent years.
Groundwater abstraction intensity, defined as the amount of ground water abstracted per
unit of GDP (in constant prices; price level of 2005), is an indicator for the burden to fresh
groundwater resources from economic production.
One of the key aspects of green growth is how efficiently producers use natural resources.
Although fresh water itself is not scarce in the Netherlands, fresh groundwater stocks in
particular are under continued pressure. This is caused by competing uses, especially in
long periods with warm and dry conditions which seem to become more frequent recently,
as well as the minimum standards required for drinking water. Lowering groundwater
tables and the resulting desiccation have an impact on nature conservation and biodiversity
and on emissions from soil in certain areas.
On average, groundwater intensity, abstraction of groundwater water in litres divided
by GDP, decreased from more than 2.12 litre in 2000 to 1.79 litre in 2011. Arable farming
and livestock breeding showed the highest water use intensity rates, followed by the
manufacturing of paper and paper products, manufacturing of basic metals, other
agriculture, and manufacture of food products, beverages and tobacco products. In 2011
several sectors showed lower groundwater abstraction intensities than in 2000, generally
with the exception of agriculture and the energy sector.
2.7.1 Groundwater abstraction and GDP
* Provisional figures.
Index (2000=100)
80
85
90
95
100
105
110
115
120
2011*20102009200820072006200520042003200220012000
GDPGroundwater abstraction

Green Growth in the Netherlands 31
2.8 Domestic biomass consumption
The level of biomass consumption by Dutch production activities in 2011 was only slightly
higher than in 2000. Between 2000 and 2006 biomass consumption decreased, but it has
increased again in more recent years.
Domestic use of biomass is calculated as the domestic extraction of biomass plus imports
minus exports of biomass products. Biomass intensity is the domestic use of biomass divided
by value added (in constant prices) of the main users (animal farming and other agriculture,
manufacture of foods products and manufacture of wood and paper).
Natural resources provide essential raw materials and derived commodities to support
economic activities. Worldwide population growth and increasing wealth have led to more
demand of natural resources. One of the main challenges in the transition to green growth
is to ensure that materials are used efficiently at all stages of their life-cycle. This can be
monitored in terms of material intensity.
The material intensity of biomass has decreased by 5 percent since 2000. So, biomass is
used more efficiently in the last decade. However, in 2006 the intensity was at its lowest
point (12 percent lower than it was is 2000). This means that, after a period of six years
of decline, nowadays more resources are needed per euro value added. This is caused by
fewer euros of value added because of the economic crisis. On the other hand, domestic
biomass consumption has increased since 2006 as both the imports and extraction of
biomass increased. More biomass consumption and less value added means an increase of
the material intensity over the last years.
2.8.1 Domestic biomass consumption and value added main users
* Provisional figures.
Index (2000=100)
80
85
90
95
100
105
110
115
2011*20102009200820072006200520042003200220012000
Value added of main usersDMC biomass

32 Green growth in the Netherlands 2012
2.9 Domestic metal consumption
The domestic use of metals saw fluctuations of more than 20 percent. In 2011, the level
was more or less the same as it was in 2000. Because of these fluctuations and because
both domestic use and value added grew in some years it cannot be said that there was
absolute decoupling during this period.
Domestic use of metals is calculated as the domestic extraction of metals plus imports minus
exports of metal products. Metal intensity is the domestic use of metals divided by value added
(in constant prices) of the main users of metals (manufacture of basic metals, metal products,
computers, electrical equipment, machinery, motor vehicles and other transport equipment).
Material resources provide essential raw materials and other commodities to support
economic activities. Worldwide population growth and increasing wealth have led to a
greater demand of natural resources. One of the main challenges in the transition to green
growth is to ensure that materials are used efficiently at all stages of their life-cycle. This
can be monitored in terms of material intensity.
The domestic use of metals has fluctuated during the last decade. There is no extraction of
metals in the Netherlands. Import levels caused the fluctuations as they differ significantly
from one year to the next. The amount of exported metals was more or less stable. The
resource efficiency of metals also fluctuated greatly between 2000 and 2011, making it
difficult to draw any conclusion from the results.
2.9.1 Domestic metal consumption and value added main users of metals
* Provisional figures.
Index (2000=100)
0
20
40
60
80
100
120
140
2011*20102009200820072006200520042003200220012000
Value added of main usersDMC metals

Green Growth in the Netherlands 33
2.10 Domestic mineral consumption
In 2011 the domestic consumption of minerals was above the 2000 level. The value added
of industries using minerals in their production process was above the 2000 level as
well. This means that in 2011 there is no decoupling. Between 2008 and 2010 there was
absolute decoupling because the domestic use of minerals increased while value added of
the main users decreased.
Domestic consumption of minerals is calculated as the domestic extraction of minerals plus
imports minus exports of mineral products. Excavated soil is excluded here as this largely
consists of sand used for infrastructure projects. The value added (in constant prices) is the
sum of values added of relevant industries (manufacture of non-metallic mineral products,
construction of buildings, roads and others).
Material resources provide essential raw materials and other commodities to support
economic activities. Worldwide population growth and increasing wealth have led to more
demand of natural resources. One of the main challenges in the transition to green growth
is to ensure that materials are used efficiently at all stages of their life-cycle. This can be
monitored in terms of material intensity, which is defined as kilos minerals consumption
per euro value added of the main users.
The domestic consumption of minerals has increased since 2007. At the same time the value
added of the relevant industries has decreased. So, the mineral intensity rose sharply due to
the economic crisis in 2008 and the rising consumption. This means that more minerals are
needed per euro value added. As intensity in 2011 was up by 11 percent on 2000, minerals
are not used more efficiently.
2.10.1 Domestic mineral consumption and value added main users of minerals
* Provisional figures.
Index (2000=100)
40
50
60
70
80
90
100
110
Domestic use minerals Value added of main users
2011*20102009200820072006200520042003200220012000

34 Green growth in the Netherlands 2012
2.11 Net domestic energy use
The net domestic energy use of industries has gone up by 6 percent since 2000 while
GDP rose by almost 14 percent. So there is relative decoupling between energy use and
economic growth. Since 2005, total energy use has stabilised. Net energy use increased in
aviation, the chemical sector, and refineries whereas it fell in horticulture, water transport
and the manufacturing of food products.
Net domestic energy use is equal to the total amount of energy used in an economy through
production and consumption activities. This includes all final energy use for energetic and non-
energetic purposes plus conversion losses. Energy use for production activities is included while
energy use by households is excluded here.
Energy is essential to the economy as input for production processes and as a consumer
commodity. The production and use of non-renewable energy often have a negative impact
on the environment (emissions of CO2 and other air pollutants) and are directly related to
the depletion of these energy resources. So improving energy efficiency and decoupling
energy consumption from economic growth are key objectives for green growth.
Economic growth has been the driving force of the increase of energy use by industries,
which was only partially negated by an increase of energy efficiency of production
processes. As companies have implemented various energy conservation measures, energy
is used more efficiently in production processes. Manufacturers have improved energy
management, optimised production processes and widely adopted energy conservation
technology. In horticulture, energy efficiency has been improved by using CHP (combining
heat and power) installations. The overall result is a 7 percent decrease of the energy
intensity, the energy use per euro value added, since 2000.
2.11.1 Net domestic energy use and GDP
* Provisional figures.
Index (2000=100)
80
85
90
95
100
105
110
115
120
2012*2011*20102009200820072006200520042003200220012000
Net domestic energy use GDP

Green Growth in the Netherlands 35
2.12 Renewable energy
The share of renewable energy sources in Dutch final energy consumption went from
1.4 percent in 2000 to 4.4 percent in 2012. Renewable energy is primarily produced from
biomass.
The share of renewable energy is defined as the percentage of total gross final energy
consumption accounted for by renewable energy. Apart from wind and biomass, renewable
energy sources include hydropower, solar energy and geothermal and aerothermal heat.
The production of renewable energy plays a key role in greening the energy sector, and
thereby the energy supply for the whole economy. Renewable energy together with energy
efficiency reduces carbon dioxide emissions. It also improves energy reliability, because
renewable energy is produced locally or imported from different regions than fossil fuels
are. However, currently, renewable energy is much more expensive than fossil energy and
needs government support in the form of subsidies or obligations.
Compared with total energy consumption, renewable energy use increased only slowly
between 2000 and 2003. Then it rose more rapidly thanks to government subsidies for
the production of renewable electricity. Also, suppliers of petrol and diesel had to blend
their products with biofuel. According to the calculations of PBL and ECN, the national
Energy Agreement may lead to a maximum share of renewable energy of 14 percent in
2020, assuming an optimistic estimate for the realizations of certain options for renewable
energy (PBL and ECN, 2013).
2.12.1 Share of renewable energy sources in total energy use
% of gross final energy consumption
Wind Biomass Other
20122011201020092008200720062005200420032002200120000
1
2
3
4
5

36 Green growth in the Netherlands 2012
2.13 Waste recycling
Since 2000, the percentage of recycled waste has remained more or less constant. Far less
waste was deposited in landfills and far more waste was incinerated.
Total generation of waste is divided into several treatment methods and measured in
megatonnes. Waste can be disposed on land, incinerated or recycled. Recycling excludes
incineration with the purpose of generating energy. Generated waste includes waste generated
by industry and households. Incineration with the purpose of generating energy is not included
in these figures.
The volume of generated waste is only partly indicative of its pressure on the environment.
According to the waste treatment hierarchy of prevention, reuse, recycling, recovery,
energy recovery, incineration and, least favoured, deposits on land, the shift from landfill
to recycling and recovery has resulted in less pressure on the environment. Moreover,
effective recycling and the reuse of waste are important in the green growth strategy, as
using recycled materials often has a lower impact on the environment than using primary
materials. In addition, waste recycling can be regarded as an economic opportunity to
recover secondary resources, resulting in less material intensive economic growth and more
employment.
Increased recycling and incineration are largely the result of stricter policies on the
minimum standard for waste treatment formulated in the national waste management
programme (www.lap2.nl). Recycling is the favourite kind of waste treatment for all types
of waste. The percentage differs between the different types of waste, but 69 percent of
total waste was recycled in 2010.
2.13.1 Waste treatment
* Provisional figures.
Index (2000=100)
0
20
40
60
80
100
120
140
160
2010*2009*200820072006200520042003200220012000
Deposit to land Recycling Incineration

Green Growth in the Netherlands 37
2.14 Energy reserves
The remaining oil and gas reserves in the Netherlands have decreased by 36 percent since
2000. Although a small new reserves has been discovered in recent years, just 4 billion Sm3
in 2012, the overall number of new discoveries has fallen. The slight increase in energy
reserves in 2009 was primarily the result of an upward revaluation of existing reserves.
The expected reserve is the remaining volume of gas and oil, based on geological surveys,
which is assumed to be extractable with existing technology and in current prices at a given
point in time.
The Netherlands has significant quantities of natural gas as well as some smaller oil
deposits. Green growth aims to avoid unsustainable pressure on natural assets. However,
there are different definitions of sustainability. According to the weak interpretation of
sustainability, a policy that lets stock value increase even if physical reserves decrease
is deemed sustainable as it provides possibilities for substitution. Green growth, on the
other hand, has more in common with the so-called strong interpretation of sustainability,
which emphasizes the use of physical indicators to monitor whether certain resources are
reaching critical levels or even exceeding thresholds.
Ever since their discovery, the natural oil and gas reserves in the fifties and sixties have
been exploited. The extraction of natural gas makes a significant contribution to the
Dutch Treasury and to economic growth. These resources are not inexhaustible, however.
Although new reserves are discovered occasionally, we assume that much of the initial
gas reserves has already been extracted. At the end of 2012, known natural gas reserves
were enough for just 15 years. This is based on the net production in 2012. The decreasing
total stock is perceived as an indicator of unsustainable behaviour, as stocks are likely to
run out within decades – given the current extraction rates and the absence of significant
discoveries and revaluations.
2.14.1 Energy reserves
* Provisional figures.
billion Sm3
0
200
400
600
800
1,000
1,200
1,400
1,600
1,800
2,000
2012*2011*20102009200820072006200520042003200220012000

38 Green growth in the Netherlands 2012
2.15 Stocks of standing timber
Stocks of standing timber have increased since 2000 by nearly 1 million m3 (over bark)
annually. In 2010, the standing stock amounted to 70.0 million m3. The timber production
of Dutch forests was relatively stable in this period, at around one million m3 (under bark).
Developments in stocks of standing timber (live plus standing dead wood) are expressed in
million m3 of round wood equivalents (over-bark). Presented stocks are estimates.
The availability and quality of forest are key factors in economic activity and welfare
and hence important for green growth. In economic terms, forestry is relatively small in
the Netherlands; the main benefits derived from forests are recreation and biodiversity.
Nevertheless, stocks of standing timber provide a good indicator as they also indirectly
cover increases in forest areas.
The increase of standing timber is largely the result of a continuous increase in forest
area. Although stocks of timber have increased, imports of timber far outweigh domestic
production by a factor of 22. Therefore, most of the potential environmental pressure
caused by the use of timber occurs abroad. The Netherlands imports most of its timber from
within Europe. The environmental impact of this wood is relatively modest, as most of the
forests are managed sustainably. Tropical timber accounts for about 4 percent of imports.
As a result of the economic crisis, the use of tropical wood has decreased since 2008.
2.15.1 Stocks of standing timber
Source: Probos.
million m3
0
10
20
30
40
50
60
70
80
201020052000

Green Growth in the Netherlands 39
2.16 Stocks of fish
Due to catch limits from the European Union some stocks of fish in the North Sea are
recovering, but not all fish species are above their precaution limit. Constant monitoring of
stocks is of great importance to control the sustainability of fish for the economy as well as
for biodiversity.
The share of five fish species that are important for consumption (herring, cod, plaice, sole and
haddock) in the North Sea that is above the precaution level.
Fish stocks are global commons, i.e. natural resources shared by several countries, and
therefore sensitive to over-exploitation. This poses a threat to the quality and quantity of
future fish stocks. Furthermore, modern fishing methods have undesirable side-effects, such
as overfishing and sea floor damage. European fishery policy is aimed at sustainability by
way of a balanced exploitation of the seas. The main policy instruments are restrictions on
annual total catches for a number of commercially important fish species, and restrictions
on the capacity and activity of the fishing fleet. In 2013 the EU issued a policy for the next
10 years in which sustainability from ecological, economic and social point of view is
central (EU, 2011).
Sustainable fishery is important for aquatic biodiversity and plays an important role for the
economy. The relation between the economy and the quality of stocks is indicated by the
share of five important fish species for consumption which are above the precaution limits
for reproduction. Thanks to the EU catch limits some of the fish stocks are recovering, but
not all fish species are above their precaution limit, but there has been an upward trend
since 2000. The volume of the domestic fish catch fell by 27 percent between 2000 and
2011.
2.16.1 Stock of �ve �sh species above the precaution limit
0
1 of 5
2 of 5
3 of 5
4 of 5
5 of 5
20132012201120102009200820072006200520042003200220012000
Source: ICES (2013).

40 Green growth in the Netherlands 2012
2.17 Land conversion into built-up land
The area of built-up land in the Netherlands is increasing steadily. The average changes
in the share of built-up land in the total land area is 0.1 percent a year. The area of
agricultural land decreased, that of nature areas stayed the same.
Land conversion into built-up land is the change in the share of the built-up area in the total
land surface.
The Netherlands is one of the most densely populated countries in the world, so space is
very scarce. The competition between different uses of space is an environmental problem.
Built-up areas are important for living and working. They are using up more and more
space as land is still being converted. The conversion of nature, forests, and agricultural
land into build-up land can be seen as a measure for the pressure on the ecosystems and
biodiversity.
The increase of built-up land mainly is at the expense of agricultural land, but it also
affects natural areas and their biodiversity. Policy will protect and improve the quality of
nature (allocating and implementing plans for Natura 2000 areas1)). By linking existing and
planned natural areas for the national ecological network of protected areas, agricultural
land was converted into nature and forest.
1) Natura 2000 areas are protected according to the EU Natural Habitats Directive (92/43/EC).
2.17.1 Land conversion into built-up land, yearly changes
0
0.02
0.04
0.06
0.08
0.10
0.12
2008200620032000
%

Green Growth in the Netherlands 41
2.18 Farmland birds
Changes in agriculture cause a moderate decrease in the presence of farmland birds in the
Netherlands over the years. Most species show a strong or moderate decrease.
The farmland bird index is an index of farmland bird species (13 of the 36 European farmland
bird species).
Biodiversity interrelates with changes in land use and many local environmental factors,
such as water pollution. In a global perspective it relates to more general themes like
climate change and the growing population. Therefore, measuring biodiversity can be
regarded as a central theme in green growth. In the Netherlands, most pressure is caused
by agriculture, and the farmland bird index is therefore a suitable indicator for the relation
between the economy and biodiversity.
A decrease of the European Farmland Bird Index is caused by intensive use of cultivated
land, changes in the choice of crops, water pollution by nutrients and pesticides, and
the increase of scale in agriculture. Therefore specific elements in the landscape have
disappeared. Also loss of breeding habitat, caused by developments of urban areas and
infrastructure play a key role in the decrease.
2.18.1 Farmland bird index
index (2000=100)
0
20
40
60
80
100
120
2012201120102009200820072006200520042003200220012000

42 Green growth in the Netherlands 2012
2.19 Urban exposure to particulates
The annual average concentration of particulate matter (PM10) in urban areas has
decreased slightly since the year 2000. Although the trend is downward in the long term,
there can be considerable yearly differences. For instance 2006 saw an increase whereas
2008 and 2012 saw large decreases. These are mainly due to differences in weather
conditions.
Particulate matter consists of particles of less than 10 micrometres in diameter. The European
limit value is 40 µg for the annual average and the daily average should not exceed 50 µg
more than 35 times per calendar year.
Pollution affects human health and ecosystems alike. Exposure to particulate matter is a
major part of air pollution. The particles can penetrate deeply into the lungs and can cause
inflammation, asthma, chronic bronchitis and cardiovascular disease. Since pollution is
mostly the result of production and consumption, it is important to assess this aspect in the
framework of green growth.
The big decrease from 2011 to 2012 is because of many rainy days during the fall of
2012. The general decreasing trend in exposure to particulate matter is the result of the
introduction of pollution-reducing technologies, such as filters, in the manufacturing
and transport sectors. Emissions of PM10 by economic activities have been reduced by
36 percent between 2000 and 2012. A large part of the PM10 that is the result of direct
actions of humans is coming from abroad.
2.19.1 Annual average concentration of PM10 particles in urban areas
Source: RIVM (2013).
0
10
20
30
40
2012201120102009200820072006200520042003200220012000
µg/m3

Green Growth in the Netherlands 43
2.20 Chemical quality of surface waters
In 2009, 75 percent of the Dutch surface water bodies complied with the European
environmental quality standards for 33 priority substances. The most important chemical
substances in this compliance check are tributyltin, cadmium and five Polyaromatic
Hydrocarbons (PAH’s).
2.20.1 Chemical quality of surface water bodies
%
% in compliance
Source: Rijkswaterstaat.
20122011201020092008200720062005200420032002200120000
20
40
60
80
100
The percentage of 680 Dutch surface water bodies complying with the environmental quality
standards of the Water Framework Directive for 33 selected priority substances. For the
Netherlands, the overall result of the chemical quality monitoring depends strongly on the
substances tributyltin, cadmium and PAH’s. The compliance check is only available for the year
2009 and is published in the River Basin Management Plans. The next compliance check will be
published in 2015.
The availability of sufficient fresh water resources of good quality is a basic prerequisite
for humans and their economic activities. This works in two ways. Economic growth is
only possible when sufficient reliable water resources are available. But economic growth
must not lead to decreasing water quality and over-exploitation of water resources. The
challenge in green growth is to find the right balance.
Chemical pollution of surface water threatens the aquatic environment and can lead to
acute and chronic toxicity to aquatic organisms, accumulation in the ecosystem, losses
of habitats and biodiversity and to threats to human health. Most pollution can be
directly linked to economic activities. Measures aim to reduce these emissions, even to
zero. Because the monitoring and reporting on the water quality standards of the Water
Framework Directive has a 6-year cycle, it is too early to evaluate the effect of these
measures on the chemical quality (Statistics Netherlands et al, 2012a).

44 Green growth in the Netherlands 2012
2.21 Ecological quality of surface waters
In 2009, only 0.5 percent of the Dutch surface water bodies complied with the European
ecological quality standards according to the Water Framework Directive (WFD). This low
score is mainly due to their poor biological quality, but also to exceeding concentrations of
substances like nutrients, heavy metals and other persistent pollutants.
2.21.1 Ecological quality of surface water bodies
%
% in compliance
Source: Rijkswaterstaat.
20122011201020092008200720062005200420032002200120000
20
40
60
80
100
The percentage of 720 selected Dutch surface water bodies complying with the ecological
quality standards of the Water Framework Directive. The ecological quality is determined on the
basis of several tests, like the species composition of algae, macro-invertebrates, water plants
and fish, hydro morphological characterization, physicochemical quality and standards for a
selection of heavy metals and toxic hydrocarbons.
The ecological quality is a measure for the health of surface water. The availability of
healthy fresh water resources is a key factor for green growth. Healthy water bodies can
contribute in general to human well-being through their different uses such as bathing,
fishing, recreational shipping, water for the preparation of potable water.
The poor ecological quality of the Dutch surface waters is caused by the presence of
persistent chemicals due to historical emissions, eutrophication caused by high nutrient
concentrations, disappearance of natural habitats and natural banks due to modification
of water courses and the widespread use of weirs and pumping stations, which hampers
the migration of fish (Statistics Netherlands et al, 2012a). Many measures are being taken
to lower the negative impact of these causes, for instance restoring the natural course of
brooks, building fish passages near weirs and reducing pollutant discharges. The first effects
of these measures can be evaluated in 2015, after the second issue of the River Basin
Management Plans.

Green Growth in the Netherlands 45
2.22 Nitrate in groundwater
The average nitrate concentration in the upper groundwater layer has fallen so much that
the target value of 50 mg/l was met in 2010. Concentrations have already been below the
target for several years, especially in regions with clay and peat soil. For sandy soils the
target was first met in 2010, whereas concentrations are still too high in regions with loess.
The average nitrate concentration is weighted for the areas representative for the samples of
groundwater. The data are corrected for variations in weather and sample composition.
Green growth requires a healthy balance with the required natural resources, like
groundwater. In the Netherlands groundwater serves to prepare drinking water. Washing
out of nitrogen to the groundwater threatens its quality. High concentrations of nitrate
can lead to closure of abstraction points or higher purification costs. A key determinate of
the nitrate concentration in the groundwater is the nitrogen surplus in the soil balance of
farms. In order to reduce the load of nitrogen to soil and groundwater, the standards for
applying nitrogen on agricultural soils are being accentuated stepwise. The effect on nitrate
content is already visible and will improve.
There is a large spread in the nitrate concentrations between agricultural use, types of farm
and regions with different soil types. Among arable farms the concentrations are generally
higher than among dairy farms. In the southern part of the sand region the concentrations
are generally higher due to a larger occurrence of crops and soil types that are sensitive to
washing out (CBS,PBL,WUR, 2012b). The higher value for 2008 can be explained by lower
precipitation in that year.
2.22.1 Average concentration of nitrate in upper groundwater layer of 2.22.1 agricultural sandy soils
%
Source: RIVM landelijk meetnet grondwaterkwaliteit
0
10
20
30
40
50
60
70
80
90
100
2010200920082007200620052004200320022001

46 Green growth in the Netherlands 2012
2.23 Level of concern
The number of people who think that air, water and soil are strongly polluted has
decreased from around 60 percent in 2002 to 40 percent in 20122). Concern for the
economic situation and security/ crime on the other hand has increased.3)
2.23.1 Level of concern
0
10
20
30
40
50
60
70
20122002
%
The level of concern for the environment is based on the number of people aged 18 years and
older who think that air, water and soil are strongly polluted.
The environment is an important determinant of health status and general wellbeing.
Subjective measures of people’s perception about the quality of the environment capture
other elements of green growth that indicate the social context of greening growth. This
indicator measures the level of concern for the environment.
Concern for the environment has dropped significantly in the last ten years. The survey
results show not much differences between age groups. With 43 percent, young people
up to 25 years, are slightly more concerned for the environment than older people (39 to
40 percent), but are less willing to pay. Women are more concerned for the environment
(45 percent) than men (35 percent). On the other hand, men are more willing to pay extra
taxes to protect the environment (26 percent) than women (22 percent). From the people
who think that air, water and soil are strongly polluted only 30 percent is willing to pay
more taxes to protect the environment.
2) It is important to mention that there were a few differences between the survey in 2000-2002 and 2012 with regard to the wording, context of the questions and the survey mode. This may have had an impact on the results. Nevertheless, the decrease is expected to be real, since other studies also suggest that the level of concern for environmental issues has decreased (Statistics Netherlands 2011, PBL 2010).
3) See also http://www.compendiumvoordeleefomgeving.nl/indicatoren/nl0040-Belangstelling-maatschappelijke-problemen.html?i=15-12.

Green Growth in the Netherlands 47
2.24 Willingness to pay
In 2012 only 24 percent of the population had the willingness to pay extra taxes to protect
the environment. In 2002 this was still around 44 percent4).
2.24.1 Willingness to pay
0
10
20
30
40
50
20122002
%
The indicator willingness to pay addresses the willingness to pay more taxes to protect the
environment. The survey was conducted among people over 18 years old.
The environment is an important determinant of health status and general wellbeing.
Subjective measures of people’s perception about the quality of the environment capture
other elements of green growth that indicate the social context of greening growth. This
indicator shows the willingness to pay to protect the environment.
There are large differences between income groups for this indicator. Only 17 percent of
low income groups is willing to pay more taxes. For the middle incomes, this increases
to 21 percent and 39 percent of the high income groups are willing to pay more taxes to
protect the environment. Contrarily, the level of concern is the lowest for high incomes
groups. The level of concern is comparable to low and middle incomes. The willingness to
pay more taxes to protect the environment decreases from 30 percent in urban areas to 20
percent in rural areas. This is consistent with the observed concern for the environment.
People in urban areas are more concerned for the environment (44 percent) than people in
rural areas (35 percent).
4) It is important to mention that there were a few differences between the survey in 2000-2002 and 2012 with regard to the wording, context of the questions and the survey mode. This may have had an impact on the results. Nevertheless, the decrease is expected to be real, since other studies also suggest that the level of concern for environmental issues has decreased (Statistics Netherlands 2011, PBL 2010).

48 Green growth in the Netherlands 2012
2.25 Environmental subsidies and transfers
Environmentally motivated subsidies and transfers provided by the government increased
from 764 to 1,158 million euros in the period 2005–2010. The share in total government
expenditure remained more or less stable around 0.6 percent.
Environmental subsidies include only the so called explicit subsidies on environmental
protection, which are direct monetary transfers from the government to the beneficiaries.
Environmental subsidies are important economic instruments for achieving national
environmental policy objectives and for compliance with international agreements. Explicit
subsidies receive a great deal of attention in the political arena. Environmental subsidies
are used to promote a wide variety of activities that aim to protect the environment, use
resources more efficiently and safeguard natural resources through better management.
Environmental subsidies and transfers can be allocated to the different environmental
domains. The share of the production of energy from renewable resources and energy
savings was 77 percent in 2010. The second largest objective in 2010 is the Protection of
biodiversity and landscape with 13 percent and the Protection of ambient air and climate
with 6 percent. With a share of 58 percent the MEP/SDE scheme to stimulate the production
of renewable energy by far is the most important environmental subsidy provided by the
Dutch government. Environmentally motivated Implicit subsidies (foregone tax revenues
due to various tax measures) amount to 600 million euros in 2010.
2.25.1 Environmental transfers/subsidies as a percentage of total government expenditure%
0
0.1
0.2
0.3
0.4
0.5
0.6
0.7
0.8
201020092008200720062005

Green Growth in the Netherlands 49
2.26 Implicit tax rate for energy
During the last decade the implicit tax rate for energy increased from 2.3 euros/GJ in 2000
to almost 3.2 euros/GJ in 2012. This means that energy use is more heavily taxed.
The implicit tax rate for energy is calculated by dividing the energy related taxes (excise duties
on petrol and other motor fuels and tax on electricity and gas use) by net energy use.
Many countries have set up energy taxes as an economic instrument aimed at
implementing environmental liability and achieving the Kyoto Protocol objectives. The
implicit tax rate for energy gauges the development of the average tax burden on energy
use. A shift in taxation from labour to energy consumption must foster energy efficiency.
The indirect costs to society for pollution due to energy use (so-called externalities) are
somehow compensated for by taxing energy use.
The rise in the implicit tax rate for energy is caused by higher rates for excise duties on
motor fuels and the tax on electricity and gas use, which is levied on the use of electricity
and natural gas. The implicit tax rate is relatively higher for the service industries than for
manufacturing, as energy tax rates for bulk users are usually much lower than for small-
scale users. The implicit tax rate for energy rose until 2006. It saw a small dip in 2007 as
energy tax yielded lower revenues because the winter of 2007 was relatively warm, so the
demand for natural gas was lower. The small dip in 2012 was due to lower revenues from
excise duties.
2.26.1 Implicit tax rate for energy
* Provisional figures.
euro/GJ
0
0.5
1.0
1.5
2.0
2.5
3.0
3.5
4.0
2012*2011*20102009200820072006200520042003200220012000

50 Green growth in the Netherlands 2012
2.27 Mitigation expenditure by the government
Climate change mitigation expenditure by central government increased from 900 million
euros in 2007 to more than 1.1 billion euros in 2010. In 2010, mitigation expenditures
equalled 0.23 percent of GDP.
Preventative climate policy, or mitigation policy, focuses on reducing greenhouse gas emissions
by industries and households. Expenditures for climate change adaptation are not included.
Governments play a key role in fostering green growth by setting framework conditions
that stimulate greener production and consumption through economic and other
instruments. The main challenge is to harness environmental protection as a source of
growth and of international competitiveness, trade and employment. Important in this
respect is climate change mitigation which is essentially any activity that serves to reduce
greenhouse gas emissions to the atmosphere.
Almost 90 percent of all climate change mitigation expenditure was spent by central
government. Other key players are the provinces and municipalities. Water boards play no
role in mitigation policy. Most of the budget was spent on subsidies, around 836 million
euros, primarily stimulating renewable energy production. Another important category
was mobility, for example stimulating energy efficient driving and green seats in aviation.
The mitigation policy resulted, among other things, in raising the percentage of renewable
energy production.
2.27.1 Mitigation expenditure as a percentage of total government expenditure2.27.1 and GDP
Mitigation expenditures as a percentage of GDP
Mitigation expenditure as a percentage of total government expenditures
0
0.1
0.2
0.3
0.4
0.5
2010200820082007
%

Green Growth in the Netherlands 51
2.28 Environmental taxes and fees
Between 2000 and 2012 the share of environmental taxes in total taxes and social
contributions has decreased slightly, indicating no progress with regard to green tax reform.
The government collected 21 billion euros of environmental taxes in 2012. This was 9.2
percent of total government tax revenues including social contributions.
An environmental tax is a tax whose tax base is a physical unit (or a proxy of it) of something
that has proven any specific negative impact on the environment. The share is calculated by
dividing the sum of environmental taxes and environmental fees by the sum of total taxes and
social contributions received by the government.
Environmental taxes can be used as policy instrument to change behaviour: they put a
price on the harmful side effects of activities on the environment, and raise revenues.
Environmental tax reform aims to shift the tax burden away from taxes on income and
capital and towards taxes on consumption, pollution, and inefficient use of energy and
resources. This shift can be monitored by looking at environmental taxes as a percentage of
total taxes and social contributions.
No major new initiatives for environmental tax reform have been undertaken since 2000.
The introduction of the packaging tax and the (temporary) introduction of a tax on air travel
have had little effect on the overall share of these taxes. Most of the environmental taxes
were imposed on energy and transport. Important revenue-generating environmental taxes
are excise duties on petrol and other motor fuels, motor vehicle tax and tax on electricity
and gas use. In 2012 the lower revenues of excise duties and a dip in car sales caused much
of the decline in environmental tax revenues for the government. Other reasons were the
abolition of the groundwater tax and the waste tax in January 2012.
0
2
4
6
8
10
12
2012*2011*20102009200820072006200520042003200220012000
2.28.1 Share of environmental taxes and environmental fees
* Provisional figures.
%

52 Green growth in the Netherlands 2012
2.29 Environmental protection expenditures
The environmental expenditures as a percentage of GDP gradually decreased from
2.2 percent of GDP in 2000 to 1.8 percent in 2009, indicating that relatively fewer financial
resources have been committed for the protection of the environment.
Environmental expenditures measure the costs of implemented technologies intended to
protect, restore or improve the environment. These include capital costs, current operation costs
and personnel costs.
Environmental expenditures are an important factor in realising a greener growth path.
Cleaner technologies make production processes less harmful to the environment.
In addition, production of environmental technologies by specialised producers may
contribute to economic growth. The Dutch government, in cooperation with the private
sector, takes all kinds of environmental protection measures. These result in costs for
industries, households and the government itself. Environmental protection includes all
measures aimed to prevent the damaging consequences of human activities or acts on the
environment. It includes expenditures by measures to improve the environmental quality of
air, water (including waste water), soil and groundwater, waste and noise.
In 2009 government and industries bore an almost equal share of the environmental
expenditures: 4.9 billion euros for government against 4.8 billion euros for industries. In
2000 the government bore a greater burden of the environmental costs than industries:
4.5 billion euros for government and 3.9 billion euros for industries. More environmental
activities have shifted from government to industries.
2.29.1 Environmental expenditures (in current prices) as percentage of GDP
%
0
0.5
1.0
1.5
2.0
2.5
3.0
2009200820072006200520042003200220012000

Green Growth in the Netherlands 53
2.30 Green patents
The share of patent applications in total Dutch patent applications submitted to the
European Patent Office (EPO) classified as green technology patents rose from 4.0 percent
in 2000 to 8.5 percent in 2009. The number of Dutch green patent applications submitted to
the EPO increased from 157 in 2000 to 396 in 2009.
Green patents are patents of technology concerning waste, wind power, geothermal energy
and biomass, submitted by Dutch applicants to the European Patent Office. The selection is
based on the international patent classification code.
Technological developments and innovation are important drivers for economic growth
and productivity. Innovations focusing on cleaning current technologies and developing
new green technologies are essential to green economic growth. As patent data give an
indication of the inventiveness of a country, green patents are indicative of innovators being
able to anticipate the new economic opportunities involved in greening economic growth.
The total number of Dutch patent applications to EPO has increased by 15 percent
between 2000 and 2009, but the number of green patents has increased much faster.
This can be interpreted as an increase in inventiveness regarding cleaner technologies
in the Netherlands. In addition, it can be interpreted as knowledge-intensification of the
economy and associated competences of green technologies. Around 60 percent of all
patent application relate to environmental inspection and monitoring. 10 percent relates
to air pollution and 11 percent to renewable energy. Most green patent applications were
submitted by manufacturing, particularly by manufacturers of chemical products, machinery
and electrical equipment.
2.30.1 Share of green patents in total patent applications submitted to EPO
0
1
2
3
4
5
6
7
8
9
10
%
2009*200820072006200520042003200220012000
* Provisional figures.
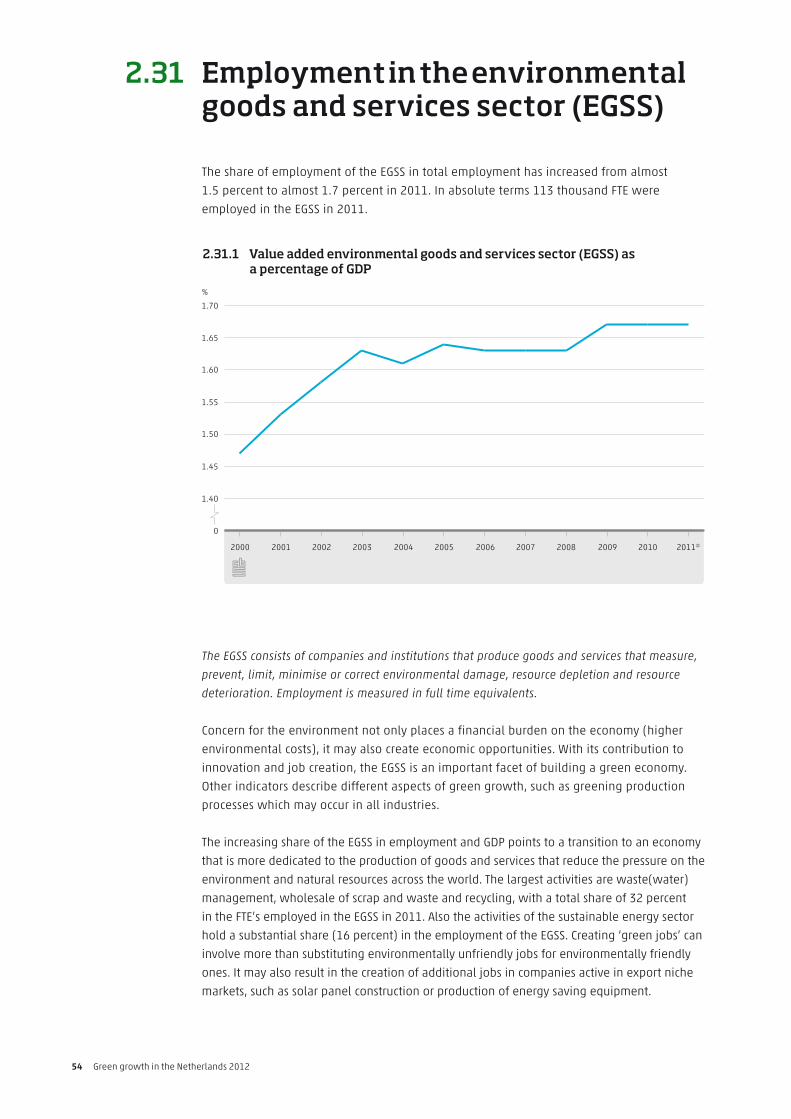
54 Green growth in the Netherlands 2012
2.31 Employment in the environmental goods and services sector (EGSS)
The share of employment of the EGSS in total employment has increased from almost
1.5 percent to almost 1.7 percent in 2011. In absolute terms 113 thousand FTE were
employed in the EGSS in 2011.
The EGSS consists of companies and institutions that produce goods and services that measure,
prevent, limit, minimise or correct environmental damage, resource depletion and resource
deterioration. Employment is measured in full time equivalents.
Concern for the environment not only places a financial burden on the economy (higher
environmental costs), it may also create economic opportunities. With its contribution to
innovation and job creation, the EGSS is an important facet of building a green economy.
Other indicators describe different aspects of green growth, such as greening production
processes which may occur in all industries.
The increasing share of the EGSS in employment and GDP points to a transition to an economy
that is more dedicated to the production of goods and services that reduce the pressure on the
environment and natural resources across the world. The largest activities are waste(water)
management, wholesale of scrap and waste and recycling, with a total share of 32 percent
in the FTE’s employed in the EGSS in 2011. Also the activities of the sustainable energy sector
hold a substantial share (16 percent) in the employment of the EGSS. Creating ‘green jobs’ can
involve more than substituting environmentally unfriendly jobs for environmentally friendly
ones. It may also result in the creation of additional jobs in companies active in export niche
markets, such as solar panel construction or production of energy saving equipment.
2.31.1 Value added environmental goods and services sector (EGSS) as2.33.1 a percentage of GDP
0
1.40
1.45
1.50
1.55
1.60
1.65
1.70
2011*20102009200820072006200520042003200220012000
%

Green Growth in the Netherlands 55
2.32 Employment sustainable energy sector
The sustainable energy sector (SES) accounted for 0.28 percent of total employment in
2011. This share has gradually increased since 2008. The share of the value added in the
renewable energy sector in the GDP is higher (0.4 percent). This expresses the relative
labour extensive nature of the sector.
2.32.1 Share of sustainable energy sector in2.32.1 total employment%
0
0.05
0.10
0.15
0.20
0.25
0.30
2011*201020092008
The sustainable energy sector consists of companies and institutions that physically produce
renewable energy, as well as companies preceding in the value chains. Apart from renewable
energy, the sustainable energy sector also includes companies and institutions that focus on
energy saving activities.
Both the exhaustibility of natural reserves of fossil fuels and the emissions related
to the consumption of fossil fuels increase the importance of the sustainable energy
sector, which is part of the EGSS, becomes more and more important. Newly developed,
rapidly developing energy systems, such as wind and solar energy, contributed also to
employment in the Dutch economy. In the light of green growth the focus is on stimulating
the increasing use of these systems for renewable energy as well as energy saving.
The sustainable energy sector consists of two phases: the pre-exploitation phase and the
exploitation phase. The first consists of producers active in energy saving and sustainable
energy systems. The second phase consists of producers of renewable energy. In 2011,
the sustainable energy sector was responsible for 16 percent of the employment in the
environmental goods and services sector (EGSS). Of this 16 percent 14 percent was created
in the pre-exploitation phase and the remaining 2 percent was created in the exploitation
phase. Total employment of the sustainable energy sector in 2011 was more than
13 percent higher than in 2008. In 2011 the employment in the sustainable energy sector
was 19.1 thousand FTE.
56 Green growth in the Netherlands 2012
2.33 Value added environmental goods and services sector (EGSS)
The EGSS contributed 14.3 billion euros to the Dutch gross domestic product in 2011. The
contribution of the environmental goods and services sector (EGSS) to GDP has increased
from 2 percent in 2000 to 2.4 percent in 2011. So in relative terms the EGSS has become
more important for the Dutch economy.
2.33.1 Value added environmental goods and services sector (EGSS) as2.33.1 a percentage of GDP
* Provisional figures.
0
1.6
1.7
1.8
1.9
2.0
2.1
2.2
2.3
2.4
2.5
2011*20102009200820072006200520042003200220012000
%
The EGSS consists of companies and institutions that produce goods and services that measure,
prevent, limit, minimise or correct environmental damage, resource depletion and resource
deterioration.
The production of environmental goods and services reflect a key aspect of economic
opportunities which arise in a greener economy. The main challenge is to foster production
of the EGSS across a wide range of economic sectors and to strengthen the export
competitiveness of the sector.
The Dutch EGSS consists of companies and institutions participating in various activities.
Waste(water) management, wholesale of scrap and waste and recycling play a significant
role (ca. 51 percent). The activities of the sustainable energy sector are the second most
important within the EGSS in terms of value added, 17 percent of the value added in the EGSS.
The remainder of total value added is generated by a variety of different activities, including
manufacturers of environmental equipment, environmental advice and engineering etc.
Environmental activities carried out by government bodies still play a key role.

Green Growth in the Netherlands 57
2.34 Environmental investments
In 2007 the total Dutch environmental investments, as a share of total investments, had
increased by almost 80 percent on 2000, reaching a peak level of 3.6 percent. In 2009
environmental investments decreased relative to 2007 to 3.2 percent of total investments.
The share of environmental investments to total investments was still higher in 2009 than it
was in 2005 and before.
2.34.1 Environmental investments as a share of total investments
0
1
2
3
4
5
%
2009200820072006200520042003200220012000
Environmental investment is investment in capital goods intended to protect, restore or
improve the environment. Investments that become profitable within three years are not
included.
Environmental investment is a key factor in realising a greener growth path. Cleaner
technologies make production processes less harmful for the environment. In addition,
production of environmental technologies by specialised producers may contribute to
economic growth.
Environmental investments are extra capital goods intended to protect, restore or improve
the environment and which do not repay themselves within three years. In 2009 the total
environmental investments amounted to 1.7 billion euros for government and 1.2 billion
euros for industries. This is much higher than in 2000 when, in current prices, the total
environmental investments amounted to 0.8 billion euros for government and 0.9 billion
euros for industries. Important examples are waste water treatment plants and the
construction of impervious surfaces. Also included are provisions for renewable energy
production, such as windmills, solar panels and installations for biomass combustion.

Green growth, position of
the Netherlands in the OECD
and Europe
3.

Green growth, position of the Netherlands in the OECD and Europe 59
In the previous chapter, green growth in the Netherlands has been analysed by 33 indicators categorized in six different themes. This chapter assesses the position of the Netherlands with respect to these indicators within in the OECD and/or Europe1). Although there are clear differences for the different themes, overall the Netherlands ranks average when compared to other countries.
3.1 Overview
The basis for assessing the green growth of the Netherlands in an international context
has been the comparison of the position of the Netherlands with the other OECD and EU
member states. The idea behind this is that the trend of green growth in the Netherlands
might be positive for some areas, but that a reference to the broader context is lacking. If
all other European countries perform better, for example, the Netherlands might experience
drawbacks from this. Or the Netherlands might be dealing less efficiently with resources or
pollution control than other countries, incurring higher compensation costs for society and
companies and making the Netherlands less competitive. It could also result in irreversible
damage to the environment and a poorer quality of life.
The Netherlands has been scored by comparing the value of the indicator for the most
recent year with other countries. Please note that this is different from scoring the national
indicators, as the national indicators are scored on the change of greening growth over a
time period. The relative position in the ranking determines the colour of the indicator. The
position of the Netherlands in the OECD or European ranking is divided by the number of
countries for which data are available. For example: if the Netherlands is in 10th place and
data are available for 27 countries, the indicator value for the Netherlands is 10/27 = 0.37.
The value is then compared with the following boundaries:
Green 0 ≤ value ≤ 1/3
Yellow 1/3 < value < 2/3
Red 2/3 ≤ value ≤ 1
As this value lies between 1/3 and 2/3, the indicator is coloured yellow. Countries with the
same values for a certain indicator are assigned the same position.
The scores for this international benchmark should be interpreted with care. First of all,
the Netherlands might be positioned close to a boundary for some indicators. A relatively
small change in the figures may also result in a different indicator colour. Secondly, there is
unfortunately no internationally comparable data available for certain indicators. Therefore,
it is not entirely possible to assess the position of the Netherlands. Thirdly, the international
comparison is based on data from the most recent available year. This is not always the
same year for each indicator. However, we feel that this does not lead to substantial
changes, since the indicators are quite robust. Year-on year changes are generally relatively
small for the indicators. Finally, the indicator which is best harmonized and comparable
1) As comparable data are not always available for all OECD countries, often only data from the European countries that are members of the OECD are used to make the international comparison.

60 Green growth in the Netherlands 2012
internationally, is not always exactly the best indicator to measure green growth in the
Netherlands. However, it is the best one that approximates it.
The position and interpretation of the Netherlands in an international context is
summarized in Figure 3.1.1. It will be discussed per theme in the next sections.
3.1.1 Position of the NL in the OECD and/or the EU for green growth indicators
Indicator Unit Year
Position in the OECD or Europe Score
-
Environmental efficiency
Production-based greenhouse gas emissions CO2 eq. / 1000 euros 2010 12 (21) ●
Consumption-based greenhouse gas emissions 1000 kg CO2 / capita 2009 20 (28) ●
Emissions to water, heavy metals . . . ●
Nutrient surpluses kg nitrogen per hectare 2008 22 (22) ●
Waste generation ton / million euros 2010 15 (22) ●
Resource efficiency
Groundwater abstraction m3 per capita 2007 5 (16) ●
Domestic biomass consumption US$ / kg 2008 6 (34) ●
Domestic metal consumption US$ / kg 2008 14 (34) ●
Domestic mineral consumption US$ / kg 2008 14 (34) ●
Net domestic energy use ktoe per US$ 2011 16 (34) ●
Renewable energy % 2011 18 (21) ●
Waste recycling kg per inhabitant 2010 1 (22) ●
Natural asset base
Energy reserves Terajoules per capita 2011 5 (11) ●
Stocks of standing timber % 2010/2005 8 (25) ●
Stocks of fish ●
Land conversion into built-up land % 2000–2006 18 (22) ●
Farmland birds % change compared to trend 2005 8 (16) ●
Environmental quality of life
Urban exposure to particulates PM10 µ/m 2010 10 (19) ●
Chemical quality of surface waters % ‘Not At Risk’ (WFD) 2007 17 (17) ●
Ecological quality of surface waters % ‘Not At Risk’ (WFD) 2007 17 (17) ●
Nitrate in groundwater . . . ●
Level of concern . . . ●
Willingness to pay . . . ●
Green policy instruments
Environmental taxes % of total tax revenues 2011 2 (22) ●
Implicit tax rate for energy euro per ktoe 2011 6 (21) ●
Environmental subsidies and transfers . . . ●
Mitigation expenditure by government . . . ●
Environmental protection expenditure % of GDP 2009 7 (18) ●
Economic opportuinities
Contribution environmental goods and services sector (EGSS) to total employment . . . ●
Contribution sustainable energy sector to employment . . . ●
Contribution environmental goods and services sector (EGSS) to total value added . . . ●
Green patents % of applications 2010 11 (33) ●
Environmental investments % of GDP 2009 9 (18) ●
-

Green growth, position of the Netherlands in the OECD and Europe 61
3.2 Environmental efficiency
In this theme there are internationally comparable data for four of the five indicators, the
only one lacking is on heavy metal emissions to water. For most indicators, the Netherlands
ranks average except for nutrient surpluses. The Netherlands occupies the lowest position
with regard to the indicator nutrient surpluses (ranking 22 out of 22 countries). This
reflects the high intensity of agricultural activities in the Netherlands, particularly the
high concentration of livestock. The significant decrease in nutrient emissions that has
been accomplished during the last decade (see section 2.5) has not yet changed the high
emission intensity compared to other countries.
The Netherlands holds an average position with respect to the intensity of carbon dioxide
emissions, compared with other EU-countries (ranking 12 out of 21 countries). The chemical
sector and refineries, which are relatively emission intensive, take up a prominent position
in Dutch manufacturing. Also agriculture (horticulture and intensive livestock farming)
causes relatively more greenhouse gas emissions. Estonia, Poland and the Czech Republic
still have relatively high emission intensities of carbon dioxide, as manufacturing in these
countries is still relatively energy inefficient. Also electricity in these countries is mainly
produced by burning coal or lignite, which results in high carbon dioxide emissions.
Denmark also has a high emission intensity, as sea shipping is an important economic
activity for this country. Austria, Sweden and Norway produce a lot of renewable energy
(hydro power) and so their economies are less emission intensive. Italy and Portugal have
the advantage that they need less energy for heating of offices and shops during winter
months. This offsets their higher use of electricity needed for air conditioning in summer,
lowering their overall emission intensity. France has the lowest emission intensity of
all European countries. This is related to the extensive use of nuclear energy to produce
electricity.
The Netherlands ranks rather high with respect to the carbon footprint per capita. Out of
28 OECD countries, The Netherlands takes the 20th position. Australia, the United States and
3.2.1 CO2 emission intensity for selected countries, 2010
CO2 eq. per 1,000 euros
0 200 400 600 800 1,000 1,200
Estonia
Poland
Czech Republic
Hungary
Greece
Denmark
Finland
Netherlands
Germany
Great Britain
Portugal
Belgium
Italy
Austria
Norway
Sweden
France

62 Green growth in the Netherlands 2012
Belgium have a higher carbon footprint, whereas most other European countries have a
lower one. This is due to a number of factors including a relatively high level of per capita
consumption and a low share of renewable energy production in the Netherlands.
3.3 Resource efficiency
All indicators for resource efficiency could be measured internationally. The international
position of the Netherlands is rather mixed. The Netherlands scores green for groundwater
abstraction (ranking 5 of 16) and domestic biomass consumption (ranking 6 of 34). Also
landfilled waste per inhabitant is the lowest in Europe. The Netherlands scores averagely
for energy use, metal and mineral use intensity.
The share of renewable energy production scores below average. It was about 4 percent
in the Netherlands in 2011, which is well below the European average of 13 percent.
Although the share in renewable energy has increased significantly since 2000, the
Netherlands still holds only the 18th position out of the 21 EU countries. Norway, Sweden
and Finland produce a lot of renewable energy by hydropower and the use of biomass.
Denmark also scores relatively high with 23 percent, due to its extensive application of
wind power. In Germany, the share of renewable energy has increased significantly from
3 percent in 2000 to 11 percent in 2011. This was realised by a great deal of investment in
wind and solar power stimulated by high subsidies provided by the government. Only the
United Kingdom and Belgium perform worse than the Netherlands.
There are several reasons for the low Dutch position (see also Statistics Netherlands,
2013a). First of all, conditions are unfavourable for hydropower generation as the Dutch
rivers have little differences in altitude. Conditions are only more favourable for wind
power. Second, Dutch households use relatively little biomass (wood) for heating, as
almost all households are connected to the natural gas network. Also, the Netherlands is
relatively poor in forests, which makes wood less easily available as a source for heating.
3.2.2 Carbon footprint per capita for selected countries, 2009
Source: Footprint for the Netherlands based on SNAC; other countries based on unadjusted WIOD; population data:Source: http://databank.worldbank.org/
1,000 kilos CO2 per capita
0 5 10 15 20 25
Australia
United States
Belgium
Netherlands
Germany
Denmark
Austria
United Kingdom
Japan
Czech Republic
Italy
Sweden
France
Spain
Poland
Romania

Green growth, position of the Netherlands in the OECD and Europe 63
Finally, renewable energy production in less subsidised than in other countries, such as
Germany, Spain, and Denmark.
3.4 Natural asset base
International data are available for four of the five indicators. The position of the
Netherlands is mixed, as some indicators score green but others yellow and red. The
Netherlands scores green for the indicator for stocks of standing timber. Until 2010, the
stock in the Netherlands rose by 8 percent. The international position is 8 of 25. The largest
increase was in Denmark, with almost 40 percent. On the other hand, in Portugal the stocks
of standing timber decreased by almost 50 percent.
The Netherlands scores average on the indicator energy reserves per capita. When
compared internationally, there are still significant reserves of natural gas, even though
these have declined significantly over the last decades. Germany, Poland and Greece have
more energy reserves per capita left. The United Kingdom, France and Italy, on the other
hand possess much lower energy reserves per capita than the Netherlands. Many countries
such as Sweden and Belgium do not have any significant energy reserves left at all, or
have never possessed any energy reserves to start with. The Netherlands scores relatively
low on the indicator for land conversion into built-up land. The position of the Netherlands
is 18 of 22. More than 1 percent of all land is annually converted into built-up land. This
puts significant pressure on biodiversity and amenities, since space is very scarce in the
Netherlands. The best performer is Belgium with a conversion rate of just 0.1 percent. Also
Germany, France and the United Kingdom have much lower conversion rates. Only Spain,
Portugal and Ireland score worse than the Netherlands.
The Netherlands scores average on the Farm Bird Index, which is a good indicator for the
overall performance on biodiversity for countries with farming. Countries that score better
here are amongst others Estonia, United Kingdom and France. Belgium, Italy and Germany
perform worse than the Netherlands.
3.3.1 Share of renewable energy in gross energy use for selected countries, 2011
%
0 10 20 30 40 50
Sweden
Latvia
Finland
Austria
Denmark
Romania
Spain
Germany
Greece
France
Italy
Poland
Czech Republic
Hungary
Netherlands
Belgium
United Kingdom

64 Green growth in the Netherlands 2012
3.5 Environmental quality of life
In this theme there were only international data for the ecological and chemical quality of
the surface water and the urban exposure to particulates. The Netherlands has the worst
water quality as just 1 percent of all the surface water was not at risk in 2007, according to
the guidelines of the Water Framework Directive. This is explained by the high population
and livestock density, causing a lot of emissions to water, but also by all trans boundary
inflows of pollution that the Netherland receive from Belgium and Germany. In Poland,
Estonia and Spain almost 60 to 80 percent of all surface water is in good condition.
The Dutch performance is average for the urban exposure to PM10. Poland, Hungary and
the Czech Republic generally score worse. Manufacturing and traffic in these countries
still emit a lot of particulates. In addition, these countries receive a lot of trans boundary
emissions from their neighbours in the west. The urban exposure to PM10 is substantially
lower in coastal countries, like the United Kingdom, Ireland, and Denmark.
3.6 Green policy responses
For this theme internationally comparable data are available for three of the five indicators.
No international data are available yet for environmental subsidies and transfers and
mitigation expenditure by the government. In the Netherlands the share of environmental
taxes in total taxes and social contributions is the highest in Europe2). While the European
average is 6.4 percent, in the Netherlands slightly less than 10 percent of the taxes and
social contributions is environment related. In Belgium, Germany and France, the share
is below 6 percent. The Netherlands scores high on this indicator particularly due to high
taxes on pollution and on transport. So the Netherlands internalizes the costs for pollution
2) In 2011 the share of Bulgaria was slightly higher than the Netherlands.
3.5.1 Urban exposure to PM10 for selected countries, 2010
PM 10 µ/m3
0 5 10 15 20 25 30 35 40
Poland
Hungary
Czech Republic
Italy
Slovak Republic
Belgium
Austria
France
Netherlands
Spain
Portugal
Germany
United Kingdom
Ireland
Sweden
Finland
Denmark

Green growth, position of the Netherlands in the OECD and Europe 65
via environmental taxes much more than other countries. With respect to energy related
taxes as a percentage of total social contributions, the Netherlands ranks fairly average.
Data for the implicit tax rate on energy show that in the Netherlands energy is relatively
highly taxed in comparison to other countries. This is due to the high excise duties and
the tax on natural gas and electricity use. The Netherlands takes up position 6 of 21, only
Denmark, Great Britain, Italy and Sweden have a higher implicit tax rate for energy. The
Netherlands has average environmental expenditure as a percentage of GDP in Europe. The
environmental expenditure of the government in particular is relatively high compared to
other European countries. The environmental expenditures for companies, however, are
average.
3.7 Economic opportunities
Only two of the five indicators can be compared with other countries, namely
environmental investments and green patents. Internationally comparable data for the
environmental goods and services sector are still lacking at this moment. New European
legislation for new statistics in this area should improve this situation in the next few years.
The Netherlands scores good on the indicator for green patents. The position is 11 of 33. In
Denmark, Norway and Sweden the share of green patents in the total is relatively higher.
For environmental investments the Netherlands holds position 9 of 18. Total environmental
investments are only 0.48 percent of GDP. Spain, Belgium and Germany have a lower
percentage. The average rank is partly the result of high environmental investments in
Eastern Europe. This is largely caused by efforts to bring the environmental infrastructure
(sewerage, water purification, waste treatment facilities) up to the same level as in the rest
of Europe.
3.6.1 Share of environmental taxes in total taxes and social contributions for selected countries, 2011
%
0 2 4 6 8 10
Netherlands
Slovenia
Ireland
Denmark
Greece
Poland
Portugal
United Kingdom
Hungary
Czech Republic
Italy
Germany
Austria
Sweden
Spain
Belgium
France

4.Summaries of theme articles

Summaries of theme articles 67
This chapter provides summaries of three studies done at Statistics Netherlands in the area of green growth. The first study discusses green growth for the top sectors in the Netherlands. The first results for a baseline study for the year 2010 are presented. The second study provides a new method for measuring the carbon footprint for the Netherlands and summarizes the first results. Finally, a summary is provided for policy-makers of the scientific research on the causal relationship between micro-productivity and green investments of enterprises (Porter-hypothesis).
4.1 Benchmark green growth for top sectors
Introduction
Green growth is of great national interest in the Netherlands, since sustainable innovation
can simultaneously create new branches of employment and cut back on pollution and
resource usage. Within the Netherlands, the so-called ‘top sectors’ play a central role
within governmental business and corporate policy aimed at promoting innovation
and strengthening the Dutch economic competitiveness. In a publication by Statistics
Netherlands (“Nulmeting groene groei in de topsectoren, 2013”), the aforementioned
themes are brought together in a baseline measurement of green growth within the top
sectors. In this chapter a summary of the above mentioned publication is given. Green
growth is generally monitored by studying changes over time. However, here the results of
a single year are presented, since economic data on the top sectors are as of yet available
for 2010 only.
Method
The green growth indicators are estimated by means of an approximation (e.g. ‘top-down’
method) applied to aggregated data concerning the top sectors compiled from statistics
available at Statistics Netherlands. A quality test of this method showed that it usually
delivers accurate results. There are however unknowns associated with this method. The
most important of these is that the conceptual definition of the top sectors sometimes
makes it difficult to interpret the outcomes of the green growth indicators. For instance,
several large companies are considered part of the top sector Water, even though a
majority of their business activities are better suited to the Chemicals or Energy top sectors.
This can therefore make it hard to interpret the high energy usage seen in the top sector
within the context of the top sector Water. For this reason, the results are presented in
terms of proportions (percentages) with respect to the average of the Dutch economy.

68 Green growth in the Netherlands 2012
Top sector totals
Fourteen indicators of green growth, categorised according to green growth themes
formulated by the OECD, are calculated for nine top sectors. Next, these data are
compared with data on non-top sectors and the average of the Dutch economy.1) The first
green growth theme (environmental efficiency) shows that, with respect to the Dutch
economy average, the top sectors produce large amounts of environmental pollution.
While all top sectors combined comprise 27 percent of the value added and 21 percent
of the employment in the Dutch economy, they are also responsible for 70 percent of
all greenhouse gas and particulate matter emissions. The second green growth theme
(resource efficiency) shows a similar picture: the top sectors use three-quarters of all
energy and materials used within the Dutch economy as a whole. The fact that the top
sectors share a large proportion of the total environmental pressure can be explained
by their composition. The top sectors consist mainly of businesses that are active in the
manufacturing, energy, agricultural and transportation sectors. These are all sectors in
which the production processes are characterised by relatively high environmental and
material intensities.2)
A striking finding with regard to the third theme (green policy-instruments and economic
opportunities) is that the top sectors are taxed relatively less in terms of environmental
taxes compared to the Dutch average or other (non-top) sectors. The top sectors therefore
experience less financial burden, despite the relatively high level of environmental
pollution associated with them. Consequently, the financial cost of this level of pollution is
less incorporated within the price. A further finding concerning the third theme is that the
production of environmental goods and services is relatively high among the top sectors
with respect to the Dutch economy. The contribution of the top sectors to the transition to a
green economy, in terms of economic opportunities, is therefore above average.
1) The environmental performance of the top sectors is compared to the Dutch economy. Within this context, the Dutch economy is taken to comprise the entire economy in the Netherlands with the exclusion of the contribution of private households.
2) Intensity is defined as environmental pressure, such as CO2 emission divided by value added.
4.1.1 Share top sectors in total economy for macro-economic and green growth4.4.1 indicators, 2010
%Non-top sectorsTop sectors
0 20 40 60 80 100
Employment EGSSValue added EGSS
Energy taxesEnvironmental taxes
Mineral useMetal use
Biomass useWater use
Net energy use
Waste productionNutrient emissions to water
Heavy metal emissions to waterParticulate emissions
Greenhousegas emissions
Labour input of employed personsValue added
Number of companies

Summaries of theme articles 69
The nine top sectors
The analysis of the individual top sectors does not reveal an overall explicit picture with regard
to green growth. None of the top sectors is characterised as exceptionally ‘green’ or ‘non-green’.
The emission intensity within the top sector Agri&food is generally higher than the Dutch
economy average. The nutrient emission intensity to water and soil is even 19 times higher than
the national average. Furthermore, this top sector is responsible for more than 40 percent of all
ground and tap water use (excluding household use). Another characteristic of the top sector is
the focus on food production, resulting in a high level of biomass input. Within important sub-
sectors of the top sector Agri&food (such as agriculture and food industry) the emission intensity
of most polluting substances has significantly decreased during 2000 and 2010.
The top sector Chemicals has the highest net energy use of all top sectors. The energy
use intensity is more than 10 times the national average. The emission of heavy metals,
particulate matter and greenhouse gases is also relatively high. The intensity with which
metals and biomass are used is clearly lower than in many other top sectors and lower than
the Dutch economic average.
The top sector Creative industry is a small sector, which is reflected in a relatively low level
of environmental pollution and use of materials. Businesses within the Creative industry
are responsible for less than half a percent of the total air and water emissions and waste
production. The emission and material intensities in this top sector are also relatively low;
few companies in the Creative industry are active in manufacturing.
The top sector Energy is characterised by high levels of energy use and greenhouse gas
emissions. In all, the top sector Energy uses 13 percent of all the energy used and emits
28 percent of all greenhouse gases emitted by Dutch producers. However, between 2000
and 2010 the increase in energy use and greenhouse gas emissions associated with
electricity companies and with oil and gas extraction companies (two subsectors of the
top sector Energy) was less pronounced than their increase in production and added value
during the same period. The subsector ‘Sustainable energy: pre-exploitation phase’, part of
the top sector Energy, is characterised by products and services that contribute to a cleaner
environment. In 2010 this subsector comprised 15.9 thousand full-time jobs, approximately
34 percent of the top sector Energy total.
Although the top sector High tech systems and materials is the largest top sector
economically speaking, the level of environmental pollution associated with it is relatively
low. The emission intensities of greenhouse gases, particulate matter and heavy metals,
as well as the waste production levels, are comparable to the Dutch economy average.
Nonetheless, this top sector does consume roughly 90 percent of all metals used in the
Netherlands, far more than any of the other top sectors. The top sector encompasses
15 percent of the employment in environment-related goods and services industry. This
proportion is only slightly below the proportion in the top sector Energy.
The emission intensities of nutrients, heavy metals, particulate matter and greenhouse
gases, and the waste production levels in the top sector Life sciences & health are all below
the national average. Noteworthy are the relatively high levels of ground and drinking
water usage. The pharmaceutical industry, as a subsector within this top sector, is primarily
responsible for the relatively high level of water usage.

70 Green growth in the Netherlands 2012
The top sector Transport and storage displays a clear pattern of environmental pollution. The
emission of heavy metals and particulate matter are noticeably high, whereas the emission
of nutrients and waste production are both very low. This top sector pays for 14 percent of
all environmental taxes that are levied against companies and organisations, more than in
any other top sector.
The environmental efficiency of the top sector Horticulture and propagation materials is, in
general, neither high, nor low. The intensity of heavy metals emissions to water, as well as
the particulate matter emissions and waste production levels are lower than the national
average. However, the greenhouse gas emission intensity is three times the national
average. A further characteristic of the top sector is high levels of energy and materials use
intensity. The horticulture sector was able to greatly reduce its energy intensity between
2000 and 2010 through the implementation of cogeneration. However, due to the fact that
more natural gas is used to generate electricity, the greenhouse gas intensity within the
sector increased during the same period.
The top sector Water scored relatively high on half the investigated environment and materials
intensity indicators. Particularly striking are the high heavy metal emission to water and the
relatively high usage of metals, mainly through ship-building and related (metal construction)
industries. The findings of the top sector Water are not all easily interpreted. This has to do
with the fact that the business activities of several large companies that are considered part of
the top sector are not always all directly related to the underlying themes of the top sector.
Figure 4.1.2 presents an overview of the available green growth indicators for each of
the nine top sectors. Per theme, each indicator is compared to the average of the Dutch
Environmentale�ciency
Resourcee�ciency
Green policyinstruments and
economicopportunities
Agri&food
Chemicals
Creative industry
Energy
High tech
Life sciences & health
Logistics
Horticulture and propagation materials
Water
4.1.2 Overview of green growth indicators for nine top sectors, 2010
Worse than average Better than average

Summaries of theme articles 71
economy. The themes Environmental efficiency and Resource efficiency each contain
five indicators; the theme Policy-instruments and economic opportunities contains four
indicators. Each indicator represents part of a circle. If a top sector scores better than
average on a particular indicator, then the corresponding part of the circle is coloured dark-
green, and if not, then it is coloured light-green.
4.2 Towards a MRIO based national accounts consistent carbon footprint
Introduction
A footprint indicator relates consumption to environmental pressures. A footprint
measures the emissions that occur within the Netherlands and abroad as a result of Dutch
consumption. It is therefore often referred to as the “consumption perspective” or the
“consumption-based approach”. This is usually set against the “production perspective”
where the direct environmental pressures generated by economic activities (production,
consumption and accumulation) are measured. In the context of green growth, the OECD
considers consumption based indicators, like the carbon footprint, an important component
of the measurement framework for green growth (OECD, 2011b).
Statistics Netherlands has published estimates for the Dutch carbon footprint based on input-
output techniques using various model specifications but never used a multi-regional input
output table (MRIO) describing the structure of the world economy including all trade flows
between countries. The advantage of using a MRIO for the calculations is that it allows us to
quantify indirect pressures along the complete supply chains in order to obtain a country specific
allocation of pressures. For instance, if China produces intermediates for German exports to the
Netherlands, the corresponding emissions in China and Germany are both taken into account.
In this study we report on our research to provide provisional estimates of the Dutch carbon
footprint using a publicly available MRIO, namely of the World Input Output Database
(WIOD, Timmer et al., 2012) which we have made consistent with Dutch national accounts
and environmental accounts data. We restrict ourselves in this study to an analysis of carbon
dioxide (CO2) emissions. For more details see also Statistics Netherlands (2013a).
The need for an “official” carbon footprint
Nowadays many carbon footprint estimates are available that are either based on MRIO
calculations or other methods. However, upon closer inspection the various sources provide
very different insights on the level of the footprint and on their annual changes. The
underlying issue is that MRIO-based footprints do not aim (or claim) to provide conclusive
results for individual countries. MRIO databases are produced to provide insight about
global developments, but there are many reasons why the representation of an individual
country in an MRIO table will differ from official statistics.

72 Green growth in the Netherlands 2012
For those reasons we will explore a more direct approach here to calculate what we will
call a “Single-country National Accounts Consistent” or “SNAC-carbon footprint”. The method
uses the MRIO methodology but rather than “getting it right from a global perspective”, the
steps are geared towards making the results consistent with Dutch official statistics. We
have decided to use the World Input Output Database (WIOD; Timmer et al. 2012) as a point
of departure due to its open source character and the existence of a time series.
Methodology
The method that we have employed (see Hoekstra et al., 2013) intervenes in the WIOD
methodology keeping the data for the Netherlands unaltered at every stage of the
calculations. The end result is therefore an adjusted “WIOD database” that is entirely
consistent with the official Dutch national accounts statistics. In the process we make use
of data that are as detailed as possible, such as microdata available from international
trade in goods statistics as well as input-output tables at product level available within the
national accounts and actual data from the air emission accounts.
Results
The carbon footprint in 2009 amounted to 202 Mton CO2.The footprint consists of 83 Mton
embedded in imports, 80 Mton domestic indirect and 40 Mton due to direct emissions. On a
per capita basis, the Dutch CO2 emissions according to the SNAC approach equal 12.2 ton.
Of the CO2 emissions emitted abroad due to final consumption in the Netherlands (import
emissions), China contributed most with 19 percent, followed by Germany at 10 percent
and Russia at 8 percent. We should be cautious, however, as these outcomes are subject to
uncertainty due to various assumptions inherent in using a MRIO.
4.2.1 Import emissions allocated to country of origin, 2009
Russia
United States
BelgiumChina
Germany United Kindom
India
Rest of world
19%
10%
8%
6%
4%4%3%
46%

Summaries of theme articles 73
Discussion and conclusions
The preliminary results show that the Dutch SNAC footprint lies within the range provided
by other MRIO estimates for the Netherlands. The SNAC footprint is about 4 percent lower
than the result obtained with the unadjusted WIOD because of significantly lower emissions
embedded in imports. This is partly explained by the fact that we have used more detailed
information to separate re-exports from imports and exports.
The SNAC methodology that we have applied here is a potentially promising approach to
reconcile the use of a MRIO model (the state of the art) with the official statistics of individual
countries. Especially for countries such as the Netherlands, that has a large trade sector
including re-exports, use of official statistics is important as it greatly affects the magnitude
and allocation of the footprint. This procedure could be used to create other globalisation
indicators such as “trade in value added” in a way that is consistent to national accounts.
There remain several issues that warrant more research before the results can be
considered definitive. It is very important to further investigate the trend in the footprint. A
method will have to be created to update the WIOD database since there are no immediate
plans to update the database beyond 2009.
There are a number of longer term challenges that may have significant impact on the
construction of MRIOs such as the technical revision of classifications of products and
industries that underlie economic statistics and the implementation of the 2008 SNA. The
revised SNA has introduced a number of conceptual changes that have altered the way in
which imports and exports are calculated in the national accounts which will therefore also
affect footprint calculations.
4.3 Testing the Porter Hypothesis on firm-level data for the Netherlands
Introduction
Driven by the widespread concerns about environmentally damaging pollution in general
and the relationship between the environment and the economy, many debates on
preferred policy strategies for greening economies are starting from a macro view on the
problem. A similar conclusion holds for the development of monitoring frameworks. The
international dimension of the problem and the complexities at stake mirror the “broad
church” interests, that seek broadly accepted and coordinated solutions and the monitoring
of broadly accepted environmental indicators across economies to measure progress in a
comparable fashion.
In the discussion of what should be accomplished for greening economies technological
change is attributed an important role. This is partly because the environmental

74 Green growth in the Netherlands 2012
consequences of social and business activity are affected by the rate and direction of
technological change, and also because environmental policy interventions may create
new constraints and incentives that may alter the path of future technological development
(Jaffe et al., 2003).
Environmental technological progress is a very broad phenomenon and every description
of it can only be very incomplete. Some examples concern 1) technologies that reduce
pollution at the end-of-pipe, such as scrubbers for use on industrial smokestacks or
catalytic converters on cars 2) technologies that increase user value for consumer products
(e.g. medicines) after introducing new production methods, which, at the same time,
lower the environmental burden by using less environmentally harmful materials and
3) implementation of technologies that are targeted to changes in production processes to
improve energy efficiency.
The role attributed to technological change explains why it also makes sense to look at
what is happening below the surface of macro environmental indicators and to go down to
the micro level. After all, investing in the environment is the first impetus to having more
green technologies developed by individual firms. Government intervention may shape
or alter a firm’s investment climate, either by public funding of environmental R&D or by
environmental regulation that sets standards for emissions or that “taxes” pollution in some
way.
The benefits of environmental technological innovations may accrue to society at large,
rather than just to the adopter or investor in these new technologies. So investing in the
greening of economies faces similar market failures as for investing in other instances
of innovation (e.g. a firm capturing less than the full fruits of its innovation investment
efforts). Green innovation market failures are pivotal to the numerous discussions
surrounding the so-called Porter-Hypothesis (PH), not at least because innovation resources
are allocated to different types of innovation.3)
The PH asserts that polluting firms can benefit from environmental policies, by arguing that
well designed and stringent environmental regulation can stimulate green innovations, which
in turn may lead to productivity gains of firms complying to environmental regulation or
increases of the product value for end users of their products (Porter and van der Linde, 1995).
The main message of this hypothesis is that there seems to be no trade-off between
economic (green) growth and the protection of the environment, but a win-win situation.
Environmental regulation could benefit society as well as regulated individual firms. It
may do so by triggering the dynamic efficiency of such firms. The benefits may offset their
costs of complying with environmental restrictions and contribute to better environmental
conditions for society as a whole. However, this assertion neglects that the innovation
decisions firms make that are likely to encompass more than direct environmental aspects.
There are a weak and a strong version of the Porter Hypothesis. The difference lies in the
answer to the question whether environmental regulation drives innovation (the weak
version) or whether it has a more direct effect on productive efficiency (the strong version).
3) A famous metaphor in this respect is the following: one cannot find a 10 dollar bill on the ground for, if it was there, somebody else would already have picked it up. Or stated otherwise: there are many examples of not (fully) captured low hanging fruits offered by environmental challenges to innovation.

Summaries of theme articles 75
This distinction is a bit artificial and cannot be defended on pure methodological grounds
because productivity gains can be achieved through different channels. Government
interventions to stimulate investment in the environment may raise innovation which in
turn may raise productive efficiency. The same interventions may raise productivity in a
direct way, but the empirical research that tested the strong version of the PH has often led
to the conclusion that environmental regulation has an insignificant or even a significantly
negative impact on productivity. This conclusion can be easily understood, because
regulation forces firms to invest in the environment, and complying with the environmental
restrictions4) increases production costs. For the Netherlands the evidence on the validity
of the PH seems to be scarce. To fill this gap we embarked on a project to test the PH at
the firm-level data.5) This contribution presents a summary of this research and the main
findings.
A short description of the model used for testing the Porter Hypothesis
Much of the empirical literature concerned with the testing of the PH starts from single-
equation (reduced-form) models. To shed a new light on the weak and strong versions
of the PH, a rich unbalanced panel dataset has been constructed by matching Dutch firm
level data from four surveys and by using a so-called “structural modelling approach”
adapted to include green innovation. As argued by e.g. Kriegel and Ziesemer (2009), the
main problem with empirical testing the PH, in essence, boils down to having a better
understanding of the (eco) innovation adoption decisions of firms. This assertion asks for
a modelling approach that explains the impact of environmental regulation on different
stages. The model includes three equations for assessing 1) the role of marginal energy
prices and environmental regulations on green investment and 2) the contribution of ER
and green investment on green innovation and 3) the contribution of green innovation and
ER to productive efficiency.6) Eco, environmental and green will be used interchangeably,
indicating an innovation with a lower environmental impact. Likewise eco, environmental
and green investment all point to investments aimed at reducing the environmental burden
of production (for more discussion on the definition, see Kemp (2011)).
The starting point of the PH investigation is the impact of energy prices on different types
of green investment. The fact that carbon taxes are a substantial part of gross energy prices
makes them a potentially useful instrument for environmental policy aimed at improving
the energy related static as well as dynamic efficiency of firms. This may be the case in
particular in process integrated green investment where such price incentives invoke
environmental investment combined with renewing the production process. For this reason
we include four innovation input equations in stage 1) of the model: two for R&D (eco R&D
and other R&D) and two for other types of green investments, end-of-pipe and process-
4) Seen from an accounting perspective, it is already difficult to assess the contribution of environmental investment in case of production processes that are potentially damaging for the environment. This is because production generates both “bad” and “good” outputs. Every dollar spend on environmental investment may reduce “bad” outputs, but these social benefits are not recorded in national accounts because of the difficulty of finding appropriate valuations for “bad” outputs. So far, there is no common sense on how to deal with this issue.
5) This research was carried out in cooperation with UNU-MERIT.6) In the econometric literature this modeling approach is known as the “CDM model” (named after their founding fathers Crépon-
Duguet-Mairesse). Interestingly, the abbreviation CDM also refers to the Clean Development Mechanism, which is a result of the Kyoto Protocol.

76 Green growth in the Netherlands 2012
integrated respectively.7) Subsequently, we use the predictions from these equations for
modelling the incidence of different types of innovation. At the end, we will estimate a
labour productivity equation and test for the direct effect of environmental regulation and
the complementarity or substitutability of different innovation strategies in affecting total
factor productivity (TFP).
A novelty of our paper is that we follow the recent theoretical and empirical literature
on innovation complementarities by investigating the existence and importance of
complementarities between product, process and eco innovations. We distinguish
complementarities in the incidence of innovation and in their effects on productivity
performance (see van Leeuwen and Mohnen (2013) for a detailed account of the model
and the econometric issues involved).
Data sources
The data used in the econometric part of the research were sourced from four surveys:
1. The survey on environmental costs of firms (ECF). The survey covers the years 2000–
2008 and beyond, collecting (amongst others) data on two types of environmental
investment, environmental subsidies and expenses on environmental R&D.
Environmental investment other than eco R&D can be broken down into “end-of-pipe”
investment and investment related to the renewing of production processes (so-called
“process-integrated eco investment”).
2. The energy use survey (ES), which covers the same period as the ECF Survey. This survey
collects volume data on energy consumption of different types of energy use and these
can be used to construct marginal energy prices at the firm-level after linking with the
data on energy costs collected in the Production Surveys.
3. The Community Innovation Surveys for 2002–2004, 2004–2006 and 2006–2008. This
survey is used to obtain data on the various adopted types of innovation (including
eco innovations), the R&D inputs into (technological) innovation and other variables,
such as e.g. the dependence on foreign markets, innovation subsidies received from
different bodies and innovation cooperation.
4. The Production Statistics Survey (PS). This survey contains firm-level data on gross
output, turnover, value added, intermediate inputs and the (total) energy costs of
firms. This source can be used to construct different output measures such as value
added and gross-output productivity and profitability.
Table 4.3.1 presents descriptive statistics for some key variables. When the CIS data are
merged with the PS and ECF data some variables, such as firm size, eco-R&D per employee,
and eco-investment, display a higher average than before the merging. This is due to the
fact that the CIS survey uses relatively larger firms. The means of the variables that originate
from the CIS survey do not change very much after merging with other surveys. Eco-R&D per
employee is considerably lower than other (non-eco) R&D investment per employee. This
difference does not tell the whole story. The overall picture that emerges from Table 4.3.1
is the well-known tremendous heterogeneity in firm-level data: distributions are very
skew, with, e.g. for R&D, relatively few firms that carry out the bulk of the aggregate
outcome. However, the (average) share of eco-R&D in total R&D investment expenditure
amounts to 27 percent. Furthermore, the share of process integrated eco investment in total
eco investment (eco R&D excluded) is about 42 percent and these are relatively sizable
numbers. These percentages remain of the same order of magnitude when calculated for
7) We applied so-called “Heckman models” to account for possible selectivity of the data.

Summaries of theme articles 77
4.3.1 Descriptive statistics for selected variables
N mean P25 P50 P75-
Eco R&D per FTE (1,000 euros) 3,784 0.130 0.023 0.076 0.115
Non-eco R&D per FTE (1,000 euros) 2,193 4.371 0.160 1.178 3.636
Eco investment per FTE (1,000 euros) 3,784 0.311 0.000 0.000 0.066
Energy cost share 3,784 0.017 0.005 0.011 0.018
Share of environmental R&D in total R&D 2,192 0.274 0.017 0.059 0.363
Share of process integrated eco investment
In total eco investment 1,694 0.424 0.038 0.361 0.726
Employment in FTE’s 3,784 142.5 30.0 70.0 140.0
Value added per FTE (1,000 euros) 3,778 63.7 40.9 53.2 72.6
log (TFP) 3,571 3,731 3,478 3,730 4,000
-
the full panel obtained after linking the PS, ECF and CIS surveys. Finally, 31 percent of the
firms in this panel responded to environmental regulation, either existing or anticipated
(not shown in Table 4.3.1).
Main findings: the weak version of the Porter Hypothesis
Tables 4.3.2 and 4.3.3 present the material for judging the weak version of the PH, i.e.
the relation between ER and innovativeness and after controlling for the contribution of
other determinants of investment and innovation adoption. All in all the results show a
strong corroboration of the weak version of the PH. This conclusion can be broken down in
two parts: the first part concerns the contribution of eco subsidies and energy price tariffs
to investment. These are important financial incentives for raising eco-R&D, and the two
other types of eco-investment (a + indicates a positive contribution to investment, the
number of +’s point to the economic significance of the estimate). Notice further, that we
already find a strong contribution of regulation at the investment stage of the model, with
a significance that is higher for “end-of-pipe” eco-investment than for “process-integrated”
green investment.
4.3.2 Estimation results innovation input stage
Contribution to Eco R&D per FTE Eco investment per FTE-
End-of-pipe Process integrated
Energy intensity +++ +++ +++
Relative energy prices +++ +++ +
Responsiveness to ER ++ +++ +
Eco subsidies received +++ +++ +++-
The second part of the “proof” for the validity of the weak version of PH is presented in
Table 4.3.2, showing the results for the innovation adoption decisions of firms (i.e. the
innovation output stage of our “Green CDM” model). We distinguished three types of
innovations: 1) product innovation, 2) process innovation and 3) eco innovation. All eco-
investment inputs seem to contribute to the three types of innovation output, except that
end-of-pipe investment is insignificant for explaining the decision to innovate in products

78 Green growth in the Netherlands 2012
and only weakly significant for the decision to innovate environmentally. The latter result
corroborates the conclusion reported in the literature that the contribution of end-of-pipe
investment to dynamic efficiency (and in particular product innovation) is limited.
By contrast, process-integrated eco investment seems to contribute to every type of
innovation output. For product innovation the marginal effect of process integrated green
investment even exceeds the contribution of green R&D investment. The picture for process
innovation output is the other way around.8) The contribution of any type of eco investment
to the usual innovation outputs considered in the mainstream of the innovation literature
(i.e. technological product – and process innovation) is relatively modest compared to
the contribution of non-eco R&D inputs. Non-eco R&D is especially influential for product
innovation. Non-eco R&D investment even contributes to eco innovation output more than
other types of investment.
Most interestingly for the PH testing, our results show that, after controlling for the other
determinants mentioned above, environmental considerations influence the incidence of
all three innovation modes. Responses of firms to existing and anticipated environmental
regulation seem to increase the probability of adopting product, process and eco
innovations, as the estimate of the regulation variable is significantly positive for any
of the three types of innovation output. In particular, the contribution of environmental
regulation to eco innovation output is of sizeable economic significance. The presence of
environmental regulation increases the occurrence of eco innovation by 68 percentage
points, the occurrence of process innovation by 9 percentage points and that of product
innovations by 18 percentage points. In other words, in addition to the indirect effect of
environmental regulation on innovation investment, there is also an important direct effect
of environmental regulation on the incidence of each of the three types of innovation. We
consider this last result as a strong corroboration of the weak version of the PH.
Finally, the estimates clearly point out a synergy between the three types of innovation.
Synergy with respect to the profits of various innovation adoption decisions. Any type of
innovation increases the profitability of adopting a certain innovation mode, after also
adopting another type of innovation. In particular, eco and non-eco innovations reinforce
each other. There is no direction of causality in this synergy effects. Eco innovation can take
the form of product or process innovations, i.e. reduce the environmental impact in producing
8) However, these differences are minor after taking into account the standard errors of the estimated marginal effects.
4.3.3 Marginal contribution of eco variables to innovation adoption1)
Type of innovation Product Process Eco innovation-
1. Explanatory variables
Non-eco R&D per FTE 0.552*** 0.142*** 0.076***
Eco-R&D per FTE 0.048** 0.072*** 0.032*
End-of-pipe eco investment per FTE 0.020 0.041*** 0.019*
Process integrated eco investment per FTE 0.121*** 0.042*** 0.045**
Environmental regulation (ER) 0.177*** 0.088*** 0.679***
2. Estimated synergy effects
Product – and process innovation 0.334*** 0.334***
Product – and eco innovation 0.328*** 0.328***
Process – and eco innovation 0.398*** 0.398***-1) *, ** and *** denote significance at the 10, 5 and 1 % level.

Summaries of theme articles 79
goods or services or lead to new products or services that are less polluting or energy-
consuming. Conversely, new products or processes often take the form of eco-innovations.
Main findings: the strong version of the Porter hypothesis
Do environmental regulations also directly affect economic performance measured e.g. by
total factor productivity (TFP)? The most appropriate way to examine this question, which is at
the heart of testing the strong version of the PH, is to include the (same) regulation variable
in productivity regressions that are refined for the contributions to (residual) TFP that are
attributable to the indirect effect of environmental regulation on TFP running via innovation.
Our research shows that there is a significantly positive contribution of lagged green R&D
investment to productive efficiency. It is above and beyond the indirect contribution to
productive efficiency of the same variable captured via the influence on the propensity
to adopt specific combinations of innovation modes. But the environmental regulation
variable in the productivity models is positive but statistically insignificant, thereby yielding
no direct corroboration of the strong version of the PH. The result is relative to the reference
firm in the analysis, i.e. a firm that performed no innovation at all.
In our perception of the PH, the testing of the strong version of the PH could also look at a
testing of the synergy effects for TFP of implementing different combination of innovation
modes and including the possibility of any absence of innovativeness. The results of this
final test for the synergy effects of innovation modes with regard to productive efficiency,
show that eco innovation is a complementary factor, and definitely not a substitute, to
product and process innovation, and that product and process innovations are substitutes
and definitely not complements. We hence do not find the crowding-out of technological
innovations by environmental innovations reported by others when using a model similar to
ours but patent counts instead of innovation occurrences as a measure of innovation output.
Summing up and concluding
The main findings are as follows:
1. After using a structural modelling approach, we found strong synergies between eco
innovation and the other types of innovation usually considered in firm-level based
innovation research;
2. Firms that respond to environmental regulation (either existing or anticipated) show
higher levels of (green) innovation investment of any type;
3. In addition, environmental regulation is an important determinant for explaining
differences in the propensity to adopt all innovation modes considered, and the
contribution of environmental regulation is most sizable for the ecological innovation
adoption decision;
4. Together, these results imply a strong corroboration of the weak version of the PH;
5. Following the mainstream of the literature that tested the direct effect of
environmental regulation on productive efficiency, we do not find a significant
positive direct contribution of environmental regulation to productivity, but the
testing of synergy effects of innovation modes for TFP shows that eco innovation is a
complementary factor in the sense that firms that combine eco innovations with other
types of innovation show a better productivity performance.

80 Green growth in the Netherlands 2012
References
Adriaanse, A. (1993), Environmental Policy performance Indicators, SDU Publishers, The Hague.
EC (European Commission) (2008), Directive 2008/105/EC of the European Parliament and of the
Council of 16 December 2008 on environmental quality standards in the field of water policy, Brussels.
EU (European Union) (2011), Reform of the common fisheries policy. EU, Brussels. Fish stocks.
Green Growth Knowledge Platform (2013), Moving towards a common approach on green
growth indicators.
Hoekstra, R., Zult, D., Edens, B., Lemmers, O., Wilting, H., Wu, R. (2013), Producing Carbon
Footprints that are consistent to the Dutch National and Environmental Accounts, Paper
prepared for the 21st International Input-Output Conference, July 9–12th 2013, Kitakyushu,
Japan and the Workshop on the Wealth of Nations in a Globalising World, July 18–19th
2013, University of Groningen, The Netherlands.
ICES (2013), ICES Advise on fish stocks. Website International Council for the Exploration of
the Sea, Copenhagen, Denmark. Fish stocks.
IPCC (Intergovernmental Panel on Climate Change) (2013), Climate Change 2013, the Physical
science basis. Fifth Assessment Report, Cambridge, Cambridge University Press.
Jaffe, A., Newell, R, and Stavins, R. (2003), Technological change and the environment,
Handbook of Environmental Economics, Vol. 1, Elsevier Science Publishers.
Kemp R. (2011), Eco-Innovation: definition, measurement and open research issues, Economia
Politica, n. 1.
Kriechel, B. and Ziesemer, T. (2009), The environmental Porter hypothesis: Theory evidence
and a model of timing of adoption, Economics of Innovation and New Technology, Vol. 18,
No 3, pp. 41–69.
Leeuwen, G. van and Mohnen, P. (2013), Revisiting The Porter Hypothesis, An Empirical
Analysis of Green Innovation For The Netherlands, UNU-MERIT Working Paper 2013-02, UNU-
MERIT, Maastricht.
OECD (Organisation for Economic Co-operation and Development) (2008), The Global Project
on “Measuring the Progress of Societies”.
OECD (Organisation for Economic Co-operation and Development) (2011a), Green Growth
Strategy, Paris.
OECD (Organisation for Economic Co-operation and Development) (2011b), Towards green:
growth: Monitoring progress: OECD indicators, OECD Green growth Studies, OECD Publishing.
PBL (Netherlands Environmental Assessment Agency) (2010), Prioritering maatschappelijke
vraagstukken, 2006–2010, The Hague.

References 81
PBL (Netherlands Environmental Assessment Agency) (2012), Balans van de leefomgeving
2012, The Hague.
PBL (Netherlands Environmental Assessment Agency) and ECN (Energy Research Centre of
the Netherlands) (2013), Het Energieakkoord: wat gaat het betekenen? Inschatting van de
gemaakte afspraken.
PBL (Netherlands Environmental Assessment Agency) (2013), Nederland voldoet aan de
Kyoto-verplichting uitstoot broeikasgassen. Persbericht 09-09-2013, The Hague.
Porter, M. and Linde, C. van der (1995), Toward a new conception of the environment-
competitiveness relationship, The Journal of Economic Perspectives, Vol. 9, No 4, pp. 97–118.
Probos (2012), Kerngegevens bos en hout in Nederland. Stocks of standing timber. Wageningen.
RIVM (2013), GCN concentratiekaartbestanden.
Rockström, J. et al (2009), A safe operating space for humanity. Nature, 461 (7263), pp. 472–
475.
SOVON (Stichting Vogelonderzoek Nederland) (2012). Breeding birds in the Netherlands,
Beek-Ubbergen.
Statistics Netherlands (CBS) (2010), Land use statistics, Heerlen/The Hague.
Statistics Netherlands (CBS) (2011a), Green growth in the Netherlands, Heerlen/The Hague.
Statistics Netherlands (CBS) (2011b), Nationaal kiezersonderzoek, Heerlen/The Hague.
Statistics Netherlands (CBS) (2011c), Sustainability monitor of the Netherlands 2011, Heerlen/
The Hague.
Statistics Netherlands (CBS) (2012a), Environmental accounts of the Netherlands 2011,
Heerlen/The Hague.
Statistics Netherlands (CBS) (2012b), Minerals in agriculture, 1970–2011*, Heerlen/
The Hague.
Statistics Netherlands (CBS) (2013a), Environmental accounts of the Netherlands 2012,
Heerlen/The Hague.
Statistics Netherlands (CBS) (2013b), Pilot belevingen 2012, Heerlen/The Hague.
Statistics Netherlands (CBS) (2013c), Renewable energy in The Netherlands, Heerlen/
The Hague.
Statistics Netherlands (CBS), PBL (Netherlands Environmental Assessment Agency),
Wageningen University and Research Centre (UR) (2012a), Kwaliteit oppervlaktewater,
2009 (indicator 1438, versie 04), CBS, Heerlen/The Hague; PBL, Den Haag/Bilthoven and
Wageningen UR, Wageningen.
82 Green growth in the Netherlands 2012
Statistics Netherlands (CBS), PBL (Netherlands Environmental Assessment Agency),
Wageningen University and Research Centre (UR) (2012b), Nitraat in het bovenste
grondwater in landbouwgebieden, 1992–2010 (indicator 0271, versie 09), CBS, Heerlen/
The Hague; PBL, Den Haag/Bilthoven and Wageningen UR, Wageningen.
Timmer, M. et al (2012), The World Input-Output Database (WIOD): Contents, Sources and
Methods, Version 0.9, University of Groningen.
Timmer, M. (ed), A.A. Erumban, R. Gouma, B. Los, U. Temurshoev and G.J. de Vries (University
of Groningen), I. Arto, V. Andreoni, A. Genty, F. Neuwahl, J.M. Rueda-Cantuche and A.
Villanueva (IPTS), J. Francois, O. Pindyuk, J. Pöschl and R. Stehrer (WIIW), G. Streicher
(WIFO). The World Input-Output Database (WIOD): Contents, Sources and Methods. April 2012,
Version 0.9.
UN (United Nations), EC (European Commission), IMF (International Monetary Fund), OECD
(Organisation for Economic Co-operation and Development) and World Bank (2009), System
of National Accounts 2008, New York.
UN (United Nations) (2012a), The future we want, Outcome document.
UN (United Nations), EC (European Commission), FAO (Food and Agriculture Organisation),
IMF (International Monetary Fund), OECD (Organisation for economic Co-operation and
Development) and World Bank (2012), System of Environmental-Economic Accounting,
Central Framework, New York.
UNEP (United Nations Environment Programme) (2009), Global Green New Deal Policy Brief.
UNEP (United Nations Environment Programme) (2011), Towards a Green Economy: Pathways
to Sustainable Development and Poverty Eradication.

Authors 83
Authors
Kees Baldé
Paul Klein
George van Leeuwen
Sjoerd Schenau
Marjan Verberk
With contributions of
Kees Baas, Anne Boelens, Ellen Brinksma, Roel Delahaye, Bram Edens, Rita Gircour, Jamie
Graham, Cor Graveland, Remco Kaashoek, Eefje Lammers, Lotte Oostrom, Albert Pieters,
Maarten van Rossum, Marianne Schuerhoff, Reinoud Segers, Vincent van Straalen, Otto
Swertz, Marcel van Velzen, Joram Vuik and Daan Zult.