Embed Size (px)
Citation preview
Green Cloud Framework For Improving CarbonEfficiency of Clouds
Saurabh Kumar Garg1, Chee Shin Yeo2 and Rajkumar Buyya1
1 Cloud Computing and Distributed Systems LaboratoryDepartment of Computer Science and Software Engineering
The University of Melbourne, Australia{sgarg, raj}@csse.unimelb.edu.au
2 Distributed Computing GroupComputing Science Department
Institute of High Performance Computing, [email protected]
Abstract. The energy efficiency of ICT has become a major issue withthe growing demand of Cloud Computing. More and more companiesare investing in building large datacenters to host Cloud services. Thesedatacenters not only consume huge amount of energy but are also verycomplex in the infrastructure itself. Many studies have been proposed tomake these datacenter energy efficient using technologies such as virtual-ization and consolidation. Still, these solutions are mostly cost driven andthus, do not directly address the critical impact on the environmentalsustainability in terms of CO2 emissions. Hence, in this work, we proposea user-oriented Cloud architectural framework, i.e. Carbon Aware GreenCloud Architecture, which addresses this environmental problem fromthe overall usage of Cloud Computing resources. We also present a casestudy on IaaS providers. Finally, we present future research directions toenable the wholesome carbon efficiency of Cloud Computing.
Keywords: Cloud Computing, Green IT, Resource Management
1 Introduction
Cloud Computing provides a highly scalable and cost-effective computing in-frastructure for running IT applications such as High Performance Computing(HPC), Web and enterprise applications which require ever-increasing compu-tational resources. The emergence of Cloud Computing has rapidly changed theparadigm of ownership-based computing approach to subscription-oriented com-puting by providing access to scalable infrastructure and services on-demand.The Cloud users can store, access, and share any amount of information online.Similarly, small and medium enterprises/organizations do not have to worryabout purchasing, configuring, administering, and maintaining their own com-puting infrastructure. They can instead focus on improving their core compe-tencies by exploiting a number of Cloud Computing benefits such as low cost,

datacenter efficiencies, on-demand computing resources, faster and cheaper soft-ware development capabilities.
However, Clouds are essentially datacenters hosting application services of-fered on a subscription basis. They require high energy usage to maintain theiroperations. Today, a typical datacenter with 1000 racks needs 10 Megawatt ofpower to operate [19]. High energy usage results in high energy cost. Thus, fora datacenter, the energy cost is a significant component of its operating and up-front costs. In addition, in April 2007, Gartner estimated that the Informationand Communication Technologies (ICT) industry generates about 2% of the to-tal global CO2 emissions, which is equal to the aviation industry [8]. According toa report published by the European Union [1], a decrease in emission volume of15–30% is required before the year 2020 to keep the global temperature increasebelow 2oC. Thus, the rapidly growing energy consumption and CO2 emission ofCloud infrastructure has become a key environmental concern [20][4].
Hence, energy efficient solutions are required to ensure the environmentalsustainability of this new computing paradigm. Up to now, as datacenters arethe major elements of Cloud Computing resources, most solutions primarilyfocus on minimizing the energy consumption of datacenters which indirectlyminimizes the CO2 emission [2]. However, although such solutions can decreasethe energy consumption to a great degree, they do not ensure the minimizationof CO2 emissions as a whole. For example, consider a Cloud datacenter whichuses cheap energy generated by coal. The usage of such a datacenter will onlyincrease CO2 emissions.
Therefore, we propose a user-oriented Carbon Aware Green Cloud Archi-tecture for reducing the carbon footprint of Cloud Computing in a wholesomemanner without sacrificing the Quality of Service (QoS) (such as performance,responsiveness and availability) offered by multiple Cloud providers. Our archi-tecture is designed such that it provides incentives to both users and providers toutilize and deliver the most “Green” services respectively. Our evaluation resultsin the context of IaaS Clouds show that a large amount of CO2 savings can begained using our proposed architecture. The contributions of this paper are:
– a novel Carbon Aware Green Cloud Architecture that aims to reduce CO2
emissions without impacting the service performance; and– a Carbon Efficient Green Policy (CEGP) for carbon-based scheduling that
can reduce the carbon footprint of Cloud Computing by 25% compared to abasic Cloud resource management system.
2 Related Work
Most works improve the energy efficiency of Clouds by addressing the issuewithin a particular datacenter and not from the usage of Clouds as a whole.They focus on scheduling and resource management within a single datacen-ter to reduce the amount of active resources executing the workload [2]. Theconsolidation of Virtual Machines (VMs), VM migration, scheduling, demand
projection, heat management, temperature aware allocation, and load balancingare used as basic techniques for minimizing energy consumption. Virtualizationplays an important role in these techniques due to its several benefits such asconsolidation, live migration and performance isolation.
Some works also propose frameworks to enable the energy efficiency of Cloudsfrom user and provider perspectives. From the provider perspective, GreenCloudarchitecture [16] aims to reduce virtualized datacenter energy consumption bysupporting optimized VM migration and VM placement. Similar work is pre-sented by Lefevre et al. [14] who propose Green Open Cloud (GOC). GOC isdesigned for next generation Cloud datacenter that supports facilities like ad-vance reservation. GOC aggregates the workload by negotiating with users sothat idle servers can be switch-off longer.
Although these works maximize the energy efficiency of Cloud datacenters,they do not consider CO2 emission which measures the environmental sustainibil-ity of Cloud Computing. Even if a Cloud provider has used most energy efficientsolutions for building his datacenter, it is still not assured that Cloud Computingwill be carbon efficient. Greenpeace [10] indicates that current datacenters arereally not environmentally friendly as Cloud providers are more concerned aboutreducing energy cost rather than CO2 emission. For instance, Google Datacenterin Lenoir, NC, USA, uses 50.5% of dirty energy generated by coal. Thus, our pre-vious work [7] proposes policies to simultaneously maximize the Cloud provider’sprofit and minimize the CO2 emission of its non-virtualized datacenters. Le etal. [13] consider a similar multi-datacenter scenario, but with a different per-spective of leveraging green energy by capping the brown energy. In contrast,here we propose an architectural framework which focuses on reducing the car-bon footprint of Cloud Computing as a whole. Specifically, we consider all theelements of Cloud computing including Software, Platform, and Infrastructureas a Service. We also present a carbon aware policy for IaaS providers.
3 Carbon Aware Green Cloud Architecture
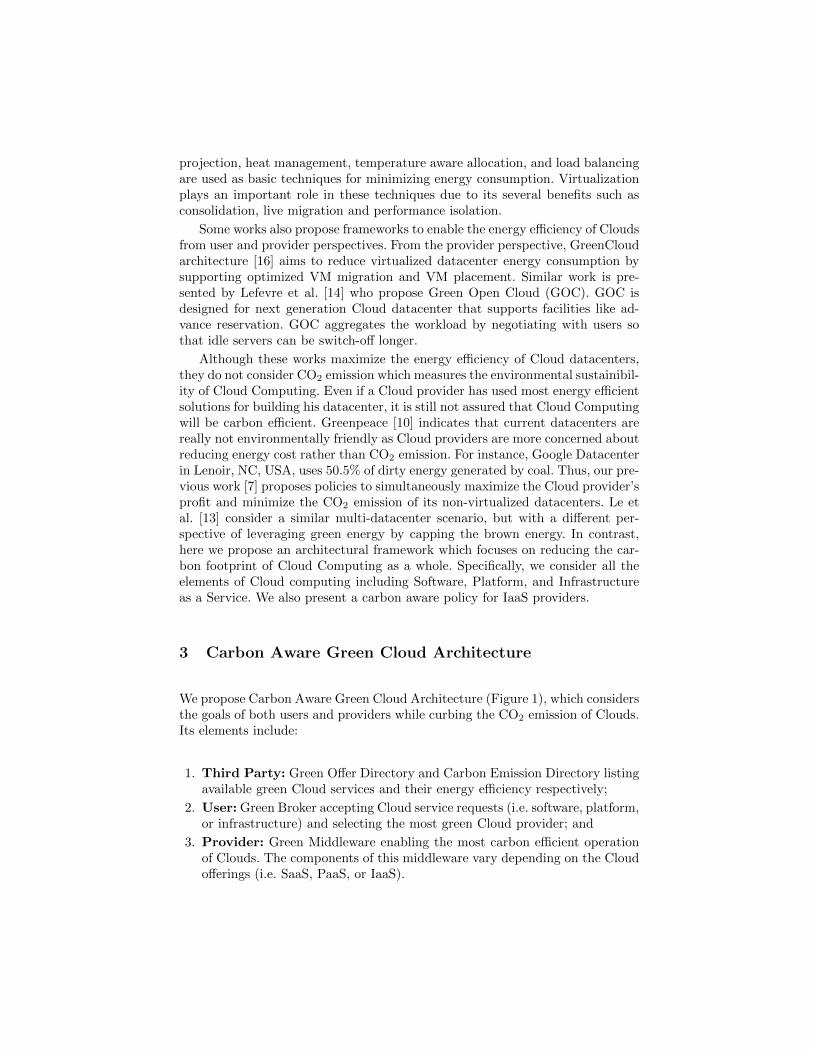
We propose Carbon Aware Green Cloud Architecture (Figure 1), which considersthe goals of both users and providers while curbing the CO2 emission of Clouds.Its elements include:
1. Third Party: Green Offer Directory and Carbon Emission Directory listingavailable green Cloud services and their energy efficiency respectively;
2. User: Green Broker accepting Cloud service requests (i.e. software, platform,or infrastructure) and selecting the most green Cloud provider; and
3. Provider: Green Middleware enabling the most carbon efficient operationof Clouds. The components of this middleware vary depending on the Cloudofferings (i.e. SaaS, PaaS, or IaaS).
Public Cloud B
PrivateCloud
EndUser
CarbonEmissionDirectory
Public Cloud A
1) Request a Cloud service
4) Allocate service
5) Request service allocation
3) Request energy efficiency information
GreenOfferDirectory
2) Request any ‘Green Offer’
Routers Internet
Green Broker
Fig. 1. Carbon Aware Green Cloud Architecture
3.1 Third Party: Green Offer Directory and Carbon EmissionDirectory
We propose two new elements, i.e. Green Offer Directory and Carbon EmissionDirectory, which are essential to enforce the green usage of Cloud Computing.Governments have already introduced energy ratings for datacenters and var-ious laws to cap the energy usage of these datacenters [12][22]. There is alsoincreasing awareness on the impact of greenhouse gases on climate change [10].Therefore, users will likely prefer using Cloud services of providers which ensurethe minimum carbon footprint. Cloud providers can also use these directories asan advertising tool to attract more users. For instance, Google has released theenergy efficiency of its datacenters [17]. Hence, the introduction of such directo-ries is practical in the current context of Cloud Computing.
Cloud providers register their services in the form of ‘Green Offers’ to a GreenOffer Directory which is accessed by Green Broker. These offers consist of thetype of service provided, pricing, and time when it can be accessed for the leastCO2 emission. The Carbon Emission Directory maintains data related to theenergy efficiency of Cloud services, which include the Power Usage Effectiveness(PUE) and cooling efficiency of Cloud datacenters which are providing the ser-vice, network cost, and CO2 emission rate of electricity. Hence, Green Brokercan get the current status of energy parameters for using various Cloud servicesfrom Carbon Emission Directory.
Cloud Programming Environment and Tools: Green Profiler, Power Capping, Green Compiler, WorkflowCloud Hosting Platforms: Admission Control, Pricing (Green Offers), SLA Management, Monitoring, Green Resource Allocation
Cloud Physical Resources: Storage, Virtualized Clusters, Servers, Networks, Energy and Temperature Sensors,Demand Prediction
Power Capping, Green Software Services such as energy-efficient scientific, social networking, gaming applications
User Applications
User and Infrastructure level Platform
C
Infrastructure
Cloud Economy
IaaS
SaaS
SaaS
IaaS
PaaS
Green Broker
User
Cloud Request Services
QoSApplication
ProfilingCloudOffers
CO2 Analysis ServicesCost
CalculatorCO2 Emission
Calculator
Green Information
System
Brokering Services such as scheduling, monitoring
Green Policies
Cloud Leasing
Scheduler
Public Cloud
Public Cloud Services
n Br
Green SaaS
Green PaaS
Green IaaS
Private Cloud
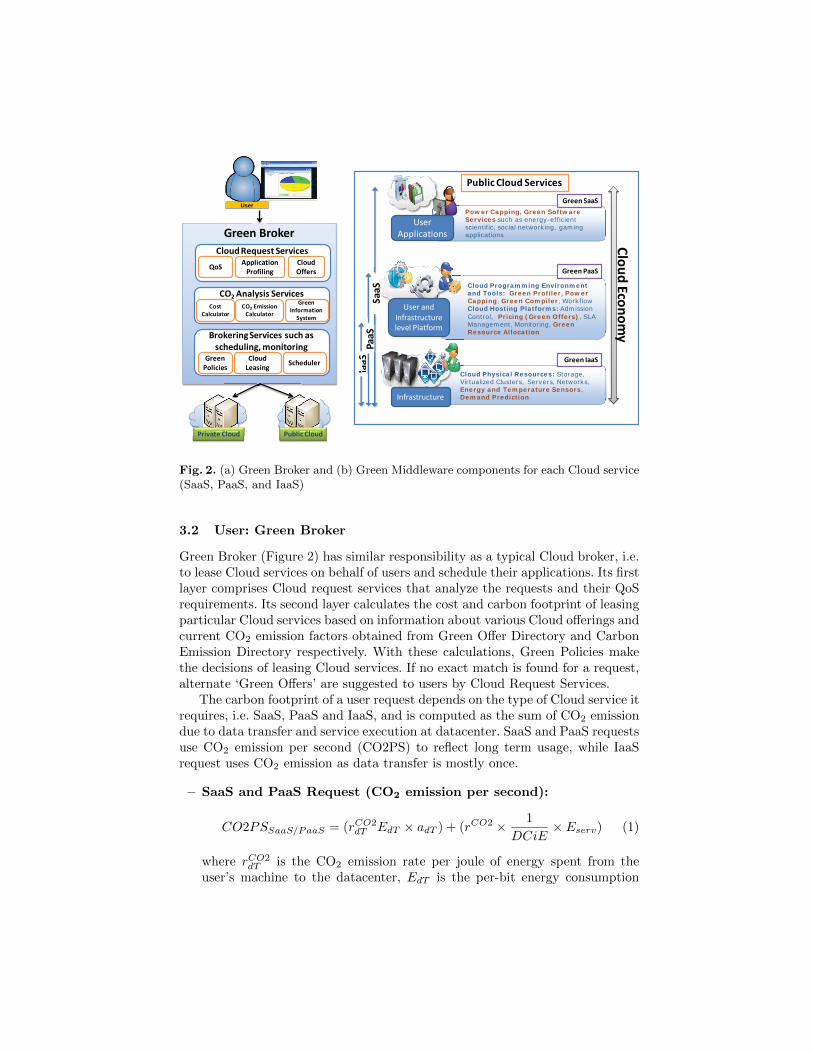
Fig. 2. (a) Green Broker and (b) Green Middleware components for each Cloud service(SaaS, PaaS, and IaaS)
3.2 User: Green Broker
Green Broker (Figure 2) has similar responsibility as a typical Cloud broker, i.e.to lease Cloud services on behalf of users and schedule their applications. Its firstlayer comprises Cloud request services that analyze the requests and their QoSrequirements. Its second layer calculates the cost and carbon footprint of leasingparticular Cloud services based on information about various Cloud offerings andcurrent CO2 emission factors obtained from Green Offer Directory and CarbonEmission Directory respectively. With these calculations, Green Policies makethe decisions of leasing Cloud services. If no exact match is found for a request,alternate ‘Green Offers’ are suggested to users by Cloud Request Services.
The carbon footprint of a user request depends on the type of Cloud service itrequires, i.e. SaaS, PaaS and IaaS, and is computed as the sum of CO2 emissiondue to data transfer and service execution at datacenter. SaaS and PaaS requestsuse CO2 emission per second (CO2PS) to reflect long term usage, while IaaSrequest uses CO2 emission as data transfer is mostly once.
– SaaS and PaaS Request (CO2 emission per second):
CO2PSSaaS/PaaS = (rCO2dT EdT × adT ) + (rCO2 × 1
DCiE× Eserv) (1)
where rCO2dT is the CO2 emission rate per joule of energy spent from the
user’s machine to the datacenter, EdT is the per-bit energy consumption
of data transfer, adT is the data bits transferred per second, rCO2 is theCO2 emission rate where the datacenter is located, DCiE is the power ef-ficiency of the datacenter defined as the fraction of total power dissipatedthat is used for IT resources, and Eserv is the energy spent per second bythe server for executing the user’s request. The total power dissipated by aCloud provider is used not only for computers, but also for other purposes,including power conditioning, HVAC (Heating, Ventilating, and Air Condi-tioning), lighting, and wiring [9]. Therefore, DCiE is the most appropriateparameter for selecting Cloud providers.
– IaaS Request (CO2 emission):
CO2IaaS = (rCO2dT EdT × IOdata) + (rCO2 × 1
DCiE× Eserv × V time) (2)
where IOdata is the data transferred to run application on VM leased fromClouds and V time is the time for which VM is active.
3.3 Provider: Green Middleware
To support carbon aware Cloud Computing, a Cloud provider must implement“Green” conscious middleware at various layers depending on the type of Cloudservice offered (SaaS, PaaS, or IaaS) (Figure 2) as follows:
– SaaS Level: SaaS providers mainly offer software installed in their owndatacenters or resources leased from IaaS providers. Therefore, they requirePower Capping component to limit the usage of software services by eachuser. This is especially important for social networking and game applica-tions where users become completely unaware of their actions on environ-mental sustainability. SaaS providers can also offer Green Software Servicesdeployed on carbon efficient datacenters with less replications.
– PaaS Level: PaaS providers in general offer platform services for appli-cation development and their deployment. Thus, to ensure energy efficientdevelopment of applications, relevant components such as Green Compilerto compile applications with the minimum carbon footprint and carbon mea-suring tools for users to monitor the carbon footprint of their applications.For example, JouleSort [19] is a Green Profiler providing energy efficiencybenchmarks to measure the energy required to perform an external sort.
– IaaS level: IaaS providers play the most crucial role in the success of GreenCloud Architecture since IaaS not only offers independent infrastructure ser-vices, but also support other services (SaaS and PaaS) offered by Clouds.They use the latest technologies for IT and cooling systems to have the mostenergy efficient infrastructure. By using virtualization and consolidation, theenergy consumption is further reduced by switching off unutilized servers.Energy and Temperature Sensors are installed to calculate the current en-ergy efficiency of each IaaS provider and their datacenters. This informationis advertised regularly by Cloud providers in the Carbon Emission Direc-tory. Various green scheduling and resource provisioning policies will ensure
minimum energy usage. In addition, IaaS providers can design attractive‘Green Offers’ and pricing schemes providing incentives for users to use theirservices during off-peak or maximum energy efficiency hours.
4 Case Study: IaaS Cloud
To illustrate the effectiveness of our proposed architecture in reducing the energyand CO2 emissions across the entire Cloud infrastructure in a unified manner, wepresent a simple scenario focussed on IaaS. It considers multiple IaaS providersoffering computational resources to run HPC jobs. A user request consists of anapplication, its estimated length in time, the deadline to complete execution,and the number of resources required. Requests are submitted to Green Brokerwhich interprets and analyzes the service requirements before deciding where toexecute them.
Cloud datacenters have different CO2 emission rates and energy costs basedon their locations. Each datacenter updates this data to Carbon Emission Direc-tory for facilitating carbon efficient scheduling. For this study, we consider threeCO2 emission related parameters: CO2 emission rate (kg/kWh) (rCO2
i ), averageDCiE (Ieffi), and VM power efficiency (VMeffi). The VM power efficiency isthe amount of power dissipated by fully active VM running at maximum uti-lization level [3]. In Green Offer Directory, IaaS providers specify the maximumnumber of VMs that can be initiated at a particular time for achieving the high-est energy efficiency due to the variation in datacenter efficiency with time andload [18] and power capping technologies used within the datacenter [15].
5 Carbon Efficient Green Policy (CEGP)
We develop Carbon Efficient Green Policy (CEGP) for Green Broker to period-ically select the Cloud provider with the minimum carbon footprint and initiateVMs to run the jobs (Algorithm 1). Based on user requests at each schedul-ing interval, Green Broker obtains information from Carbon Emission Directoryabout the current CO2 emission related parameters of providers as describedin Section 4 (Line 2). The QoS requirements of a job j is defined in a tuple(dj , nj , ej , f
mj ), where dj is the deadline to complete job j, nj is the number of
CPUs required for job execution, and ej is the job execution time when operatingat the CPU frequency fmj (Line 3).
CEGP then sorts the incoming jobs based on Earliest Deadline First (EDF)(Line 4), before sorting the Cloud datacenters based on their carbon footprint(Line 5). CEGP schedule jobs to IaaS Clouds in a greedy manner to reducethe overall CO2 emission. For IaaS providers, CEGP uses three main factors tocalculate the CO2 emission: CO2 emission rate, DCiE, and CPU power efficiency.The carbon footprint of an IaaS Cloud i is given by: rCO2
i × 1Ieffi
× 1VMeffi
where VMeffi can be calculated by Cloud providers based on the proportionof resources on a server utilized by the VM using tools such as PowerMeter [3].If a VM consumes the power equivalent to a processor running at fi frequency
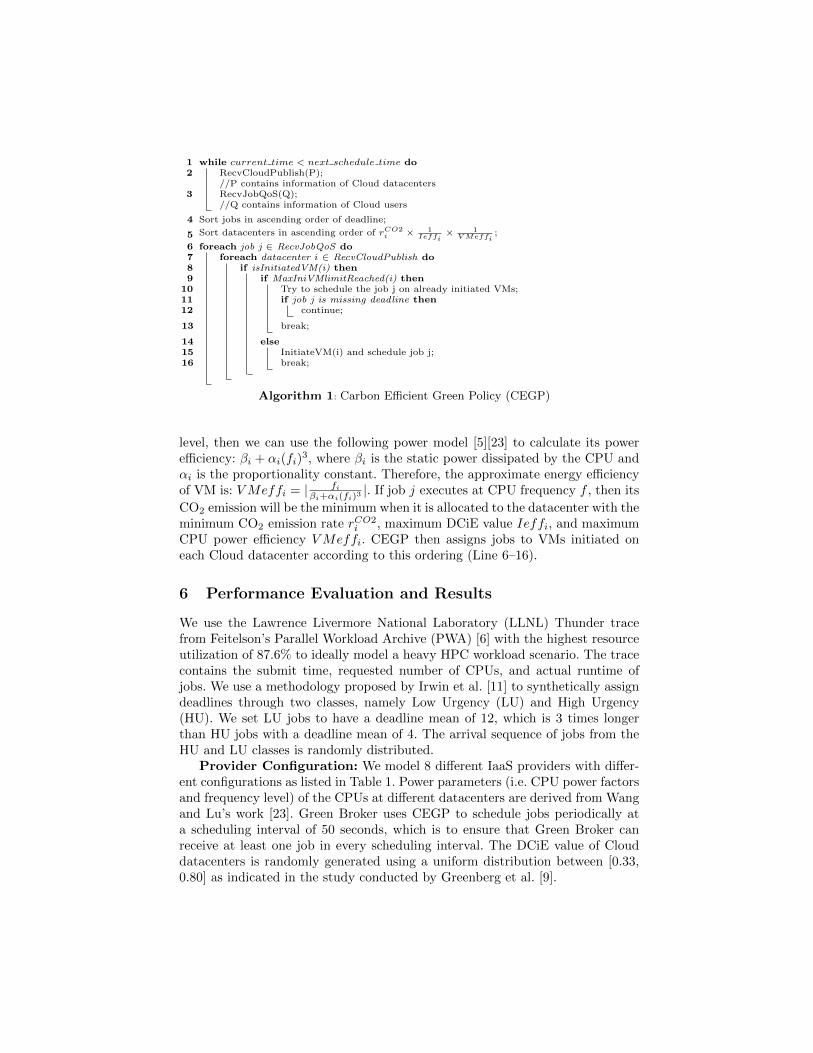
while current time < next scℎedule time do1RecvCloudPublish(P);2//P contains information of Cloud datacentersRecvJobQoS(Q);3//Q contains information of Cloud users
Sort jobs in ascending order of deadline;4
Sort datacenters in ascending order of rCO2i × 1
Ieffi× 1VMeffi
;5
foreach job j ∈ RecvJobQoS do6foreach datacenter i ∈ RecvCloudPublish do7
if isInitiatedVM(i) then8if MaxIniVMlimitReached(i) then9
Try to schedule the job j on already initiated VMs;10if job j is missing deadline then11
continue;12
break;13
else14InitiateVM(i) and schedule job j;15break;16
Algorithm 1: Carbon Efficient Green Policy (CEGP)
level, then we can use the following power model [5][23] to calculate its powerefficiency: �i + �i(fi)
3, where �i is the static power dissipated by the CPU and�i is the proportionality constant. Therefore, the approximate energy efficiencyof VM is: VMeffi = ∣ fi
�i+�i(fi)3∣. If job j executes at CPU frequency f , then its
CO2 emission will be the minimum when it is allocated to the datacenter with theminimum CO2 emission rate rCO2
i , maximum DCiE value Ieffi, and maximumCPU power efficiency VMeffi. CEGP then assigns jobs to VMs initiated oneach Cloud datacenter according to this ordering (Line 6–16).
6 Performance Evaluation and Results
We use the Lawrence Livermore National Laboratory (LLNL) Thunder tracefrom Feitelson’s Parallel Workload Archive (PWA) [6] with the highest resourceutilization of 87.6% to ideally model a heavy HPC workload scenario. The tracecontains the submit time, requested number of CPUs, and actual runtime ofjobs. We use a methodology proposed by Irwin et al. [11] to synthetically assigndeadlines through two classes, namely Low Urgency (LU) and High Urgency(HU). We set LU jobs to have a deadline mean of 12, which is 3 times longerthan HU jobs with a deadline mean of 4. The arrival sequence of jobs from theHU and LU classes is randomly distributed.
Provider Configuration: We model 8 different IaaS providers with differ-ent configurations as listed in Table 1. Power parameters (i.e. CPU power factorsand frequency level) of the CPUs at different datacenters are derived from Wangand Lu’s work [23]. Green Broker uses CEGP to schedule jobs periodically ata scheduling interval of 50 seconds, which is to ensure that Green Broker canreceive at least one job in every scheduling interval. The DCiE value of Clouddatacenters is randomly generated using a uniform distribution between [0.33,0.80] as indicated in the study conducted by Greenberg et al. [9].
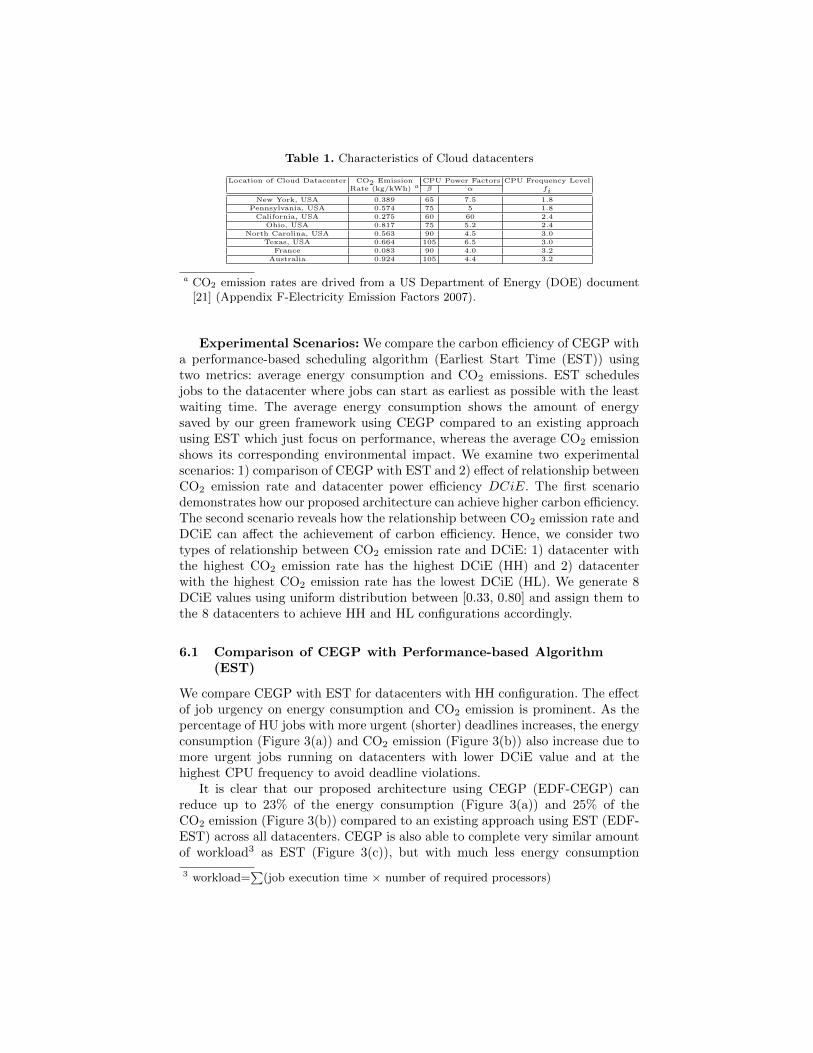
Table 1. Characteristics of Cloud datacenters
Location of Cloud Datacenter CO2 Emission CPU Power Factors CPU Frequency LevelRate (kg/kWh) a � � fi
New York, USA 0.389 65 7.5 1.8
Pennsylvania, USA 0.574 75 5 1.8
California, USA 0.275 60 60 2.4
Ohio, USA 0.817 75 5.2 2.4
North Carolina, USA 0.563 90 4.5 3.0
Texas, USA 0.664 105 6.5 3.0
France 0.083 90 4.0 3.2
Australia 0.924 105 4.4 3.2
a CO2 emission rates are drived from a US Department of Energy (DOE) document[21] (Appendix F-Electricity Emission Factors 2007).
Experimental Scenarios: We compare the carbon efficiency of CEGP witha performance-based scheduling algorithm (Earliest Start Time (EST)) usingtwo metrics: average energy consumption and CO2 emissions. EST schedulesjobs to the datacenter where jobs can start as earliest as possible with the leastwaiting time. The average energy consumption shows the amount of energysaved by our green framework using CEGP compared to an existing approachusing EST which just focus on performance, whereas the average CO2 emissionshows its corresponding environmental impact. We examine two experimentalscenarios: 1) comparison of CEGP with EST and 2) effect of relationship betweenCO2 emission rate and datacenter power efficiency DCiE. The first scenariodemonstrates how our proposed architecture can achieve higher carbon efficiency.The second scenario reveals how the relationship between CO2 emission rate andDCiE can affect the achievement of carbon efficiency. Hence, we consider twotypes of relationship between CO2 emission rate and DCiE: 1) datacenter withthe highest CO2 emission rate has the highest DCiE (HH) and 2) datacenterwith the highest CO2 emission rate has the lowest DCiE (HL). We generate 8DCiE values using uniform distribution between [0.33, 0.80] and assign them tothe 8 datacenters to achieve HH and HL configurations accordingly.
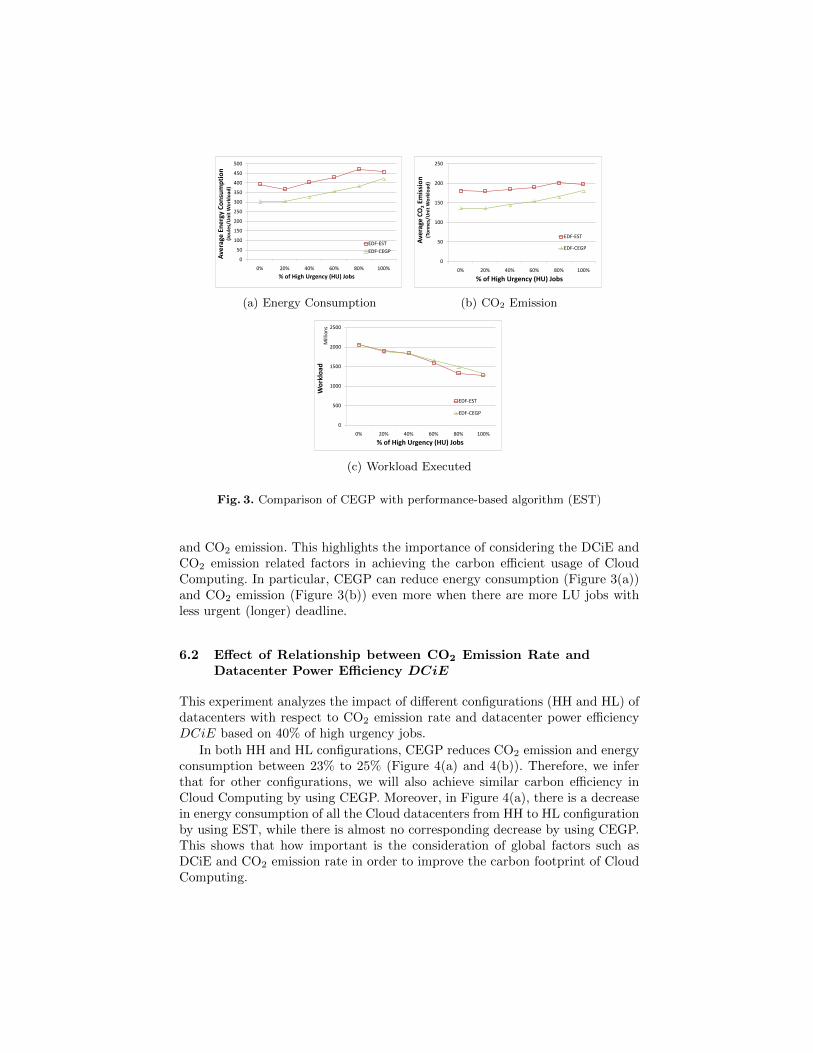
6.1 Comparison of CEGP with Performance-based Algorithm(EST)
We compare CEGP with EST for datacenters with HH configuration. The effectof job urgency on energy consumption and CO2 emission is prominent. As thepercentage of HU jobs with more urgent (shorter) deadlines increases, the energyconsumption (Figure 3(a)) and CO2 emission (Figure 3(b)) also increase due tomore urgent jobs running on datacenters with lower DCiE value and at thehighest CPU frequency to avoid deadline violations.
It is clear that our proposed architecture using CEGP (EDF-CEGP) canreduce up to 23% of the energy consumption (Figure 3(a)) and 25% of theCO2 emission (Figure 3(b)) compared to an existing approach using EST (EDF-EST) across all datacenters. CEGP is also able to complete very similar amountof workload3 as EST (Figure 3(c)), but with much less energy consumption
3 workload=∑
(job execution time × number of required processors)
0
50
100
150
200
250
300
350
400
450
500
0% 20% 40% 60% 80% 100%
Ave
rage
Ene
rgy
Cons
umpt
ion
(Jou
les/
Uni
t Wor
kloa
d)
% of High Urgency (HU) Jobs
EDF-ESTEDF-CEGP
(a) Energy Consumption
0
50
100
150
200
250
0% 20% 40% 60% 80% 100%
Ave
rage
CO
2Em
issi
on(T
onne
s/U
nit W
orkl
oad)
% of High Urgency (HU) Jobs
EDF-EST
EDF-CEGP
(b) CO2 Emission
0
500
1000
1500
2000
2500
0% 20% 40% 60% 80% 100%
Wor
kloa
dM
illio
ns
% of High Urgency (HU) Jobs
EDF-EST
EDF-CEGP
(c) Workload Executed
Fig. 3. Comparison of CEGP with performance-based algorithm (EST)
and CO2 emission. This highlights the importance of considering the DCiE andCO2 emission related factors in achieving the carbon efficient usage of CloudComputing. In particular, CEGP can reduce energy consumption (Figure 3(a))and CO2 emission (Figure 3(b)) even more when there are more LU jobs withless urgent (longer) deadline.
6.2 Effect of Relationship between CO2 Emission Rate andDatacenter Power Efficiency DCiE
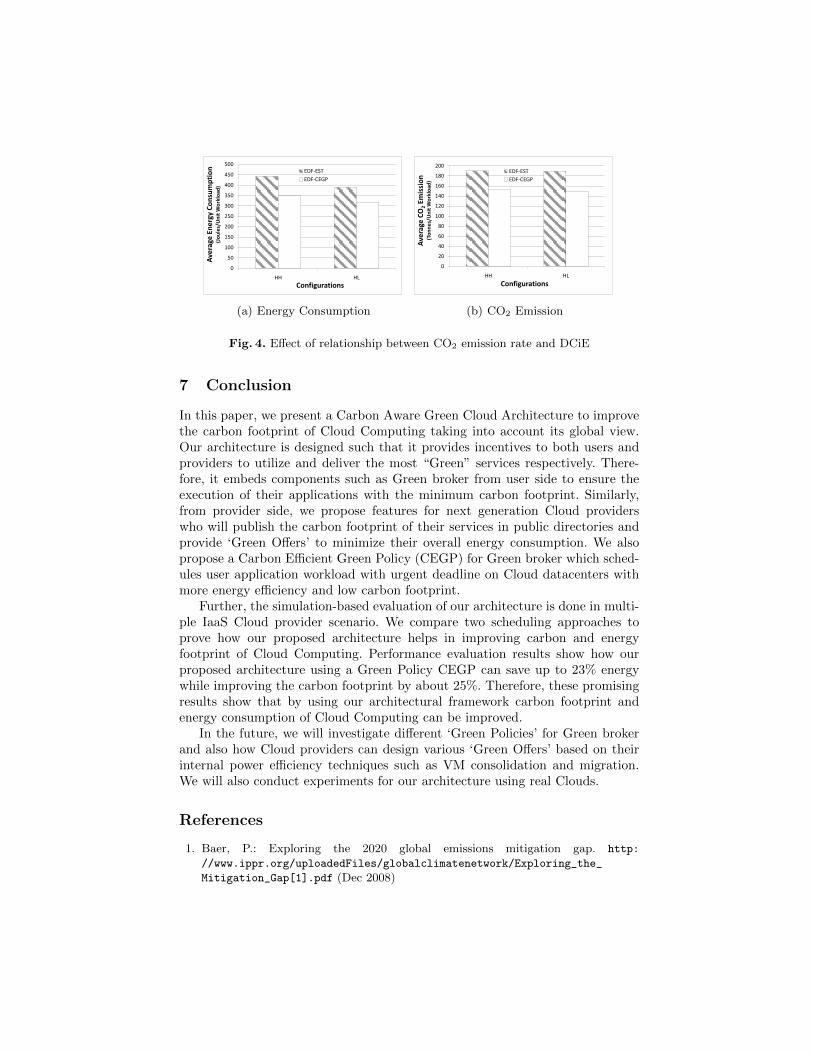
This experiment analyzes the impact of different configurations (HH and HL) ofdatacenters with respect to CO2 emission rate and datacenter power efficiencyDCiE based on 40% of high urgency jobs.
In both HH and HL configurations, CEGP reduces CO2 emission and energyconsumption between 23% to 25% (Figure 4(a) and 4(b)). Therefore, we inferthat for other configurations, we will also achieve similar carbon efficiency inCloud Computing by using CEGP. Moreover, in Figure 4(a), there is a decreasein energy consumption of all the Cloud datacenters from HH to HL configurationby using EST, while there is almost no corresponding decrease by using CEGP.This shows that how important is the consideration of global factors such asDCiE and CO2 emission rate in order to improve the carbon footprint of CloudComputing.
0
50
100
150
200
250
300
350
400
450
500
HH HL
Ave
rage
Ene
rgy
Cons
umpt
ion
(Jou
les/
Uni
t Wor
kloa
d)
Configurations
EDF-ESTEDF-CEGP
(a) Energy Consumption
0
20
40
60
80
100
120
140
160
180
200
HH HL
Ave
rage
CO
2Em
issi
on(T
onne
s/U
nit W
orkl
oad)
Configurations
EDF-ESTEDF-CEGP
(b) CO2 Emission
Fig. 4. Effect of relationship between CO2 emission rate and DCiE
7 Conclusion
In this paper, we present a Carbon Aware Green Cloud Architecture to improvethe carbon footprint of Cloud Computing taking into account its global view.Our architecture is designed such that it provides incentives to both users andproviders to utilize and deliver the most “Green” services respectively. There-fore, it embeds components such as Green broker from user side to ensure theexecution of their applications with the minimum carbon footprint. Similarly,from provider side, we propose features for next generation Cloud providerswho will publish the carbon footprint of their services in public directories andprovide ‘Green Offers’ to minimize their overall energy consumption. We alsopropose a Carbon Efficient Green Policy (CEGP) for Green broker which sched-ules user application workload with urgent deadline on Cloud datacenters withmore energy efficiency and low carbon footprint.
Further, the simulation-based evaluation of our architecture is done in multi-ple IaaS Cloud provider scenario. We compare two scheduling approaches toprove how our proposed architecture helps in improving carbon and energyfootprint of Cloud Computing. Performance evaluation results show how ourproposed architecture using a Green Policy CEGP can save up to 23% energywhile improving the carbon footprint by about 25%. Therefore, these promisingresults show that by using our architectural framework carbon footprint andenergy consumption of Cloud Computing can be improved.
In the future, we will investigate different ‘Green Policies’ for Green brokerand also how Cloud providers can design various ‘Green Offers’ based on theirinternal power efficiency techniques such as VM consolidation and migration.We will also conduct experiments for our architecture using real Clouds.
References
1. Baer, P.: Exploring the 2020 global emissions mitigation gap. http:
//www.ippr.org/uploadedFiles/globalclimatenetwork/Exploring_the_
Mitigation_Gap[1].pdf (Dec 2008)
2. Beloglazov, A., Buyya, R., Lee, Y., Zomaya, A.: A Taxonomy and Survey ofEnergy-Efficient Data Centers and Cloud Computing Systems. Advances in Com-puters, M. Zelkowitz (editor). Elsevier, San Francisco, USA (2011)
3. Bohra, A., Chaudhary, V.: Vmeter: Power modelling for virtualized clouds. In:Proc. of 24th IEEE IPDPS Workshops. Atlanta, USA (2010)
4. Cameron, K.: Trading in Green IT. Computer 43(3), 83–85 (2010)5. Chen, Y., et al.: Managing server energy and operational costs in hosting centers.
ACM SIGMETRICS Performance Evaluation Review 33(1), 303–314 (2005)6. Feitelson, D.: Parallel workloads archive. http://www.cs.huji.ac.il/labs/
parallel/workload (2011)7. Garg, S., Yeo, C., Anandasivam, A., Buyya, R.: Environment-conscious scheduling
of HPC applications on distributed cloud-oriented data centers. Journal of Paralleland Distributed Computing 71(6), 732–749 (2011)
8. Gartner: Gartner Estimates ICT Industry Accounts for 2 Percent of Global CO2Emissions. http://www.gartner.com/it/page.jsp?id=503867 (Apr 2007)
9. Greenberg, S., et al.: Best practices for data centers: Results from benchmarking 22data centers. In: ACEEE Summer Study on Energy Efficiency in Buildings (2006)
10. Greenpeace International: Make IT green: Cloud computing and its contributionto climate change (2010)
11. Irwin, D., Grit, L., Chase, J.: Balancing risk and reward in a market-based taskservice. In: Proc. of 13th IEEE HPDC. Honolulu, USA (2004)
12. Kurp, P.: Green computing. Commun. ACM 51, 11–13 (2008)13. Le, K., et al.: Managing the cost, energy consumption, and carbon footprint of
internet services. ACM SIGMETRICS Perf. Eval. Review 38(1), 357–358 (2010)14. Lefevre, L., Orgerie, A.: Designing and evaluating an energy efficient Cloud. The
Journal of Supercomputing 51(3), 352–373 (2010)15. Lefurgy, C., Wang, X., Ware, M.: Power capping: a prelude to power shifting.
Cluster Computing 11(2), 183–195 (2008)16. Liu, L., et al.: GreenCloud: a new architecture for green data center. In: Proc. of
6th International Conference on Autonomic Computing. Barcelona, Spain (2009)17. Miller, R.: Google: Raise Your Data Center Temperature.
http://www.datacenterknowledge.com/archives/2008/10/14/
google-raise-your-data-center-temperature (Oct 2008)18. Patel, C., et al.: Energy Aware Grid: Global Workload Placement based on Energy
Efficiency. Technical Report HPL-2002-329, HP Labs, Palo Alto (2002)19. Rivoire, S., Shah, M.A., Ranganathan, P., Kozyrakis, C.: Joulesort: a balanced
energy-efficiency benchmark. In: Proc. of ACM SIGMOD. Beijing, China (2007)20. Tomlinson, B., Silberman, M.S., White, J.: Can More Efficient IT Be Worse for
the Environment? Computer 44, 87–89 (2011)21. U.S. DOE: Voluntary Reporting of Greenhouse Gases: Appendix F. Electric-
ity Emission Factors. http://www.eia.doe.gov/oiaf/1605/pdf/Appendix%20F_
r071023.pdf (2007)22. U.S. EPA: Report to Congress on Server and Data Center Energy Efficiency, Public
Law 109-431 (Aug 2007)23. Wang, L., Lu, Y.: Efficient Power Management of Heterogeneous Soft Real-Time
Clusters. In: Proc. of 29th IEEE RTSS. Barcelona, Spain (2008)