Embed Size (px)
Citation preview

1 3
Catal Lett
DOI 10.1007/s10562-016-1906-3
Green Catalytic Degradation of Ethyl Acetate Incurred by Strong
Interaction Between PdO and Ce0.5Co0.5 Support at Low
Temperature
Sadia Akram1,2 · Lan Chen1 · Qi Wang1 · Xiaorui Zhang1,2 · Ning Han3 · Genli Shen1 ·
Zhen Wang1 · Guanglu Ge1
Received: 27 September 2016 / Accepted: 31 October 2016
© Springer Science+Business Media New York 2016
5 × 10⁻⁴ mol gcat−1 s− 1. The enhanced catalytic activity of
the Ce/Co-supported noble metal catalyst (PdO/Ce0.5Co0.5)
is attributed to the strong metal-support interaction (SMSI).
The efect of PdO addition and its interaction with the sup-
port has been investigated by a set of comprehensive char-
acterization technologies on an elaborately-designed model
catalytic system. In addition, in-situ DRIFT analysis shows
that no harmful intermediate product, such as aldehydes
other than alcohols and acetate is produced during the reac-
tion, suggesting this promising green approach.
Abstract Metal oxide-supported noble metal catalysts
have been conirmed to be highly eicient and green in
catalytic degradation of VOCs at low temperature and high
concentration. Understanding the interaction between the
noble metal and various oxide supports is crucial in improv-
ing catalytic performance. Herein, lattice doped Ce-Co
composite oxide (Ce0.5Co0.5) has been used to support PdO
species for the decomposition of ethyl acetate (EA). The
catalytic activity of the supported PdO catalyst at a feed
rate R140 °C = 1.38 × 10⁻⁴ mol gcat−1 s− 1 was enhanced com-
pared with that of the support at a feed rate R140 °C = 0.7
Sadia Akram and Lan Chen have contributed equally.
Electronic supplementary material The online version of this
article (doi:10.1007/s10562-016-1906-3) contains supplementary
material, which is available to authorized users.
* Zhen Wang
* Guanglu Ge
1 CAS Key Laboratory of Standardization and Measurement
for Nanotechnology, and CAS Centre for Excellence
in Nanoscience, National Centre for Nanoscience
and Technology, No.11 Zhongguancun Beiyitiao,
Beijing 100190, China
2 University of Chinese Academy of Science, No. 19 A
Yuquan Road, Beijing 100049, China
3 State Key Laboratory of Multiphase Complex Systems,
Institute of Process Engineering, Chinese Academy
of Sciences, Beijing 100190, China

S. Akram et al.
1 3
Graphical Abstract
Keywords Strong metal-support interaction · Highly
eicient · Ethyl acetate · Catalytic degradation · In-situ
DRIFT
1 Introduction
Over the past decade, the emission of volatile organic
compounds (VOCs) has become a hot topic as they are
the major contributors to the production of photochemi-
cal smog and ground level ozone. They are emitted from
numerous industrial and anthropogenic sources and are
hazardous to human health as they are mutagenic and car-
cinogenic. Thus, to relate the VOCs emission and exposure
with mortality and morbidity is reasonable. These health
and environmental issues have led numerous countries to
regulate the policies aimed at the reduction and emanation
of VOCs [1–6].
To date, a substantial amount of research work has been
done to develop technologies for the eicient removal of
VOCs. Among these technologies, catalytic oxidation is
very promising to meet the requirements such as high com-
petency at low temperature, eco-friendliness, low cost,
energetically afordability along with negligible production
of SOx and NOx [7].
VIIIB noble metals such as palladium and platinum
containing catalysts are very useful and indispensible to
achieve higher catalytic activities at lower temperature
owing to their enhanced resistance to thermal deactivation,
excellent catalytic activity and facile catalyst regeneration
[8–10]. However, these precious metals are expensive due
to the limited reserves. Thus, the fabrication of the catalyst
with least amount of noble metal is of importance for efec-
tive use of the precious species. The noble metal decorated
catalysts is one of widely-used approaches to achieve this
goal, where the noble metal species are well-dispersed and
spread over oxide substrates forming active component by
the minimum usage of Pd or Pt along with the enhanced
stability and improved performances [11, 12]. In addition,
the interaction between noble metal and its support named
“strong metal-support interaction” (SMSI) signiicantly
afects the catalytic properties of the system and can be
tuned by the chemical nature of support and the extent of
the noble metal dispersion. Thus the excise control to the
interaction between the interface of the noble metal parti-
cles and the support is a pivot factor to improve the cata-
lytic activity and catalyst life [13, 14].
In this regard, ceria is the most popular rare earth oxide
widely used as a support alone or by hybridizing with other
metal oxides, because of its unique redox performance and
remarkable oxygen storage/mobility properties [15–22].
However, the detailed understanding of the reaction mecha-
nism and the interaction between the noble metal and its
support remains elusive due to complex nature of these
catalytic systems.
Recently [21] our group has investigated a series of lat-
tice doped CeO2-Co3O4 nanocomposites for the oxidative
removal of EA and determined the interaction between
Green Catalytic Degradation of Ethyl Acetate Incurred by Strong Interaction Between PdO and…
1 3
the components of composite oxide that afects the cata-
lytic activity. In this work, the main focus is to explore
the efect of PdO addition to the system and its interaction
with support (Ce0.5Co0.5) as well as its impacts on VOCs
oxidation performance at signiicantly reduced tempera-
ture under a concentrated feed stream. In order to evaluate
the efect of PdO addition, the physiochemical properties
and the catalytic performance for both support and noble
metal deposited catalyst, XRD, XPS, Raman and TPR
analysis have been used to systematically investigate the
interaction between Ce0.5Co0.5 and the PdO. Furthermore,
detailed investigation on the degradation mechanism of EA
by time resolved in-situ DRIFT analysis has been done. It is
anticipated that the model catalytic system described here
would be generally applicable in the development of other
similar catalysts for the complete catalytic degradation of
EA or similar organic compounds by a greener approach at
reduced temperature without the formation of other harm-
ful intermediates other than alcohols and acetates.
2 Experimental
2.1 Catalyst Preparation
A facile surfactant-free hydrothermal method is used to
prepare the support materials (Ce0.5Co0.5) synthesized from
the nitrates of cerium and cobalt in accordance with the
procedure described previously [21]. In a typical prepara-
tion, an aqueous solution of concentrated NaOH (6M) was
mixed with a aqueous solution of Ce(NO3)3·6H2O (Sinop-
harm chemical reagents, 99%) and Co(NO3)2 6H2O (Tian-
jin Fuchen chemical reagents, 99%) in appropriate amount.
The resulting solution was poured into a Telon lined auto-
clave, heated and kept at 120 °C for 24 h in an oven. The
resultant precipitates were washed with distilled water and
ethanol sequentially for several times and collected by cen-
trifugation. The obtained product was dried at 80 °C and
calcinated at 550 °C for more than 2 h. PdO/Ce0.5Co0.5
was synthesized with a modiied multi-step method [23].
Firstly, the as-synthesized Ce0.5Co0.5 was mixed with Na2P-
dCl4 solution (0.01 M, 10 mL) at room temperature and an
appropriate amount of Na3C6H5O7·2H2O was added as the
reducing agent into the mixture after it rises to 60 °C. The
reaction mixture was processed at the temperature for 5 h.
Finally, the precipitates were harvested, dried under vac-
uum at 80 °C for 24 h and calcined under ambient atmos-
phere at 550 °C for 2 h.
2.2 Characterization
Surface composition was determined by X-ray photo-
electron spectroscopy (XPS) using an ESCALab220i-XL
electron spectrometer from VG Scientiic with a mono-
chromatic Al Kα radiation. The binding energy (BE) was
referenced to the C1s line at 284.8 eV from adventitious
carbon.
The textural characterization was obtained from the
adsorption isotherms of N2 at 77 K using an Autosorb-1
analyzer (Quantachrome). Before measurement, the sam-
ples were degassed at 573 K for 4 h under vacuum. The
crystal structure of the materials was examined by X-ray
difraction (XRD, Philips X’pert PRO) equipped with a
Cu Kα radiation source (λe = 0.154187 nm) at a scanning
rate of 0.03° s−1 (2θ from 10° to 90°). The selected samples
were also analyzed by Inductively Coupled Plasma-Mass
Spectrometry (ICP-MS) to determine the content of Ce,
Co and Pd in each sample. Raman study was carried out
by InVo- RENISHAW system at room temperature using a
514.5 nm laser.
Morphological and compositional characterization
was carried out by high resolution transmission electron
microscopy (HRTEM) (Tecnai G2 F20 U-TWIN) with an
accelerating voltage of 200 kV.
TPD measurements were carried out using NH3 and CO2
as probe molecules for acidity and basicity analysis, respec-
tively. The operations were performed with a U-type quartz
reactor equipped with Automated Catalyst Characterization
System (Autochem 2920, MICROMERITICS). A typical
experiment used a 100 mg sample (40–60 mesh) and a gas
low rate of 20 mL/min. The catalysts were irstly degassed
under He low at 823 K for 1 h. Subsequently, the sample
was allowed to cool to 313 K under He low. NH3-He or
CO2-He was passed over the catalyst for 1 h at a rate of
10 mL/min to ensure complete adsorption. For desorption,
the NH3 or CO2 saturated catalyst was then ramped from
313 K to 823 K at a heating rate of 10 K/min with He as
the carrier to cause desorption. This amount desorbed at
various temperatures is an indicator of the catalyst acidity
or basicity respectively, and is expressed as millimole of
absorbent per gram adsorbate.
To acquire the information of the sample reducibility,
hydrogen temperature-programmed reduction (H2-TPR)
was conducted in a U-type quartz reactor equipped with
Automated Catalyst Characterization System (Autochem
2920, MICROMERITICS). 50 mg of each sample (40–60
mesh) used for the analysis was loaded and pre-treated with
an air low mixed by 5% O2 and 95% He (50 mL min− 1)
at 423 K for 1 h and cooled to 323 K under a helium low.
The samples were then re-heated to 1173 K at a rate of
10 K min−1 under a low consisting of 10% H2 and 90% Ar
(50 mL min−1) to obtained TPR signals.
In-situ difuse relectance infrared Fourier transform
spectroscopy (DRIFTS) were carried out on a Nicolet
6700 FTIR itted with a liquid nitrogen-cooled mercury–
cadmium–telluride detector (MCT). The DRIFTS cell
S. Akram et al.
1 3
(Harrick, HVC-DRP) itted with CaF2 windows was used
as the reaction chamber where the samples are allowed to
be heated to 600 °C. The spectra of 50 mg of samples were
recorded with the reaction progressed from RT to 400 °C
under comparable conditions. All the spectra were col-
lected within the range of 4000–1200 cm−1 at a resolution
of 4 cm−1 and 64 scans per test. The composition of the
feed stream is same to that of the catalytic reaction.
2.3 Catalytic Tests
The as-prepared support and Ce-Co-supported PdO cata-
lysts have been evaluated for the oxidation of EA. The
catalytic reactions were performed in a continuous-low
ixed-bed reactor containing 100 mg of catalyst samples
(40–60 mesh) under ambient pressure. A standard reac-
tion gas i.e. 1500 ppm of EA in a mixture of 25% O2 and
75% N2 was continuously fed at the rate of 100 mL min−1.
The weight hourly space velocity (WHSV) is typically
60,000 mL g−1 h−1. On-line analysis on the products was
done by GC/MS (Hewlett–Packard 6890N gas chroma-
tograph interfaced to a Hewlett–Packard 5973N mass
selective detector) with a HP-5MS capillary column
(30 m × 0.25 mm × 0.25 μm). The catalytic activity is deter-
mined by the conversion of EA into CO2 as shown below:
3 Results and Discussion
3.1 Physiochemical Characterization of the Catalysts
Wide-angle XRD patterns of the as-prepared catalysts are
shown in Fig. 1a. The peaks at 2θ = 28.5°, 33.1°, 47.5°,
56.4°, 69.4°, and 76.8° in pure CeO2 are well-resolved
and assigned to the typical luorite cubic CeO2 (JCPDS
# 81-0792). In the case of pure Co3O4, all the difraction
peaks at 2θ = 31.3°, 36.9°, 44.8°, 59.4° and 65.4° match
well with the spinal structure of Co3O4 (JCPDS # 74-2120).
As seen in Fig. 1a, the pure compound shows better crys-
tallinity than their composite counterparts. No crystalline
peaks of the isolated PdO or spurious phases are observed
in PdO/Ce0.5Co0.5 suggesting Pd clusters is too small to be
identiied by XRD and well-dispersed over the whole cata-
lyst. Figure 1b reveals that the difraction peak (2θ = 28.6°)
of the support materials (Ce0.5Co0.5) shifts to higher 2θ
value with the increase of the dopant in pure CeO2 phase,
which implies the insertion of cobalt atoms into ceria lat-
tice to form Ce–Co–O solid solution resulted in a contrac-
tion of the lattice parameters from 0.54 to 0.537 nm for
CeO2 phase [24]. Since the efective ionic radius of Co3+
Xethylacetate =Cethylacetate(in) − Cethylacetate(out)
Cethylacetate(in)
× 100%
(0.065 nm) or Co2+ (0.082 nm) is smaller than that of Ce4+
(0.111 nm), these ions can easily replace Ce4+ and enter
into CeO2 lattice [25, 26]. Lattice microstrain is, therefore
produced by such replacement, which is evaluated by XRD
analysis and is given in supporting information (SI) (Fig.
S1). The value for pure CeO2 (ɛ = 0.550) is found to be
lower than that of Ce0.5Co0.5 (ɛ = 0.759), which again con-
irms the insertion of cobalt ions into ceria lattice result-
ing in the increase of the strain-related defects, i.e. oxygen
vacancy and oxygen mobility compared with pure CeO2.
However, the lattice strain is somehow relaxed (ɛ = 0.668)
when Pd species are dispersed on the surface of this com-
posite, indicating that a strong interaction exists between
the active metal and support [27]. The enhanced catalytic
activity of PdO/Ce0.5Co0.5 is considered to be imluenced
by this factor and further discussion will be seen in the fol-
lowing paragraphs.
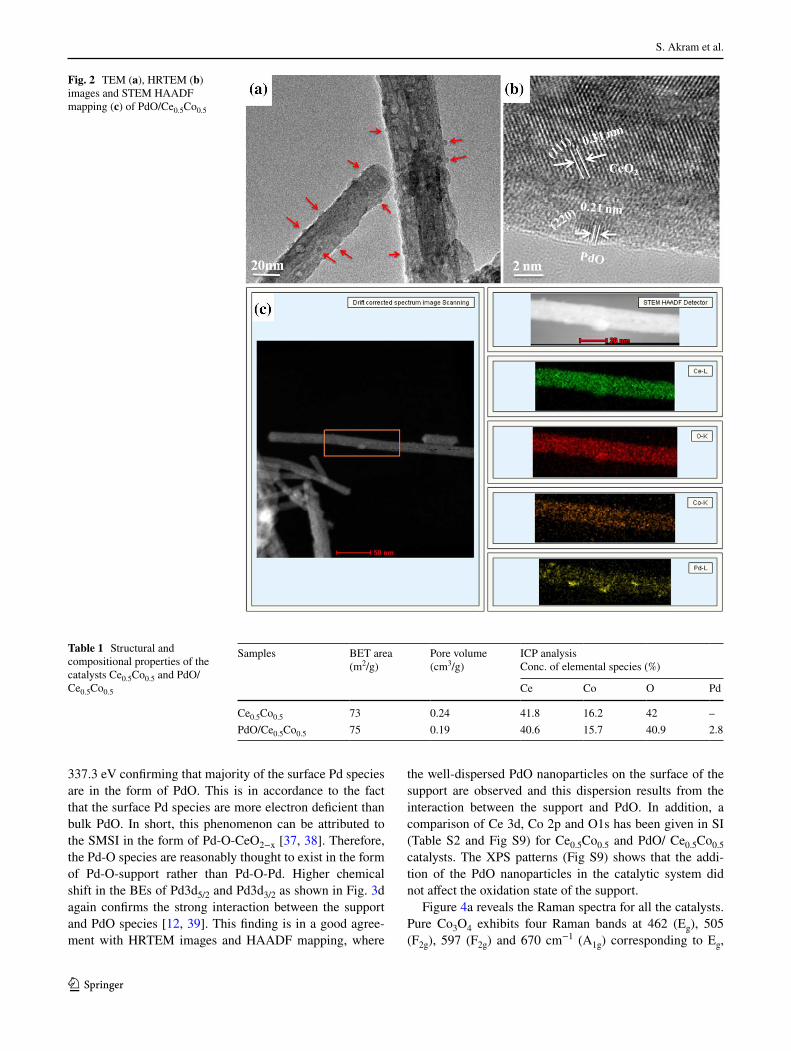
For the detailed investigation on morphological charac-
ters, crystal structure and dispersion of active metal over
the support, TEM and HRTEM and HAADF mapping were
conducted (Fig. 2). A typical TEM image (Fig. S2) dem-
onstrate the rod-like shape of the support with a length of
150–200 nm and diameter of 20–30 nm. In case of PdO/
Ce0.5Co0.5 (Fig. 2a), it can be seen that the addition of PdO
species did not alter the shape and size of the support mate-
rials which remains as nanorods, while the shape of PdO is
spherical particles with a size of 2–5 nm marked by the red
arrows. As identiied by HRTEM, the crystal fringes can
be assigned to (220) crystal plane of Pd species (PdO) and
(111) crystal plane of the ceria (Fig. 2b). A careful EDX
analysis of PdO/Ce0.5Co0.5 (Fig. S3) concludes that the cat-
alyst is indeed composed of no elements other than Ce, Co,
Pd and O. The minor peak of Cu is from the Cu TEM grids.
In addition, the homogeneous dispersion of both the noble
metal and support throughout the whole PdO/Ce0.5Co0.5
catalyst is observed by HAADF mapping (Fig. 2c), which
is crucial to cause the interaction between support and
active metal [28].
Thermogravimetric analysis (TGA) proiles of PdO/
Ce0.5Co0.5 (Fig. S4) shows almost no weight loss up to
600 °C, attributed to the highly stable nature of the cata-
lyst without elemental loss including Pd species except for
negligible amount of the adsorbed water molecules. The
BET surface area of PdO/Ce0.5Co0.5 is almost similar to
that of Ce0.5Co0.5 (Table 1). Furthermore the pore volume
of PdO/Ce0.5Co0.5 decreases slightly indicating that the
Pd species are not fully incorporated into the pores of the
support (Table 1) and prevent the destruction of the stack-
ing pores. The composition of the catalyst was determined
by ICP-MS (Table 1). The content of Ce and Co is 41.8
and 16.2 wt% respectively in the compound while oxygen
account for the remaining 42 wt%. Pd content is 2.8% for
the PdO/Ce0.5Co0.5 catalyst as analyzed by ICP-MS.

Green Catalytic Degradation of Ethyl Acetate Incurred by Strong Interaction Between PdO and…
1 3
XPS not only provides the information about the surface
composition and electronic state of the catalyst but also is
a powerful tool to study the interaction between the sup-
port and active metal component. Figure 3a illustrates the
XPS spectra of Ce 3d. The peaks are itted by Gaussian-
Lorenz model and the obtained 6 main features (V0, V0′, V1, V1′, V2, V2′) can be ascribed to Ce4+ 3d inal states [29,
30]. The high binding energy (BE) doublet (V2/V2′ and V1/
V1′) is attributed to the inal state of Ce(IV)3d94f0O2p6 and
Ce(IV)3d94f1O2p5 respectively, while the V0/V0′ doublet
corresponds to the state of Ce(IV)3d94f2O2p4. Therefore,
the dominant oxidation state of Ce species in the support
is tetravalent [31]. The characteristic peaks of Ce3+ are also
observed and labeled as U1/U1′ and U0/U0′, whereas the
relative amount of Ce3+ is calculated to be 23% (SI: Eq. 1)
based on the integrated peak areas for both Ce3+ and Ce4+.
A previous report has described the correlation between
Ce3+ and the formation of oxygen vacancies in the cata-
lyst, which play a vital role in the storage and mobility of
oxygen during catalysis [32]. As seen from the above XPS
results, it is clear that the support solid solution consists of
both Ce4+ and Ce3+ species where the amount of Ce4+ is
dominant.
As seen in Fig. 3b, Co 2p spectra present two main
peaks at higher (794.4 eV) and lower (779.2 eV) BE attrib-
uted to Co 2p1/2 and Co 2p3/2, respectively. Due to small
diference in the BE of Co2+ and Co3+, they are not easily
distinguished. It is well known that ΔE value (Co 2p peaks)
for CoO, Co2O3, and Co3O4 is 16.0, 15.0 and 15.2 eV
respectively [33, 34]. The examined ΔE value in Co 2p
spectra is 15.2 eV so Co3O4 is considered as the main phase
of cobalt in support which is consistent with XRD analysis.
The spectrum of Ce0.5Co0.5 in Fig. 3c shows a peak
with a broad shoulder attributed to the overlapping of dif-
ferent oxygen species (O1s), which can be deconvoluted
into three peaks at low, medium and high BEs respectively.
The peak at low BE (529.0 eV) is attributed to lattice oxy-
gen atoms (O2−, denoted as Oα). The peak at medium BE
(531.0 eV) is denoted as Oβ indicate the surface adsorbed
oxygen species (O2−, O− or O22−) while a broad shoulder
at higher BE (533.5 eV, denoted as Oγ) refers to the pres-
ence of the defective oxides, hydroxylated or carbonated
oxygen on the surface of the catalysts [35]. The relative
concentration of the lattice oxygen species in terms of Oα
vs Oβ for the pure CeO2, Co3O4 and composite oxide sup-
port (Ce0.5Co0.5) is calculated in our previous work, which
conirms that Ce0.5Co0.5 possesses the highest ratio of Oα/
Oβ. This again approves that the enhanced lattice oxygen
storage and mobility is caused by CeO2–Co3O4 interaction
[36].
Figure 3d shows two distinct peaks at 337.2 and
342.6 eV assigned to Pd3d5/2 and Pd3d3/2 respectively.
BE for Pd3d5/2 with diferent valence has slight varia-
tion where the peaks at 337.7–338.4 eV, 336.7–336.9 eV
and 335.0–335.4 eV are attributed to Pd4+, Pd2+ and Pd0,
respectively. According to the previous report, the Pd2+
(PdO) 3d5/2 and 3d3/2 BE values are around ~337.0 and
~342.0 eV [37], close to one of the XPS proile lines at
Fig. 1 XRD (a) wide-angle
patterns, and (b) Enlarged-zone
patterns. Crystalline phases
detected CeO2 (asterisk), Co3O4
(illed circle)
S. Akram et al.
1 3
337.3 eV conirming that majority of the surface Pd species
are in the form of PdO. This is in accordance to the fact
that the surface Pd species are more electron deicient than
bulk PdO. In short, this phenomenon can be attributed to
the SMSI in the form of Pd-O-CeO2−x [37, 38]. Therefore,
the Pd-O species are reasonably thought to exist in the form
of Pd-O-support rather than Pd-O-Pd. Higher chemical
shift in the BEs of Pd3d5/2 and Pd3d3/2 as shown in Fig. 3d
again conirms the strong interaction between the support
and PdO species [12, 39]. This inding is in a good agree-
ment with HRTEM images and HAADF mapping, where
the well-dispersed PdO nanoparticles on the surface of the
support are observed and this dispersion results from the
interaction between the support and PdO. In addition, a
comparison of Ce 3d, Co 2p and O1s has been given in SI
(Table S2 and Fig S9) for Ce0.5Co0.5 and PdO/ Ce0.5Co0.5
catalysts. The XPS patterns (Fig S9) shows that the addi-
tion of the PdO nanoparticles in the catalytic system did
not afect the oxidation state of the support.
Figure 4a reveals the Raman spectra for all the catalysts.
Pure Co3O4 exhibits four Raman bands at 462 (Eg), 505
(F2g), 597 (F2g) and 670 cm−1 (A1g) corresponding to Eg,
Fig. 2 TEM (a), HRTEM (b)
images and STEM HAADF
mapping (c) of PdO/Ce0.5Co0.5
Table 1 Structural and
compositional properties of the
catalysts Ce0.5Co0.5 and PdO/
Ce0.5Co0.5
Samples BET area
(m2/g)
Pore volume
(cm3/g)
ICP analysis
Conc. of elemental species (%)
Ce Co O Pd
Ce0.5Co0.5 73 0.24 41.8 16.2 42 –
PdO/Ce0.5Co0.5 75 0.19 40.6 15.7 40.9 2.8

Green Catalytic Degradation of Ethyl Acetate Incurred by Strong Interaction Between PdO and…
1 3
F2g and A1g vibration modes, respectively, consistent with
the previous results [40, 41] which are identiied as a spinel
structure of Co3O4 by XRD. In the case of pure CeO2, four
bands appear at 265, 460 and 592, 1174 cm−1 are attrib-
uted to doubly degenerated TO mode, the triply degener-
ated Raman-active mode and the non-degenerated LO
mode respectively. The most intense vibration at 460 cm−1
corresponds to the Raman active vibration mode (F2g) of
a cubic luorite structure and represents the symmetric
breathing mode of oxygen atom around cerium ions [42].
In the case of Ce0.5Co0.5, the central location of the strong
band shifts towards a lower value from 460 cm−1 (Fig. 4b),
which could be attributed to the formation of solid solution
and the change in lattice parameters as a result of lattice
doping of CeO2 by Co atoms with the formation of oxy-
gen vacancies [21]. In addition, a small hump occurs at
around 670 cm−1 (Fig. 4a) which can be attributed to the
existence of a separated Co3O4 phase. These indings are
in accordance with XRD data. The broad shoulder around
590 cm−1 indicates a defect-induced mode, which is used
to determine the content of the oxygen vacancy-related
defects caused by Ce3+ ions and oxygen in the support [25,
43]. The oxygen vacancies are beneicial for the adsorption
of surface oxygen species and consequently favor the oxi-
dation reaction [44]. These indings are consistent with the
above XPS results. Raman spectrum of PdO/Ce0.5Co0.5 cat-
alyst is similar to that of the supporting compounds and no
distingushable PdO peaks appear in either Raman or XRD
due to its small size. And the A1g (Co3O4) peak at 670 cm−1
is signiicantly enhanced by depositing Pd. The reason for
such enhancement will be further investigated in future.
The ratio of the integrated peak area at 590 cm−1 (oxygen
vacancy) and 460 cm−1 (main peak) is denoted as AOV/AMP
which is an indicator for the relative amount of the oxygen
vacancies. The concentration of oxygen vacancies in PdO/
Ce0.5Co0.5 (0.7) is relatively higher than that of the sup-
port (0.6), which supports the strong interaction between
Ce0.5Co0.5 and PdO.
The H2-TPR proiles of PdO/Ce0.5Co0.5 and Ce0.5Co0.5
are displayed in Fig. 5. The reducibility of the individual
pure oxides, CeO2 and Co3O4 is also investigated as shown
in Fig. S5. Ce0.5Co0.5 exhibits mainly three reduction peaks
Fig. 3 X-ray photoelectron spectra for Ce 3d (a), Co 2p (b), O 1 s (c) of Ce0.5Co0.5 and Pd 3d (d) of PdO/Ce0.5Co0.5 catalyst

S. Akram et al.
1 3
at about 269, 330 and 730 °C respectively and two small
humps at low temperature. The irst two peaks are ascribed
to the two-step reduction of the inely dispersed Co3O4 to
Co0 involving CoO intermediate strongly interacted with
the supporting CeO2 [24, 35]. Whereas, a small reduction
peak in between these two peaks is due to the interaction
between CeO2 and Co3O4. Meanwhile, the reduction of sur-
face Ce4+ to Ce3+ also occurs in the temperature range and
the peak appears as a broad shoulder in the TPR pattern.
The wide reduction window at 730 °C is assigned to the
conversion of the remaining CeO2 to Ce2O3 i.e. the reduc-
tion of bulk oxide species [45, 46]. It is worthy to note that
the Ce(IV) reduction temperature in Ce0.5Co0.5 systemati-
cally shift towards a lower value compared with the pure
CeO2, strongly suggesting that the interaction of Ce-Co can
increase the reducibility of CeO2 [47]. Previously studies
show the introduction of the second metal in ceria resulting
in the formation of solid solution and increase of the M-O-
Ce bonds, which favors the formation of oxygen vacancy
and enhance the mobility of oxygen species from its bulk to
the surface dramatically [48, 49].
The addition of PdO to the supporting compound
(Ce0.5Co0.5) improves the reduction proile signiicantly.
The low temperature reduction doublet moves to lower
Fig. 4 Raman spectra of the
model catalysts, (a) wide angle
patterns and (b) enlarged zone
patterns
Fig. 5 TPR spectra of Ce0.5Co0.5 (a) and Pd/Ce0.5Co0.5 (b)

Green Catalytic Degradation of Ethyl Acetate Incurred by Strong Interaction Between PdO and…
1 3
temperatures, which also witnesses the interaction between
the support and the active metal [36]. The peak at around
90 °C is found to be the characteristic reduction peak of
Pd2+ to Pd0 [50, 51]. The actual hydrogen amount con-
sumed by PdO (0.32 mmol/g, calculated based on the
integrated peak area) is much higher than the theoretical
value (0.028 mmol/g), might indicate the reduction of the
supporting compound at the temperature and validating
the hypothesis of SMSI occurrence. Moreover, the addi-
tion of PdO to the catalytic system is thought to enhance
the mobility of lattice oxygen as the reduction temperature
of bulk oxygen species of CeO2 phase drop from 730 to
700 °C [13].
3.2 Catalytic Activity
The catalytic performance of PdO/Ce0.5Co0.5 and the
Ce0.5Co0.5 for EA degradation is shown by the conver-
sion vs temperature at 60,000 mL g−1 h−1 of an inlet EA
low with a concentration of 1500 ppm (Fig. 6). In order to
check the efect of PdO addition, the catalytic reaction was
comparably carried out by using both the Ce0.5Co0.5 and
PdO/Ce0.5Co0.5 catalysts under similar conditions. The tem-
perature for EA conversion over both catalysts reaching to
10% (T10), 50% (T50) and 90% (T90) of the total conversion
is summarized in Table 2.
It is noteworthy that the light-of temperatures for the
conversion of EA over PdO/Ce0.5Co0.5 (T10/122, T50/155
and T90/182) are signiicantly lower than those of Ce0.5Co0.5
(T10/141, T50/180 and T90/213). Whereas, the complete
degradation of EA to CO2 and H2O takes place at 198
and 230 °C over the noble metal supported/unsupported
catalysts, respectively. Figure 6 shows that the activity of
Ce0.5Co0.5 is not as good as that of PdO/Ce0.5Co0.5. Fur-
thermore, the reaction rate at 140 °C (The EA conversion is
lower than 20% at the temperature below 140 °C) over PdO/
Ce0.5Co0.5 (1.38 × 10⁻⁴ mol gcat−1 s−1) is two times higher
than that of Ce0.5Co0.5 (0.75 × 10⁻⁴ mol gcat−1 s−1) as shown
in Table 2.
The above results unambiguously demonstrate the
occurrence of SMSI between the support (Ce0.5Co0.5) and
noble metal (PdO) nanoparticles. Since Ce0.5Co0.5 is transi-
tion metal, the case might be considered as a general one
and extended to other transition metal based supports. We
therefore, synthesized the PdO/Ce0.5Co0.5 catalyst which is
proved to be highly eicient for the catalytic oxidation of
EA. The HAADF mapping (Fig. 2c) shows the homogene-
ous dispersion of the active metal on the support. As con-
irmed by the catalytic activity results, the support seems to
have a signiicant efect in lowering the degradation tem-
perature of EA.
To evaluate the stability and durability of PdO/
Ce0.5Co0.5, real-time tests under stream low have been
done (Fig. 7). The catalyst was examined at a practical tem-
perature until a complete degradation is achieved (EA low
rate: 60,000 mL g−1 h−1, reactant concentration: 1500 ppm
and reaction temperature: 230 °C). Figure 7 shows that cat-
alytic activity is stably kept at 100% after a short period of
induction for EA degradation over PdO/Ce0.5Co0.5 and no
obvious catalyst deactivation can be seen after 36 h.
3.3 Drift Analysis
In-situ difuse relectance infrared Fourier Transform spec-
troscopy (DRIFTS) experiments were conducted under the
same reaction conditions. Figures 8a, b and 9a, b shows
the IR spectra obtained for both the Ce0.5Co0.5 and PdO/
Ce0.5Co0.5catalyst during the EA oxidation at various tem-
peratures. Over the catalyst of Ce0.5Co0.5, the spectrum
at room temperature (Fig. 8a) shows an intense band at
1440 cm−1 along with a moderate one at 1550 cm−1 are
attributed to the COO symmetric and asymmetric stretching
vibrations respectively. An intense band at 1307 cm−1 with
a very small hump at 1350 cm−1 is denoted to CH3 symmet-
ric and asymmetric variable angle vibration (COO linked
CH3). Similarly a small low intense peak at 1047 is attrib-
uted to the C–O–C symmetric and asymmetric stretching
Fig. 6 Ethyl acetate (EA) conversion (%) over Ce0.5Co0.5 and PdO/
Ce0.5Co0.5
Table 2 T10, T50 and T90 of the catalysts for the catalytic oxidation of
ethyl acetate (EA) and the corresponding reaction rate at 140 °C
Samples EA conversion tempera-
ture (oC)
Rate at 140 °C
(×10−4 mol gcat−1 s− 1)
T10 T50 T90
Ce0.5Co0.5 141 180 213 0.75
PdO/Ce0.5Co0.5 122 155 182 1.38

S. Akram et al.
1 3
of acetate [52]. In addition the peaks at 3692, 3300 cm−1
and 1642 cm−1 are attributed to the hydroxylated species on
the surface of catalyst, OH stretching and deviational vibra-
tion, respectively. Figure 8b depicts the IR spectra at ele-
vated temperature. With the reaction progress, a new band
at 1293 cm−1 (CO asymmetric stretching) appears when
the temperature rises to 100 °C indicating the formation
of acetic acid [53]. In addition, an IR band at 1350 cm− 1
becomes intense denoting an asymmetric vibration caused
by the CH3 molecule linked to COO [54]. Meanwhile, it
is worthy to note that the OH band (3300 cm− 1) becomes
intense with the increase of the temperature along with
the appearance of a new band at 1066 cm−1 indicating the
formation of alcohol [52]. Up to 200 °C, no any new peaks
appear except the intensity of OH band increases due to
the increased concentration of alcohol. Another evidence
on the formation of alcohol is the change of the band at
1647 cm−1, the out-of-plane deviational vibration of OH
Fig. 7 Catalytic stability test of PdO/Ce0.5Co0.5 for ethyl acetate (EA)
conversion
Fig. 8 In-situ FTIR spectra of Ce0.5Co0.5 at room temperature (a) and at elevated temperature (b)

Green Catalytic Degradation of Ethyl Acetate Incurred by Strong Interaction Between PdO and…
1 3
group since no liquid species are stable on this temperature.
The peaks at 300 °C are almost similar to those at 200 °C.
However, the FTIR bands changes dramatically at 400 °C.
At this temperature, the FTIR spectra for O–C=O stretch-
ing at 1450, 1560 and 1320 cm−1 and a broad shoulder
around 1750 cm−1 C=O stretching appear [52, 53]. It is
worthy to note that the peaks of alcohols disappear when
those of acetate species appear indicating that alcohol is no
longer an intermediate product at the temperature where
the EA is totally converted into acetic acid and further
decomposed into the inal product, CO2 and H2O.
Over Pd/Ce0.5Co0.5 (Fig. 9a, b), the in-situ FTIR band at
room temperature and 100 °C is quite similar to that of the
Ce0.5Co0.5 compound and the only diference is the inten-
sity of the OH peak, which indicates the surface absorbed
EA is easier to be oxidized by active oxygen species at
low temperature. At 300 °C the FTIR bands over PdO/
Ce0.5Co0.5 catalyst are similar to those reacted at 400 °C
over Ce0.5Co0.5 compound, conirms the degradation reac-
tion can occur at lower temperature caused by the strong
SMSI.
3.4 Ethyl Acetate Degradation Mechanism
In the light of in-situ FTIR the oxidative degradation mech-
anism of EA is proposed (Fig. 10). When the molecules
of EA contact with the catalyst, they are adsorbed on the
surface and activated due to its electron-deicient acid-
ity nature (Fig. S8), the detailed surface acidic and basic
analysis is given in SI (Fig. S6, S7 and Table S1). The
C-O bond of the activated EA molecules is cleaved by the
assistance of the hydroxyl species on the surface. After
that, acetic acid and ethanol are produced [55] as shown in
Fig. 10. The energetic gaseous oxygen species are absorbed
Fig. 9 In-situ FTIR spectra of PdO/Ce0.5Co0.5 at room temperature (a) and elevated temperature (b)

S. Akram et al.
1 3
on the oxygen vacancies on the catalyst surface to form O2−
which is able to oxidize acetic acid molecules to inal prod-
uct, where the cleaved species, i.e. acetic acid and ethanol
are oxidized by the lattice oxygen following the Mars-van
Kerevlen mechanism. With the progress of the reaction,
acetic acid and ethanol are continuously oxidized to CO2,
H2O by the oxygen species difused from feed stream to the
surface of a catalyst and then from the bulk (lattice) to the
surface via the so-called vacancy hopping mechanism [56].
It is worthy to note that no other by-products appear in both
the catalytic systems, either supported PdO or support as
seen by the DRIFT spectra conirming that the pathway of
the EA degradation is similar over both catalysts. The role
of PdO here is thought to enhance the activation of oxy-
gen species in two ways, irstly, it increases the dissociation
rate of the oxygen from the feed low [33] and secondly, it
increases the mobility of the oxygen species on the surface
of the catalyst [13]. Moreover, no any aldehydes bands are
observed in in-situ FTIR analysis, indicating that a green
degradation of EA is achieved by these catalysts under the
experiment conditions without the formation of any harm-
ful intermediates.
To summarize, it is speculated that the performance of
the Ce/Co-supported PdO catalyst (Pd/Ce0.5Co0.5) is bet-
ter than the support (Ce0.5Co0.5) for the degradation of EA.
It is not surprising taking into account the crucial role of
PdO to enhance the activation of oxygen species [40], ulti-
mately increasing the rate of reaction. The even dispersion
of the PdO throughout the whole body of the support and
the SMSI is of primary importance for the catalytic activ-
ity. Furthermore the electron deicient acidic sites on the
support favor the adsorption and cleavage of the reactant
molecule (EA) to ethanol and acetic acid and further oxi-
dized to inal products following the Mars-van Kerevlen
mechanism.
4 Conclusion
Ce/Co-supported PdO catalyst (PdO/Ce0.5Co0.5) have been
synthesized and used to degrade EA at reduced temperature
under concentrated feed stream. The efect of PdO addition
and its interaction with the support has been investigated
by structural, textural, spectroscopic techniques and redox
properties on a model catalytic system. The catalytic per-
formance of the catalysts conirm that Ce/Co-supported
PdO catalyst can further lowers the EA degradation tem-
perature (T90) from 213 to 182 °C under concentrated feed
stream as compared with the support. Furthermore, in-situ
DRIFT analysis is used to interpret the EA degradation
mechanism over diferent catalytic system and the results
show that no other harmful intermediate products, such as
aldehydes other than alcohols and acetates is produced sug-
gesting this a green approach.
Acknowledgements The authors thank National Natural Science
Foundation of China (No. 51402061) and Control frontier technol-
ogy of major pollutants haze of CAS (No. XDB05050300) for the
Fig. 10 Schematic reaction
mechanism for ethyl acetate
(EA) degradation

Green Catalytic Degradation of Ethyl Acetate Incurred by Strong Interaction Between PdO and…
1 3
inancial support. We also acknowledge the Fund from state key
laboratory of multiphase complex systems in IPE, CAS (Nos. MPCS-
2015-A-04; MPCS-2014-D-10).
References
1. Unger K (2006) Science 312:823
2. Matheson RR (2002) Science 297:976–979
3. Hutchings GH, Heneghan CS, Hudson LD, Taylor SH (1996)
Nature 384:341–343
4. Rappaport SM, Kupper LL (2004) J Expo Anal Env Epid
14:92–107
5. Chen X, Carabineiro SAC, Bastos SST, Tavares PB, Orfao
JJM, Pereira MFR, Figueiredo JL (2013) J Environ Chem Eng
1:795–804
6. Dai Q, Huang H, Zhu Y, Deng W, Bai S, Wang X, Lu G (2012)
Appl Catal B Environ 117–118:360368
7. Yang Y, Xu X, Sun K (2007) J Hazard Mater B 139:140–145
8. Zhang F, Pan L, Li T, Diulus JT, Asthagiri A, Weaver JF (2014)
J Phys Chem C 118:28661–28674
9. Chin YH, Iglesia E (2011) J Phys Chem C 115:17845–17855
10. Kinnunen NM, Hirvi JT, Suvanto M, Pakkanen TA (2011) J
Phys Chem C 115:19197–19202
11. Cubeiro ML, Fierro JLG (1998) Appl Catal A Gen 168:307–322
12. Jin MS, Park JN, Shon JK, Kim JH, Li ZH, Park YK, Kim JM
(2012) Catal Today 185:183–190
13. Wang W, Yuan F, Niu X, Zhu Y (2016) Scientiic Reports
6:19511
14. Zhang J, Li Y, Chen M, Wang L, Zhang C, He H (2015) Scien-
tiic Reports 5:12950
15. Zhang T, Li W, Croue JP (2011) Environ Sci Technol
45:9339–9346
16. Atkinson A, Barnett S, Gorte RJ, Irvine JTS, Mcevoy AJ,
Mogensen M, Singhal SC, Vohs J (2004) Nat Mater 3:17–27
17. Murugan Ramaswamy AV (2007) J Am Chem Soc
129:30623063
18. Cwele T, Mahadevaiah N, Singh S, Friedrich HB (2016) Appl
Catal B Environ 182:1–14
19. Li G, Li L, Jiang D (2015) J Phys Chem C 119:12502–12507
20. Liotta LF, Ousmane M, Carlo GD, Pantaleo G, Deganello G,
Marci G, Retailleau L, Fendler AG (2008) Appl Catal A Gen
347:81–88
21. Akram S, Wang Z, Chen L, Wang Q, Shen GL, Han N, Chen Y,
Ge G (2016) Catal Comm 73:123–127
22. Trovarelli A (2002) Catalysis by Ceria and related materials.
London, Imperial college press
23. Wang Z, Yang M, Shen GL, Liu HD, Chen YF, Wang Q (2014) J
Nanopart Res 16:2367
24. Wang Z, Shen GL, Liu HD, Wang Q, Chen YF (2013) Appl
Catal B Environ 138:253–259
25. Yang P, Yang S, Shi Z, Meng Z, Zhou R (2015) Appl Catal B
Environ 162:227–235
26. Wyrwalski F, Giraudon JM, Lamonier JF (2010) Catal Lett
137:141–149
27. Huang H, Dai QG, Wang XY (2014) Appl Catal B Environ
158–159:96–105
28. Tan H, Wang J, Yu S, Zhou K (2015) Envir Sci Technol
49:8675–8682
29. Fau P, Schierbaum KD (1994) Surf Sci 321:71–80
30. Xiao WD, Guo QL, Wang EG (2003) Chem Phys Lett
368:527–531
31. Lenormand F, Hilaire L, Kili K, Krill G, Maire G (1988) J Phys
Chem 92:2561–2568
32. He C, Yu Y, Yue L, Li J, Shen Q, Yu W, Chen J, Hao Z (2014)
Appl Catal B Environ 147:156–166
33. Luo JY, Meng M, Li X, Li XG, Zha YQ, Hu TD, Xie YN, Zhang
J (2008) J Catal 254:310–324.
34. Ichimura K, Inoue Y, Yasumori I (1980) Bull Chem Soc Jpn
53:3044
35. Tang W, Wu X, Li D, Wang Z, Liu H, Chen Y (2014) J Mater
Chem A 2:2544
36. Narayanappa M, Dasireddy VDBC, Friedrich H (2012) Appl
Catal A Gen 447–448:135–143
37. Naresh D, Kumar VP, Harisekhar M, Nagaraju N, Putrakumar B,
Cherry KVR (2014) Appl Surf Sci 314:199–207
38. Harikrishna Y, Kumar VP, Ramu K, Cherry KVR, Rao VV
(2015) Appl Petrochem Res 5:71–80
39. Otto K, Haack LP, Devries JE (1992) Appl Catal B Environ
1:1–12
40. Rashad M, Rusing M, Berth G, lischka K, Pawlis A (2013) J
Nanomaterial 2013:714853.
41. Ercolino G, Grzybek G, Stelmachowski P, Specchia S, Kotarba
A, Specchia V (2015) Catal Today 275:66–71
42. Thammachart M, Meeyoo V, Risksomboon T, Osuwan S (2001)
Catal Today 68:53–61
43. Chang S, Li M, Hua Q, Zhang L, Ma Y, Ye B, Huang W (2012) J
Catal 293:195–204
44. Wang Z, Wang Q, Liao Y, Shen GL, Gong X, Han N, Liu H,
Chen Y (2011) Chem Phys Chem 12:2763–2770
45. Dai QG, Huang H, Zhou Y, Deng W, Bai SX, Wang XY, Lu GZ
(2012) Appl Catal B Environ 117–118:360–368
46. Rivas BD, Fonseca RL, Ortiz MAG, Ortiz JIG (2011) Appl Catal
B Environ 101:317–325
47. Xue L, Xue L, Zhang C, He H, Teraoka Y (2007) Appl Catal B
Environ 75:167–174
48. Cen W, Liu Y, Wu Z, Wang H, Weng X (2012) Phy Chem Chem
Phy 14:5769–5777
49. Zhang P, Lu H, Zou Y, Zhang L, Wu Z, Yang S, Shi H, Zhu Q,
Chen Y, Dai S (2015) Nat Commun 6:8446
50. Tang XF, Chen JL, Li YG, Li Y, Xu YD, Shen WJ (2006) J
Chem Eng 118:119–125
51. Priolkar KR, Bera P, Sarode PR, Hegde MS, Emura S, Kuma-
shiro R, Lalla NP (2002) Chem Mater 14:2120–2128
52. Phung TK, Casaza AA, Aliakbarian B, Finocchio E, Perego P,
Busca (2013) G Chem Eng J 215–216:838–848
53. Hauchecorne B, Terrens D, Verbruggen S, Martens JA, Langen-
hove HV, Demeestere K, Lenaerts S (2011) Appl Catal B Envi-
ron 106:630–638
54. Phung TK, Carnasciali MM, Finocchio E, Busca G (2014) Appl
Catal A Gen 470:72–80
55. Larsson PO, Andersson A (2000) Appl Catal B Environ 24:
175–192
56. Catlolw CRA (1990) J Chem Soc Faraday Trans 86:1167–1176