Embed Size (px)
Citation preview
GSA Public Buildings Service
WHite PAPeR1
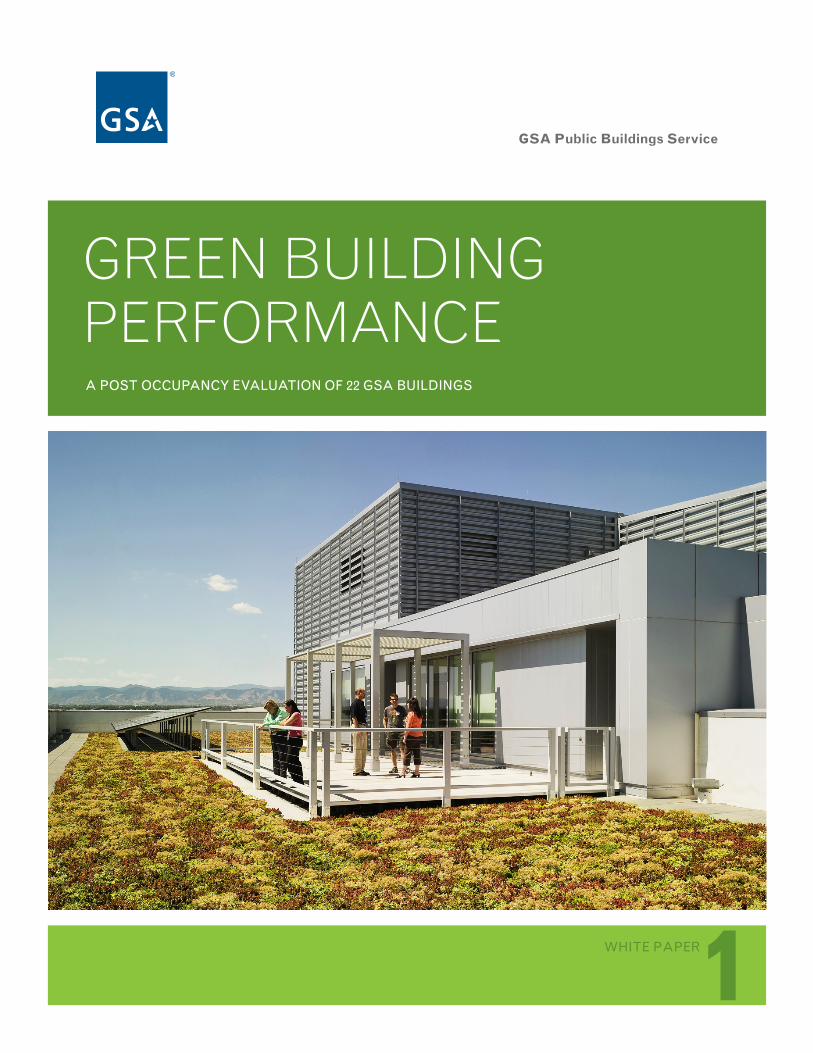
Green buildinG performanceA Post occuPAncy evAluAtion of 22 GsA buildinGs
tAble of contents
introduction .............................................................................................1
research overview ................................................................................ 2
research context ................................................................................... 3
GSa Study buildings .............................................................................. 4
finding 1: fully integrated design delivers High performance............12
finding 2: GSa’s Green buildings cost less to operate ...................... 13
finding 3: Sustainable design Supports occupant Satisfaction .........15
finding 4: Green buildings Help GSa meet federal mandates .............17
The office of the pbS chief Greening officer drives the implementation of sustainability practices and customer facing solutions to enhance the environmental performance of GSa’s real estate portfolio and provide healthy and productive workspaces. The office also leads GSa’s Green proving Ground, a program that aims to accelerate sustainable real estate through testing, evaluation, and adoption of “proven” innovative technologies and practices.
.
Produced by GsA Public buildings serviceAuGust 2011
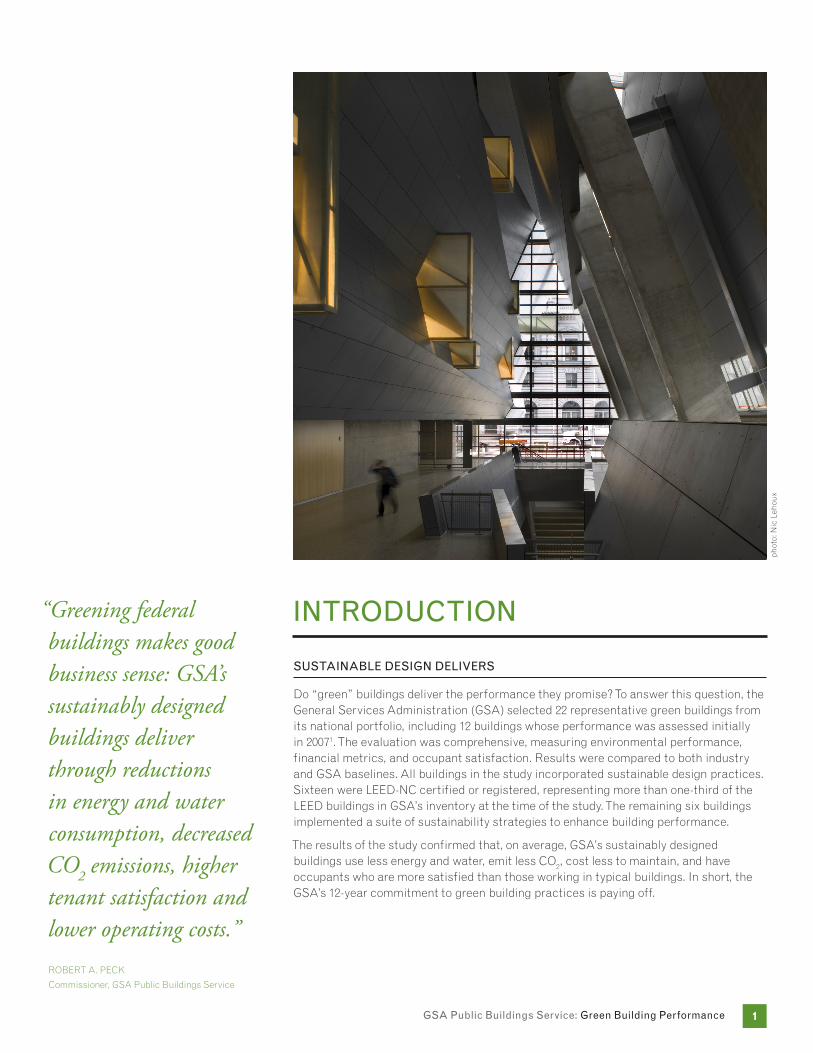
intRoduction
sustAinAble desiGn deliveRs
do “green” buildings deliver the performance they promise? To answer this question, the General Services administration (GSa) selected 22 representative green buildings from its national portfolio, including 12 buildings whose performance was assessed initially in 20071. The evaluation was comprehensive, measuring environmental performance, financial metrics, and occupant satisfaction. results were compared to both industry and GSa baselines. all buildings in the study incorporated sustainable design practices. Sixteen were leed-nc certified or registered, representing more than one-third of the leed buildings in GSa’s inventory at the time of the study. The remaining six buildings implemented a suite of sustainability strategies to enhance building performance.
The results of the study confirmed that, on average, GSa’s sustainably designed buildings use less energy and water, emit less co2, cost less to maintain, and have occupants who are more satisfied than those working in typical buildings. in short, the GSa’s 12-year commitment to green building practices is paying off.
“Greening federal buildings makes good business sense: GSA’s sustainably designed buildings deliver through reductions in energy and water consumption, decreased CO2
emissions, higher tenant satisfaction and lower operating costs.”roberT a. peck
commissioner, GSa public buildings Service
GsA Public buildings service: Green building Performance 1
phot
o: n
ic l
ehou
x
GsA Public buildings service: Green building Performance 2
ReseARcH oveRvieW
MotivAtions And MetHods
for more than a decade, the federal Government has committed itself to demonstrating that sustainably designed commercial buildings save energy, cost less to operate, have smaller carbon footprints, and more satisfied occupants. This commitment is reflected in executive orders and congressional legislation. GSa, which provides real estate for more than one million federal employees, has adopted policies to realize this commitment to sustainability. The intention of this study was to evaluate the effectiveness of those policies.
The study was conducted in two phases. The first phase, completed in 2008, developed a repeatable, cost-effective, post occupancy evaluation (poe) methodology and piloted that methodology across a representative sample of 12 sustainably designed buildings in GSa’s portfolio. The study’s second phase re-examined the first set of buildings to verify that measured results persisted. When ten additional buildings were added to the sample, results obtained from the second set were consistent with results obtained from the first. in all cases, “whole building performance” was evaluated—energy and water use, carbon emissions, operations and maintenance, waste generation and recycling, and occupant satisfaction.
because all buildings constructed by GSa for the past decade have incorporated sustainable design, key performance indicators were judged against comparable, industry-accepted benchmarks that measured performance of the broader building stock constructed during the same period. data summarized in this study were provided in mid to late 2009 and are primarily for calendar year 2008. evaluated in this way, green buildings outperformed national averages in all measured performance areas. comparisons were based on the following sources of data:
key findinGs:compared to national averages, buildings in this study have:
less energy use (66 kbtu/sf/yr vs. 88 kbtu/sf/yr)
25%
19%lower aggregate operational costs ($1.60/sf vs. $1.98/sf8)
27%Higher occupant satisfaction
36%fewer co2 emissions
Measurement data source2
eui cbecS national Survey of commercial buildings constructed between 1990 and 20033
energy cost boma4 2008 all Sector Total building rentable area – utility (less water)
co2 enerGY STar baseline5, late 2009/early 2010
Maintenance costs ifma6 facilities less than 5 years old and boma4 2008 all Sector Total buildings rentable area - roads/Grounds
Water use ifma6 50th percentile, 2009
occupant satisfaction center for the built environment, uc berkeley, 20097
GsA Public buildings service: Green building Performance 3
ReseARcH context
“By looking critically at real world performance, this report demonstrates that GSA, in support of its zero environmental footprint vision, delivers high performance, sustainable workplaces.”marTHa joHnSon
GSa administrator
A coMPReHensive evAluAtion
GSa commissioned the pacific northwest national laboratory (pnnl) to evaluate 22 of GSa’s sustainably designed buildings. it wanted to know whether its green buildings were delivering the performance they promised.
because of GSa’s commitment to real-world results, the study evaluated actual, not modeled, building performance. Successes and shortcomings were identified, along with areas requiring further research. The 22 buildings selected reflect different uS regional climates, a mix of uses (courthouses and offices), and a mix of build-to-suit leases and federally owned buildings. Sixteen of these buildings were designed to meet or exceed basic leed certification. The other six were designed to meet the requirements of other programs, including enerGY STar and the california Title 24 energy Standard.
The research team used a consistent evaluation process for every building studied:
• Obtaining and reviewing one year of operating data• Surveying building occupants• Interviewing the building manager• Conducting an expert walkthrough
To understand how GSa’s green buildings measured up to commonly accepted national benchmarks, the team compared each performance metric with the national average for uS commercial buildings. The latest available benchmark data come from widely accepted industry and government standards.9
The uS Green building council’s (uSGbc) leadership in energy and environmental design (leed) rating System is a nationally accepted third party certification program for green building design, construction, and operation. leed promotes a whole-building approach to sustainability by recognizing performance in five key areas: sustainable site development, water savings, energy efficiency, materials selection, and indoor environmental quality.
leed provides four measures of performance: basic certification, Silver, Gold, and platinum, based on a set of prerequisites and credits in the five major categories listed above. each measure represents an incremental step toward integrating the different components of sustainable design, construction, and operation to achieve optimal performance.
for more information on the leed rating System: www.usgbc.org
About tHe leed GReen buildinG RAtinG systeM
GsA Public buildings service: Green building Performance 4
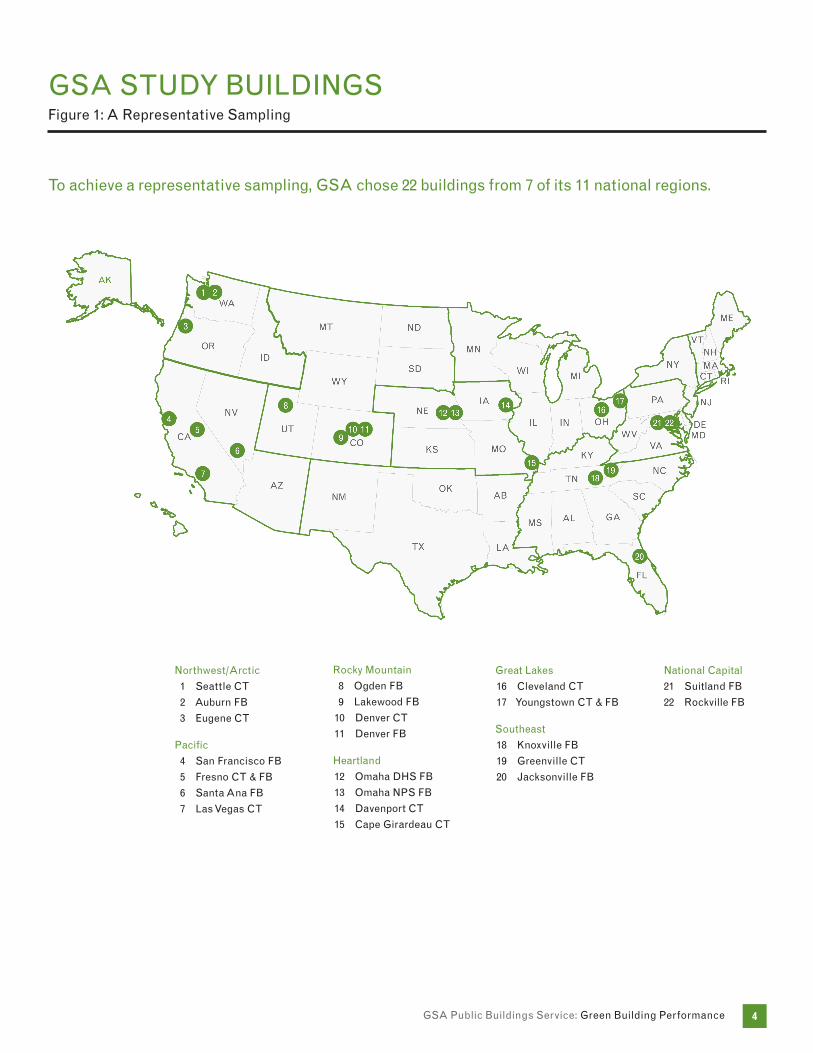
GsA study buildinGsfigure 1: A Representative sampling
to achieve a representative sampling, GsA chose 22 buildings from 7 of its 11 national regions.
northwest/Arctic
1 seattle ct
2 Auburn fb
3 eugene ct
Pacific
4 san francisco fb
5 fresno ct & fb
6 santa Ana fb
7 las vegas ct
Rocky Mountain
8 ogden fb
9 lakewood fb
10 denver ct
11 denver fb
Heartland
12 omaha dHs fb
13 omaha nPs fb
14 davenport ct
15 cape Girardeau ct
Great lakes
16 cleveland ct
17 youngstown ct & fb
southeast
18 knoxville fb
19 Greenville ct
20 Jacksonville fb
national capital
21 suitland fb
22 Rockville fb
GsA Public buildings service: Green building Performance 5
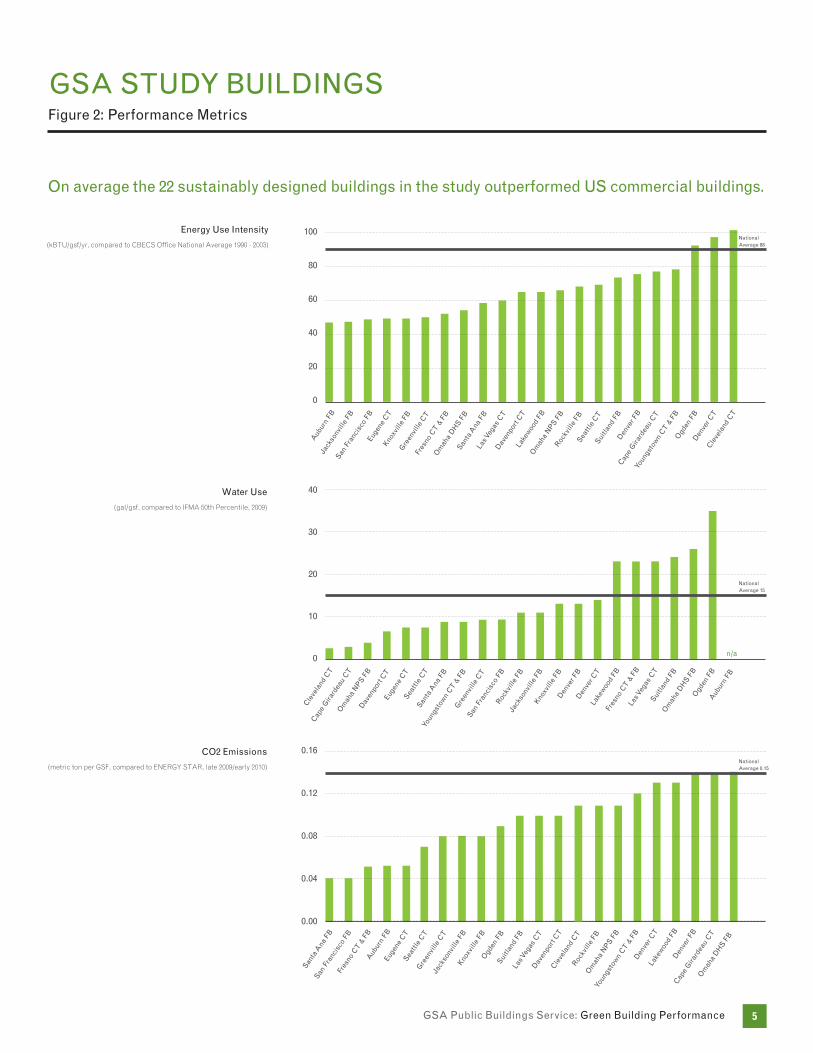
GsA study buildinGsfigure 2: Performance Metrics
on average the 22 sustainably designed buildings in the study outperformed us commercial buildings.
energy use intensity 100
80
60
40
20
0
A
ubur
n fb
J
acks
onvi
lle f
b
san
fra
ncis
co f
b
euge
ne c
t
kno
xvill
e fb
G
reen
ville
ct
fre
sno
ct &
fb
o
mah
a d
Hs f
b
s
anta
Ana
fb
l
as v
egas
ct
d
aven
port
ct
l
akew
ood
fb
om
aha
nPs f
b
R
ockv
ille
fb
sea
ttle
ct
s
uitla
nd f
b
den
ver f
b
cap
e G
irard
eau
ct
you
ngst
own
ct &
fb
o
gden
fb
den
ver c
t
c
leve
land
ct
national Average 88(kbTu/gsf/yr, compared to cbecS office national average 1990 - 2003)
s
anta
Ana
fb
san
fra
ncis
co f
b
fre
sno
ct &
fb
A
ubur
n fb
e
ugen
e c
t
sea
ttle
ct
G
reen
ville
ct
J
acks
onvi
lle f
b
kno
xvill
e fb
o
gden
fb
s
uitla
nd f
b
las
veg
as c
t
d
aven
port
ct
c
leve
land
ct
Rockv
ille
fb
o
mah
a n
Ps fb
you
ngst
own
ct &
fb
den
ver c
t
lak
ewoo
d fb
den
ver f
b
cap
e G
irard
eau
ct
om
aha
dH
s fb
national Average 0.15
0.16
0.12
0.08
0.04
0.00
co2 emissions
(metric ton per GSf, compared to enerGY STar, late 2009/early 2010)
c
leve
land
ct
cap
e G
irard
eau
ct
o
mah
a n
Ps fb
dav
enpo
rt c
t
eug
ene
ct
s
eattl
e c
t
s
anta
Ana
fb
youn
gsto
wn
ct &
fb
G
reen
ville
ct
s
an f
ranc
isco
fb
R
ockv
ille
fb
Ja
ckso
nvill
e fb
kno
xvill
e fb
den
ver f
b
d
enve
r ct
lake
wood
fb
fres
no c
t & f
b
l
as v
egas
ct
s
uitla
nd f
b
o
mah
a d
Hs f
b
ogd
en f
b
Aub
urn
fb
national Average 15
40
30
20
10
0
Water use
(gal/gsf, compared to ifma 50th percentile, 2009)
n/a
GsA Public buildings service: Green building Performance 6
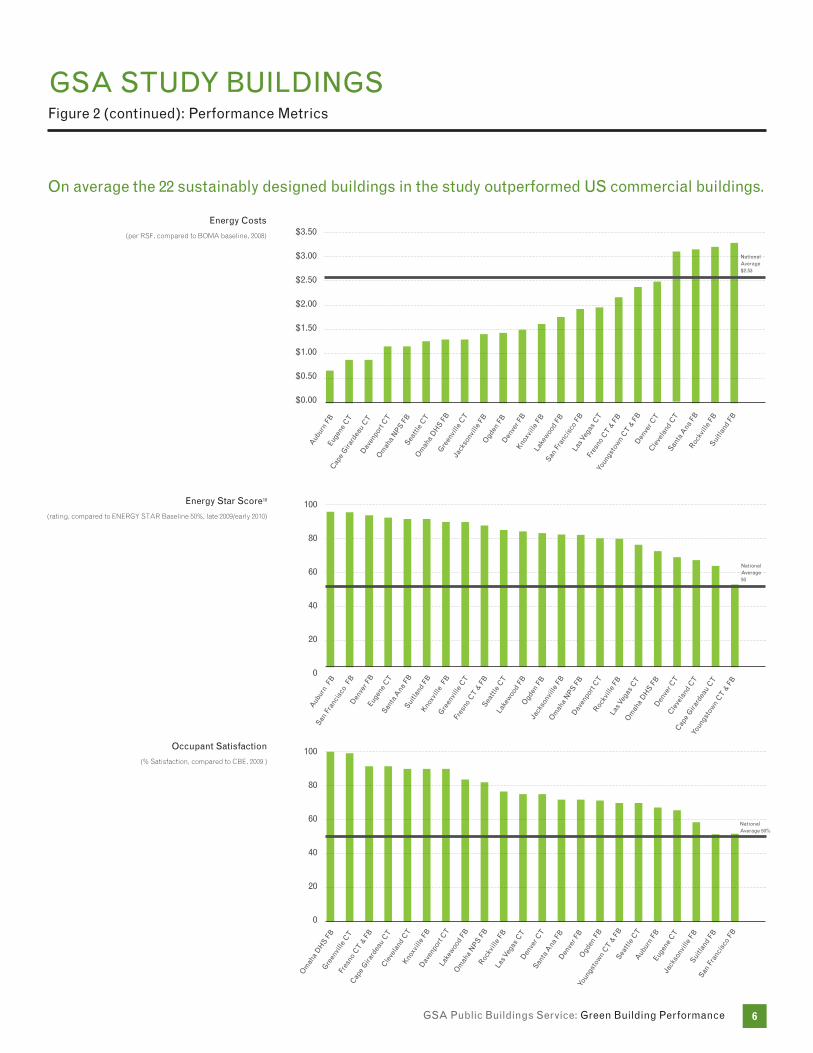
GsA study buildinGsfigure 2 (continued): Performance Metrics
on average the 22 sustainably designed buildings in the study outperformed us commercial buildings.
energy costs
(per rSf, compared to boma baseline, 2008)
national Average $2.53
Aub
urn
fb
san
fra
ncis
co f
b
den
ver f
b
e
ugen
e c
t
s
anta
Ana
fb
s
uitla
nd f
b
kno
xvill
e f
b
Gre
envi
lle c
t
fr
esno
ct &
fb
s
eattl
e c
t
l
akew
ood
fb
o
gden
fb
Jac
kson
ville
fb
o
mah
a n
Ps fb
dav
enpo
rt c
t
Roc
kvill
e fb
la
s veg
as c
t
o
mah
a d
Hs f
b
d
enve
r ct
c
leve
land
ct
cap
e G
irard
eau
ct
y
oung
stow
n c
t & f
b
100
80
60
40
20
0
energy star score10
(rating, compared to enerGY STar baseline 50%, late 2009/early 2010)
occupant satisfaction
(% Satisfaction, compared to cbe, 2009 )
national Average 50
A
ubur
n fb
e
ugen
e c
t
c
ape
Gira
rdea
u c
t
d
aven
port
ct
om
aha
nPs f
b
sea
ttle
ct
om
aha
dH
s fb
Gre
envi
lle c
t
Jack
sonv
ille
fb
ogd
en f
b
d
enve
r fb
knoxv
ille
fb
lak
ewoo
d fb
san
fra
ncis
co f
b
las
veg
as c
t
fr
esno
ct &
fb
you
ngst
own
ct &
fb
den
ver c
t
cle
vela
nd c
t
san
ta A
na f
b
Roc
kvill
e fb
s
uitla
nd f
b
$3.50
$3.00
$2.50
$2.00
$1.50
$1.00
$0.50
$0.00
om
aha
dH
s fb
Gre
envi
lle c
t
fre
sno
ct &
fb
c
ape
Gira
rdea
u c
t
c
leve
land
ct
kno
xvill
e fb
d
aven
port
ct
lak
ewoo
d fb
om
aha
nPs f
b
Roc
kvill
e fb
l
as v
egas
ct
d
enve
r ct
san
ta A
na f
b
den
ver f
b
ogd
en f
b
youn
gsto
wn
ct &
fb
s
eattl
e c
t
Aub
urn
fb
eu
gene
ct
Ja
ckso
nvill
e fb
sui
tland
fb
san f
ranc
isco
fb
national Average 50%
100
80
60
40
20
0
GsA Public buildings service: Green building Performance 7
GsA study buildinGs: fAst fActs
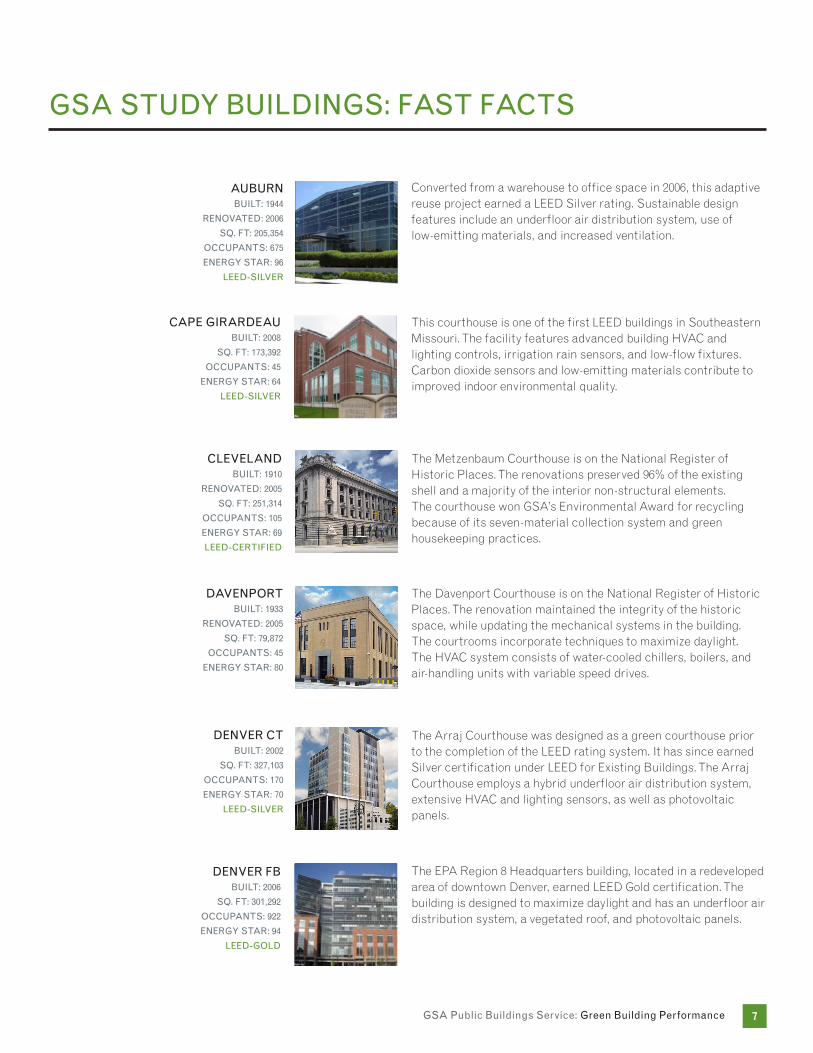
converted from a warehouse to office space in 2006, this adaptive reuse project earned a leed Silver rating. Sustainable design features include an underfloor air distribution system, use of low-emitting materials, and increased ventilation.
This courthouse is one of the first leed buildings in Southeastern missouri. The facility features advanced building HVac and lighting controls, irrigation rain sensors, and low-flow fixtures. carbon dioxide sensors and low-emitting materials contribute to improved indoor environmental quality.
The metzenbaum courthouse is on the national register of Historic places. The renovations preserved 96% of the existing shell and a majority of the interior non-structural elements. The courthouse won GSa’s environmental award for recycling because of its seven-material collection system and green housekeeping practices.
The davenport courthouse is on the national register of Historic places. The renovation maintained the integrity of the historic space, while updating the mechanical systems in the building. The courtrooms incorporate techniques to maximize daylight. The HVac system consists of water-cooled chillers, boilers, and air-handling units with variable speed drives.
The arraj courthouse was designed as a green courthouse prior to the completion of the leed rating system. it has since earned Silver certification under leed for existing buildings. The arraj courthouse employs a hybrid underfloor air distribution system, extensive HVac and lighting sensors, as well as photovoltaic panels.
The epa region 8 Headquarters building, located in a redeveloped area of downtown denver, earned leed Gold certification. The building is designed to maximize daylight and has an underfloor air distribution system, a vegetated roof, and photovoltaic panels.
AubuRnbuilt: 1944
RenovAted: 2006
sq. ft: 205,354
occuPAnts: 675
eneRGy stAR: 96
leed-silveR
cAPe GiRARdeAubuilt: 2008
sq. ft: 173,392
occuPAnts: 45
eneRGy stAR: 64
leed-silveR
clevelAndbuilt: 1910
RenovAted: 2005
sq. ft: 251,314
occuPAnts: 105
eneRGy stAR: 69
leed-ceRtified
dAvenPoRt built: 1933
RenovAted: 2005
sq. ft: 79,872
occuPAnts: 45
eneRGy stAR: 80
denveR ct built: 2002
sq. ft: 327,103
occuPAnts: 170
eneRGy stAR: 70
leed-silveR
denveR fb built: 2006
sq. ft: 301,292
occuPAnts: 922
eneRGy stAR: 94
leed-Gold

GsA Public buildings service: Green building Performance 8
GsA study buildinGs: fAst fActs
The morse courthouse was the first leed Gold courthouse in the uS. Sustainable design features include an underfloor air distribution system, daylight sensors, and low-flow fixtures. indoor environmental Quality (ieQ) is improved through the use of low-emitting materials.
The coyle courthouse and federal building houses 14 courtrooms and is the tallest building in the city (11 floors). designed under california’s Title 24 energy Standard, the building includes high-efficiency lighting, an underfloor air distribution system, water-cooled chillers, and natural gas boilers.
energy-efficiency features in the Quillen courthouse include a well-insulated white roof and an energy management control System that integrates lighting and occupancy sensors. it also scores the highest occupant satisfaction rating for air quality, acoustics, and lighting of any building in this study.
renovations to this federal building improved operations and occupant satisfaction. The building earned an energy Star rating in 2007 and incorporates high-efficiency lighting and recycled materials in the interior.
located in downtown knoxville, the duncan federal building incorporates high-efficiency lighting, enhanced metering techniques, and low-flow fixtures. The cool roof reduces the heat island effect and supports photovoltaic panels.
The leed Silver facility at lakewood features daylight and exterior views in 91% of its regularly occupied spaces. in addition, all building occupants receive a booklet about the design and operations of the building enhancing tenant engagement
euGene built: 2006
sq. ft: 270,322
occuPAnts: 120
eneRGy stAR: 92
leed-Gold
fResnobuilt: 2005
sq. ft: 495,914
occuPAnts: 235
eneRGy stAR: 87
GReenvillebuilt: 2001
sq. ft: 160,975
occuPAnts: 85
eneRGy stAR: 90
JAcksonvillebuilt: 1967
RenovAted: 2004
sq. ft: 338,008
occuPAnts: 1,000
eneRGy stAR: 82
knoxville built: 1986
RenovAted: 2005
sq. ft: 172,684
occuPAnts: 285
eneRGy stAR: 90
leed-ceRtified
lAkeWood built: 2004
sq. ft: 128,342
occuPAnts: 318
eneRGy stAR: 84
leed-silveR
GsA Public buildings service: Green building Performance 9
GsA study buildinGs: fAst fActs
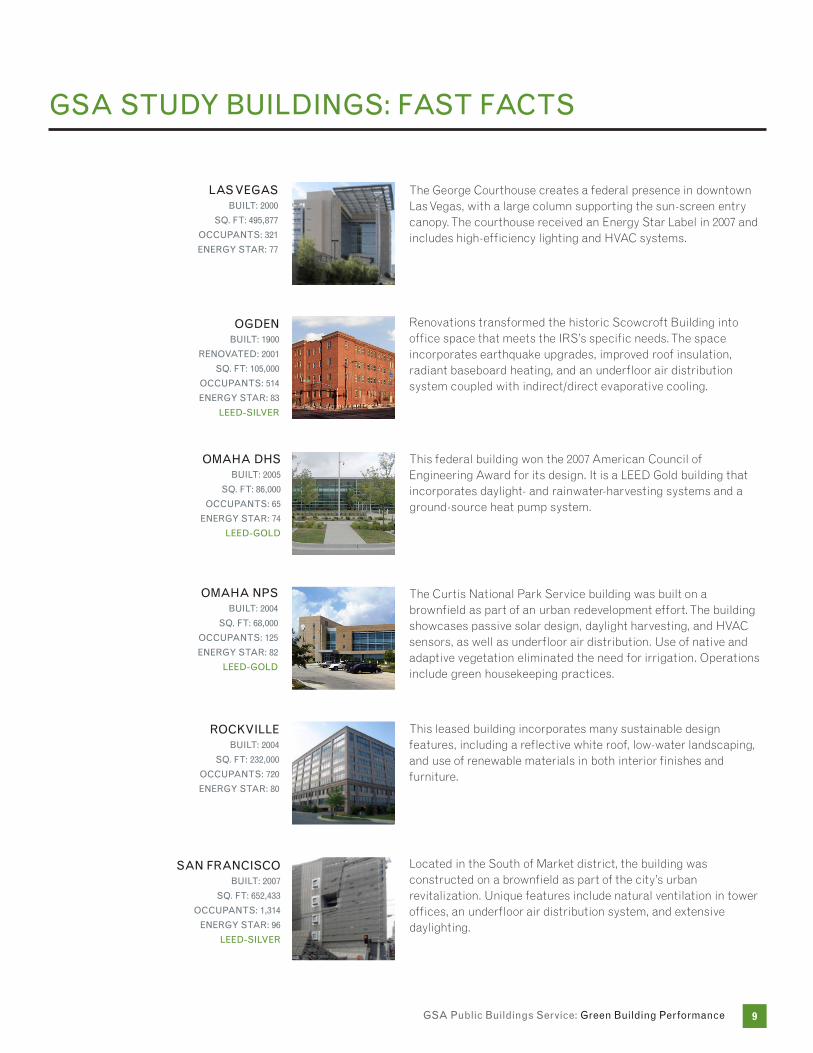
The George courthouse creates a federal presence in downtown las Vegas, with a large column supporting the sun-screen entry canopy. The courthouse received an energy Star label in 2007 and includes high-efficiency lighting and HVac systems.
renovations transformed the historic Scowcroft building into office space that meets the irS’s specific needs. The space incorporates earthquake upgrades, improved roof insulation, radiant baseboard heating, and an underfloor air distribution system coupled with indirect/direct evaporative cooling.
This federal building won the 2007 american council of engineering award for its design. it is a leed Gold building that incorporates daylight- and rainwater-harvesting systems and a ground-source heat pump system.
The curtis national park Service building was built on a brownfield as part of an urban redevelopment effort. The building showcases passive solar design, daylight harvesting, and HVac sensors, as well as underfloor air distribution. use of native and adaptive vegetation eliminated the need for irrigation. operations include green housekeeping practices.
This leased building incorporates many sustainable design features, including a reflective white roof, low-water landscaping, and use of renewable materials in both interior finishes and furniture.
located in the South of market district, the building was constructed on a brownfield as part of the city’s urban revitalization. unique features include natural ventilation in tower offices, an underfloor air distribution system, and extensive daylighting.
lAs veGAs built: 2000
sq. ft: 495,877
occuPAnts: 321
eneRGy stAR: 77
oGden built: 1900
RenovAted: 2001
sq. ft: 105,000
occuPAnts: 514
eneRGy stAR: 83
leed-silveR
oMAHA dHsbuilt: 2005
sq. ft: 86,000
occuPAnts: 65
eneRGy stAR: 74
leed-Gold
oMAHA nPsbuilt: 2004
sq. ft: 68,000
occuPAnts: 125
eneRGy stAR: 82
leed-Gold
Rockvillebuilt: 2004
sq. ft: 232,000
occuPAnts: 720
eneRGy stAR: 80
sAn fRAncisco built: 2007
sq. ft: 652,433
occuPAnts: 1,314
eneRGy stAR: 96
leed-silveR
GsA Public buildings service: Green building Performance 10
GsA study buildinGs: fAst fActs
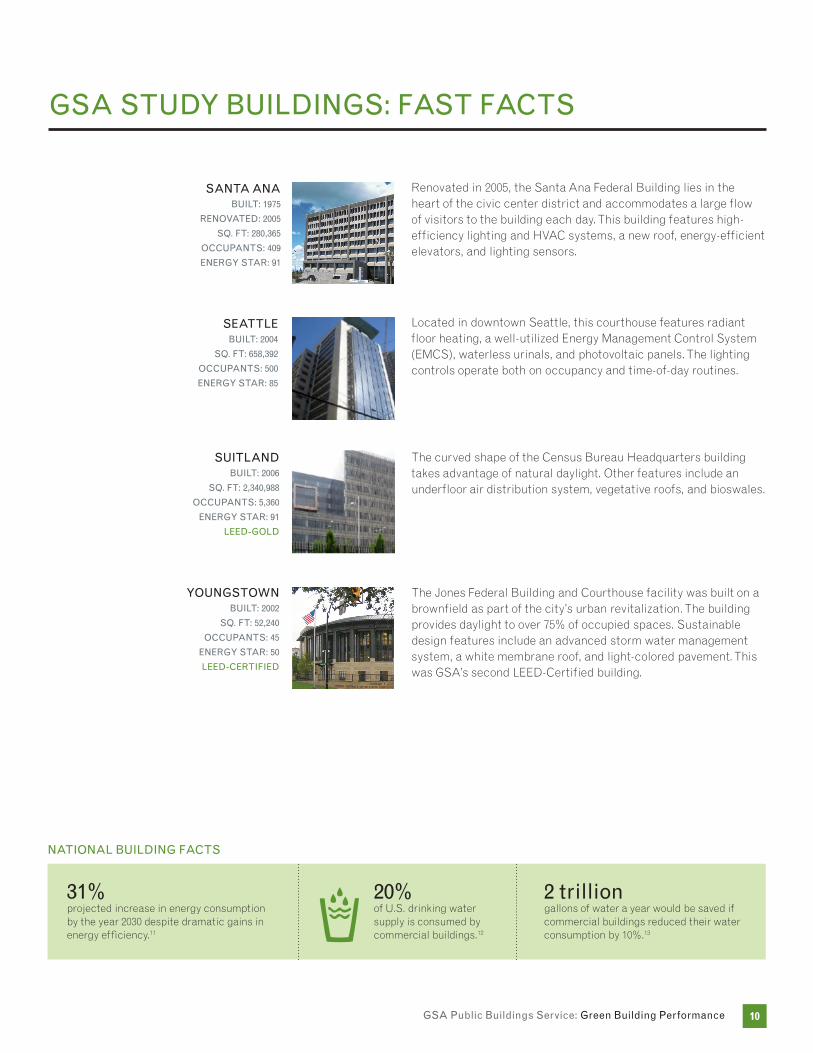
renovated in 2005, the Santa ana federal building lies in the heart of the civic center district and accommodates a large flow of visitors to the building each day. This building features high-efficiency lighting and HVac systems, a new roof, energy-efficient elevators, and lighting sensors.
located in downtown Seattle, this courthouse features radiant floor heating, a well-utilized energy management control System (emcS), waterless urinals, and photovoltaic panels. The lighting controls operate both on occupancy and time-of-day routines.
The curved shape of the census bureau Headquarters building takes advantage of natural daylight. other features include an underfloor air distribution system, vegetative roofs, and bioswales.
The jones federal building and courthouse facility was built on a brownfield as part of the city’s urban revitalization. The building provides daylight to over 75% of occupied spaces. Sustainable design features include an advanced storm water management system, a white membrane roof, and light-colored pavement. This was GSa’s second leed-certified building.
sAntA AnA built: 1975
RenovAted: 2005
sq. ft: 280,365
occuPAnts: 409
eneRGy stAR: 91
seAttle built: 2004
sq. ft: 658,392
occuPAnts: 500
eneRGy stAR: 85
suitlAnd built: 2006
sq. ft: 2,340,988
occuPAnts: 5,360
eneRGy stAR: 91
leed-Gold
younGstoWn built: 2002
sq. ft: 52,240
occuPAnts: 45
eneRGy stAR: 50
leed-ceRtified
nAtionAl buildinG fActs
31%projected increase in energy consumption by the year 2030 despite dramatic gains in energy efficiency.11
20%of u.S. drinking water supply is consumed by commercial buildings.12
2 trilliongallons of water a year would be saved if commercial buildings reduced their water consumption by 10%.13
GsA Public buildings service: Green building Performance 11
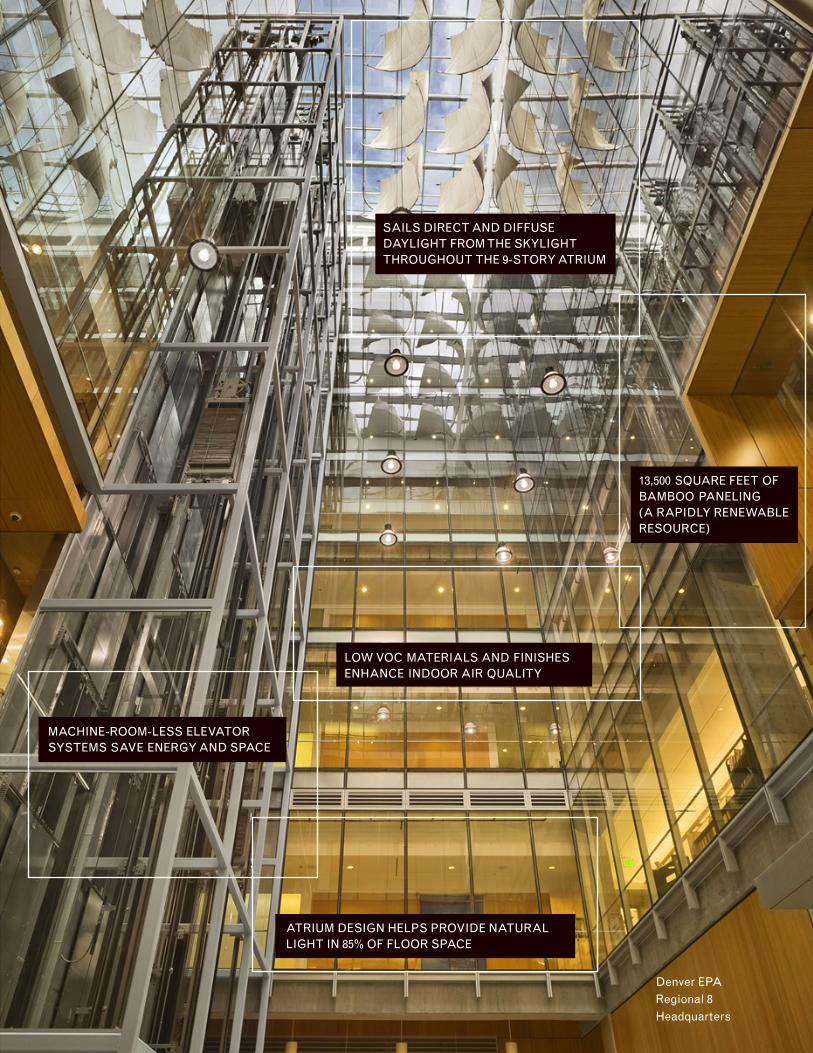
denver ePA Regional 8 Headquarters
sAils diRect And diffuse dAyliGHt fRoM tHe skyliGHt tHRouGHout tHe 9-stoRy AtRiuM
loW voc MAteRiAls And finisHes enHAnce indooR AiR quAlity
AtRiuM desiGn HelPs PRovide nAtuRAl liGHt in 85% of flooR sPAce
MAcHine-RooM-less elevAtoR systeMs sAve eneRGy And sPAce
13,500 squARe feet of bAMboo PAnelinG (A RAPidly ReneWAble ResouRce)
GsA Public buildings service: Green building Performance 12
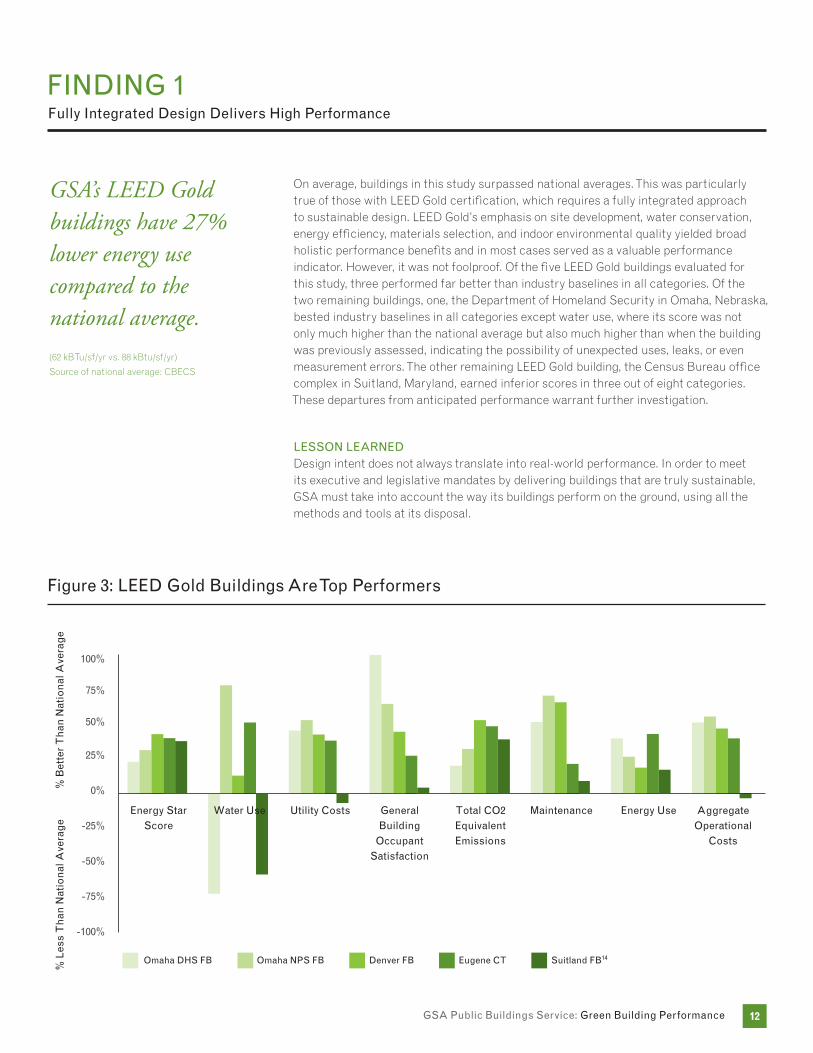
findinG 1fully integrated design delivers High Performance
GSA’s LEED Gold buildings have 27% lower energy use compared to the national average.(62 kbTu/sf/yr vs. 88 kbtu/sf/yr)
Source of national average: cbecS
on average, buildings in this study surpassed national averages. This was particularly true of those with leed Gold certification, which requires a fully integrated approach to sustainable design. leed Gold’s emphasis on site development, water conservation, energy efficiency, materials selection, and indoor environmental quality yielded broad holistic performance benefits and in most cases served as a valuable performance indicator. However, it was not foolproof. of the five leed Gold buildings evaluated for this study, three performed far better than industry baselines in all categories. of the two remaining buildings, one, the department of Homeland Security in omaha, nebraska, bested industry baselines in all categories except water use, where its score was not only much higher than the national average but also much higher than when the building was previously assessed, indicating the possibility of unexpected uses, leaks, or even measurement errors. The other remaining leed Gold building, the census bureau office complex in Suitland, maryland, earned inferior scores in three out of eight categories. These departures from anticipated performance warrant further investigation.
lesson leARneddesign intent does not always translate into real-world performance. in order to meet its executive and legislative mandates by delivering buildings that are truly sustainable, GSa must take into account the way its buildings perform on the ground, using all the methods and tools at its disposal.
figure 3: leed Gold buildings Are top Performers
% l
ess
th
an n
atio
nal
Ave
rag
e
% b
ette
r t
han
nat
ion
al A
vera
ge
100%
75%
50%
25%
0%
-25%
-50%
-75%
-100%
omaha dHs fb omaha nPs fb denver fb eugene ct suitland fb14
energy star score
Water use utility costs General building
occupantsatisfaction
total co2 equivalent emissions
Maintenance energy use Aggregate operational
costs
GsA Public buildings service: Green building Performance 13
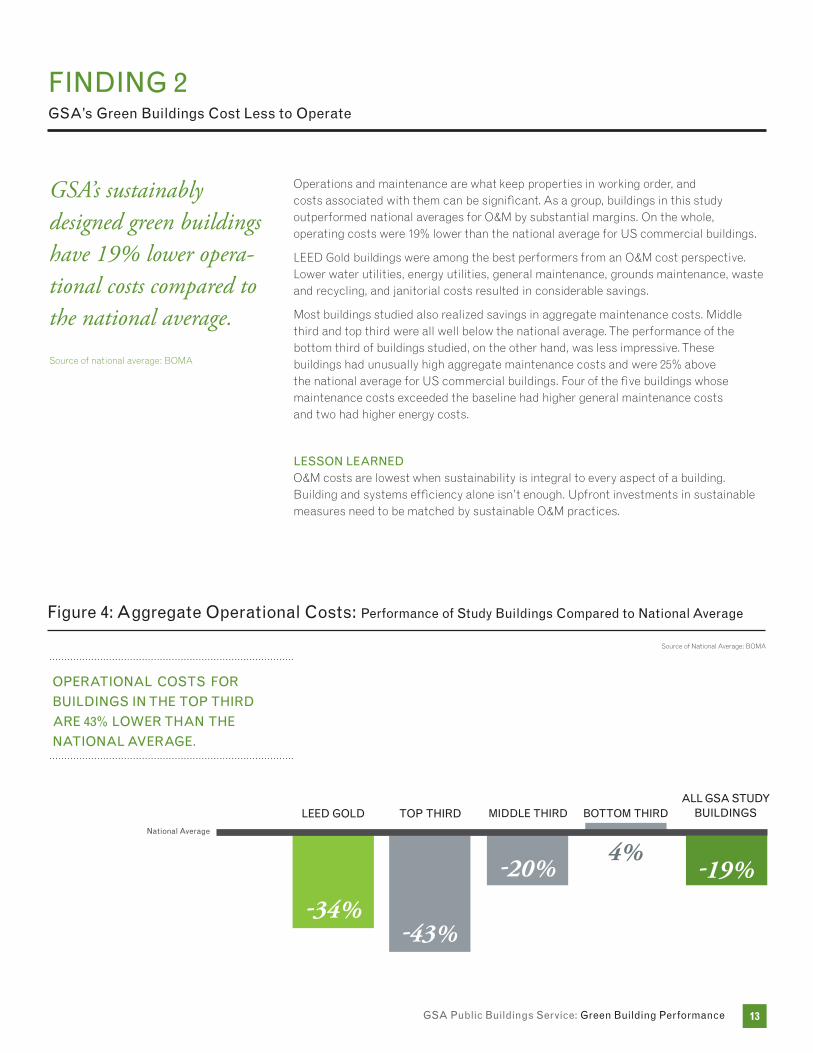
findinG 2GsA’s Green buildings cost less to operate
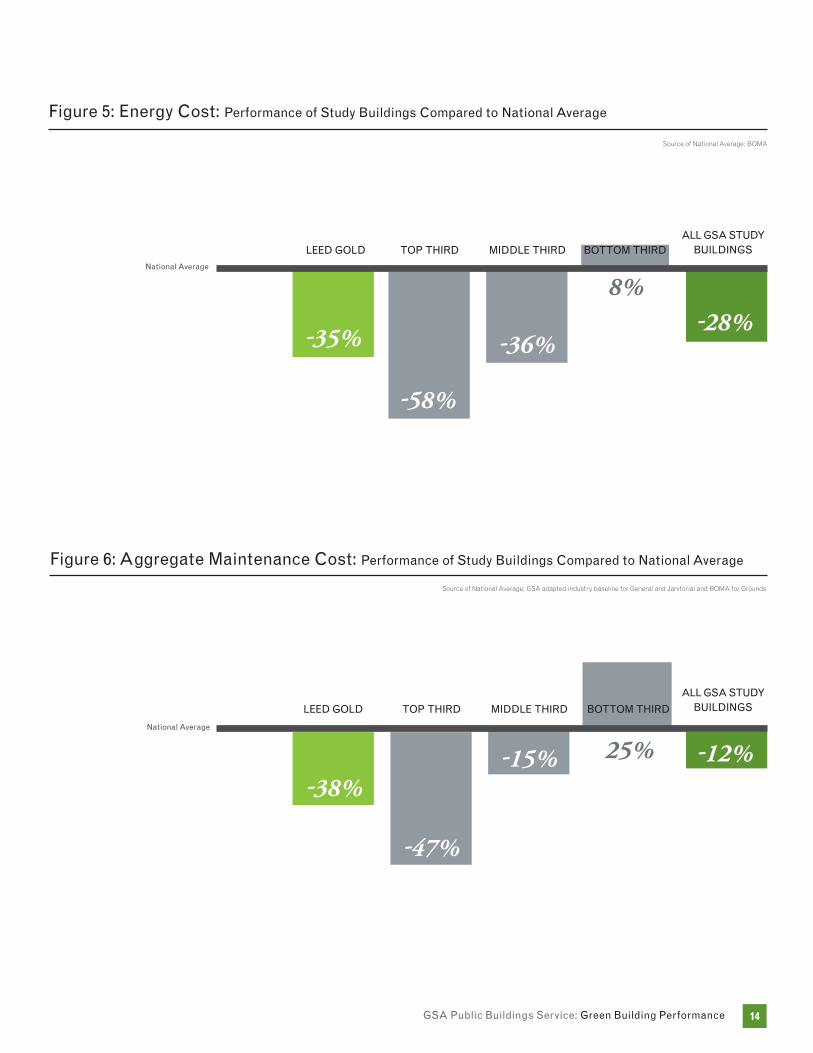
operations and maintenance are what keep properties in working order, and costs associated with them can be significant. as a group, buildings in this study outperformed national averages for o&m by substantial margins. on the whole, operating costs were 19% lower than the national average for uS commercial buildings.
leed Gold buildings were among the best performers from an o&m cost perspective. lower water utilities, energy utilities, general maintenance, grounds maintenance, waste and recycling, and janitorial costs resulted in considerable savings.
most buildings studied also realized savings in aggregate maintenance costs. middle third and top third were all well below the national average. The performance of the bottom third of buildings studied, on the other hand, was less impressive. These buildings had unusually high aggregate maintenance costs and were 25% above the national average for uS commercial buildings. four of the five buildings whose maintenance costs exceeded the baseline had higher general maintenance costs and two had higher energy costs.
lesson leARnedo&m costs are lowest when sustainability is integral to every aspect of a building. building and systems efficiency alone isn’t enough. upfront investments in sustainable measures need to be matched by sustainable o&m practices.
GSA’s sustainably designed green buildings have 19% lower opera-tional costs compared to the national average.
Source of national average: boma
figure 4: Aggregate operational costs: Performance of study buildings compared to national Average
Source of national average: boma
oPeRAtionAl costs foR
buildinGs in tHe toP tHiRd
ARe 43% loWeR tHAn tHe
nAtionAl AveRAGe.
national Average
leed Gold
-34%
toP tHiRd
-43%
Middle tHiRd
-20%
bottoM tHiRd
4%
All GsA study buildinGs
-19%
GsA Public buildings service: Green building Performance 14
figure 5: energy cost: Performance of study buildings compared to national Average
Source of national average: boma
national Average
leed Gold
-35%
toP tHiRd
-58%
Middle tHiRd
-36%
bottoM tHiRd
8%
All GsA study buildinGs
-28%
figure 6: Aggregate Maintenance cost: Performance of study buildings compared to national Average
Source of national average: GSa adapted industry baseline for General and janitorial and boma for Grounds
national Average
leed Gold
-38%
toP tHiRd
-47%
Middle tHiRd
-15%
bottoM tHiRd
25%
All GsA study buildinGs
-12%
GsA Public buildings service: Green building Performance 15
findinG 3sustainable design supports occupant satisfaction
GSA’s sustainably designed green buildings demonstrate a 27% higher occupant satisfaction than the national average.
Source for national average: cbe, uc berkeley15
a primary goal of sustainable design is to maximize occupant comfort and satisfac-tion, while minimizing environmental impact and costs. comfort and satisfaction are important for many reasons, not least of which is that they correlate positively with personal and team performance. The greater the satisfaction, the higher the productiv-ity and creativity of an organization. it has also been demonstrated that occupant satisfaction impacts staff retention.
on average, the 22 buildings studied scored better in occupant satisfaction than the national average for uS commercial buildings. With 76% higher occupant satisfaction, the top third of buildings scored significantly better than the national average. despite the overall positive performance, however, the study found that occupant satisfaction was in some cases undermined by problems with lighting and acoustics. lighting was the one area in which most of the buildings studied were no better than their non-green comparison set. While occupants in all buildings judged lighting to be “satisfactory,” the scores for three-fifths of those buildings were below the national average. acoustics were also problematic, but the problems did not necessarily have to do with noise level per se. rather, an analysis of the data revealed that occupants were more dissatisfied with sound privacy than with noise level. occupants in open office spaces and cubicles reported the highest levels of dissatisfaction.
lesson leARnedlighting and acoustic performance matter greatly, even to occupants who are otherwise satisfied with building and workplace quality. both should be addressed by appropriate teaming and design criteria at the outset of every project.
nAtionAl buildinG fActs
79%of employees surveyed were willing to forgo income to work for a firm with a credible sustainable strategy.16
80%of employees surveyed said they felt greater motivation and loyalty toward their company due to its sustainability initiatives.17
GsA Public buildings service: Green building Performance 16
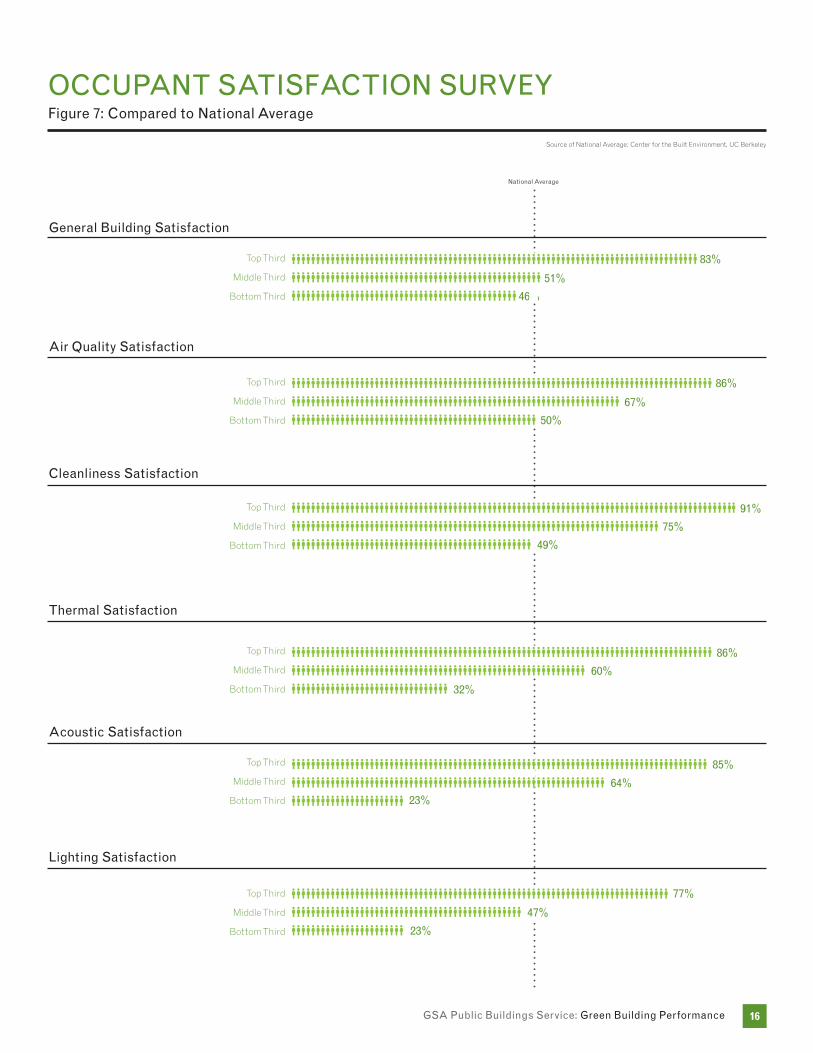
occuPAnt sAtisfAction suRveyfigure 7: compared to national Average
Source of national average: center for the built environment, uc berkeley
General building satisfaction
Top Third
middle Third
bottom Third
83%
51%
46%
Air quality satisfaction
Top Third
middle Third
bottom Third
86%
67%
50%
cleanliness satisfaction
Top Third
middle Third
bottom Third
91%
75%
49%
thermal satisfaction
Top Third
middle Third
bottom Third
86%
60%
32%
Acoustic satisfaction
Top Third
middle Third
bottom Third
85%
64%23%
lighting satisfaction
Top Third
middle Third
bottom Third
77%
47%
23%
national Average
GsA Public buildings service: Green building Performance 17
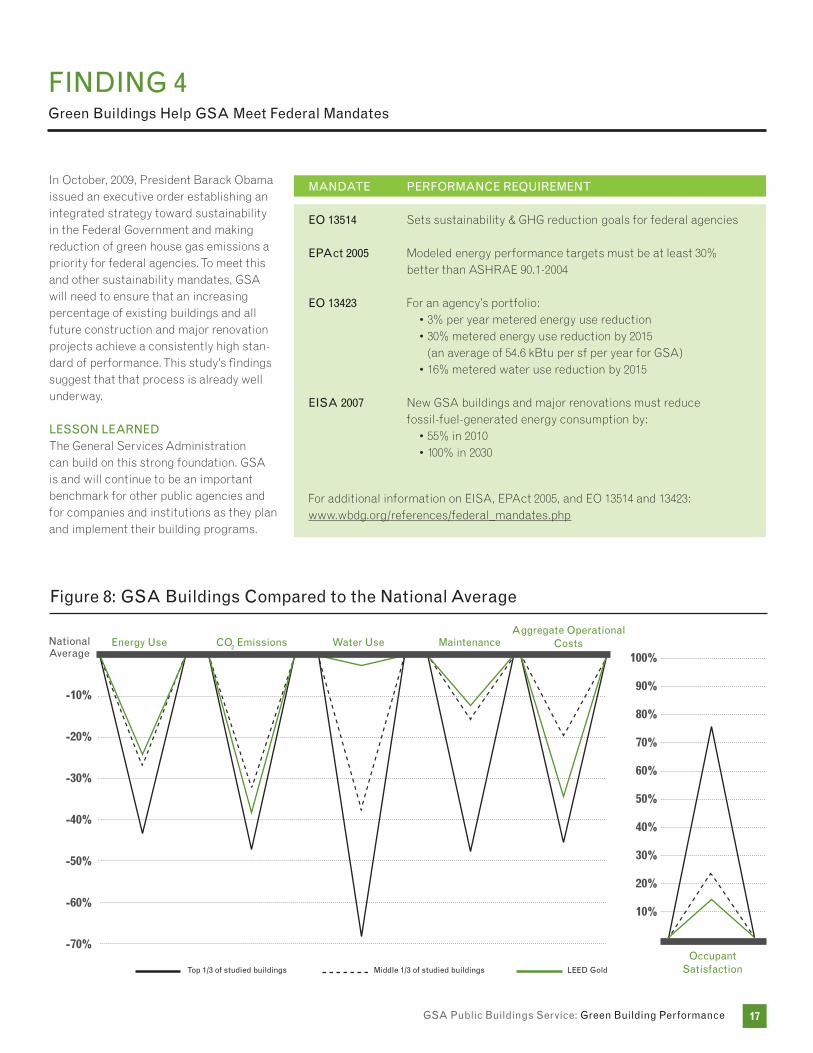
findinG 4Green buildings Help GsA Meet federal Mandates
in october, 2009, president barack obama issued an executive order establishing an integrated strategy toward sustainability in the federal Government and making reduction of green house gas emissions a priority for federal agencies. To meet this and other sustainability mandates, GSa will need to ensure that an increasing percentage of existing buildings and all future construction and major renovation projects achieve a consistently high stan-dard of performance. This study’s findings suggest that that process is already well underway.
lesson leARnedThe General Services administration can build on this strong foundation. GSa is and will continue to be an important benchmark for other public agencies and for companies and institutions as they plan and implement their building programs.
energy use co2 emissions Water use Maintenance
-10%
-20%
-30%
-40%
-50%
-60%
-70%
100%
90%
80%
70%
60%
50%
40%
30%
20%
10%
national Average
occupant satisfaction
Aggregate operational costs
figure 8: GsA buildings compared to the national Average
MAndAte
eo 13514
ePAct 2005
PeRfoRMAnce RequiReMent
Sets sustainability & GHG reduction goals for federal agencies
modeled energy performance targets must be at least 30% better than aSHrae 90.1-2004
for an agency’s portfolio:• 3% per year metered energy use reduction • 30% metered energy use reduction by 2015
(an average of 54.6 kbtu per sf per year for GSa)• 16% metered water use reduction by 2015
new GSa buildings and major renovations must reduce fossil-fuel-generated energy consumption by:
• 55% in 2010• 100% in 2030
eo 13423
eisA 2007
for additional information on eiSa, epact 2005, and eo 13514 and 13423: www.wbdg.org/references/federal_mandates.php
top 1/3 of studied buildings Middle 1/3 of studied buildings leed Gold
GsA Public buildings service: Green building Performance 18
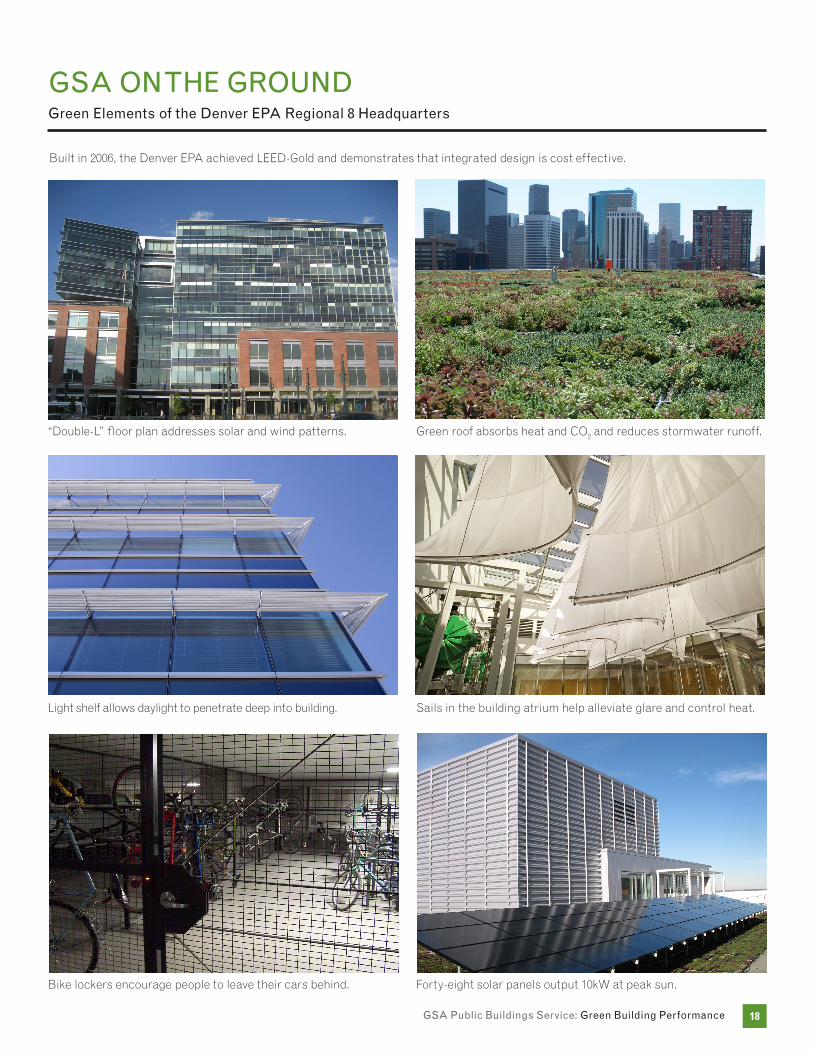
GsA on tHe GRoundGreen elements of the denver ePA Regional 8 Headquarters
built in 2006, the denver epa achieved leed-Gold and demonstrates that integrated design is cost effective.
“double-l” floor plan addresses solar and wind patterns. Green roof absorbs heat and co2 and reduces stormwater runoff.
Sails in the building atrium help alleviate glare and control heat.light shelf allows daylight to penetrate deep into building.
bike lockers encourage people to leave their cars behind. forty-eight solar panels output 10kW at peak sun.
GsA Public buildings service: Green building Performance 19
ResouRces
lessons leARned fRoM cAse studies of six HiGH-PeRfoRMAnce buildinGsnational Renewable energy laboratory2006
analyzed the design, construction, and energy performance of six commercial buildings. all of the low-energy buildings used more energy than predicted, but those designed with a whole building approach and with the “strongest” energy goals had the best energy performance. monitoring buildings to provide feedback improves their energy performance.
tHe cost of GReen Revisiteddavis langdon2007
found no significant difference in the average costs between green and other buildings. The study also found that the con-struction industry has embraced sustainable design in most uS regions and no longer views sustainable design measures as an extra cost burden.
tHe eneRGy cHAllenGe: A neW AGendA foR coRPoRAte ReAl estAteRocky Mountain institute / corenet2007
buildings use two-fifths of the world’s materials and energy and one-sixth of its fresh water. in the uS, buildings make up 85% of all fixed uS capital assets. in short, buildings are part of the problem and part of the solution. The energy challenge identifies barriers, documents successes, and recommends actions to achieve greater energy efficiency in uS corporate real estate.
eneRGy PeRfoRMAnce of leed nc buildinGsnew buildings institute2008
compares design intent to energy performance in 121 leed-rated buildings. office buildings used 33% less energy and all buildings used 24% less energy than the cbecS average for uS commercial buildings. nearly half the buildings had an enerGY STar rating of at least 75; the average rating for all buildings was 68, with a quarter rated below 50.
nAtionAl buildinG fActs
43% of co2 emissions are from the building sector approximately 43% of u.S. carbon dioxide (co2) emissions result from the energy services required by residential, commercial, and industrial buildings. Transportation accounts for 32% and industry for 25%18.
43% buildings
32% transport
25%
industry
25%
GsA Public buildings service: Green building Performance 20
GlossARy
boMA building owners and managers associa-tion international. This study used boma research to obtain the national average for maintenance costs. cbecenter for the built environment. This study used cbe research as a basis for the occupant satisfaction surveys, as well as obtaining the national average for general building satisfaction, cleanliness, lighting, air quality, acoustic, and thermal satisfaction. cAlifoRniA title 24 eneRGy stAndARda california-specific building standard that combines codes from three sources: standards from national model codes, adapted national model codes to meet california conditions, and new standards to address particular california concerns. cbecscommercial buildings energy consumption Survey. The survey gathers and combines energy use and cost information for uS commercial buildings. Green Building Performance used their research to obtain the national average for energy use.
ctcourthouse
eMcsenergy management control System
eneRGy stARenergy Star is a rating to promote energy efficiency in products and buildings. This study used energy Star research to obtain the national average for co2 emissions. it is a joint program between the uS environmental protection agency and the uS department of energy.
euienergy use intensity
fbfederal building
federal Water use indexThis study used the department of energy's research on federal buildings to obtain the national average for water use. GHGGreen House Gas
GsfGross square feet. refers to a building’s overall floor plate size, measuring from the outside of its exterior walls and including all vertical penetrations, such as walls and elevator shafts.
ieqindoor environmental Quality
ifMAinternational facility management association. This study used ifma research to obtain the national average for energy costs.
kbtu1000 british thermal units, a bTu is the amount of heat energy needed to raise the temperature of one pound of water by 1º f.
Rsfrentable square feet. usable Sf + a percentage of the common areas of the building.
nAtionAl buildinG fActs
18%of total uS energy use consumption comes from commercial buildings.19
Why water efficiency? between 1950 and 2000, the uS population nearly doubled. in that same period, however, public demand for water nearly tripled. americans now use an average of 100 gallons of water per day—enough to fill 1,600 drinking glasses!20
GsA Public buildings service: Green building Performance 21
notes
1 This white paper summarizes research presented in the following report: km fowler, em rauch, jW Henderson, and ar kora: Re-Assessing Green Building Performance: A Post Occupancy Evaluation of 22 GSA Buildings, pnnl-19369, pacific northwest national laboratory, richland, Wa, 2010. for the original study of 12 GSa green buildings, see km fowler and em rauch: Assessing Green Building Performance: A Post-Occupancy Evaluation of 12 GSA Buildings, pnnl-17393, pacific northwest national laboratory, richland, Wa, 2008.
www.gsa.gov/appliedresearch
2 See glossary above for abbreviations.
3 uS department of energy. commercial buildings energy consumption Survey (cbecS), 2003. energy information administration. Washington, dc.
4 building owners and managers association (boma) international experience exchange report. 2008. Special Studies 2005, agency managed, downtown all sizes, uS Government Sector. boma international, Washington, dc.
5 enerGY STar portfolio manager. www.energystar.gov/index.cfm?c=evaluate_performance.bus_portfoliomanager
6 ifma. 2009. Space and project management benchmarks #32. ifma. Houston, Texas.
7 center for the built environment (cbe) occupant Satisfaction Survey, 2009. uc berkeley.
8 average percent better than baseline for Water, energy, maintenance, janitorial, Grounds, Waste and recycling costs per rSf as compared to boma industry baselines.
9 industry baselines developed from GSa building data, the uS department of energy, u.S. environmental protection agency, international facility management association, building owners and managers association international, university of california berkeley‘s center for the built environment, and the energy information administration.
10 energy Star scores are annual. Since the initial analysis, cleveland cT and Youngstown have both improved their energy performance. The cleveland courthouse energy Star score is 75 today, up from 69, and Youngstown is 77, up from 50.
11 www.yourenergyfuture.org/energyfacts.htm, (accessed 23.04.2008).
12 www.energystar.gov/index.cfm?c=business.bus_water, (accessed 23.04.2008).
13 ibid.
14 Suitland earned leed Gold certification in 2011, two years after this study was conducted.
15 center for the built environment (cbe) occupant Satisfaction Survey, 2009. uc berkeley.
16 Survey of 800 mbas from 11 Top international business Schools; Stanford Graduate School of business, 2002 GlobeScan international Survey, mori.
17 ibid.
18 pew center on Global climate change, Towards a Climate-Friendly Built Environment, june 2005, www.pewclimate.org/publications/report/towards-climate-friendly-built-environment.
19 goliath.ecnext.com/coms2/gi_0199-6408096/Section-2-energy-consumption-by.html, (accessed 01.05.08).
20 www.epa.gov/watersense/water/why.htm, (accessed 23.04.08).
phot
o: n
ic l
ehou
x
GsA Public buildings service: Green building Performance 22
AcknoWledGeMents
GsApatricia chengdon Hornmarianne kaiserkevin kampschroerkevin powelleleni reed
otHeRliz exter, on assignment to GSa from lawrence berkeley national laboratory (lbnl)
Pnnlkim fowlerjordan Hendersonangela koraemily rauchSteve Shankle
cbejohn Goinsnicole Walter
tenfoldbill freaiscarolyn St. jeanandréa Silvestri
site contActslaura anderson, rockville fbpaul anderson, davenport cTdanielle bogni, las Vegas cTalex bonaparte, rockville fbjonathan bringewatt, lakewood fbjim brown, ogden fbGina carter, ogden fbSteven casey, San francisco fbdiana ciryak, cleveland cTchris cockrill, cape Girardeau cT, manhattan fbpamela coleman, ogden fb
Scott crews, ogden fbmike daniels, rockville fbTim essebaggers, Seattle cTdan fenner, Sault Ste. marie portjohn Garner, omaha npS fb and omaha dHS fbchristopher Grigsby, denver cTangel Gonzalez, San francisco fbrichard Gordan, auburn fbScott Hawkins, Greeneville cT and knoxville fbSue Heeren, davenport cTTina Hingorani, Santa ana fbrichard Hosey, jacksonville fbjason Hunt, fresno cT & fbnicholas infantino, Youngstown cT & fbmary ann kosmicki, omaha npS fb and omaha dHS fbkristina lee, omaha npS fbchris litsey, auburn fb, eugene cT, Seattle cTjill mccormick, omaha dHS fbdonald murphy, eugene cTWilliam murphy, auburn fblorento neequaye, Suitland fbj. michael ortega, denver cTpeter pocius, Sweetgrass portSharon Schuler, cape Girardeau cTWendy Schuman, lakewood doT fbWarren Sitterley, San francisco fbSandy Sitton, fresno cT & fbc. johnathan Sitzlar, Greeneville cT and knoxville fbamy Smith, denver fbdon Smyth, omaha npS fbmark Stanford, Sweetgrass portjoni Teter, denver fbTim Trubey, manhattan fbSteven underhill, las Vegas cTchristopher Wentzell, Sweetgrass portStephen West, Scowcroft fbryan Wilcoxen, denver fbbruce Williams, las Vegas cT
U.S. General Services AdministrationPublic buildings service1800 f street, nWWashington, dc 20405www.gsa.gov