Embed Size (px)
Citation preview
Limnol. Oceanogr., 35(S), 1990, 1 182-1195 0 1990, by the American Society of Limnology and Oceanography, Inc.
Oxygen isotopic composition of bottom seawater and tunicate cellulose used as indicators of water masses in the northern Bering and Chukchi Seas
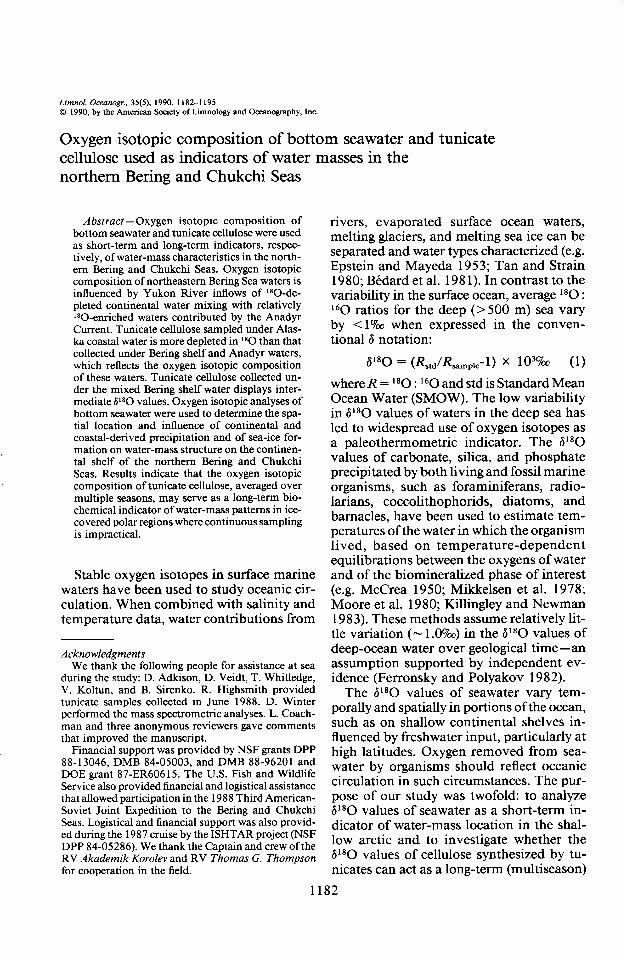
Abstract -Oxygen isotopic composition of bottom seawater and tunicate cellulose were used as short-term and long-term indicators, respec- tively, of water-mass characteristics in the north- ern Bering and Chukchi Seas. Oxygen isotopic composition of northeastern Bering Sea waters is influenced by Yukon River inflows of IsO-de- pleted continental water mixing with relatively 180-enriched waters contributed by the Anadyr Current. Tunicate cellulose sampled under Alas- ka coastal water is more depleted in IsO than that collected under Bering shelf and Anadyr waters, which reflects the oxygen isotopic composition of these waters. Tunicate cellulose collected un- der the mixed Bering shelf water displays inter- mediate 6180 values. Oxygen isotopic analyses of bottom seawater were used to determine the spa- tial location and influence of continental and coastal-derived precipitation and of sea-ice for- mation on water-mass structure on the continen- tal shelf of the northern Bering and Chukchi Seas. Results indicate that the oxygen isotopic composition of tunicate cellulose, averaged over multiple seasons, may serve as a long-term bio- chemical indicator of water-mass patterns in ice- covered polar regions where continuous sampling is impractical.
Stable oxygen isotopes in surface marine waters have been used to study oceanic cir- culation. When combined with salinity and temperature data, water contributions from
Acknowledgments We thank the following people for assistance at sea
during the study: D. Adkison, D. Veidt, T. Whitledge, V. Koltun, and B. Sirenko. R. Highsmith provided tunicate samples collected in June 1988. D. Winter performed the mass spectrometric analyses. L. Coach- man and three anonymous reviewers gave comments that improved the manuscript.
Financial support was provided by NSF grants DPP 88-l 3046, DMB 84-05003, and DMB 88-96201 and DOE grant 87-ER60615. The U.S. Fish and Wildlife Service also provided financial and logistical assistance that allowed participation in the 1988 Third American- Soviet Joint Expedition to the Bering and Chukchi Seas. Logistical and financial support was also provid- ed during the 1987 cruise by the ISHTAR project (NSF DPP 84-05286). We thank the Captain and crew of the RV Akademik Korolev and RV Thomas G. Thompson for cooperation in the field.
rivers, evaporated surface ocean waters, melting glaciers, and melting sea ice can be separated and water types characterized (e.g. Epstein and Mayeda 1953; Tan and Strain 1980; Bedard et al. 198 1). In contrast to the variability in the surface ocean, average 180 : 160 ratios for the deep (> 500 m) sea vary by < 1%~ when expressed in the conven- tional 6 notation:
6180 = (Rstd/R,mple- 1) X 1 030/oo (1)
where R = 180 : l 6O and std is Standard Mean Ocean Water (SMOW). The low variability in V80 values of waters in the deep sea has led to widespread use of oxygen isotopes as a paleothermometric indicator. The a1 8O values of carbonate, silica, and phosphate precipitated by both living and fossil marine organisms, such as foraminiferans, radio- larians, coccolithophorids, diatoms, and barnacles, have been used to estimate tem- peratures of the water in which the organism lived, based on temperature-dependent equilibrations between the oxygens of water and of the biomineralized phase of interest (e.g. McCrea 1950; Mikkelsen et al. 1978; Moore et al. 1980; Killingley and Newman 1983). These methods assume relatively lit- tle variation (N 1 .O%G) in the al80 values of deep-ocean water over geological time-an assumption supported by independent ev- idence (Ferronsky and Polyakov 1982).
The al80 values of seawater vary tem- porally and spatially in portions of the ocean, such as on shallow continental shelves in- fluenced by freshwater input, particularly at high latitudes. Oxygen removed from sea- water by organisms should reflect oceanic circulation in such circumstances. The pur- pose of our study was twofold: to analyze al80 values of seawater as a short-term in- dicator of water-mass location in the shal- low arctic and to investigate whether the 6180 values of cellulose synthesized by tu- nicates can act as a long-term (multiseason)
1182
Notes 1183
biochemical indicator of water-mass pat- terns. Our intent was unconventional com- pared to that of traditional oxygen isotopic studies of biosynthesized materials. Instead of relating the 6180 values of the biosyn- thesized materials to variations in water temperature, we sought to relate the al80 values of tunicate cellulose to the ambient 6l*O values of different water masses in a shallow, polar system.
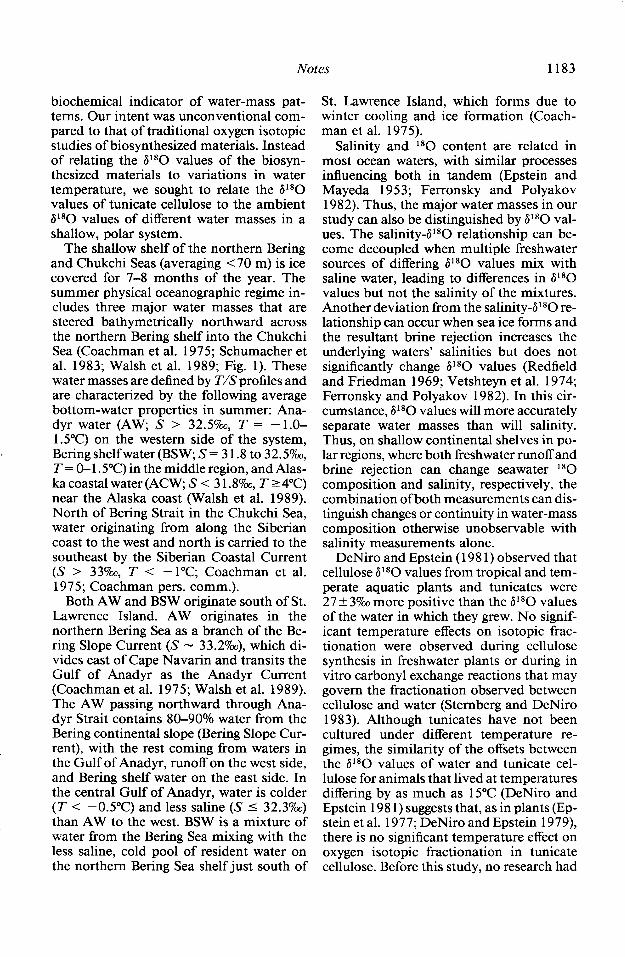
The shallow shelf of the northern Bering and Chukchi Seas (averaging ~70 m) is ice covered for 7-8 months of the year. The summer physical oceanographic regime in- cludes three major water masses that are steered bathymetrically northward across the northern Bering shelf into the Chukchi Sea (Coachman et al. 1975; Schumacher et al. 1983; Walsh et al. 1989; Fig. 1). These water masses are defined by T’S profiles and are characterized by the following average bottom-water properties in summer: Ana- dyr water (AW; S > 32.5o/oo, T = - l.O- 1.5”C) on the western side of the system, Bering shelfwater (BSW; S = 3 1.8 to 32.5o/oo, T = 0- 1.5”C) in the middle region, and Alas- ka coastal water (ACW, S < 3 1.8!&, T 2 4°C) near the Alaska coast (Walsh et al. 1989). North of Bering Strait in the Chukchi Sea, water originating from along the Siberian coast to the west and north is carried to the southeast by the Siberian Coastal Current (S > 33?&, T < - 1°C; Coachman et al. 1975; Coachman pers. comm.).
Both AW and BSW originate south of St. Lawrence Island. AW originates in the northern Bering Sea as a branch of the Be- ring Slope Current (S - 33.27~), which di- vides east of Cape Navarin and transits the Gulf of Anadyr as the Anadyr Current (Coachman et al. 1975; Walsh et al. 1989). The AW passing northward through Ana- dyr Strait contains 80-90% water from the Bering continental slope (Bering Slope Cur- rent), with the rest coming from waters in the Gulf of Anadyr, runoff on the west side, and Bering shelf water on the east side. In the central Gulf of Anadyr, water is colder (T < -O.SOC) and less saline (S 5 32.37~) than AW to the west. BSW is a mixture of water from the Bering Sea mixing with the less saline, cold pool of resident water on the northern Bering Sea shelf just south of
St. Lawrence Island, which forms due to winter cooling and ice formation (Coach- man et al. 1975).
Salinity and 180 content are related in most ocean waters, with similar processes influencing both in tandem (Epstein and Mayeda 1953; Ferronsky and Polyakov 1982). Thus, the major water masses in our study can also be distinguished by 6180 val- ues. The salinity-al80 relationship can be- come decoupled when multiple freshwater sources of differing al80 values mix with saline water, leading to differences in al80 values but not the salinity of the mixtures. Another deviation from the salinity-al80 re- lationship can occur when sea ice forms and the resultant brine rejection increases the underlying waters’ salinities but does not significantly change a1 *O values (Redfield and Friedman 1969; Vetshteyn et al. 1974; Ferronsky and Polyakov 1982). In this cir- cumstance, a1 8O values will more accurately separate water masses than will salinity. Thus, on shallow continental shelves in po- lar regions, where both freshwater runoff and brine rejection can change seawater 180 composition and salinity, respectively, the combination of both measurements can dis- tinguish changes or continuity in water-mass composition otherwise unobservable with salinity measurements alone.
DeNiro and Epstein (198 1) observed that cellulose 6180 values from tropical and tem- perate aquatic plants and tunicates were 27 + 3o/oo more positive than the al80 values of the water in which they grew. No signif- icant temperature effects on isotopic frac- tionation were observed during cellulose synthesis in freshwater plants or during in vitro carbonyl exchange reactions that may govern the fractionation observed between cellulose and water (Sternberg and DeNiro 1983). Although tunicates have not been cultured under different temperature re- gimes, the similarity of the offsets between the al80 values of water and tunicate cel- lulose for animals that lived at temperatures differing by as much as 15°C (DeNiro and Epstein 198 1) suggests that, as in plants (Ep- stein et al. 1977; DeNiro and Epstein 1979), there is no significant temperature effect on oxygen isotopic fractionation in tunicate cellulose. Before this study, no research had
1184 Notes
+ water circulation
BERING SEA \
BERING SLOPE
67
65
63
61
Fig. 1. Study area showing local water circulation, water masses, and bathymetry (modified from Coachman et al. 1975; Walsh et al. 1989).
been done to investigate the l*O composi- known as a tunic, along with inhalent and tion of polar tunicate cellulose. exhalent siphons at one end and an attach-
Ascidians (often called sea squirts) are ment surface at the other. The fibrous ma- sessile tunicates that occur attached to rocks, trix of the tunic is composed primarily of a pilings, or ships as well as within fine sed- type of cellulose, called tunicin, that occurs iments (Barnes 1980). These animals are in variable amounts, with proteins, poly- characterized by a tough outer body wall, saccharides, blood cells, and inorganic com-
Notes 1185
pounds (Ushakov 1955; Alexander 1975; Barnes 1980). Ciliary action transports wa- ter through the tunicate inhalent siphon and a central pharynx composed of a fine mesh, and plankton (primarily unicellular algae) are strained from the water. Water then passes into a surrounding cavity and is ex- pelled by the exhalent siphon (Alexander 1975). Sessile tunicates filter seawater for both food and oxygen and can filter water volumes ranging from 72 to 173 liters d-l, although the animal itself is only 5-l 5 cm long (Alexander 1975; Barnes 1980). Oxy- gen is required for filter feeding, metabolic processes, and growth (Alexander 1975). Solitary tunicates in tropical and temperate waters can live l-3 yr, colonial tunicates even longer (Barnes 1980). Cold tempera- tures and slower metabolism may be asso- ciated with longer lifespans in polar re- gimes, as is the case with many marine invertebrates in Antarctica (White 1977). Distribution of tunicates and other macro- benthic animals in the study area has re- cently been surveyed and linked to ocean- ographic processes governing pelagic productivity in the Bering and Chukchi Seas (Grebmeier et al. 1988, 1989; Grebmeier and McRoy 1989).
Salinity, temperature, and depth data were collected with a Neil Brown conductivity- temperature-depth profiler during the cruise on the RV Thomas G. Thompson (TT214) and a Seabird SBE9 CTD/General Oceanics rosette system during the cruise on the RV Akademik Korolev (AK47). Data for 1987 (TT2 14) were collected in conjunction with the National Science Foundation-funded ISHTAR (Inner Shelf Transfer and Recy- cling) project (P. McRoy and R. Tripp un- publ. data). Data in 1988 (AK47) were col- lected by the University of Texas Marine Science Institute-University of Washing- ton-USSR GOSGIMET project as part of the Third American-Soviet Joint Expedi- tion to the Bering and Chukchi Seas (A. Amos and L. Coachman unpubl. data). Sta- tion numbers are presented as the 2- or 3-digit cruise number followed by the 3-digit consecutive station number for that cruise.
Seawater samples were collected with 3-liter Niskin bottles and stored in 8-ml vi- als, sealed with Parafilm, and returned to
the laboratory. Oxygen isotopic ratios of water samples were determined by equili- brating 1 .O-ml water samples with -300 pmol of CO2 for 48 h, purifying the equil- ibrated CO, cryogenically, analyzing it mass spectrometrically, and using mass balance to calculate the original oxygen isotopic composition of the water (Epstein and May- eda 1953). Precisions of 6l*O values deter- mined for water were +O. 17~ (SD).
Tunicates were collected from both O.l- m2 van Veen grabs and otter trawls. Ani- mals were sorted to species or lowest taxon possible and frozen in Whirl-Pak bags. Tu- nicates were freeze-dried in the laboratory. The body wall of solitary animals was dis- sected out for cellulose extraction. In the case of colonial ascidians, a section of the outer region of the animals was excised for extraction. Cellulose was extracted with a sodium chlorite-acetic acid oxidation pro- cedure (Wise 1944). Oxygen isotopic ratios of cellulose were determined by pyrolyzing vacuum-dried and sealed samples in the presence of HgC12 at 520°C for 5 h to form CO, C02, and HCl. CO was disproportion- ated to CO, and C by electrical discharge. HCl was removed by reaction with isoquin- oline (Epstein et al. 1977). The CO, was then analyzed mass spectrometrically. Pre- cisions of al80 values determined for cel- lulose were +0.5o/oo (SD).
Twenty seawater samples were collected at 10 stations during TT2 14 (1 O-24 August 1987): half surface and half bottom samples (Table 1, Fig. 2). Seawater was most de- pleted in l*O just offshore of the Yukon Riv- er (14-m depth) in the less saline ACW, where the 6l*O value was -4.9?& near the bottom. Stations farther from the Yukon River, yet still within ACW, had #*O values ranging from - 3.6 to - 3.7(?& in surface wa- ters and - 3.2 to - 3.87~ in bottom waters. Stations in the Chirikov Basin-the region north of St. Lawrence Island in the more saline BSW- had higher l*O concentra- tions, with a1 *O values ranging from - 1.8 to-1.90/00atthesurfaceand-1.6to-1.8(% at depth. Stations north of Bering Strait had al80 values ranging from - 1.4 to -2.27~ for surface waters and bottom values rang- ing from - 1.4 to - 1.8%0. Comparison be- tween surface and bottom seawater samples
1186 Notes
Table 1. Summary of hydrographic and stable oxygen isotopic measurements for surface and bottom waters collected during cruise TT214 (12-3 1 August 1987).
Bottom water
St% Location Depth
(ml a-t e-4
6’80sMow 64
002 63”58SN, 165”30.5’W 5 29.53 6.81 23.13 -3.7 17 29.63 6.67 23.23 -3.8
003 63”30. l’N, 165”35.4’W 5 30.00 11.48 23.00 -3.6 22 30.29 5.71 23.84 -3.8
004 62”45.0’N, 165”56.O’W 5 29.84 12.09 22.55 -4.8 14 29.88 12.05 22.58 -4.9
007 62”19.0’N, 167”08.O’W 5 29.33 11.12 22.44 -3.6 31 30.40 2.31 24.24 -3.2
028 64”23.2’N, 169”2O.O’W 5 31.39 9.38 24.3 1 -1.9 39 32.10 0.36 25.72 -2.1
050 64”46.0’N, 168”38.O’W 5 30.19 10.45 23.32 -1.8 45 32.16 0.59 25.76 -1.6
128 65”58.0’N, 168”56.O’W 5 32.32 1.10 25.89 -1.8 45 32.9 1 2.05 26.27 -1.4
144 67”30.0’N, 168”55.O’W 5 32.04 2.91 25.44 -1.4 49 32.75 1.63 26.23 -1.4
148 67”46.1’N, 167”lO.O’W 9 31.24 5.86 24.68 -1.9 44 32.17 1.11 25.84 -1.8
156 68”00.O’N, 168”55.O’W 5 30.37 5.76 24.25 -2.2 45 32.75 0.89 25.65 -1.5
at individual stations indicated no signifi- cant difference in l*O * 160 ratios with a Wil- . coxon signed-ranks test (P = 0.173). There- fore, all values were combined to compare the relationship of 6180 values to salinity. Since water masses in the area are defined by bottom salinity values and tunicates grow benthically, we designed the second field season to investigate water-mass location with bottom-water samples only.
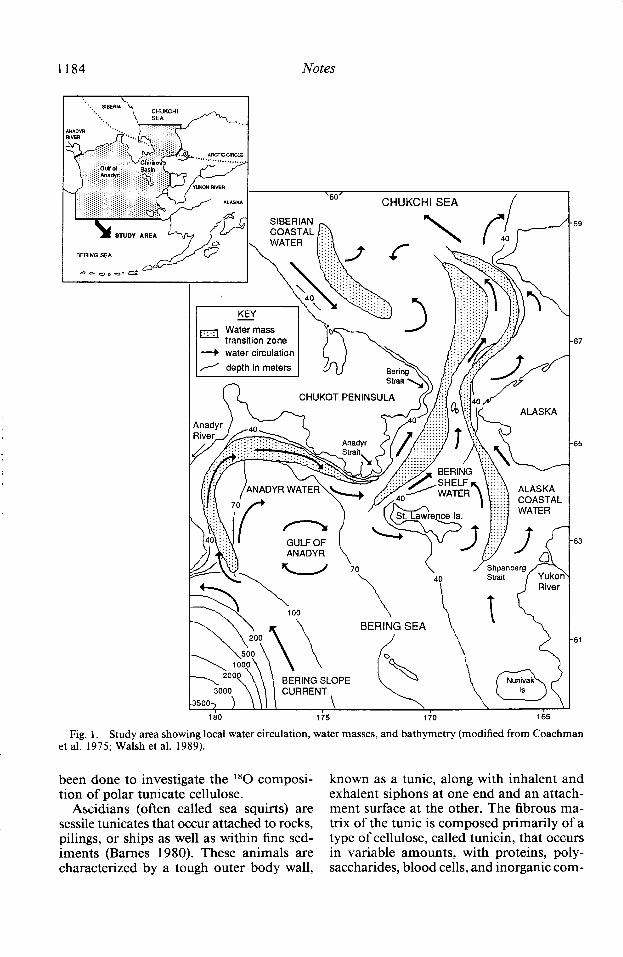
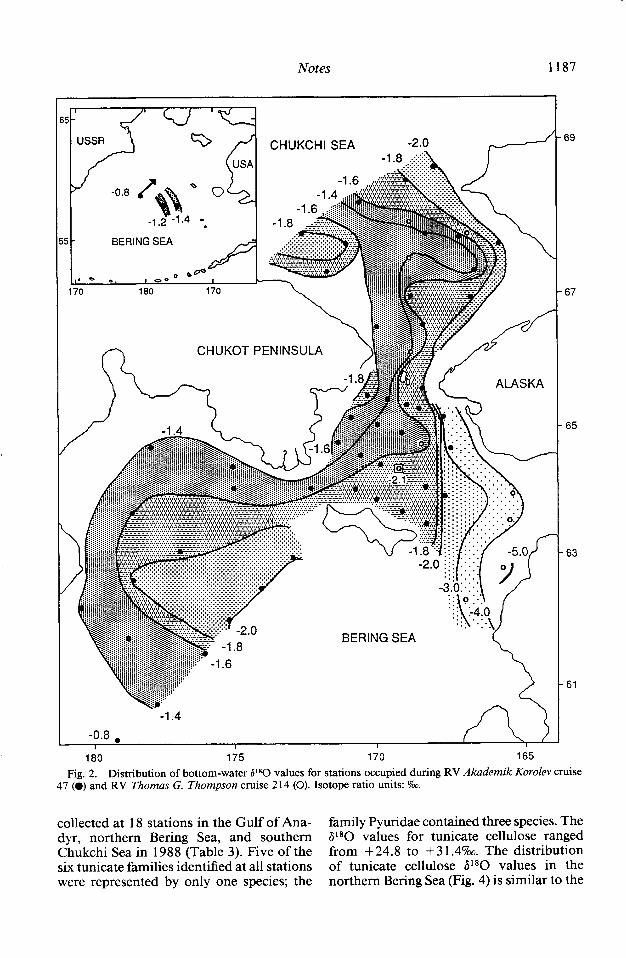
Fifty bottom-water samples for stable ox- ygen isotopic composition were collected in the central Bering Sea, Gulf of Anadyr, northern Bering Sea, and southern Chukchi Sea during AK47 (25 July-3 September 1988; Table 2). These data, in combination with P*O bottom-water values from cruise TT2 14, show a pattern of more enriched I80 seawater in the central Bering Sea with P*O values becoming more negative on the continental shelf of the northern Bering and Chukchi Seas (Fig. 2). In the Gulf of Anadyr, the stable oxygen isotopic values ranged from - 1.4 to - 1.69m in AW, with the most negative P*O values for this area observed in the outer boundary of the gulf (Figs. 1, 2). Bottom 6 l *O values generally ranged from - 1.4 to - 1.69~ in the western portion of the Chirikov Basin under AW, becoming more negative in the central basin (- 1.6 to
- 1.89m) under BSW and in the BSW-ACW frontal zone (- 1.8 to - 3.09~). The most ‘*O-depleted values occurred near the Alas- ka coastline in ACW (- 3.0 to - 5.09~). The pattern is similar in the western portion of the southern Chukchi Sea (excluding the westernmost protrusion of more negative al80 values), with P*O values becoming more negative at stations closer to the Alas- ka coastline.
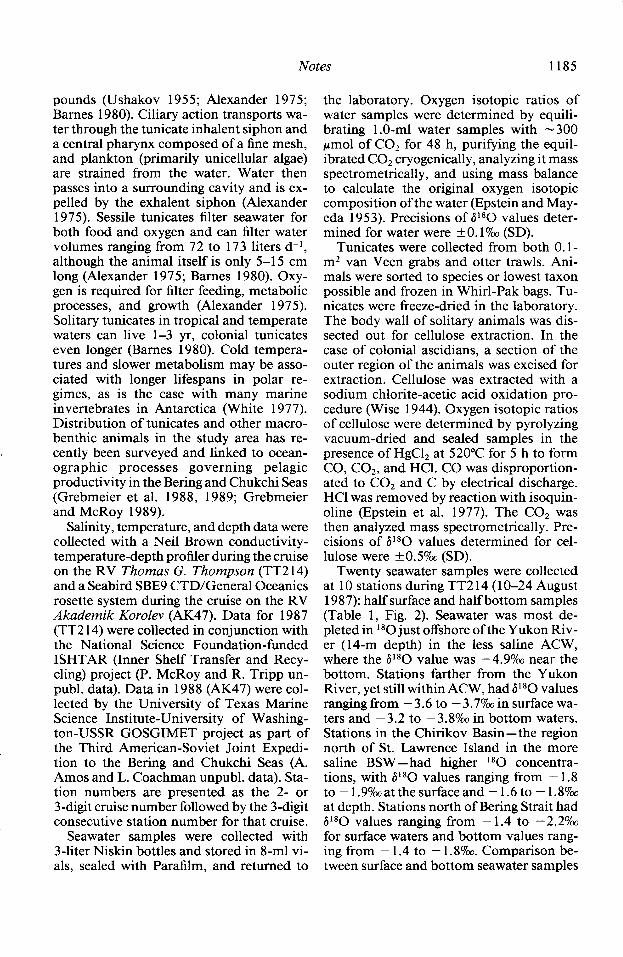
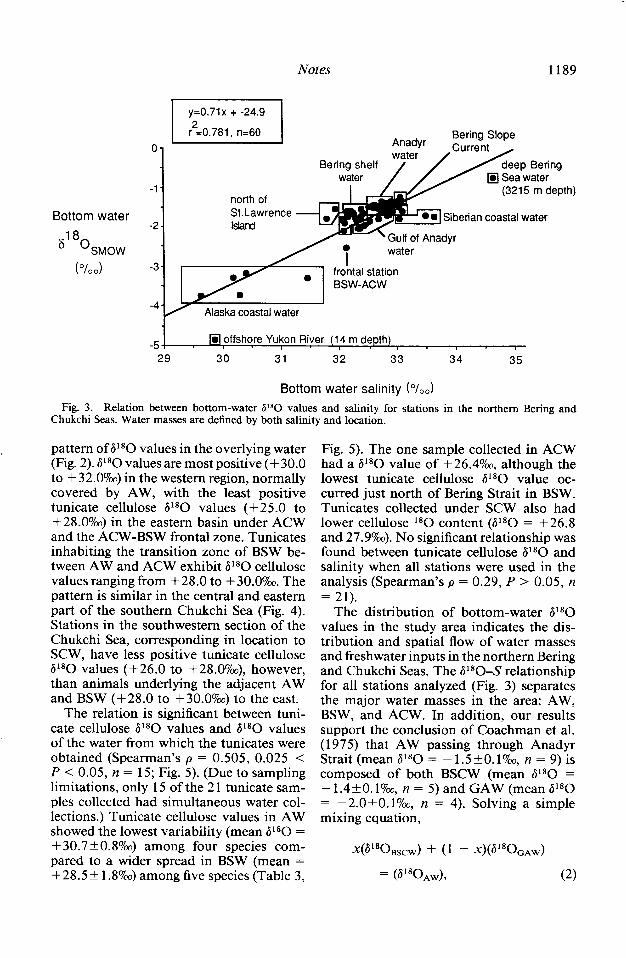
We observed a significant relation in bot- tom seawater salinity-stable oxygen isotope in the study area. Different water masses can be distinguished (Fig. 3) based on both the salinity definitions provided in the intro- duction and the spatial distribution of P*O values (Fig. 3): ACW (S = 29-31.59m, P*O = -3.0 to -5.09~), BSW (S = 31.8-32.59~, V*O = - 1.6 to -2.19~), AW (S = 32.5- 33 1900 6180 = - 1.4 to - 1.69~), Gulf of Anady; water (GAW; S = 32.49~ ?jl*O = - 1.9 to - 2.09~), and Siberian coasial water (SCW; S > 339m, 6180 = - 1.7 to - 1.89~). Stations in the Bering Slope Current water (BSCW) had bottom salinity values ranging from 33.0 to 33.19~ and al80 from - 1.3 to - 1.49~. The least negative al80 value (- 0.89m) occurred in deep Bering Sea water (3,215-m depth).
Twenty-one benthic tunicate samples were
Notes 1187
-0.8 . I I I I
180 175 170 165
69
67
65
63
61
Fig. 2. Distribution of bottom-water P*O values for stations occupied during RV Akudemik Korolev cruise 47 (0) and RV Thomas G. Thompson cruise 2 14 (0). Isotope ratio units: ‘SO.
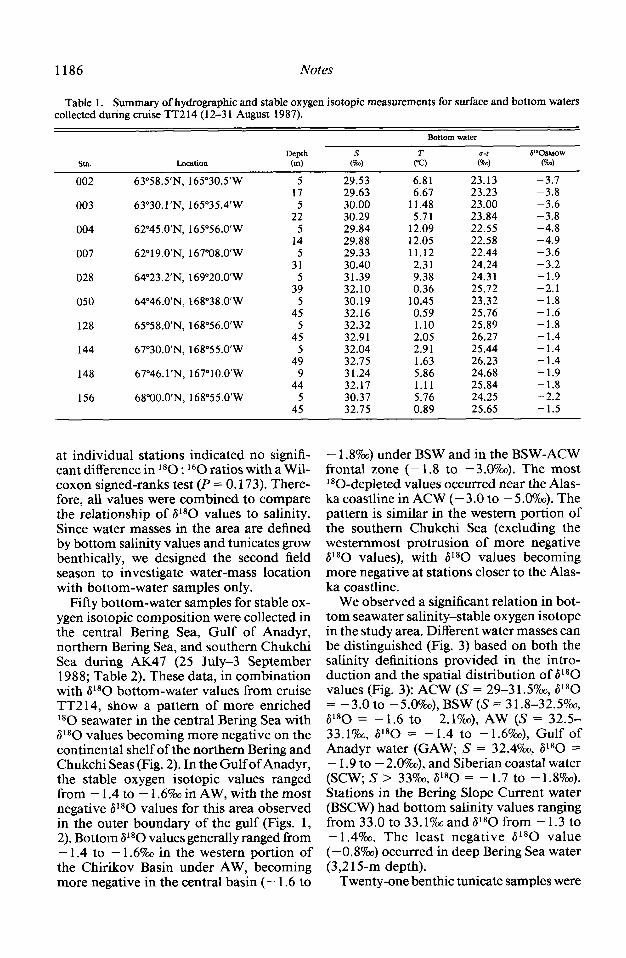
collected at 18 stations in the Gulf of Ana- family Pyuridae contained three species. The dyr, northern Bering Sea, and southern P*O values for tunicate cellulose ranged Chukchi Sea in 1988 (Table 3). Five of the from +24.8 to + 3 1.49~. The distribution six tunicate families identified at all stations of tunicate cellulose P*O values in the were represented by only one species; the northern Bering Sea (Fig. 4) is similar to the
1188
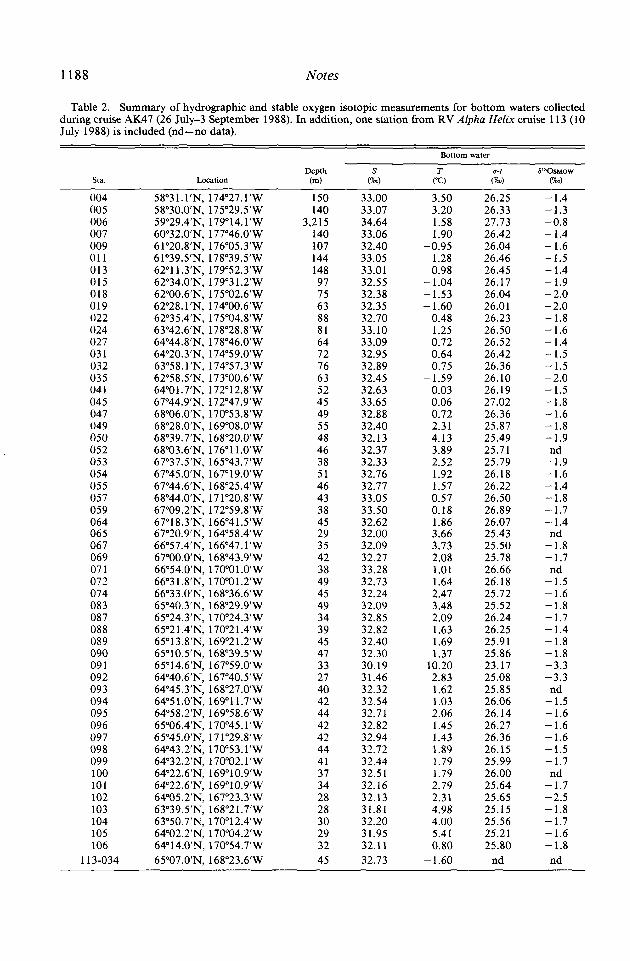
Table 2. Summary of hydrographic and stable oxygen isotopic measurements for bottom waters collected during cruise AK47 (26 July-3 September 1988). In addition, one station from RV Alpha Helix cruise 113 (10 July 1988) is included (nd-no data).
sta. Location Depth
(m) a-t 6’80sMow (94 (94
004 58”3l.l’N, 174’27.l’W 150 33.00 3.50 26.25 -1.4 005 58”30.0’N, 175”29.5’W 140 33.07 3.20 26.33 -1.3 006 59”29.4’N, 179’14.l’W 3,215 34.64 1.58 27.73 -0.8 007 60”32.0’N, 177’46.O’W 140 33.06 1.90 26.42 -1.4 009 61”20.8’N, 176’05.3’W 107 32.40 -0.95 26.04 -1.6 011 61”39.5’N, 178’39.5’W 144 33.05 1.28 26.46 -1.5 013 62”11.3’N, 179’52.3’W 148 33.01 0.98 26.45 -1.4 015 62”34.0’N, 179’3 1.2’W 97 32.55 - 1.04 26.17 -1.9 018 62”00.6’N, 175’02.6’W 75 32.38 - 1.53 26.04 -2.0 019 62”28.l’N, 174’00.6’W 63 32.35 -1.60 26.01 -2.0 022 62”35.4’N, 175’04.8’W 88 32.70 0.48 26.23 -1.8 024 63”42.6’N, 178’28.8’W 81 33.10 1.25 26.50 -1.6 027 64”44.8’N, 178”46.O’W 64 33.09 0.72 26.52 -1.4 031 64”20.3’N, 174”59.O’W 72 32.95 0.64 26.42 -1.5 032 63”58,l’N, 174’57.3’W 76 32.89 0.75 26.36 -1.5 035 62”58.5’N, 173’00.6’W 63 32.45 -1.59 26.10 -2.0 041 64”01.7’N, 172”12.8’W 52 32.63 0.03 26.19 -1.5 045 67”44.9’N, 172’47.9’W 45 33.65 0.06 27.02 -1.8 047 68”06.0’N, 170’53.8’W 49 32.88 0.72 26.36 -1.6 049 68”28.0’N, 169’08.O’W 55 32.40 2.31 25.87 -1.8 050 68”39.7’N, 168”2O.O’W 48 32.13 4.13 25.49 -1.9 052 68”03.6’N, 176”ll .O’W 46 32.37 3.89 25.7 1 nd 053 67”37.5’N, 165’43.7’W 38 32.33 2.52 25.79 -1.9 054 67”45.0’N, 167’19.O’W 51 32.76 1.92 26.18 -1.6 055 67”44.6’N, 168*25.4’W 46 32.77 1.57 26.22 -1.4 057 68”44.0’N, 17 l”20.8’W 43 33.05 0.57 26.50 -1.8 059 67”09.2’N, 172”59.8’W 38 33.50 0.18 26.89 -1.7 064 67”18.3’N, 166’41.5’W 45 32.62 1.86 26.07 -1.4 065 67”20.9’N, 164’58.4’W 29 32.00 3.66 25.43 nd 067 66”57.4’N, 166’47.l’W 35 32.09 3.73 25.50 -1.8 069 67”00.O’N, 168’43.9’W 42 32.27 2.08 25.78 -1.7 071 66”54.0’N, 170’0 1 .O’W 38 33.28 1.01 26.66 nd 072 66”31.8’N, 170’01.2’W 49 32.73 1.64 26.18 -1.5 074 66”33.0’N, 168”36.6’W 45 32.24 2.47 25.72 -1.6 083 65”40.3’N, 168”29.9’W 49 32.09 3.48 25.52 -1.8 087 65”24.3’N, 170’24.3’W 34 32.85 2.09 26.24 -1.7 088 65”21.4’N, 170”21.4’W 39 32.82 1.63 26.25 -1.4 089 65”13.8’N, 169’21.2’W 45 32.40 1.69 25.9 1 -1.8 090 65”10.5’N, 168’39.5’W 47 32.30 1.37 25.86 -1.8 091 65”14.6’N, 167’59.O’W 33 30.19 10.20 23.17 -3.3 092 64”40.6’N, 167”40.5’W 27 31.46 2.83 25.08 -3.3 093 64”45.3’N, 168’27.O’W 40 32.32 1.62 25.85 nd 094 64”5l.O’N, 169’11.7’W 42 32.54 1.03 26.06 -1.5 095 64”58.2’N, 169’58.6’W 44 32.71 2.06 26.14 -1.6 096 65”06.4’N, 170’45.l’W 42 32.82 1.45 26.27 -1.6 097 65”45.0’N, 171’29.8’W 42 32.94 1.43 26.36 -1.6 098 64”43.2’N, 170’53.l’W 44 32.72 1.89 26.15 -1.5 099 64”32.2’N, 170°02.1’W 41 32.44 1.79 25.99 -1.7 100 64”22.6’N, 169’10.9’W 37 32.51 1.79 26.00 nd 101 64”22.6’N, 169’10.9’W 34 32.16 2.79 25.64 -1.7 102 64”05.2’N, 167’23.3’W 28 32.13 2.31 25.65 -2.5 103 63”39,5’N, 168’2 1.7’W 28 31.81 4.98 25.15 -1.8 104 63”50.7’N, 170’12.4’W 30 32.20 4.00 25.56 -1.7 105 64”02.2’N, 1 70°04.2’W 29 31.95 5.41 25.21 -1.6 106 64”14.0’N, 170”54.7’W 32 32.11 0.80 25.80 -1.8
113-034 65”07.0’N, 168”23.6’W 45 32.73 -1.60 nd nd
Notes 1189
Bottom water
PO SMOW
(O/00)
Siberian coastal water
m offshore Yukon River (14 m depth) I I I I
30 31 32 33 I I
34 35
Bottom water salinity (o/oo)
Fig. 3. Relation between bottom-water PO values and salinity for stations in the northern Bering and Chukchi Seas. Water masses are defined by both salinity and location.
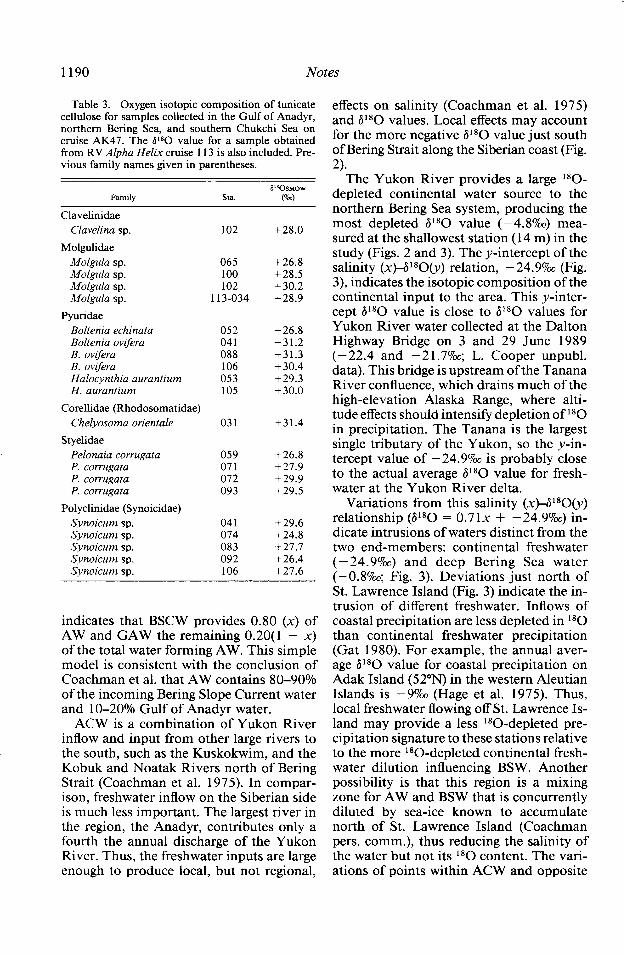
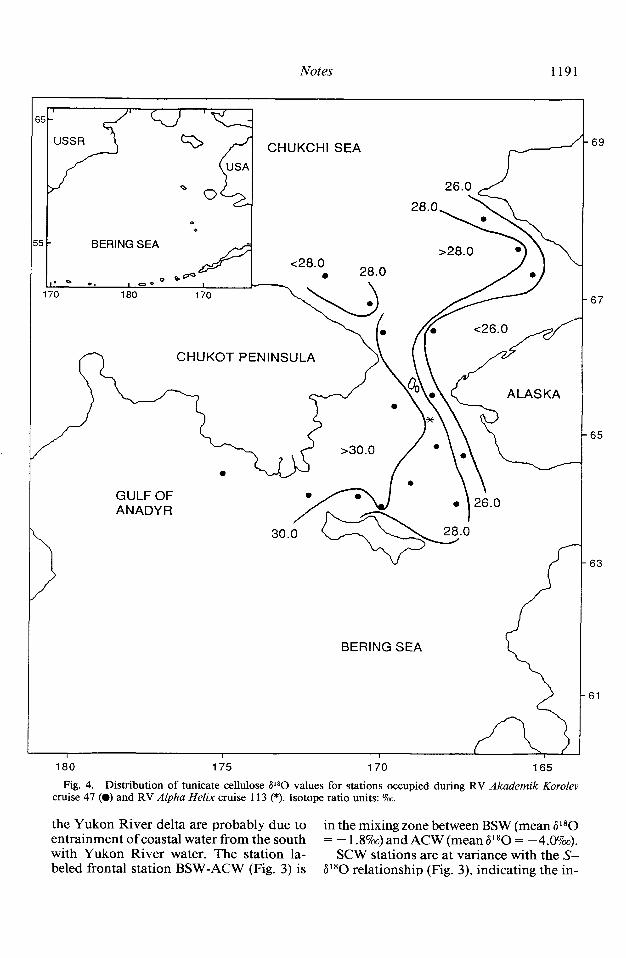
pattern of P *O values in the overlying water (Fig. 2). P*O values are most positive (+ 30.0 to + 32.07~) in the western region, normally covered by AW, with the least positive tunicate cellulose P80 values (+25.0 to +28.07~) in the eastern basin under ACW and the ACW-BSW frontal zone. Tunicates inhabiting the transition zone of BSW be- tween AW and ACW exhibit P80 cellulose values ranging from +28.0 to + 30.0%. The pattern is similar in the central and eastern part of the southern Chukchi Sea (Fig. 4). Stations in the southwestern section of the Chukchi Sea, corresponding in location to SCW, have less positive tunicate cellulose al80 values (+26.0 to +28.0%~), however, than animals underlying the adjacent AW and BSW (+28.0 to + 30.0%) to the east.
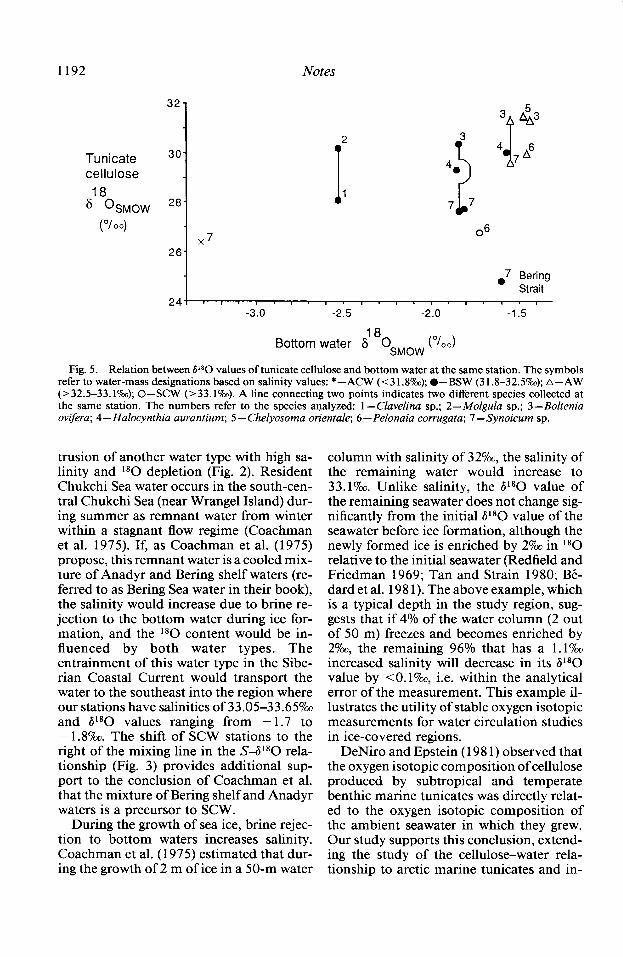
The relation is significant between tuni- cate cellulose P80 values and 6 180 values of the water from which the tunicates were obtained (Spearman’s p = 0.505, 0.025 < P < 0.05, n = 15; Fig. 5). (Due to sampling limitations, only 15 of the 2 1 tunicate sam- ples collected had simultaneous water col- lections.) Tunicate cellulose values in AW showed the lowest variability (mean 6180 = +30.7*0.8%) among four species com- pared to a wider spread in BSW (mean = + 28.5 + 1.87~) among five species (Table 3,
Fig. 5). The one sample collected in ACW had a P80 value of +26.4%~, although the lowest tunicate cellulose 6180 value oc- curred just north of Bering Strait in BSW. Tunicates collected under SCW also had lower cellulose 180 content (P80 = +26.8 and 27.9Y&~). No significant relationship was found between tunicate cellulose P80 and salinity when all stations were used in the analysis (Spearman’s p = 0.29, P > 0.05, n = 21).
The distribution of bottom-water P*O values in the study area indicates the dis- tribution and spatial flow of water masses and freshwater inputs in the northern Bering and Chukchi Seas. The P*O-S relationship for all stations analyzed (Fig. 3) separates the major water masses in the area: AW, BSW, and ACW. In addition, our results support the conclusion of Coachman et al. (1975) that AW passing through Anadyr Strait (mean 6180 = - 1.5&O. I?&, n = 9) is composed of both BSCW (mean P*O = - 1.4+0.1?& n = 5) and GAW (mean al80 = -2.OfO.1%0, n = 4). Solving a simple mixing equation,
x(V80 BSCW) + (1 - xW8%4w)
= (~18Q4wh (2)
1190 Notes
Table 3. Oxygen isotopic composition of tunicate cellulose for samples collected in the Gulf of Anadyr, northern Bering Sea, and southern Chukchi Sea on cruise AK47. The WO value for a sample obtained from RV Alpha Helix cruise 113 is also included. Pre- vious family names given in parentheses.
Family
Clavelinidae Clavelina sp.
Molgulidae Molgula sp. Molgula sp. Molgula sp. Molgula sp.
Pyuridae Boltenia echinata 052 Boltenia ovifera 041 B. ovifera 088 B. ovifera 106 Halocynthia aurantium 053 H. aurantium 105
Corellidae (Rhodosomatidae) Chelyosoma orientale
Styelidae Pelonaia corrugata P. corrugata P. corrugata P. corrugata
Polyclinidae (Synoicidae) Synoicum sp. Synoicum sp.
Synoicum sp. Synoicum sp. Synoicum sp.
031
059 +26.8 071 +27.9 072 +29.9 093 +29.5
041 +29.6 074 +24.8 083 +27.7 092 +26.4 106 +27.6
102
065 +26.8 100 +28.5 102 + 30.2
113-034 +28.9
+2&o
+26.8 +31.2 +31.3 +30.4 +29.3 +30.0
+31.4
indicates that BSCW provides 0.80 (x) of AW and GAW the remaining 0.20(1 - x) of the total water forming AW. This simple model is consistent with the conclusion of Coachman et al. that AW contains 80-90% of the incoming Bering Slope Current water and lo-20% Gulf of Anadyr water.
ACW is a combination of Yukon River inflow and input from other large rivers to the south, such as the Kuskokwim, and the Kobuk and Noatak Rivers north of Bering Strait (Coachman et al. 1975). In compar- ison, freshwater inflow on the Siberian side is much less important. The largest river in the region, the Anadyr, contributes only a fourth the annual discharge of the Yukon River. Thus, the freshwater inputs are large enough to produce local, but not regional,
effects on salinity (Coachman et al. 1975) and al80 values. Local effects may account for the more negative P*O value just south of Bering Strait along the Siberian coast (Fig. 2).
The Yukon River provides a large l*O- depleted continental water source to the northern Bering Sea system, producing the most depleted al80 value (- 4.87~) mea- sured at the shallowest station (14 m) in the study (Figs. 2 and 3). The y-intercept of the salinity (x)-P*O@) relation, -24.9o/oo (Fig. 3), indicates the isotopic composition of the continental input to the area. This y-inter- cept P*O value is close to al*O values for Yukon River water collected at the Dalton Highway Bridge on 3 and 29 June 1989 (-22.4 and -2 1.7o/oo; L. Cooper unpubl. data). This bridge is upstream of the Tanana River confluence, which drains much of the high-elevation Alaska Range, where alti- tude effects should intensify depletion of 1 *O in precipitation. The Tanana is the largest single tributary of the Yukon, so the v-in- tercept value of - 24.9?& is probably close to the actual average al80 value for fresh- water at the Yukon River delta.
Variations from this salinity (x)-P*O@) relationship @l*O = 0.71x + -24.97~) in- dicate intrusions of waters distinct from the two end-members: continental freshwater (-24.9ym) and deep Bering Sea water (-0.8o/oo; Fig. 3). Deviations just north of St. Lawrence Island (Fig. 3) indicate the in- trusion of different freshwater. Inflows of coastal precipitation are less depleted in ‘*O than continental freshwater precipitation (Gat 1980). For example, the annual aver- age al80 value for coastal precipitation on Adak Island (52”N) in the western Aleutian Islands is -9%~ (Hage et al. 1975). Thus, local freshwater flowing off St. Lawrence Is- land may provide a less ‘*O-depleted pre- cipitation signature to these stations relative to the more ‘*O-depleted continental fresh- water dilution influencing BSW. Another possibility is that this region is a mixing zone for AW and BSW that is concurrently diluted by sea-ice known to accumulate north of St. Lawrence Island (Coachman pers. comm.), thus reducing the salinity of the water but not its l*O content. The vari- ations of points within ACW and opposite
Notes 1191
CHUKCHI SEA CHUKCHI SEA
0 0 0 0
BERING SEA BERING SEA
CHUKOT PENINSULA CHUKOT PENINSULA
GULF OF GULF OF ANADY R ANADY R
BERING SEA
180 175 170 165
Fig. 4. Distribution of tunicate cellulose 6’*0 values for stations occupied during RV Akademik Korolev cruise 47 (0) and RV Alpha Helix cruise 113 (*). Isotope ratio units: o/00.
-69
.67
.65
63
61
the Yukon River delta are probably due to in the mixing zone between BSW (mean P*O entrainment of coastal water from the south = -1.8%)andACW(meanP80= -4.0%). with Yukon River water. The station la- SCW stations are at variance with the S- beled frontal station BSW-ACW (Fig. 3) is ai80 relationship (Fig. 3), indicating the in-
1192 Notes
3Q G3
Tunicate cellulose
18 ’ OSMOW
(O/00)
32-
30-
28-
2
I 1
Bering Strait
-3.0 -2.5 -2.0 -1.5
Bottom water $ 80sMow (“/,,)
Fig. 5. Relation between PO values of tunicate cellulose and bottom water at the same station. The symbols refer to water-mass designations based on salinity values: * -ACW (<31.8o/oo); l -BSW (31.8-32.5%); A-AW (>32.5-33.1%0); 0-SCW (>33.1?&). A line connecting two points indicates two different species collected at the same station. The numbers refer to the species analyzed: 1 - Clavelina sp.; 2-A4olgula sp.; 3 -Boltenia ovifera; 4 - Halocynthia aurantium; 5 - Chelyosoma orientale; 6 - Pelonaia corrugata; 7 -Synoicum sp.
trusion of another water type with high sa- linity and l*O depletion (Fig. 2). Resident Chukchi Sea water occurs in the south-cen- tral Chukchi Sea (near Wrangel Island) dur- ing summer as remnant water from winter within a stagnant flow regime (Coachman et al. 1975). If, as Coachman et al. (1975) propose, this remnant water is a cooled mix- ture of Anadyr and Bering shelf waters (re- ferred to as Bering Sea water in their book), the salinity would increase due to brine re- jection to the bottom water during ice for- mation, and the l*O content would be in- fluenced by both water types. The entrainment of this water type in the Sibe- rian Coastal Current would transport the water to the southeast into the region where our stations have salinities of 33.05-33.657~ and al80 values ranging from - 1.7 to - 1.8o/oo. The shift of SCW stations to the right of the mixing line in the S_6180 rela- tionship (Fig. 3) provides additional sup- port to the conclusion of Coachman et al. that the mixture of Bering shelf and Anadyr waters is a precursor to SCW.
During the growth of sea ice, brine rejec- tion to bottom waters increases salinity. Coachman et al. (1975) estimated that dur- ing the growth of 2 m of ice in a 50-m water
column with salinity of 32?&, the salinity of the remaining water would increase to 3 3.1?&. Unlike salinity, the a1 *O value of the remaining seawater does not change sig- nificantly from the initial P*O value of the seawater before ice formation, although the newly formed ice is enriched by 2o/oo in l*O relative to the initial seawater (Redfield and Friedman 1969; Tan and Strain 1980; Be- dard et al. 198 1). The above example, which is a typical depth in the study region, sug- gests that if 4% of the water column (2 out of 50 m) freezes and becomes enriched by 2o/oo, the remaining 96% that has a 1.17~ increased salinity will decrease in its al80 value by <O.lo/oo, i.e. within the analytical error of the measurement. This example il- lustrates the utility of stable oxygen isotopic measurements for water circulation studies in ice-covered regions.
DeNiro and Epstein (198 1) observed that the oxygen isotopic composition of cellulose produced by subtropical and temperate benthic marine tunicates was directly relat- ed to the oxygen isotopic composition of the ambient seawater in which they grew. Our study supports this conclusion, extend- ing the study of the cellulose-water rela- tionship to arctic marine tunicates and in-
Notes 1193
dicating the potential value of these organisms for defining water masses and hence possibly inferring ocean circulation in polar regions.
For AW, which arises in the Gulf of Ana- dyr, the distribution of tunicate cellulose 6 1 *O values (Fig. 4) is very similar in spatial distribution to the overlying bottom-water V*O values (Fig. 2), indicating a potential relationship between the two. Tunicate cel- lulose 6l*O values in AW averaged + 30.7 +0.8%0 (n = 5) for both solitary (Bol- tenia ovifera, Chelyosoma orientale, Pelo- naia corrugata) and colonial (Clavelina sp., Synoicum sp.) ascidians (Table 3, Fig. 5). The fact that four tunicate species had sim- ilar cellulose V*O values indicates minimal species effects on oxygen isotopic fraction- ation in this water mass. ACW, in the east- ernmost region of the study area, has bot- tom-water P*O values ranging from - 3.0 to -5.O?& (Figs. 2 and 3). Tunicates were collected at only one station in ACW, but by comparison with AW had a less positive P*O value, +26.4% (Table 3, Fig. 5).
The least positive value of tunicate cel- lulose P*O (+24.8%) was observed at sta- tion AK47-074 just north of Bering Strait (Figs. 4 and 5), which, based on bottom- water P*O and salinity values, was covered with BSW. Longer term, seasonal analyses of the location of ACW indicate that it oc- cupies this area most of summer (Fig. 1; Coachman et al. 1975), suggesting that the lower P*O value recorded in the tunicate cellulose is an indicator of tunicate growth when ACW normally overlies this station, particularly earlier in the season when fresh- water runoff is maximal. If we exclude this station, based on the a priori assumption that ACW normally overlies this station, the significance of the correlation between tunicate cellulose P*O values and 6 l*O val- ues of bottom seawater increases from 0.025 < P < 0.05 (Spearman’s p = 0.505, n = 15) to 0.01 < P < 0.025 (Spearman’s p = 0.60, n = 14).
BSW had P*O values ranging from - 1.6 to -2.l%~, intermediate between those of AW and ACW (Figs. 2 and 3). The location and composition of BSW is dependent on water transport events through Anadyr and Shpanberg straits (Coachman et al. 1975;
Walsh et al. 1989). The horizontal expanse of BSW is directly influenced by the volume and mixing of Bering Sea water from south of St. Lawrence Island with AW from the west and ACW from the east, all flowing northward through the region and perhaps explaining the wide range of water and tunicate cellulose P*O values (Figs. 2 and 5). Tunicate cellulose P*O values ranged from + 26.4Ym in the east to + 30.2o/oo in the west, giving an average BSW value of +28.5* 1.8?& (n = 8; Fig. 5). The larger variability in the stable oxygen isotopic val- ues of tunicate cellulose compared to sam- ples collected in AW may be indicative of either the large spatial variability in BSW over the open-water season due to mixing with AW to the west and ACW to the east or interspecific physiological differences that could influence oxygen isotopic fractiona- tion during tunicate cellulose production.
Further investigation is also needed to study isotopic effects influenced by physi- ological differences between solitary and co- lonial ascidians on oxygen fractionation during cellulose production. When both sol- itary and colonial species were obtained at individual stations in both BSW and AW, colonial ascidians (Clavelina sp., Synoicum sp.) consistently had cellulose #*O values less positive than solitary species (Molgula sp., B. ovzjkra; Fig. 5). This difference may be due to physiological differences between solitary tunicates, which build individual body walls, and colonial tunicates, which share a common outer tunic and fused in- terior chambers. Another possibility may be that solitary and colonial organisms have different growth rates or periods of growth. Nevertheless, if most interspecific differ- ences are caused by growth at different times of year, rather than by biochemistry, tuni- cates collected in AW probably are a better indicator of the magnitude of biochemical variability because BSW is a mixed water mass with a more variable salinity and iso- topic composition. Additional work is also needed to determine the lifespan of the tu- nicate species in the study area in order to use tunicate cellulose as a seasonal indicator of water-mass location.
Despite various uncertainties, there is a distinct gradient of more positive P*O val-
1194 Notes
ues of water and tunicate cellulose in AW in the west to intermediate values in BSW, with the least positive values in ACW to the east (Figs. 2 and 4). Tunicate cellulose P80 values are significantly related to the al80 values of the overlying bottom water throughout the study area, but not to bot- tom salinity. As discussed earlier, however, higher salinity in SCW is apparently caused by sea-ice formation, which does not sig- nificantly affect bottom seawater P80 val- ues, so tunicates collected at two stations in that water mass show a relationship to sea- water P80 values, even though the seawater 6 l 8O-S relationship has been disturbed (Figs. 2 and 4). If we exclude SCW stations from the correlation between tunicate cellulose 6180 and salinity for all samples collected, the relationship becomes significant (Spear- man’s p = 0.5 15, 0.01 < P < 0.025, n = 19), as it is between tunicate cellulose and bottom-seawater 6180 values. This finding demonstrates the conservative nature of P80 values as opposed to salinity in character- izing water masses at high latitudes, even when tunicate cellulose values are used.
Given the indications from this study that tunicate cellulose P*O values can be used to characterize water-mass locations at high latitudes over time scales that are expensive and difficult to sample, we think that de- tailed studies of the basis for the tunicate cellulose-water oxygen isotope relationship are in order. Work is needed to elucidate the biochemical processes involved in cel- lulose synthesis in tunicates, focusing spe- cifically on the issue of whether cellulose al80 values are determined solely by the in situ isotopic composition of the seawater in which the animal lives, or whether the P80 values of organic filtrate available to tuni- cates or temperature also affect cellulose composition. Once the magnitude of these potentially interfering signals is evaluated, the widespread distribution of benthic tu- nicate populations may prove useful in characterizing temporal variation of water- mass distributions in polar regions.
Jacqueline M. Grebmeier 1
’ Present address: Graduate Program in Ecology, University of Tennessee, Knoxville 37996- 119 1.
Department of Geological Sciences University of Southern California Los Angeles 90089
Lee W. Cooper2 Michael J. DeNiro
Department of Earth Sciences University of California Santa Barbara 93 106
References ALEXANDER, R. M. 1975. The chordates. Cambridge. BARNES, R. D. 1980. Invertebrate zoology, 4th ed.
Saunders. B~DARD, P., C. HILLAIRE-MARCEL, AND P. PAGE. 198 1.
l*O modelling of freshwater inputs in Baffin Bay and Canadian Arctic coastal waters. Nature 293: 287-289.
COACHMAN, L. K., K. AAGAARD, AND R. B. TRIPP. 1975. Bering Strait: The regional physical ocean- ography. Univ. Washington.
DENIRO, M. J., AND S. EPSTEIN. 1979. Relationship between the oxygen isotope ratios of terrestrial plant cellulose, carbon dioxide and water. Science 204: 5 l-53.
-, AND -. 198 1. Isotopic composition of cellulose from aquatic organisms. Geochim. Cos- mochim. Acta 45: 1885-l 894.
EPSTEIN, S., AND T. MAYEDA. 1953. Variations of 018 content of waters from natural sources. Geochim. Cosmochim. Acta 4: 2 13-224.
-, P. THOMPSON, AND C. J. YAPP. 1977. Oxygen and hydrogen isotopic ratios in plant cellulose. Science 198: 1209-l 2 15.
FERRONSKY, V. I., AND V. A. POLYAKOV. 1982. En- vironmental isotopes in the hydrosphere. Wiley.
GAT, J. R. 1980. The isotopes of hydrogen and ox- ygen in precipitation, p. 21-48. In P. Fritz and J. C. Fontes [eds.], Handbook of environmental iso- tope geochemistry. V. 1. Elsevier.
GREBMEIER, J. M., H. M. FEDER, AND C. P. MCROY. 1989. Pelagic-benthic coupling on the shelf of the northern Bering and Chukchi Seas. 2. Benthic community structure. Mar. Ecol. Prog. Ser. 51: 253-268.
-, AND C. P. McRou. 1989. Pelagic-benthic coupling on the shelf of the northern Bering and Chukchi Seas. 3. Benthic food supply and carbon cycling. Mar. Ecol. Prog. Ser. 53: 79-9 1.
- - AND H. M. FEDER. 1988. Pelagic- benthic coupling on the shelf of the northern Be- ring and Chukchi Seas. 1. Food supply source and benthic biomass. Mar. Ecol. Prog. Ser. 48: 57-67.
HAGE, K. D., J. GRAY, AND J. C. LINTON. 1975. Iso- topes in precipitation in northwestern North America. Mon. Weather Rev. 103: 958-966.
2 Present address: Department of Geological Sci- ences, University of Tennessee, Knoxville 37996- 1 410.
Notes 1195
KILLINGLEY, J. S., AND W. A. NEWMAN. 1983. O-18 fractionation in barnacle calcite. A barnacle pa- leotemperature equation. J. Mar. Res. 40: 893- 902.
MCCREA, J. M. 1950. On the isotopic chemistry of carbonates and paleotemperature scale. 9. Chem. Phys. 18: 849-857.
MIKKELSEN,N., L. LABEYRIE, JR., AND W.H. BERGER. 1978. Silica oxygen isotopes in diatoms: A 20,000 yr record in deep-sea sediments. Nature 271: 536- 538.
MOORE, T. C., JR., AND OTHERS. 1980. The recon- struction of sea surface temperatures in the Pacific Ocean of 18,000 B.P. Mar. Micropaleontol. 5: 2 15- 247.
REDFIELD, A.C., ANDLFRIEDMAN. 1969. Theeffect of meteoric water, melt water and brine on the composition of polar sea water and of the deep waters of the ocean. Deep-Sea Res. 16: 197-214.
SCHUMACHER, J. D., K. AAGAARD, C. H. PEASE, AND R. B. TRIPP. 1983. Effects of a shelf polynya on flow and water properties in the northern Bering Sea. J. Geophys. Res. 88: 2723-2732.
STERNBERG, L. D. S. L. O., AND M. J. D. DENIRO. 1983. Biogeochemical implications of the isotopic equi- librium fractionation factor between the oxygen
atoms of acetone and water. Geochim. Cosmo- chim. Acta 47: 227 l-2274.
TAN, F. C., AND P. M. STRAIN. 1980. The distribution of sea-ice melt-water in the eastern Canadian arc- tic. J. Geophys. Res. 85: 1925-1932.
USHAKOV, P. V. 1955. Subphylum Tunicata, class Ascidiae, p. 307-3 12. Zn E. N. Pavlov&ii [ed.], Atlas of the invertebrates of the far eastern seas of the USSR. Akad. Nauk SSSR. Zool. Inst. [Isr. Program Sci. Transl., 1966.1
VETSHTEYN, V.Y.,G.A. MALYUK,AND V.P. RUSANOV. 1974. Oxygen- 18 distribution in the central arctic basin. Oceanology 14: 5 14-5 19.
WALSH, J. J., AND OTHERS. 1989. Carbon and nitrogen cycling within the Bering/Chukchi Seas: Source regions for organic matter effecting AOU demands of the Arctic Ocean. Prog. Oceanogr. 22: 279-36 1.
WHITE, M. G. 1977. Ecological adaptions by Ant- arctic poikilotherms to the polar marine environ- ment, p. 197-208. Zn G. A. Llano [ed.], Adaptions within Antarctic ecosystems. Gulf Publ.
WISE, L. E. 1944. Wood chemistry. Reinhold.
Submitted: 12 April I989 Accepted: 4 December 1989
Revised: 17 April 1990
Lmnol. Oceanogr., 3549, 1990, 1195-1200 0 1990, by the American Society of Limnology and Oceanography, Inc.
Predicting diel vertical migration of zooplankton
Abstract-Amplitude of diel vertical migration is predicted by water clarity measured by Secchi depth. The model assumes that vertical migra- tion serves to minimize mortality from visually feeding fish and to maximize grazing rate within this predation context. Three of the 24 obser- vations of diel vertical migration are outliers which are either ultraoligotrophic, or have minimal populations of plankton-eating fish, or both. The other 2 1 observations in lakes with average pho- tosynthetic rates 2300 mg C m-2 d-’ and more than -2 g m-2 of plankton-eating fish showed diel vertical migration proportional to Secchi depth, with a correlation coefficient of about
Acknowledgments I thank Virginia Dodson, Ken Parejko, Charles
Ramcharan, Bart DeStasio, and Peter Jumars for com- ments on the manuscript. Thanks to Charles Ram- charan (Licht Pond), Trevor Downie (Muskellunge Lake), and the 1987 University of Wisconsin summer limnology class (Lake Mendota), who helped sample these lakes. I especially thank Steve Carpenter who allowed me to use unpublished data from Long Lake, Michigan, Ami Litt who went out and sampled Lake Washington when I asked if there were any data, and Jane and Wes Licht, who allowed me to sample their pond in Wisconsin.
0.880. The residual ofthe migration-water clarity relationship is significantly and inversely corre- lated with percent illumination of the moon. Wa- ter clarity and moon intensity together account for 84% of the variation in migration amplitude for the 21 observations.
The usual behavior pattern of diel vertical migration is for a population of zooplank- ton to spend the daylight hours deep in a lake and then to rise toward the surface for a few hours at night. This behavior has been studied for nearly two centuries (Lampert 1989). Several recent reviews identify a few factors as important causes of the behavior in both marine and freshwater habitats: in- tensity of visual predation on zooplankton, light intensity, temperature, and food levels (e.g. Clark and Levy 1988; Gabriel and Thomas 1988; Lampert 1989; Wurtsbaugh and Neverman 19 8 8). Although differing in details, a common theme runs through these studies. Diel vertical migration is thought of as being primarily determined by a com-