Embed Size (px)
Citation preview

Greater temperature sensitivity of plant phenology atcolder sites: implications for convergence across northernlatitudesJ ANET PREV �EY 1 , 2 , MARK VELLEND3 , NAD JA R €UGER 4 , 5 , ROBERT D . HOLL I STER 6 , ANNE
D . B JORKMAN4 , 7 , I S LA H . MYERS - SM ITH 7 , SARAH C . ELMENDORF 8 , KAR IN CLARK 9 ,
EL I SABETH J . COOPER 1 0 , BO ELBERL ING 1 1 , ANNA M . FOSAA 1 2 , GREGORY H . R .
HENRY 1 3 , TOKE T . HØYE 1 4 , ING IB J €ORG S . J �ONSD �OTT IR 1 5 , 1 6 , KAR I KLANDERUD1 7 ,
E STHER L �EVESQUE 1 8 , MARGUER I TE MAUR ITZ 1 9 , ULF MOLAU2 0 , SUSAN M . NATAL I 2 1 ,
S TEVEN F . OBERBAUER 2 2 , ZOE A . PANCHEN 2 3 , ER IC POST 2 4 , SAB INE B . RUMPF 2 5 , N I ELS
M . SCHMIDT 1 4 , EDWARD A . G . SCHUUR 1 9 , PH I LL I P R . S EMENCHUK 1 0 , T I F FANY
TROXLER 2 1 , J E F FREY M . WELKER 2 6 and CHRISTIAN RIXEN1
1WSL Institute for Snow and Avalanche Research SLF, 7260 Davos, Switzerland, 2USDA-Forest Service, Pacific Northwest
Research Station, Olympia, WA 98512, USA, 3D�epartement de Biologie, Universit�e de Sherbrooke, Sherbrooke, QC J1K 2R1,
Canada, 4German Centre for Integrative Biodiversity Research (iDiv), 04103 Leipzig, Germany, 5Smithsonian Tropical Research
Institute, Balboa Anc�on, Panama, Republic of Panama, 6Biology Department, Grand Valley State University, Allendale, MI 49041,
USA, 7School of Geosciences, University of Edinburgh, Edinburgh, UK, 8National Ecological Observatory Network, Boulder, CO,
USA, 9Environment and Natural Resources, Government of the Northwest Territories, NT X1A 3S8, Canada, 10Institute for
Arctic and Marine Biology, UiT-The Arctic University of Norway, 9037 Tromsø, Norway, 11Center for Permafrost (CENPERM),
Department of Geosciences and Natural Resource Management, University of Copenhagen, DK-1350 Copenhagen, Denmark,12Faroese Museum of Natural History, Hoyv�ık 188, Faroe Islands, 13Department of Geography and Biodiversity Research Institute,
University of British Columbia, Vancouver, BC V6T 1Z4, Canada, 14Arctic Research Center, Department of Bioscience, Aarhus
University, DK-8000 Aarhus, Denmark, 15The University Centre in Svalbard, N-9171 Longyearbyen, Norway, 16Faculty of Life
and Environmental Sciences, University of Iceland, 101 Reykjav�ık, Iceland, 17Department of Ecology and Natural Resources,
Norwegian University of Life Sciences, NO-1432,�As, Norway, 18Universit�e du Qu�ebec �a Trois-Rivi�eres, Trois-Rivi�eres, QC G9A
5H7, Canada, 19Center for Ecosystem Science and Society Center, Northern Arizona University, Flagstaff, AZ 86011, USA,20Department of Biology and Environmental Sciences, University of Gothenburg, S-405 30 Gothenburg, Sweden, 21Woods Hole
Research Center, Falmouth, MA 02540, USA, 22Department of Biological Sciences, Florida International University, Miami, FL
33181, USA, 23Department of Biology, Carleton University, Ottawa, ON K1S 5B6, Canada, 24Department ofWildlife, Fish, &
Conservation Biology, University of California, Davis, CA 95616, USA, 25Department of Botany and Biodiversity Research, University
of Vienna, A-1030 Vienna, Austria, 26Department of Biological Sciences, University of Alaska, Anchorage, AK 99508, USA
Abstract
Warmer temperatures are accelerating the phenology of organisms around the world. Temperature sensitivity of
phenology might be greater in colder, higher latitude sites than in warmer regions, in part because small changes in
temperature constitute greater relative changes in thermal balance at colder sites. To test this hypothesis, we exam-
ined up to 20 years of phenology data for 47 tundra plant species at 18 high-latitude sites along a climatic gradient.
Across all species, the timing of leaf emergence and flowering was more sensitive to a given increase in summer
temperature at colder than warmer high-latitude locations. A similar pattern was seen over time for the flowering
phenology of a widespread species, Cassiope tetragona. These are among the first results highlighting differential
phenological responses of plants across a climatic gradient and suggest the possibility of convergence in flowering
times and therefore an increase in gene flow across latitudes as the climate warms.
Keywords: Arctic, Cassiope tetragona, climate change, climatic gradient, flowering, International Tundra Experiment, latitude,
tundra
Received 1 September 2016; revised version received 30 November 2016 and accepted 3 December 2016
Introduction
Changes in plant phenology are among the most nota-
ble and widespread examples of climate changeCorrespondence: Janet Prev�ey, tel. +1 360 701 6466,
fax +1 360 753 7737, e-mail: [email protected]
1© 2017 John Wiley & Sons Ltd
Global Change Biology (2017), doi: 10.1111/gcb.13619

impacts across all biomes (Walther et al., 2002; Parme-
san & Yohe, 2003; Badeck et al., 2004; Post, 2013; IPCC,
2014; Thackeray et al., 2016). High-latitude regions are
excellent places to study phenological responses to cli-
mate change, as northern regions are experiencing
more rapid warming than lower latitudes (IPCC, 2014;
Anderegg & Diffenbaugh, 2015), and phenological
changes may be more pronounced than those else-
where on Earth (Høye et al., 2007a; Parmesan, 2007;
Oberbauer et al., 2013). Northern ecosystems are char-
acterized by shorter growing seasons than temperate or
tropical ecosystems, and plants in such environments
are under selective pressure to initiate growth when
temperatures become favorable during spring (Shaver
& Kummerow, 1992) and thus can be particularly sensi-
tive to small changes in temperatures during the grow-
ing season (Bliss, 1962; Billings & Mooney, 1968;
Welker et al., 1997).
Ecologically important traits, including the timing
of phenological events, can vary within species
across environmental and temperature gradients
(Weber & Schmid, 1998; Riihim€aki & Savolainen,
2004; Kenta et al., 2011). In the Arctic, small absolute
changes in temperature may represent relatively lar-
ger increases in the thermal budgets of plants at
cold sites (Bliss, 1962; Billings, 1992; Oberbauer et al.,
2013); hence, one might expect plants at colder,
higher latitude sites to respond more strongly to the
same degree of warming than those from warmer,
lower latitude sites. Plants growing in high Arctic
locations with very short growing seasons could be
under strong selective pressure to initiate growth
and flowering as soon as temperatures are favorable.
Differential sensitivity to temperature at sites with
different climatic conditions could, in turn, result in
a convergence of flowering times across sites as the
climate warms. Many tundra plant species extend
over large geographical and elevational ranges, with
populations of the same species adapted to local
environmental conditions (Chapin & Chapin, 1981;
McGraw & Antonovics, 1983; Welker et al., 1997;
Bennington et al., 2012). Populations of a species
occurring in colder sites have been found to flower
later than those of the same species in warmer sites
(L�evesque et al., 1997; Riihim€aki & Savolainen, 2004;
Kenta et al., 2011). Consequently, if warmer tempera-
tures lead to a greater advancement of flowering at
colder sites than at warmer sites, overlap in flower-
ing times across sites will likely increase. This, in
turn, could lead to increased gene flow among pop-
ulations, with potentially important consequences for
adaptive evolution and the ability of plant species
to persist under climate change (Fox, 2003; Philli-
more et al., 2010; Sexton et al., 2011). However, few
studies have compared phenological sensitivities
between sites, so we have been unable to predict
whether reproductive phenology will converge,
diverge, or show no change as the climate warms in
high-latitude regions.
Climate change influences the phenology not only
of flowering, but also of leaf emergence and senes-
cence, and therefore ecosystem processes such as
carbon dynamics (Oberbauer et al., 1998, 2007; Welker
et al., 2004; Pe~nuelas et al., 2009; Cahoon et al., 2012).
Current process-based vegetation models – which are
linked to global carbon models – assume similar tem-
perature sensitivities of plant species responses across
the Arctic (e.g., Miller & Smith, 2012). However, if
growth initiation of plants from colder regions
responds more quickly to warmer temperatures than
plants from warmer regions, then the net balance of
carbon exchange from Arctic ecosystems might
change considerably (Oechel et al., 2000; Welker et al.,
2004; Cahoon et al., 2012; Sharp et al., 2013; Myers-
Smith et al., 2015). Studies examining differences in
the phenological sensitivity of growth to temperature
across species0 ranges can thus help improve predic-
tions of the cumulative responses of high-latitude
ecosystems, and associated ecosystem services, to
climate change.
In this study, we investigate the variation in phe-
nological responses to warmer temperatures among
sites along a climatic gradient in high northern lati-
tudes. This is one of the first studies to examine
whether the temperature sensitivity of phenology dif-
fers among sites with different climatic conditions
within the tundra biome. We use the largest collec-
tion of plot-based high-latitude plant phenological
data to date, consisting of more than 23 000 pheno-
logical observations, to test the hypothesis that plants
from colder northern sites will have greater tempera-
ture sensitivity of leaf and flowering phenology than
plants from warmer northern sites. To specifically
investigate whether warmer temperatures could lead
to converging flowering times within the distribu-
tional range of a given species, we also examined
how the flowering dates of the single most common
species in the dataset, Cassiope tetragona, have
responded to temperature, and have changed over
time, in colder vs. warmer sites. Finally, we exam-
ined whether sites with colder mean temperatures
and at higher latitudes have experienced greater
changes in spring and summer temperatures over the
last 50 years than warmer or lower latitude sites. The
combination of greater temperature sensitivity of
phenology and greater temperature increases could
act synergistically to magnify phenological conver-
gence across latitudes as the climate warms.
© 2017 John Wiley & Sons Ltd, Global Change Biology, doi: 10.1111/gcb.13619
2 J . PREV �EY et al.
Materials and methods
Site and phenological data description
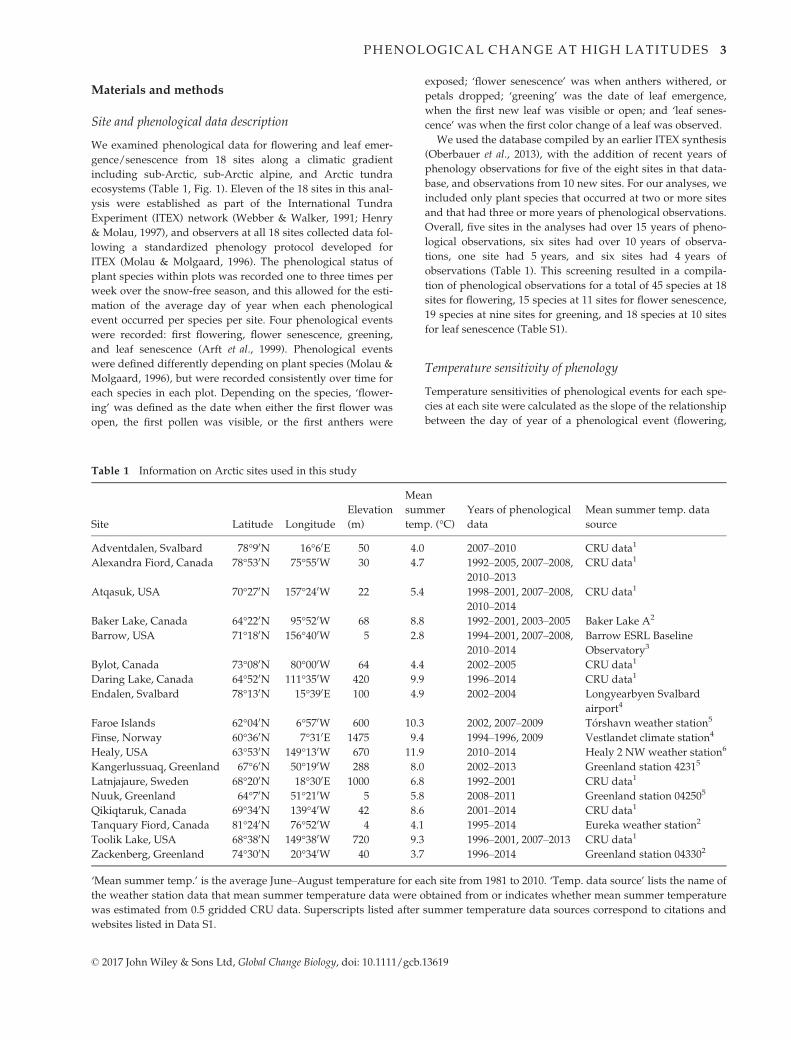
We examined phenological data for flowering and leaf emer-
gence/senescence from 18 sites along a climatic gradient
including sub-Arctic, sub-Arctic alpine, and Arctic tundra
ecosystems (Table 1, Fig. 1). Eleven of the 18 sites in this anal-
ysis were established as part of the International Tundra
Experiment (ITEX) network (Webber & Walker, 1991; Henry
& Molau, 1997), and observers at all 18 sites collected data fol-
lowing a standardized phenology protocol developed for
ITEX (Molau & Molgaard, 1996). The phenological status of
plant species within plots was recorded one to three times per
week over the snow-free season, and this allowed for the esti-
mation of the average day of year when each phenological
event occurred per species per site. Four phenological events
were recorded: first flowering, flower senescence, greening,
and leaf senescence (Arft et al., 1999). Phenological events
were defined differently depending on plant species (Molau &
Molgaard, 1996), but were recorded consistently over time for
each species in each plot. Depending on the species, ‘flower-
ing’ was defined as the date when either the first flower was
open, the first pollen was visible, or the first anthers were
exposed; ‘flower senescence’ was when anthers withered, or
petals dropped; ‘greening’ was the date of leaf emergence,
when the first new leaf was visible or open; and ‘leaf senes-
cence’ was when the first color change of a leaf was observed.
We used the database compiled by an earlier ITEX synthesis
(Oberbauer et al., 2013), with the addition of recent years of
phenology observations for five of the eight sites in that data-
base, and observations from 10 new sites. For our analyses, we
included only plant species that occurred at two or more sites
and that had three or more years of phenological observations.
Overall, five sites in the analyses had over 15 years of pheno-
logical observations, six sites had over 10 years of observa-
tions, one site had 5 years, and six sites had 4 years of
observations (Table 1). This screening resulted in a compila-
tion of phenological observations for a total of 45 species at 18
sites for flowering, 15 species at 11 sites for flower senescence,
19 species at nine sites for greening, and 18 species at 10 sites
for leaf senescence (Table S1).
Temperature sensitivity of phenology
Temperature sensitivities of phenological events for each spe-
cies at each site were calculated as the slope of the relationship
between the day of year of a phenological event (flowering,
Table 1 Information on Arctic sites used in this study
Site Latitude Longitude
Elevation
(m)
Mean
summer
temp. (°C)Years of phenological
data
Mean summer temp. data
source
Adventdalen, Svalbard 78°90N 16°60E 50 4.0 2007–2010 CRU data1
Alexandra Fiord, Canada 78°530N 75°550W 30 4.7 1992–2005, 2007–2008,2010–2013
CRU data1
Atqasuk, USA 70°270N 157°240W 22 5.4 1998–2001, 2007–2008,2010–2014
CRU data1
Baker Lake, Canada 64°220N 95°520W 68 8.8 1992–2001, 2003–2005 Baker Lake A2
Barrow, USA 71°180N 156°400W 5 2.8 1994–2001, 2007–2008,2010–2014
Barrow ESRL Baseline
Observatory3
Bylot, Canada 73°080N 80°000W 64 4.4 2002–2005 CRU data1
Daring Lake, Canada 64°520N 111°350W 420 9.9 1996–2014 CRU data1
Endalen, Svalbard 78°130N 15°390E 100 4.9 2002–2004 Longyearbyen Svalbard
airport4
Faroe Islands 62°040N 6°570W 600 10.3 2002, 2007–2009 T�orshavn weather station5
Finse, Norway 60°360N 7°310E 1475 9.4 1994–1996, 2009 Vestlandet climate station4
Healy, USA 63°530N 149°130W 670 11.9 2010–2014 Healy 2 NW weather station6
Kangerlussuaq, Greenland 67°60N 50°190W 288 8.0 2002–2013 Greenland station 42315
Latnjajaure, Sweden 68°200N 18°300E 1000 6.8 1992–2001 CRU data1
Nuuk, Greenland 64°70N 51°210W 5 5.8 2008–2011 Greenland station 042505
Qikiqtaruk, Canada 69°340N 139°40W 42 8.6 2001–2014 CRU data1
Tanquary Fiord, Canada 81°240N 76°520W 4 4.1 1995–2014 Eureka weather station2
Toolik Lake, USA 68°380N 149°380W 720 9.3 1996–2001, 2007–2013 CRU data1
Zackenberg, Greenland 74°300N 20°340W 40 3.7 1996–2014 Greenland station 043302
‘Mean summer temp.’ is the average June–August temperature for each site from 1981 to 2010. ‘Temp. data source’ lists the name of
the weather station data that mean summer temperature data were obtained from or indicates whether mean summer temperature
was estimated from 0.5 gridded CRU data. Superscripts listed after summer temperature data sources correspond to citations and
websites listed in Data S1.
© 2017 John Wiley & Sons Ltd, Global Change Biology, doi: 10.1111/gcb.13619
PHENOLOGICAL CHANGE AT HIGH LATITUDES 3
flower senescence, greening, or leaf senescence) and average
temperature in that year over a summer time-window (model
structure described below). The summer time-window was
defined as either average May–June, June, June–July, or June–
August mean monthly temperatures per year. We specified
the summer time-window separately for each species and phe-
nological event on the basis of the average time of that pheno-
logical event over the period observed across all sites
(Table S1). Species at different sites initiated phenological
events at different times; however, we use a common summer
temperature window for each species and event across all sites
to ensure that the units of the sensitivity estimates were identi-
cal for each species across sites. All monthly temperature data
used to calculate sensitivities were obtained from local site cli-
mate records (Data S1). We used average monthly tempera-
tures because they were the only climate variable available
from local weather stations for all sites included in our analy-
ses. While we recognize that cumulative daily temperatures
and the timing of snow melt have a strong influence on tundra
plant phenology (Høye et al., 2007b; Semenchuk et al., 2013;
Bjorkman et al., 2015), those data were not available for many
of the sites. To address potential biases resulting from species
reaching phenological stages at different times at different
sites, we also analyzed data using separate summer time-win-
dows based on the average time of a phenological event for
each species at each site. We additionally analyzed data using
only June temperature for all species, phenological events,
and sites, because June temperature was the strongest predic-
tor of the timing of all phenological events across the dataset
(Table S2).
Chilling temperatures over winter (Cook et al., 2012; Clark
et al., 2014), extreme events (Phoenix & Bjerke, 2016), and lag
effects from temperatures experienced the previous year
(Mulder et al., 2016) can also influence the timing of phenol-
ogy of plants. However, in this dataset, we found no relation-
ships between winter temperatures or monthly temperatures
of the previous year and the timing of phenological events
(data not shown).
To statistically test whether species at colder sites shifted
phenological dates more strongly in response to the same
degree of warming than those from warmer sites, we then
modeled the response of temperature sensitivities (described
above) to the mean summer (June–August) temperature of
sites from 1981 to 2010 using a Bayesian hierarchical modeling
approach (described below). We used a two-level model in
which species-level phenological sensitivities to temperature
and the associated uncertainties were used to estimate site-
level phenological responses and their relationship with mean
summer temperature across sites. We chose mean summer
temperature over the last 30 years as the main predictor vari-
able at the site level because summer temperatures are
strongly associated with growth and phenology of many
tundra species (Th�orhallsd�ottir, 1998; Elmendorf et al., 2012a;
Oberbauer et al., 2013; Myers-Smith et al., 2015). Average
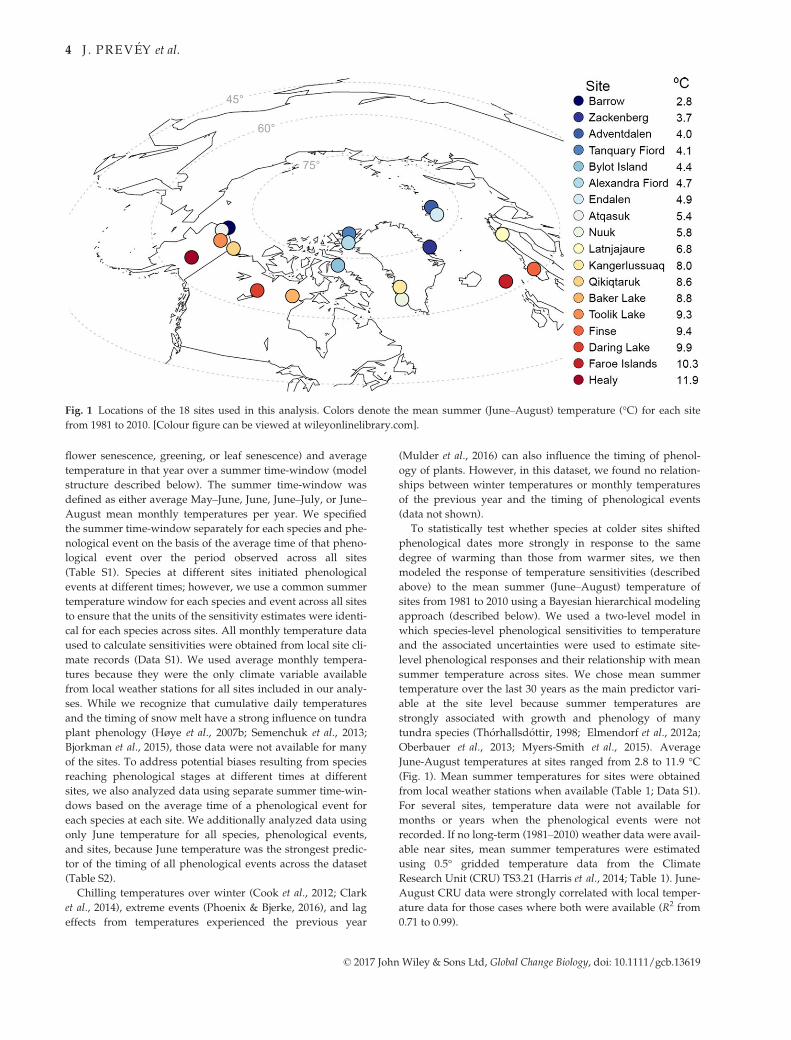
June-August temperatures at sites ranged from 2.8 to 11.9 °C(Fig. 1). Mean summer temperatures for sites were obtained
from local weather stations when available (Table 1; Data S1).
For several sites, temperature data were not available for
months or years when the phenological events were not
recorded. If no long-term (1981–2010) weather data were avail-
able near sites, mean summer temperatures were estimated
using 0.5° gridded temperature data from the Climate
Research Unit (CRU) TS3.21 (Harris et al., 2014; Table 1). June-
August CRU data were strongly correlated with local temper-
ature data for those cases where both were available (R2 from
0.71 to 0.99).
Fig. 1 Locations of the 18 sites used in this analysis. Colors denote the mean summer (June–August) temperature (°C) for each site
from 1981 to 2010. [Colour figure can be viewed at wileyonlinelibrary.com].
© 2017 John Wiley & Sons Ltd, Global Change Biology, doi: 10.1111/gcb.13619
4 J . PREV �EY et al.
Phenology model description
We assumed that the phenology of a species could vary
among different plots within a site due to effects of local
topography on microclimate (plot-by-species-combinations
are indexed by the letter i), but that the phenological response
of a species to temperature would not differ among plots
within a site (site-by-species-combinations are indexed by the
letter j). We modeled the date of the phenological event (DOY)
as a function of temperature over the summer time-window
per site (s) in a given year (y) (tempy,s), with ai being the plot-
by-species-level intercept, bj the site-by-species-level slope,
and rj the variation in observed dates (DOYi,y) around the pre-
diction at the site-by-species level
DOYi;y �Normalðai þ bj � tempy;s; rjÞ:
Site-by-species-level slopes (bj), or the temperature sensitivi-
ties of phenology per species, were assumed to be normally
distributed around the average community response of phe-
nology to temperature at that site (bs)
bj �Normalðbs; rsÞ;
which was fitted as a function of average summer temperature
(avsummertemps):
bs �Normalðc0 þ c1 � avsummertemps; rbÞ:
If there was only one species at a site, the site-level slope
was estimated directly:
DOYi;y �Normalðai þ bs � tempy;s; rjÞ:
Slopes of the same species at different sites were assumed
to be independent of each other. We tested the normality of
the data by running a model where species-by-site slopes were
fit independently from each other and by visually assessing
the distribution for each site. Our results demonstrated that
the assumption of a normal distribution was not violated at
any site and that a normal distribution is a good description of
site-level variation in species’ temperature sensitivity. Addi-
tionally, we do not investigate how phenology varies directly
with summer temperature between sites; but rather, we inves-
tigate how the temperature sensitivity of phenology (i.e., the
change in phenology per °C) varies among sites with different
mean summer temperatures, so we have not within-subject
mean-centered the site-level temperature data as recom-
mended in other similar hierarchical modeling approaches
where site is included as a random effect (Van de Pol &
Wright, 2009; Phillimore et al., 2013).
For this model, we did not include both plot and year ran-
dom effects (to account for the nonindependence of plots mea-
sured repeatedly over time as well as the nonindependence of
observations conducted in the same year at a given site)
because some sites had very few yearly observations, and
including both plot and year random effects resulted in a
model that did not converge. We thus included only the plot
effect in the model presented here, and ran a separate version
of the analysis including a year random effect (but no plot
random effect), which demonstrated the same overall relation-
ship (Data S2.1). Finally, we also analyzed data using simple
linear regressions and a mixed-model framework using the
R package lme4 (Bates et al., 2015), which gave similar results
(Data S2.2). To investigate whether the variation in the num-
ber of years that sites were sampled influenced our results, we
also performed two separate analyses for the flowering data,
one limited to sites with 10 or more years of data and the other
limited to sites with less than 10 years of data. Both analyses
gave similar results to the analysis that included all sites
(Table S2.3).
Bayesian hierarchical modeling allowed us to incorporate
the uncertainties of species- and site-level phenological
responses in the final correlation of site climate and site-level
phenological responses (Data S3, Latimer, 2007). We fit
Bayesian models using the program STAN, accessed using the
package Rstan (Stan Development Team, 2015). We used flat
priors for all parameter estimates. Each model was run with
two chains of 20 000 iterations, using Hamiltonian Monte
Carlo (HMC) sampling. We checked for convergence of chains
for all parameters both visually with trace plots and with the
Gelman–Rubin convergence statistic (Gelman & Rubin, 1992).
Trace plots showed that chains mixed well and converged to
stationary distributions for all parameters estimates. Gelman–
Rubin convergence statistics for parameter estimates of all
models were <1.02.
Flowering of Cassiope tetragona
We additionally tested whether the flowering times of the sin-
gle most common species in the dataset, the evergreen dwarf
shrub C. tetragona, showed greater temperature sensitivity in
colder vs. warmer locations. We had flowering observations of
C. tetragona at eight sites, with four or more years of observa-
tions per site, so we were able to perform a robust intraspecific
analysis using this species. The relatively long time series of
C. tetragona observations at sites (4–19 years) also allowed us
to test whether the flowering dates of C. tetragona have
advanced more at colder sites than at warmer sites over time.
For these analyses, we calculated the temperature sensitivities
of flowering of C. tetragona to yearly June temperatures, and
the change in the day of year of flowering of C. tetragona
per year at each site. We then compared these temperature
sensitivities and temporal changes to the mean summer
(June–August) temperature of sites from 1981 to 2010 using
the Bayesian modeling framework described above. Stan
model specifications for the phenological models used for all
species and C. tetragona are presented in Data S3.
Temperature change over time
To test whether colder or higher latitude sites have experi-
enced greater changes in spring and summer temperatures
over the last 50 years than warmer or lower latitude sites, we
analyzed the temperature data for the 18 sites included in
these analyses. To identify longer term trends in temperature
change, we used CRU 0.5° gridded temperature data (Harris
et al., 2014) to examine temperature change over a longer
© 2017 John Wiley & Sons Ltd, Global Change Biology, doi: 10.1111/gcb.13619
PHENOLOGICAL CHANGE AT HIGH LATITUDES 5
period (1960–2013) than the period we used to estimate mean
summer temperature at each site (1981–2010). To determine
how spring and summer temperatures have changed at north-
ern sites over time, we regressed CRU temperature data for
each site against year to calculate the change in May, June,
July, and August temperatures from 1960 to 2013. Then, to
examine whether colder sites at higher latitudes had experi-
enced more warming over time than lower, warmer sites, we
compared the temperature changes to both the mean summer
temperature of sites from 1981 to 2010, and also to site latitude
using simple linear regressions. All statistical analyses were
conducted in the statistical program R 3.2.2 (R Core Team,
2015).
Results
Temperature sensitivity of phenology
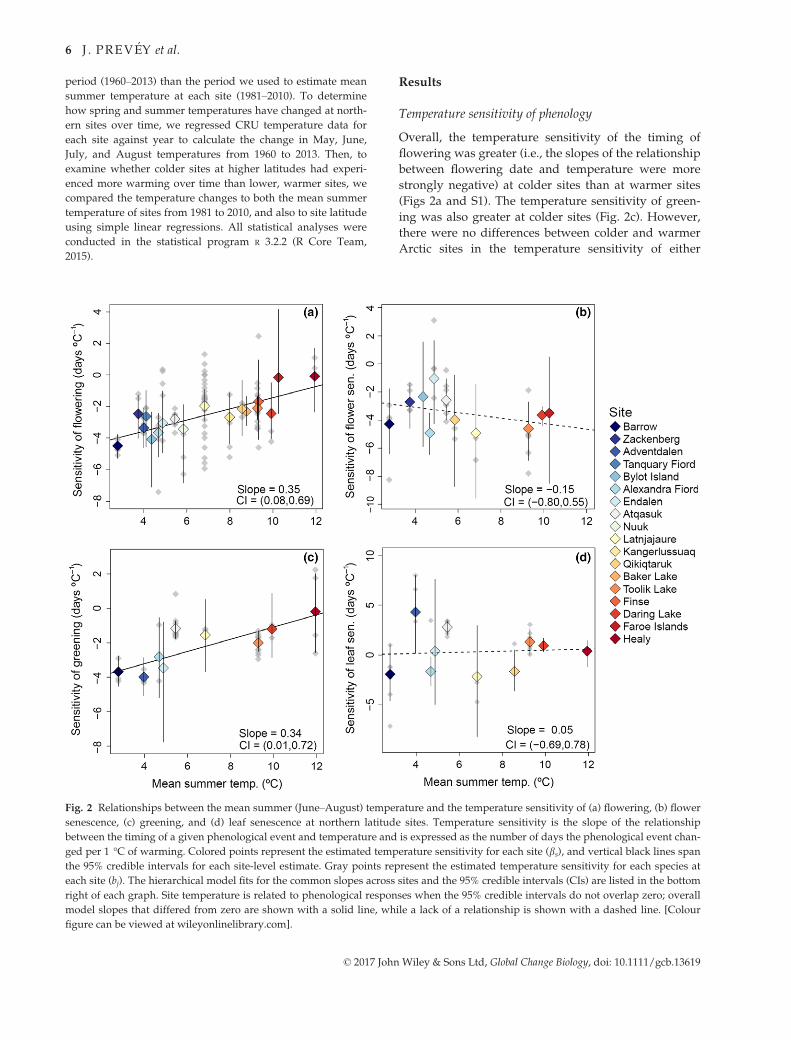
Overall, the temperature sensitivity of the timing of
flowering was greater (i.e., the slopes of the relationship
between flowering date and temperature were more
strongly negative) at colder sites than at warmer sites
(Figs 2a and S1). The temperature sensitivity of green-
ing was also greater at colder sites (Fig. 2c). However,
there were no differences between colder and warmer
Arctic sites in the temperature sensitivity of either
Fig. 2 Relationships between the mean summer (June–August) temperature and the temperature sensitivity of (a) flowering, (b) flower
senescence, (c) greening, and (d) leaf senescence at northern latitude sites. Temperature sensitivity is the slope of the relationship
between the timing of a given phenological event and temperature and is expressed as the number of days the phenological event chan-
ged per 1 °C of warming. Colored points represent the estimated temperature sensitivity for each site (bs), and vertical black lines span
the 95% credible intervals for each site-level estimate. Gray points represent the estimated temperature sensitivity for each species at
each site (bj). The hierarchical model fits for the common slopes across sites and the 95% credible intervals (CIs) are listed in the bottom
right of each graph. Site temperature is related to phenological responses when the 95% credible intervals do not overlap zero; overall
model slopes that differed from zero are shown with a solid line, while a lack of a relationship is shown with a dashed line. [Colour
figure can be viewed at wileyonlinelibrary.com].
© 2017 John Wiley & Sons Ltd, Global Change Biology, doi: 10.1111/gcb.13619
6 J . PREV �EY et al.
flower or leaf senescence dates (Fig. 2b, d). Alternative
analyses that calculated slopes for phenological sensi-
tivities using either different summer temperature
time-windows for each species and site or using June
temperature for all species and sites gave similar results
to those presented in the main text (Table S2).
Flowering of Cassiope tetragona
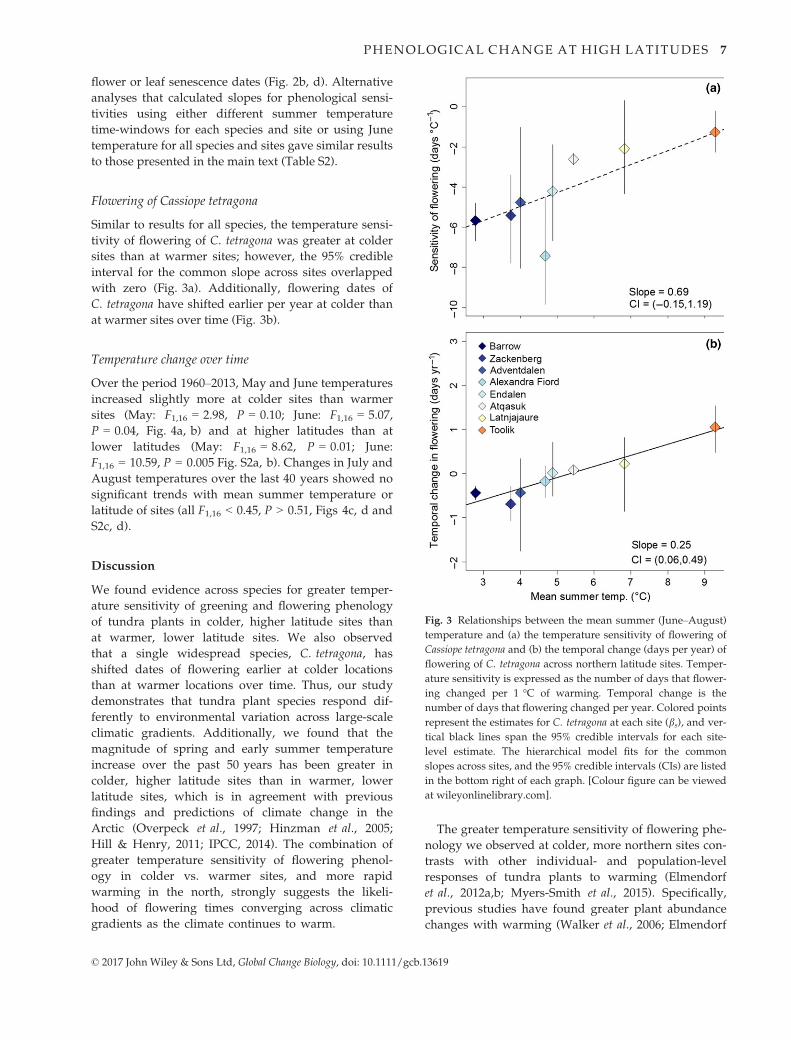
Similar to results for all species, the temperature sensi-
tivity of flowering of C. tetragona was greater at colder
sites than at warmer sites; however, the 95% credible
interval for the common slope across sites overlapped
with zero (Fig. 3a). Additionally, flowering dates of
C. tetragona have shifted earlier per year at colder than
at warmer sites over time (Fig. 3b).
Temperature change over time
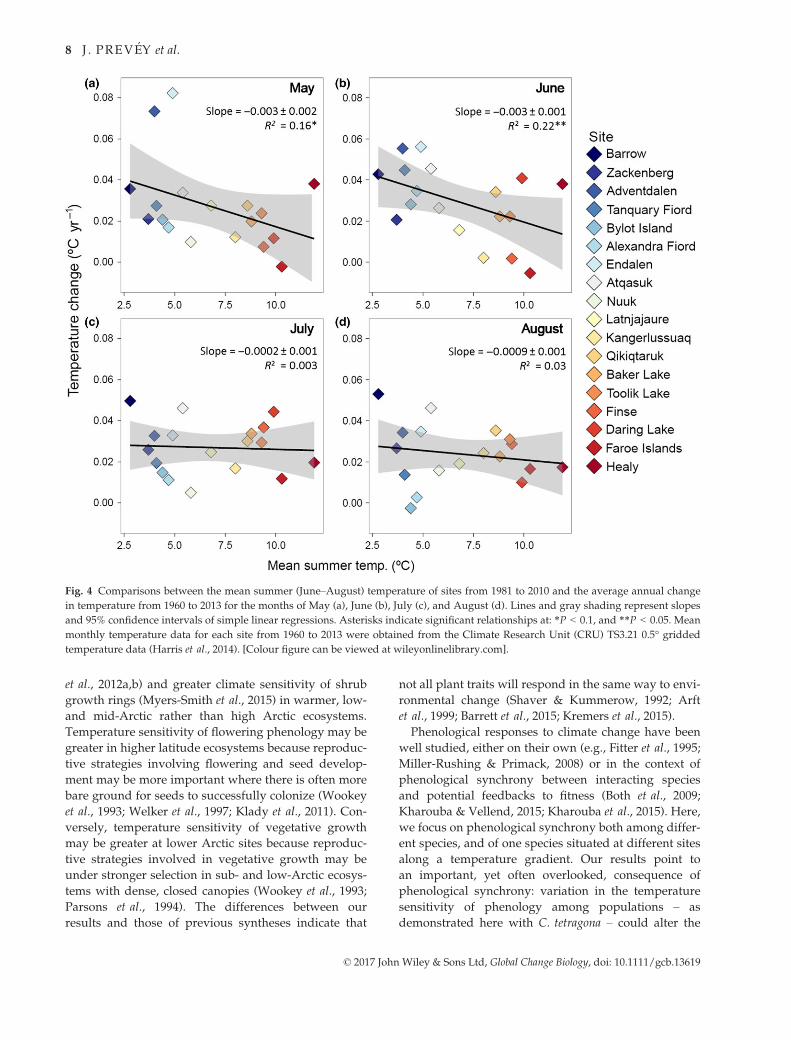
Over the period 1960–2013, May and June temperatures
increased slightly more at colder sites than warmer
sites (May: F1,16 = 2.98, P = 0.10; June: F1,16 = 5.07,
P = 0.04, Fig. 4a, b) and at higher latitudes than at
lower latitudes (May: F1,16 = 8.62, P = 0.01; June:
F1,16 = 10.59, P = 0.005 Fig. S2a, b). Changes in July and
August temperatures over the last 40 years showed no
significant trends with mean summer temperature or
latitude of sites (all F1,16 < 0.45, P > 0.51, Figs 4c, d and
S2c, d).
Discussion
We found evidence across species for greater temper-
ature sensitivity of greening and flowering phenology
of tundra plants in colder, higher latitude sites than
at warmer, lower latitude sites. We also observed
that a single widespread species, C. tetragona, has
shifted dates of flowering earlier at colder locations
than at warmer locations over time. Thus, our study
demonstrates that tundra plant species respond dif-
ferently to environmental variation across large-scale
climatic gradients. Additionally, we found that the
magnitude of spring and early summer temperature
increase over the past 50 years has been greater in
colder, higher latitude sites than in warmer, lower
latitude sites, which is in agreement with previous
findings and predictions of climate change in the
Arctic (Overpeck et al., 1997; Hinzman et al., 2005;
Hill & Henry, 2011; IPCC, 2014). The combination of
greater temperature sensitivity of flowering phenol-
ogy in colder vs. warmer sites, and more rapid
warming in the north, strongly suggests the likeli-
hood of flowering times converging across climatic
gradients as the climate continues to warm.
The greater temperature sensitivity of flowering phe-
nology we observed at colder, more northern sites con-
trasts with other individual- and population-level
responses of tundra plants to warming (Elmendorf
et al., 2012a,b; Myers-Smith et al., 2015). Specifically,
previous studies have found greater plant abundance
changes with warming (Walker et al., 2006; Elmendorf
Fig. 3 Relationships between the mean summer (June–August)
temperature and (a) the temperature sensitivity of flowering of
Cassiope tetragona and (b) the temporal change (days per year) of
flowering of C. tetragona across northern latitude sites. Temper-
ature sensitivity is expressed as the number of days that flower-
ing changed per 1 °C of warming. Temporal change is the
number of days that flowering changed per year. Colored points
represent the estimates for C. tetragona at each site (bs), and ver-
tical black lines span the 95% credible intervals for each site-
level estimate. The hierarchical model fits for the common
slopes across sites, and the 95% credible intervals (CIs) are listed
in the bottom right of each graph. [Colour figure can be viewed
at wileyonlinelibrary.com].
© 2017 John Wiley & Sons Ltd, Global Change Biology, doi: 10.1111/gcb.13619
PHENOLOGICAL CHANGE AT HIGH LATITUDES 7
et al., 2012a,b) and greater climate sensitivity of shrub
growth rings (Myers-Smith et al., 2015) in warmer, low-
and mid-Arctic rather than high Arctic ecosystems.
Temperature sensitivity of flowering phenology may be
greater in higher latitude ecosystems because reproduc-
tive strategies involving flowering and seed develop-
ment may be more important where there is often more
bare ground for seeds to successfully colonize (Wookey
et al., 1993; Welker et al., 1997; Klady et al., 2011). Con-
versely, temperature sensitivity of vegetative growth
may be greater at lower Arctic sites because reproduc-
tive strategies involved in vegetative growth may be
under stronger selection in sub- and low-Arctic ecosys-
tems with dense, closed canopies (Wookey et al., 1993;
Parsons et al., 1994). The differences between our
results and those of previous syntheses indicate that
not all plant traits will respond in the same way to envi-
ronmental change (Shaver & Kummerow, 1992; Arft
et al., 1999; Barrett et al., 2015; Kremers et al., 2015).
Phenological responses to climate change have been
well studied, either on their own (e.g., Fitter et al., 1995;
Miller-Rushing & Primack, 2008) or in the context of
phenological synchrony between interacting species
and potential feedbacks to fitness (Both et al., 2009;
Kharouba & Vellend, 2015; Kharouba et al., 2015). Here,
we focus on phenological synchrony both among differ-
ent species, and of one species situated at different sites
along a temperature gradient. Our results point to
an important, yet often overlooked, consequence of
phenological synchrony: variation in the temperature
sensitivity of phenology among populations – as
demonstrated here with C. tetragona – could alter the
Fig. 4 Comparisons between the mean summer (June–August) temperature of sites from 1981 to 2010 and the average annual change
in temperature from 1960 to 2013 for the months of May (a), June (b), July (c), and August (d). Lines and gray shading represent slopes
and 95% confidence intervals of simple linear regressions. Asterisks indicate significant relationships at: *P < 0.1, and **P < 0.05. Mean
monthly temperature data for each site from 1960 to 2013 were obtained from the Climate Research Unit (CRU) TS3.21 0.5° gridded
temperature data (Harris et al., 2014). [Colour figure can be viewed at wileyonlinelibrary.com].
© 2017 John Wiley & Sons Ltd, Global Change Biology, doi: 10.1111/gcb.13619
8 J . PREV �EY et al.
potential for pollen transfer and therefore gene flow,
which could either promote adaptive evolution and
persistence via increased genetic variation and reduced
inbreeding depression (Alleaume-Benharira et al.,
2006), or counteract adaptive evolution via the intro-
duction of locally maladapted alleles (Lenormand,
2002; Sexton et al., 2011). Although many of the sites in
this study are too distant for pollen transport by polli-
nators, the variation observed in the temperature sensi-
tivities of flowering from these sites can inform the
manner in which flowering times in regions with strong
elevational or continental climatic gradients may con-
verge with warmer summer temperatures. Specifically,
our results suggest that increased summer tempera-
tures will shift the flowering times of plants from
colder, higher latitude sites earlier to overlap more with
those of populations from warmer sites, thus poten-
tially increasing gene flow between populations across
latitudes.
We also found a trend for greater sensitivity of green-
ing to temperature change at colder vs. warmer sites. If
the timing of initiating physiological activity differs
among populations in response to warming, this could
have a major influence on carbon uptake across the
tundra biome as a whole (Buitenwerf et al., 2015).
Remote-sensing studies of northern areas have found
high variability in greenness indices early in the grow-
ing season (Tucker et al., 2001; Macias-Fauria et al.,
2012), and warmer temperatures may reduce the vari-
ability observed between warmer and colder sites if the
phenology of greening converges with warming. Addi-
tionally, if plant phenology is more temperature sensi-
tive at colder sites, this could also increase chances of
trophic mismatch for herbivores (Herfindal et al., 2006;
Post & Forchhammer, 2008; Post et al., 2008; Kerby &
Post, 2013), especially if the greater sensitivity of plant
phenology is coupled with greater early-season warm-
ing at colder sites. Our results indicate that the timing
of food availability in early season may shift more in
higher and colder sites, and this could alter food webs
to a greater extent in high Arctic locations.
There was no relationship between the phenological
sensitivity of flower or leaf senescence and summer
temperature across sites, similar to results of an earlier
synthesis of tundra plant phenology (Oberbauer et al.,
2013). Non-temperature-related cues, such as successful
pollination, may exert a greater influence on the timing
of flower senescence than temperature (Stead, 1992).
Multiple factors, such as photoperiod, soil moisture,
frost, and insect damage may be more important cues
than temperature for leaf senescence (K€orner, 2003;
Panchen et al., 2015). Growing seasons are predicted to
expand in polar ecosystems as temperatures increase,
snow melt occurs earlier, and snow fall occurs later
(Oberbauer et al., 1998). Our findings suggest that
growing season duration may extend due to earlier
greening or flowering in warmer years, but not as a
result of a longer period of photosynthetic activity in
the fall in the aboveground parts of plants (Macias-
Fauria et al., 2012; Rumpf et al., 2014; Khorsand Rosa
et al., 2015). However, belowground phenology might
differ, as longer growing seasons could occur with later
freeze-up due to an extended period of root growth
(Blume-Werry et al., 2016; Radville et al., 2016; Sloan
et al., 2016).
Although these results indicate potential for a con-
vergence of flowering and greening phenology as sum-
mer temperatures become warmer in the future, they
should be interpreted with caution. Other factors, such
as snow accumulation and the timing of snow melt,
may be decoupled from temperature changes in north-
ern latitudes (Kohler et al., 2006; Bjorkman et al., 2015)
and alter the phenology of tundra plant communities in
different ways than warmer temperatures alone
(Cooper et al., 2011; Semenchuk et al., 2013; Bjorkman
et al., 2015; Phoenix & Bjerke, 2016). Additionally, our
use of average monthly temperatures here may not
reflect the exact temperatures experienced by each spe-
cies at each site before completion of phenological
stages. It will be important to continue to gather
detailed phenological and temperature measurements
on common species across the Arctic to elucidate how
environmental factors shape phenological responses
and how these responses are changing through time.
Bridging the gap between research that links the effects
of climate change on phenology, and research that
addresses the effects of phenology on plant adaptation
and evolutionary processes, is the next step in under-
standing how plants will continue to respond to global
change over longer timescales.
The results of our study substantially advance our
understanding of tundra plant phenology by illustrat-
ing how the temperature sensitivity of phenological
events can vary across large-scale climatic gradients.
This increased sensitivity of flowering and greening
phenology, coupled with increased spring and summer
warming in the far north, may amplify the phenological
convergence across latitudes as the climate warms.
Given that phenology is among the most important
traits influencing the fitness, evolution, and distribution
of plant species (Chuine & Beaubien, 2001; Fox, 2003;
Chuine, 2010), incorporating spatial differences in the
temperature sensitivity of phenology into bioclimatic
envelope models and dynamic vegetation models could
improve our ability to accurately predict how plant
communities will respond to climate change (Morin &
Thuiller, 2009; Valladares et al., 2014). Integrating spa-
tial variation in temperature sensitivity of phenology
© 2017 John Wiley & Sons Ltd, Global Change Biology, doi: 10.1111/gcb.13619
PHENOLOGICAL CHANGE AT HIGH LATITUDES 9
with fine-grained climate scenarios will allow us to pre-
dict where and when plant phenology will change most
rapidly in the future.
Data accessibility
The data used in this synthesis are archived at the Polar
Data catalog (www.polardata.ca/pdcsearch/?doi_id=
12722).
Acknowledgements
We are grateful to the hundreds of scientists, field assistants,and others who established experiments and collected detailedphenological observations, including Dorothy Cooley, OrinDurey, Cameron Eckert, Jill F. Johnstone, Catherine Kennedy,Vincent Lamarre, Guylaine Levasseur, Carmen Spiech, JosefSvoboda, Renee Wising, the Herschel Island-Qikiqtaruk Territo-rial Park staff, Quttinirpaaq National Park staff, the GreenlandEcosystem Monitoring team, and others. We thank four anony-mous reviewers for their helpful comments on previous ver-sions of this manuscript. These observations were madepossible with the support of many funding agencies and grantsincluding: the Natural Sciences and Engineering Council ofCanada, Canadian International Polar Year Program, Polar Con-tinental Shelf Program of Natural Resources Canada, the DanishEnvironmental Protection Agency, the Swiss Federal Institutefor Forest, Snow, and Landscape Research WSL, US NationalScience Foundation grants: PLR 1525636, PLR 1107381, PLR0902125, 1312402, 1019324, LTER-1026415, 1433063, 0856728,0612534, 0119279, 9421755, OPP-9907185, and 0856710, DanishNational Research Foundation grant: CENPERM DNRF100,Deutsche Forschungsgemeinschaft grant: RU 1536/3-1, NaturalEnvironment Research Council grant: NE/M016323/1, Depart-ment of Energy grant: SC006982, and an INTERACT Transna-tional Access grant. The idea for the manuscript was conceivedat a workshop funded by the German Centre for Integrative Bio-diversity Research (iDiv).
References
Alleaume-Benharira M, Pen I, Ronce O (2006) Geographical patterns of adaptation
within a species’ range: interactions between drift and gene flow. Journal of Evolu-
tionary Biology, 19, 203–215.
Anderegg WRL, Diffenbaugh NS (2015) Observed and projected climate trends and
hotspots across the National Ecological Observatory Network regions. Frontiers in
Ecology and the Environment, 13, 547–552.
Arft AM, Walker MD, Gurevitch JEA et al. (1999) Responses of tundra plants to
experimental warming: meta-analysis of the international tundra experiment. Eco-
logical Monographs, 69, 491–511.
Badeck FW, Bondeau A, B€ottcher K et al. (2004) Responses of spring phenology to cli-
mate change. New Phytologist, 162, 295–309.
Barrett RT, Hollister RD, Oberbauer SF, Tweedie CE (2015) Arctic plant responses to
changing abiotic factors in northern Alaska. American Journal of Botany, 102, 2020–
2031.
Bates D, Maechler M, Bolker B, Walker S (2015) Fitting linear mixed-effects models
using lme4. Journal of Statistical Software, 67, 1–48.
Bennington CC, Fetcher N, Vavrek MC et al. (2012) Home site advantage in two long-
lived arctic plant species: results from two thirty-year reciprocal transplant stud-
ies. Journal of Ecology, 100, 841–851.
Billings WD (1992) Phytogeographic and evolutionary potential of the arctic flora and
vegetation in a changing climate. In: Arctic Ecosystems in a Changing Climate: An
Ecophysiological Perspective (eds Chapin FS, Jeffries RL, Reynolds JF, Shaver GR,
Svoboda J, Chu EW), pp. 91–109. Academic Press, Cambridge, MA.
Billings WD, Mooney HA (1968) The ecology of arctic and alpine plants. Biological
Review, 43, 481–529.
Bjorkman AD, Elmendorf SC, Beamish AL et al. (2015) Contrasting effects of warming
and increased snowfall on Arctic tundra plant phenology over the past two dec-
ades. Global Change Biology, 21, 4651–4661.
Bliss LC (1962) Adaptations of arctic and alpine plants to environmental conditions.
Arctic, 15, 117–144.
Blume-Werry G, Wilson SD, Kreyling J, Milbau A (2016) The hidden season: growing
season is 50% longer below than above ground along an arctic elevation gradient.
New Phytologist, 209, 978–986.
Both C, Van Asch M, Bijlsma RG et al. (2009) Climate change and unequal phenologi-
cal changes across four trophic levels: constraints or adaptations? Journal of Animal
Ecology, 78, 73–83.
Buitenwerf R, Rose L, Higgins SI (2015) Three decades of multi-dimensional change
in global leaf phenology. Nature Climate Change, 5, 364–368.
Cahoon SM, Sullivan PF, Shaver GR et al. (2012) Interactions among shrub cover and
the soil microclimate may determine future Arctic carbon budgets. Ecology Letters,
15, 1415–1422.
Chapin FS III, Chapin MC (1981) Ecotypic differentiation of growth processes in Carex
aquatilis along latitudinal and local gradients. Ecology, 62, 1000–1009.
Chuine I (2010) Why does phenology drive species distribution? Philosophical Transac-
tions of the Royal Society of London B: Biological Sciences, 365, 3149–3160.
Chuine I, Beaubien EG (2001) Phenology is a major determinant of tree species range.
Ecology Letters, 4, 500–510.
Clark JS, Salk C, Melillo J, Mohan J (2014) Tree phenology responses to winter chilling,
spring warming, at north and south range limits. Functional Ecology, 1, 1344–1355.
Cook BI, Wolkovich EM, Parmesan C (2012) Divergent responses to spring and win-
ter warming drive community level flowering trends. Proceedings of the National
Academy of Sciences, 109, 9000–9005.
Cooper EJ, Dullinger S, Semenchuk P (2011) Late snowmelt delays plant development
and results in lower reproductive success in the High Arctic. Plant Science, 180,
157–167.
Elmendorf SC, Henry GHR, Hollister RD et al. (2012a) Plot-scale evidence of tundra
vegetation change and links to recent summer warming. Nature Climate Change, 2,
453–457.
Elmendorf SC, Henry GHR, Hollister RD et al. (2012b) Global assessment of experi-
mental climate warming on tundra vegetation: heterogeneity over space and time.
Ecology Letters, 5, 164–175.
Fitter AH, Fitter RSR, Harris ITB, Williamson MH (1995) Relationships between first
flowering date and temperature in the flora of a locality in central England. Func-
tional Ecology, 9, 55–60.
Fox GA (2003) Assortative mating and plant phenology: evolutionary and practical
consequences. Evolutionary Ecology Research, 5, 1–18.
Gelman A, Rubin DB (1992) Inference from iterative simulation using multiple
sequences. Statistical Science, 7, 457–472.
Harris I, Jones PD, Osborn TJ et al. (2014) Updated high-resolution grids of monthly
climatic observations – the CRU TS3.10 Dataset. International Journal of Climatology,
34, 623–642.
Henry GHR, Molau U (1997) Tundra plants and climate change: the International
Tundra Experiment (ITEX). Global Change Biology, 3, 1–9.
Herfindal I, Solberg EJ, Sæther BE et al. (2006) Environmental phenology and geo-
graphical gradients in moose body mass. Oecologia, 150, 213–224.
Hill GB, Henry GHR (2011) Responses of High Arctic wet sedge tundra to climate
warming since 1980. Global Change Biology, 17, 276–287.
Hinzman L, Oechel W, Sturm M et al. (2005) Evidence for recent changes in the Arctic
terrestrial landscape. Climatic Change, 72, 251–298.
Høye TT, Post E, Meltofte H, Schmidt NM, Forchhammer MC (2007a) Rapid advance-
ment of spring in the High Arctic. Current Biology, 17, R449–R451.
Høye TT, Mølgaard Ellebjerg S, Philipp M (2007b) The impact of climate on flowering
in the High Arctic-The case of Dryas in a hybrid zone. Arctic, Antarctic, and Alpine
Research, 39, 412–421.
IPCC (2014) Climate change 2014: impacts, adaptation, and vulnerability. Part A: glo-
bal and sectoral aspects. In: Contribution of Working Group II to the Fifth Assessment
Report of the Intergovernmental Panel on Climate Change (eds Field CB, Barros VR,
Dokken DJ, Mach KJ, Mastrandrea MD, Bilir TE, Chatterjee M, Ebi KL, Estrada
YO, Genova RC, Girma B, Kissel ES, Levy AN, MacCracken S, Mastrandrea PR,
White LL), pp. 1567–1581. Cambridge University Press, Cambridge, UK and New
York, NY, USA.
Kenta T, Yamada A, Onda Y (2011) Clinal variation in flowering time and vernalisa-
tion requirement across a 3000-m altitudinal range in perennial Arabidopsis kam-
chatica ssp. kamchatica and annual lowland subspecies kawasakiana. Journal of
Ecosystem & Ecography, S6: 001.
© 2017 John Wiley & Sons Ltd, Global Change Biology, doi: 10.1111/gcb.13619
10 J . PREV �EY et al.
Kerby JT, Post E (2013) Advancing plant phenology and reduced herbivore produc-
tion in a terrestrial system associated with sea ice decline. Nature Communications,
4, 2514.
Kharouba HM, Vellend M (2015) Flowering time of butterfly nectar food plants is
more sensitive to temperature than the timing of butterfly adult flight. Journal of
Animal Ecology, 84, 1311–1321.
Kharouba HM, Vellend M, Sarfraz RM, Myers JH (2015) The effects of experimental
warming on the timing of a plant-insect herbivore interaction. Journal of Animal
Ecology, 84, 785–796.
Khorsand Rosa R, Oberbauer SF, Starr G et al. (2015) Plant phenological responses to
a long-term experimental extension of growing season and soil warming in the
tussock tundra of Alaska. Global Change Biology, 21, 4520–4532.
Klady RA, Henry GHR, Lemay V (2011) Changes in high arctic tundra plant repro-
duction in response to long-term experimental warming. Global Change Biology, 17,
1611–1624.
Kohler J, Brandt O, Johansson M, Callaghan T (2006) A long-term arctic snow depth
record from Abisko, northern Sweden, 1913–2004. Polar Research, 25, 91–113.
K€orner C (ed.) (2003) Growth dynamics and phenology. In: Alpine Plant Life, pp. 221–
233. Springer, Berlin, Heidelberg.
Kremers KS, Hollister RD, Oberbauer SF (2015) Diminished response of arctic plants
to warming over time. PLoS One, 10, e0116586–13.
Latimer AM (2007) Geography and resource limitation complicate metabolism-based
predictions of species richness. Ecology, 88, 1895–1898.
Lenormand T (2002) Gene flow and the limits to natural selection. Trends in Ecology
and Evolution, 17, 183–189.
L�evesque E, Henry GHR, Svoboda J (1997) Phenological and growth responses of
Papaver radicatum along altitudinal gradients in the Canadian High Arctic. Global
Change Biology, 3, 125–145.
Macias-Fauria M, Forbes BC, Zetterberg P, Kumpula T (2012) Eurasian Arctic green-
ing reveals teleconnections and the potential for structurally novel ecosystems.
Nature Climate Change, 2, 613–618.
McGraw JB, Antonovics J (1983) Experimental ecology of Dryas octopetala ecotypes: I.
Ecotypic differentiation and life-cycle stages of selection. The Journal of Ecology, 71,
879–897.
Miller PA, Smith B (2012) Modelling tundra vegetation response to recent arctic
warming. Ambio, 3, 281–291.
Miller-Rushing A, Primack RB (2008) Global warming and flowering times in Thor-
eau’s Concord: a community perspective. Ecology, 89, 332–341.
Molau U, Molgaard P (eds.) (1996) ITEX Manual. Dansk Polar Center, Copenhagen.
Morin X, Thuiller W (2009) Comparing niche-and process-based models to reduce
prediction uncertainty in species range shifts under climate change. Ecology, 90,
1301–1313.
Mulder CP, Iles DT, Rockwell RF (2016) Increased variance in temperature and lag
effects alter phenological responses to rapid warming in a subarctic plant commu-
nity. Global Change Biology, 23, 801–814.
Myers-Smith IH, Elmendorf SC, Beck PS et al. (2015) Climate sensitivity of shrub
growth across the tundra biome. Nature Climate Change, 5, 887–891.
Oberbauer SF, Starr G, Popp EW (1998) Effects of extended growing season and soil
warming on carbon dioxide and methane exchange of tussock tundra in Alaska.
Journal of Geophysical Research, 103, 29075–29082.
Oberbauer SF, Tweedie CE, Welker JM et al. (2007) Carbon dioxide exchange
responses of arctic tundra ecosystems to experimental warming along latitudinal
and moisture gradients. Ecological Monographs, 77, 221–238.
Oberbauer SF, Elmendorf SC, Troxler TG et al. (2013) Phenological response of tundra
plants to background climate variation tested using the International Tundra
Experiment. Philosophical Transactions of the Royal Society B: Biological Sciences, 368,
20120481.
Oechel WC, Vourlitis GL, Hastings SJ et al. (2000) Acclimation of ecosystem CO2
exchange in the Alaskan Arctic in response to decadal climate warming. Nature,
406, 978–981.
Overpeck J, Hughen K, Hardy D et al. (1997) Arctic environmental change of the last
four centuries. Science, 278, 1251–1256.
Panchen ZA, Primack RB, Gallinat AS et al. (2015) Substantial variation in leaf senes-
cence times among 1360 temperate woody plant species: implications for phenol-
ogy and ecosystem processes. Annals of Botany, 116, 865–873.
Parmesan C (2007) Influences of species, latitudes and methodologies on estimates of
phenological response to global warming. Global Change Biology, 13, 1860–1872.
Parmesan C, Yohe G (2003) A globally coherent fingerprint of climate change impacts
across natural systems. Nature, 421, 37–42.
Parsons AN, Welker JM, Wookey PA et al. (1994) Growth responses of four sub-Arctic
dwarf shrubs to simulated environmental change. Journal of Ecology, 82, 307–318.
Pe~nuelas J, Rutishauser T, Filella I (2009) Phenology feedbacks on climate change.
Science, 324, 887–888.
Phillimore AB, Hadfield JD, Jones OR, Smithers RJ (2010) Differences in spawning
date between populations of common frog reveal local adaptation. Proceedings of
the National Academy of Sciences, 107, 8292–8297.
Phillimore AB, Proios K, O’Mahony N et al. (2013) Inferring local processes from
macro-scale phenological pattern: a comparison of two methods. Journal of Ecology,
101, 774–783.
Phoenix GK, Bjerke JW (2016) Arctic browning: extreme events and trends reversing
arctic greening. Global Change Biology, 22, 2960–2962.
Post E (2013) Ecology of Climate Change: The Importance of Biotic Interactions. Princeton
University Press, Princeton, NJ.
Post E, Forchhammer MC (2008) Climate change reduces reproductive success of an
arctic herbivore through trophic mismatch. Philosophical Transactions of the Royal
Society of London B: Biological Sciences, 363, 2369–2375.
Post E, Pedersen C, Wilmers CC, Forchhammer MC (2008) Warming, plant phenol-
ogy and the spatial dimension of trophic mismatch for large herbivores. Proceed-
ings of the Royal Society of London B: Biological Sciences, 275, 2005–2013.
R Core Team (2015) R: A Language and Environment for Statistical Computing. R Foun-
dation for Statistical Computing, Vienna, Austria.
Radville L, McCormack ML, Post E, Eissenstat DM (2016) Root phenology in a chang-
ing climate. Journal of Experimental Botany, 67, 3617–3628.
Riihim€aki M, Savolainen O (2004) Environmental and genetic effects on flowering dif-
ferences between northern and southern populations of Arabidopsis lyrata (Brassi-
caceae). American Journal of Botany, 91, 1036–1045.
Rumpf SB, Semenchuk PR, Dullinger S, Cooper EJ (2014) Idiosyncratic responses of
high arctic plants to changing snow regimes. PLoS One, 9, e86281.
Semenchuk PR, Elberling B, Cooper EJ (2013) Snow cover and extreme winter warm-
ing events control flower abundance of some, but not all species in high arctic
Svalbard. Ecology and Evolution, 3, 2586–2599.
Sexton JP, Strauss SY, Rice KJ (2011) Gene flow increases fitness at the warm edge of
a species’ range. Proceedings of the National Academy of Sciences, 108, 11704–11709.
Sharp ED, Sullivan PF, Steltzer H et al. (2013) Complex carbon cycle responses to
multi-level warming and supplemental summer rain in the high Arctic. Global
Change Biology, 19, 1780–1792.
Shaver GR, Kummerow J (1992) Phenology, resource allocation and growth of Arctic
vascular plants. In: Arctic Ecosystems in a Changing Climate: An Ecophysiological Per-
spective (eds Chapin FS, Jefferies RL, Reynolds JF, Shaver GR, Svoboda J), pp. 193–
211. Academic Press, San Diego, CA, USA.
Sloan VL, Fletcher BJ, Phoenix GK (2016) Contrasting synchrony in root and leaf phe-
nology across multiple sub-Arctic plant communities. Journal of Ecology, 104, 239–
248.
Stan Development Team (2015) Stan: A C++ Library for Probability and Sampling,
Version 2.8.0. Available at: http://mc-stan.org/ (accessed 20 December 2015).
Stead AD (1992) Pollination-induced flower senescence: a review. Plant Growth Regu-
lation, 11, 13–20.
Thackeray SJ, Henrys PA, Hemming D, Bell JR et al. (2016) Phenological sensitivity to
climate across taxa and trophic levels. Nature, 535, 241–245.
Th�orhallsd�ottir TE (1998) Flowering phenology in the central highland of Iceland and
implications for climatic warming in the arctic. Oecologia, 11, 43–49.
Tucker CJ, Slayback DA, Pinzon JE et al. (2001) Higher northern latitude normalized
difference vegetation index and growing season trends from 1982 to 1999. Interna-
tional Journal of Biometeorology, 45, 184–190.
Valladares F, Matesanz S, Guilhaumon F et al. (2014) The effects of phenotypic plas-
ticity and local adaptation on forecasts of species range shifts under climate
change. Ecology Letters, 17, 1351–1364.
Van de Pol M, Wright J (2009) A simple method for distinguishing within-versus
between-subject effects using mixed models. Animal Behaviour, 77, 753–758.
Walker MD, Wahren CH, Hollister RD et al. (2006) Plant community responses to
experimental warming across the tundra biome. Proceedings of the National Academy
of Sciences of the United States of America, 103, 1342–1346.
Walther GR, Post E, Convey P, Beebee TJ et al. (2002) Ecological responses to recent
climate change. Nature, 416, 389–395.
Webber PJ, Walker MD (1991) The International Tundra Experiment (ITEX): resolu-
tion. Arctic Antarctic and Alpine Research, 23, 124.
Weber E, Schmid B (1998) Latitudinal population differentiation in two species of Sol-
idago (Asteraceae) introduced into Europe. American Journal of Botany, 8, 1110–
1121.
Welker JM, Molau U, Parsons AN et al. (1997) Response of Dryas octopetala to ITEX
manipulations: a synthesis with circumpolar comparisons. Global Change Biology,
3, 61–73.
© 2017 John Wiley & Sons Ltd, Global Change Biology, doi: 10.1111/gcb.13619
PHENOLOGICAL CHANGE AT HIGH LATITUDES 11
Welker JM, Fahnestock JT, Henry GH et al. (2004) CO2 exchange in three Canadian
High Arctic ecosystems: response to long-term experimental warming. Global
Change Biology, 10, 1981–1995.
Wookey PA, Parsons AN, Welker JM et al. (1993) Comparative responses of phenol-
ogy and reproductive development to simulated environmental change in sub-arc-
tic and high arctic plants. Oikos, 67, 490–502.
Supporting Information
Additional Supporting Information may be found in the online version of this article:
Data S1. Names and websites for sources of temperature data used to estimate the mean summer (June–August) temperatures foreach site from 1981 to 2010.Data S2. Results from alternative models used to analyze how mean summer temperatures at sites influence the temperature sensi-tivity of phenological events.Data S3. Stan model specifications for hierarchical Bayesian analyses presented in the main text.Figure S1. Relationship between the mean summer temperature at sites and the temperature sensitivity of flowering only for spe-cies that occurred at three or more sites.Figure S2. Comparisons between the latitude of sites in the analyses and the average annual change in temperature from 1960 to2013 for the months of May (a), June (b), July (c), and August (d).Table S1. List of all plant species and phenological measurements used in analyses.Table S2. Results of Bayesian hierarchical analyses using different summer temperature windows.
© 2017 John Wiley & Sons Ltd, Global Change Biology, doi: 10.1111/gcb.13619
12 J . PREV �EY et al.