Embed Size (px)
DESCRIPTION
Greater Park City, Utah Area Real Estate Market Update for Q1 2016 courtesy of Summit Sotheby's International Realty.
Citation preview

GREATER PARK CITY MARKET UPDATEGreater Park City Market (Entire MLS), Summit County, Wasatch County, 84060, 84098
Aerie, Deer Crest, Empire Pass, Glenwild - Silver Creek, Jeremy Ranch, Jordanelle, Kimball Junction, Lower Deer Valley® Resort, Up-per Deer Valley® Resort, Old Ranch Road, Old Town, Park Meadows, Pinebrook, Promontory, Prospector, Silver Springs, Summit Park, Sun Peak - Bear Hollow, The Canyons, Trailside Park
Heber - Daniels, Midway - Charleston, Timberlakes, Kamas - Marion, Oakley - Weber Canyon, Wanship - Hoytsville - Coalville - Echo and Henefer, Woodland - Francis
View our monthly Market Update Videos at summitsothebysrealty.com/market-update
Q1 2016
7870 Moon Dog Court, Promontory


GREATER PARK CITY AREAGREATER PARK CITY AREA ...........................PG 4SUMMIT COUNTY ...............................................PG 5WASATCH COUNTY ........................................PG 6
PARK CITY AREA84060 .............................................................................PG 7 84098 .............................................................................PG 8 AERIE ..............................................................................PG 9DEER CREST .............................................................PG 10EMPIRE PASS .............................................................PG 11GLENWILD - SILVER CREEK ..........................PG 12JEREMY RANCH .....................................................PG 13JORDANELLE............................................................PG 14KIMBALL JUNCTION ..........................................PG 15LOWER DEER VALLEY® RESORT ...............PG 16UPPER DEER VALLEY® RESORT ..................PG 17OLD RANCH ROAD ..........................................PG 18OLD TOWN ..............................................................PG 19PARK MEADOWS..................................................PG 20
PINEBROOK ..............................................................PG 21PROMONTORY ......................................................PG 22PROSPECTOR ..........................................................PG 23SILVER SPRINGS ....................................................PG 24SUMMIT PARK ..........................................................PG 25SUN PEAK - BEAR HOLLOW .......................PG 26THE CANYONS .....................................................PG 27TRAILSIDE PARK .....................................................PG 28
OUTLYING AREAS HEBER - DANIEL’S .................................................PG 29MIDWAY - CHARLESTON ..............................PG 30TIMBERLAKES ...........................................................PG 31KAMAS - MARION ...............................................PG 32OAKLEY - WEBER CANYON ........................PG 33WANSHIP - HOYTSVILLE - COALVILLE - ECHO AND HENEFER .......................................PG 34WOODLAND - FRANCIS ...............................PG 35
This material is based upon information that we consider reliable, but because it has been supplied by third parties, we cannot represent that it is accurate or complete, including price, or withdrawal without notice; square footage is an estimate only. ©MMXV Sotheby’s International Realty Affiliates, Inc. All Rights Reserved. Sotheby’s International Realty®
is a licensed trademark to Sotheby’s International Realty Affiliates, Inc. An Equal Opportunity Company. Each Office Is Independently Owned And Operated.
TABLE OF CONTENTS

Source: PCMLS 2012-2015. This material is based upon information that we consider reliable, but because it has been supplied by third parties, we cannot represent that it is accurate or complete, including price, or withdrawal without notice; square footage is an estimate only. ©MMXV Sotheby’s International Realty Affiliates, Inc. All Rights Reserved. Sotheby’s International Realty® is a licensed trademark to Sotheby’s International Realty Affiliates, Inc. An Equal Opportunity Company.
GREATER PARK CITY - ALL MLSThe statistics below compare 1st Quarter 2013 to 2016 for the entire Park City MLS (Areas 1-41) with a year-over-year percentage comparing 2015 to 2015. All of the numbers in these charts are Closed Transactions. Ask a Summit Sotheby’s International Realty REALTOR® for help interpreting these charts.
SINGLE FAMILY HOMES Q1 2013 Q1 2014 Q1 2015 Q1 2016 Q1 2016 vs Q1 2015
Units Sold 169 162 183 180 -2%
Sold Dollar Volume $169,625,323 $169,468,331 $198,022,691 $225,880,354 14%
For Sale at End of Quarter 718 732 737 660 -10%
Avg MSI 10.3 10.9 9.8 8.5 -13%
Avg DOM 171 161 143 114 -20%Avg List Price $1,097,075 $1,112,881 $1,142,945 $1,316,455 15%
Avg Sale Price $1,003,700 $1,046,101 $1,082,091 $1,254,891 16%
Median Sale Price $619,000 $632,000 $754,000 $722,000 -4%
Avg LP/Sq. Ft. $241 $273 $292 $292 0%
Avg SP/Sq. Ft. $224 $258 $261 $282 8%
Avg SP/OLP 91.49% 94.00% 94.68% 95.32% 1%
Highest Sold Price $8,500,000 $12,500,000 $12,750,000 $11,500,000 -10%
Lowest Sold Price $75,000 $66,000 $1 $75,000 7499900%
CONDOS Q1 2013 Q1 2014 Q1 2015 Q1 2016 Q1 2016 vs Q1 2015
Units Sold 131 167 189 151 -20%
Sold Dollar Volume $99,304,537 $121,443,019 $151,171,465 $120,931,557 -20%
For Sale at End of Quarter 605 572 524 439 -16%
Avg MSI 13.4 8.4 6.2 10.0 61%
Avg DOM 207 122 130 85 -35%
Avg List Price $795,852 $763,774 $818,830 $828,869 1%
Avg Sale Price $758,050 $727,204 $799,849 $800,871 0%
Median Sale Price $415,000 $409,000 $449,500 $500,000 11%
Avg LP/Sq. Ft. $382 $384 $427 $450 5%
Avg SP/Sq. Ft. $365 $367 $416 $435 5%
Avg SP/OLP 95.25% 95.21% 97.68% 96.62% -1%Highest Sold Price $5,320,000 $6,150,000 $7,500,000 $5,350,000 -29%Lowest Sold Price $40,000 $60,000 $94,000 $70,000 -26%
VACANT LAND Q1 2013 Q1 2014 Q1 2015 Q1 2016 Q1 2016 vs Q1 2015
Units Sold 73 93 104 98 -6%
Sold Dollar Volume $25,173,909 $38,807,497 $36,611,403 $44,511,698 22%
For Sale at End of Quarter 733 735 781 760 -3%
Avg MSI 21.6 18.8 17.4 26.2 51%
Avg DOM 242 257 243 160 -34%
Avg List Price $377,408 $451,282 $367,162 $487,086 33%
Avg Sale Price $344,848 $417,285 $352,033 $454,201 29%
Median Sale Price $184,300 $195,000 $225,000 $292,250 30%
Avg SP/OLP 91.37% 92.47% 95.88% 93.25% -3%
Highest Sold Price $2,800,000 $3,700,000 $3,795,250 $2,100,000 -45%
Lowest Sold Price $14,000 $15,000 $15,684 $11,000 -30%

Source: PCMLS 2012-2015. This material is based upon information that we consider reliable, but because it has been supplied by third parties, we cannot represent that it is accurate or complete, including price, or withdrawal without notice; square footage is an estimate only. ©MMXV Sotheby’s International Realty Affiliates, Inc. All Rights Reserved. Sotheby’s International Realty® is a licensed trademark to Sotheby’s International Realty Affiliates, Inc. An Equal Opportunity Company.
SUMMIT COUNTYThe statistics below compare 1st Quarter 2013 to 2016 for Summit County with a year-over-year percentage comparing 2016 to 2015. All of the numbers in these charts are Closed Transactions. Ask a Summit Sotheby’s International Realty REAL-TOR® for help interpreting these charts.
SINGLE FAMILY HOMES Q1 2013 Q1 2014 Q1 2015 Q1 2016 Q1 2016 vs Q1 2015
Units Sold 112 112 121 107 -12%
Sold Dollar Volume $127,669,411 $139,973,635 $166,569,901 $184,703,513 11%
For Sale at End of Quarter 473 443 449 378 -16%
Avg MSI 10.1 10.1 8.6 9.7 13%
Avg DOM 175 167 140 115 -18%Avg List Price $1,228,295 $1,321,658 $1,452,909 $1,818,907 25%
Avg Sale Price $1,139,905 $1,249,765 $1,376,611 $1,726,201 25%
Median Sale Price $797,500 $777,250 $957,000 $960,000 0%
Avg LP/Sq. Ft. $284 $305 $333 $374 12%
Avg SP/Sq. Ft. $265 $290 $317 $361 14%
Avg SP/OLP 92.80% 94.56% 94.75% 94.90% 0%
Highest Sold Price $7,973,920 $12,500,000 $12,750,000 $11,500,000 -10%Lowest Sold Price $75,000 $85,000 $1 $75,000 7499900%
CONDOS Q1 2013 Q1 2014 Q1 2015 Q1 2016 Q1 2016 vs Q1 2015
Units Sold 108 130 147 110 -25%
Sold Dollar Volume $85,402,604 $109,533,461 $135,052,933 $103,756,531 -23%
For Sale at End of Quarter 419 456 440 353 -20%
Avg MSI 11.3 8.9 8.1 11.4 41%
Avg DOM 190 122 96 94 -2%
Avg List Price $839,023 $890,236 $943,028 $981,853 4%
Avg Sale Price $790,765 $842,565 $918,727 $943,241 3%
Median Sale Price $459,500 $485,000 $515,000 $594,250 15%
Avg LP/Sq. Ft. $404 $443 $480 $528 10%
Avg SP/Sq. Ft. $383 $421 $466 $507 9%
Avg SP/OLP 94.25% 94.65% 97.42% 96.07% -1%Highest Sold Price $4,900,000 $6,150,000 $7,500,000 $5,350,000 -29%Lowest Sold Price $47,200 $107,500 $94,000 $70,000 -26%
VACANT LAND Q1 2013 Q1 2014 Q1 2015 Q1 2016 Q1 2016 vs Q1 2015
Units Sold 51 58 64 55 -14%
Sold Dollar Volume $19,751,850 $30,279,290 $27,147,853 $26,098,548 -4%
For Sale at End of Quarter 452 406 441 400 -9%
Avg MSI 18.1 15.6 14.7 23.5 60%
Avg DOM 276 251 240 189 -21%
Avg List Price $424,374 $561,314 $442,087 $507,721 15%
Avg Sale Price $387,291 $522,057 $424,185 $474,519 12%
Median Sale Price $235,900 $232,250 $242,500 $255,000 5%
Avg SP/OLP 91.26% 93.01% 95.95% 93.46% -3%
Highest Sold Price $2,800,000 $3,700,000 $3,795,250 $2,100,000 -45%
Lowest Sold Price $30,000 $39,500 $15,684 $15,000 -4%

Source: PCMLS 2012-2015. This material is based upon information that we consider reliable, but because it has been supplied by third parties, we cannot represent that it is accurate or complete, including price, or withdrawal without notice; square footage is an estimate only. ©MMXV Sotheby’s International Realty Affiliates, Inc. All Rights Reserved. Sotheby’s International Realty® is a licensed trademark to Sotheby’s International Realty Affiliates, Inc. An Equal Opportunity Company.
WASATCH COUNTYThe statistics below compare 1st Quarter 2013 to 2016 for Wasatch County with a year-over-year percentage comparing 2016 to 2015. All of the numbers in these charts are Closed Transactions. Ask a Summit Sotheby’s International Realty REAL-TOR® for help interpreting these charts.
SINGLE FAMILY HOMES Q1 2013 Q1 2014 Q1 2015 Q1 2016 Q1 2016 vs Q1 2015
Units Sold 49 32 47 58 23%
Sold Dollar Volume $35,953,912 $16,312,696 $22,829,839 $33,890,441 48%
For Sale at End of Quarter 179 201 194 185 -5%
Avg MSI 9.4 13.4 10.8 6.0 -44%
Avg DOM 156 166 146 107 -27%Avg List Price $815,555 $547,888 $511,907 $599,053 17%
Avg Sale Price $733,753 $509,772 $485,741 $584,318 20%
Median Sale Price $375,000 $393,000 $356,000 $434,000 22%
Avg LP/Sq. Ft. $157 $177 $161 $171 6%
Avg SP/Sq. Ft. $146 $165 $154 $167 8%
Avg SP/OLP 89.97% 93.04% 94.89% 97.54% 3%
Highest Sold Price $8,500,000 $1,850,000 $2,050,000 $4,850,000 137%Lowest Sold Price $100,700 $151,000 $150,000 $128,750 -14%
CONDOS Q1 2013 Q1 2014 Q1 2015 Q1 2016 Q1 2016 vs Q1 2015
Units Sold 22 34 37 35 -5%
Sold Dollar Volume $13,714,933 $11,177,558 $13,349,532 $15,026,026 13%
For Sale at End of Quarter 173 107 59 60 2%
Avg MSI 24.7 6.7 2.2 6.7 205%
Avg DOM 300 123 264 62 -77%
Avg List Price $611,505 $325,034 $357,155 $427,730 20%
Avg Sale Price $623,406 $328,752 $360,798 $429,315 19%
Median Sale Price $341,564 $337,925 $376,000 $355,000 -6%
Avg LP/Sq. Ft. $280 $174 $222 $235 6%
Avg SP/Sq. Ft. $284 $175 $225 $237 5%
Avg SP/OLP 101.95% 101.14% 101.02% 100.37% -1%Highest Sold Price $5,320,000 $645,000 $605,000 $1,720,000 184%Lowest Sold Price $40,000 $135,000 $173,000 $165,000 -5%
VACANT LAND Q1 2013 Q1 2014 Q1 2015 Q1 2016 Q1 2016 vs Q1 2015
Units Sold 21 34 37 41 11%
Sold Dollar Volume $5,242,059 $8,295,707 $8,566,300 $18,229,150 113%
For Sale at End of Quarter 258 267 283 282 0%
Avg MSI 28.7 22.3 20.2 23.5 16%
Avg DOM 160 268 259 116 -55%
Avg List Price $267,034 $269,796 $242,076 $476,141 97%
Avg Sale Price $249,622 $243,991 $231,522 $444,613 92%
Median Sale Price $104,500 $165,000 $200,000 $375,000 88%
Avg SP/OLP 93.48% 90.44% 95.64% 93.38% -2%
Highest Sold Price $1,900,000 $1,250,000 $550,000 $1,930,500 251%
Lowest Sold Price $14,000 $15,000 $26,500 $20,000 -25%

Source: PCMLS 2012-2015. This material is based upon information that we consider reliable, but because it has been supplied by third parties, we cannot represent that it is accurate or complete, including price, or withdrawal without notice; square footage is an estimate only. ©MMXV Sotheby’s International Realty Affiliates, Inc. All Rights Reserved. Sotheby’s International Realty® is a licensed trademark to Sotheby’s International Realty Affiliates, Inc. An Equal Opportunity Company.
PARK CITY - 84060The statistics below compare 1st Quarter 2013 to 2016 for the Park City MLS Areas 1-9 with a year-over-year percentage comparing 2016 to 2015. All of the numbers in these charts are Closed Transactions. Ask a Summit Sotheby’s International Realty REALTOR® for help interpreting these charts.
SINGLE FAMILY HOMES Q1 2013 Q1 2014 Q1 2015 Q1 2016 Q1 2016 vs Q1 2015
Units Sold 42 38 35 37 6%
Sold Dollar Volume $75,866,760 $78,342,850 $65,583,250 $112,367,830 71%
For Sale at End of Quarter 187 148 155 144 -7%
Avg MSI 10.4 9.3 10.3 16.0 55%
Avg DOM 212 177 128 91 -29%Avg List Price $1,955,662 $2,195,365 $1,975,183 $3,249,832 65%
Avg Sale Price $1,806,351 $2,061,654 $1,873,807 $3,036,968 62%
Median Sale Price $1,297,500 $1,300,000 $1,600,000 $1,550,000 -3%
Avg LP/Sq. Ft. $414 $482 $490 $577 18%
Avg SP/Sq. Ft. $384 $457 $464 $548 18%
Avg SP/OLP 92.37% 93.91% 94.87% 93.45% -1%
Highest Sold Price $7,973,920 $12,500,000 $6,400,000 $11,500,000 80%
Lowest Sold Price $344,000 $500,000 $365,000 $75,000 -79%
CONDOS Q1 2013 Q1 2014 Q1 2015 Q1 2016 Q1 2016 vs Q1 2015
Units Sold 73 85 84 55 -35%
Sold Dollar Volume $74,114,210 $92,407,075 $102,310,903 $69,051,404 -33%
For Sale at End of Quarter 285 276 274 236 -14%
Avg MSI 13.6 7.7 9.1 14.8 63%
Avg DOM 225 158 88 97 10%
Avg List Price $1,080,789 $1,153,394 $1,261,591 $1,304,290 3%
Avg Sale Price $1,015,263 $1,087,142 $1,217,987 $1,255,480 3%
Median Sale Price $638,000 $725,000 $698,500 $740,000 6%
Avg LP/Sq. Ft. $480 $526 $579 $614 6%
Avg SP/Sq. Ft. $453 $497 $561 $590 5%
Avg SP/OLP 93.94% 94.26% 96.54% 96.26% 0%Highest Sold Price $4,900,000 $6,150,000 $7,500,000 $5,350,000 -29%Lowest Sold Price $59,900 $112,750 $94,000 $70,000 -26%
VACANT LAND Q1 2013 Q1 2014 Q1 2015 Q1 2016 Q1 2016 vs Q1 2015
Units Sold 15 5 9 12 33%
Sold Dollar Volume $10,228,900 $6,712,500 $11,861,120 $15,945,000 34%
For Sale at End of Quarter 94 81 56 59 5%
Avg MSI 15.7 20.3 8.0 59.0 638%
Avg DOM 342 156 286 95 -67%
Avg List Price $741,733 $1,461,000 $1,362,722 $1,409,167 3%
Avg Sale Price $681,927 $1,342,500 $1,317,902 $1,328,750 1%
Median Sale Price $520,000 $1,050,000 $677,370 $1,457,500 115%
Avg SP/OLP 91.94% 91.89% 96.71% 94.29% -3%
Highest Sold Price $2,800,000 $3,400,000 $3,795,250 $2,100,000 -45%
Lowest Sold Price $180,000 $357,500 $379,500 $525,000 38%

Source: PCMLS 2012-2015. This material is based upon information that we consider reliable, but because it has been supplied by third parties, we cannot represent that it is accurate or complete, including price, or withdrawal without notice; square footage is an estimate only. ©MMXV Sotheby’s International Realty Affiliates, Inc. All Rights Reserved. Sotheby’s International Realty® is a licensed trademark to Sotheby’s International Realty Affiliates, Inc. An Equal Opportunity Company.
PARK CITY - 84098The statistics below compare 1st Quarter 2013 to 2016 for the Park City MLS Areas 10-21 with a year-over-year percentage comparing 2016 to 2015. All of the numbers in these charts are Closed Transactions. Ask a Summit Sotheby’s International Realty REALTOR® for help interpreting these charts.
SINGLE FAMILY HOMES Q1 2013 Q1 2014 Q1 2015 Q1 2016 Q1 2016 vs Q1 2015
Units Sold 52 52 65 52 -20%
Sold Dollar Volume $44,095,550 $54,024,800 $94,957,415 $65,026,886 -32%
For Sale at End of Quarter 194 221 214 184 -14%
Avg MSI 9.2 13.8 7.9 8.0 1%
Avg DOM 107 122 134 137 2%Avg List Price $906,765 $1,095,455 $1,544,741 $1,291,617 -16%
Avg Sale Price $847,991 $1,038,938 $1,460,883 $1,250,517 -14%
Median Sale Price $634,500 $735,000 $957,000 $923,000 -4%
Avg LP/Sq. Ft. $223 $254 $312 $306 -2%
Avg SP/Sq. Ft. $210 $241 $300 $298 -1%
Avg SP/OLP 93.52% 94.84% 94.57% 96.82% 2%
Highest Sold Price $2,400,000 $3,750,000 $12,750,000 $5,440,400 -57%Lowest Sold Price $230,000 $374,000 $429,000 $425,000 -1%
CONDOS Q1 2013 Q1 2014 Q1 2015 Q1 2016 Q1 2016 vs Q1 2015
Units Sold 34 44 61 55 -10%
Sold Dollar Volume $11,241,194 $16,261,386 $32,478,030 $36,300,127 12%
For Sale at End of Quarter 134 183 170 128 -25%
Avg MSI 8.4 12.2 7.4 8.5 15%
Avg DOM 120 54 104 92 -12%
Avg List Price $343,232 $381,822 $530,713 $688,426 30%
Avg Sale Price $330,623 $369,577 $532,427 $660,002 24%
Median Sale Price $313,497 $363,500 $395,000 $544,000 38%
Avg LP/Sq. Ft. $249 $287 $354 $461 30%
Avg SP/Sq. Ft. $240 $277 $345 $443 28%
Avg SP/OLP 96.33% 96.79% 100.32% 95.87% -4%Highest Sold Price $1,167,500 $1,255,681 $2,302,919 $2,588,500 12%Lowest Sold Price $112,000 $107,500 $115,000 $129,250 12%
VACANT LAND Q1 2013 Q1 2014 Q1 2015 Q1 2016 Q1 2016 vs Q1 2015
Units Sold 30 41 38 22 -42%
Sold Dollar Volume $9,819,300 $22,722,735 $12,894,549 $7,664,000 -41%
For Sale at End of Quarter 201 153 192 161 -16%
Avg MSI 10.6 9.0 13.7 17.9 31%
Avg DOM 250 257 206 138 -33%
Avg List Price $359,640 $591,963 $353,739 $375,891 6%
Avg Sale Price $327,310 $554,213 $339,330 $348,364 3%
Median Sale Price $225,000 $340,000 $254,500 $282,000 11%
Avg SP/OLP 91.01% 93.62% 95.93% 92.68% -3%
Highest Sold Price $1,195,000 $3,700,000 $1,580,000 $1,150,000 -27%
Lowest Sold Price $30,000 $39,500 $65,000 $31,000 -52%

Source: PCMLS 2012-2015. This material is based upon information that we consider reliable, but because it has been supplied by third parties, we cannot represent that it is accurate or complete, including price, or withdrawal without notice; square footage is an estimate only. ©MMXV Sotheby’s International Realty Affiliates, Inc. All Rights Reserved. Sotheby’s International Realty® is a licensed trademark to Sotheby’s International Realty Affiliates, Inc. An Equal Opportunity Company.
AERIEThe statistics below compare 1st Quarter 2013 to 2016 for the Aerie with a year-over-year percentage comparing 2016 to 2015. The Aerie is a great neighborhood centrally located on the mountain between Old Town, Lower Deer Valley® Resort and Prospector Square.
SINGLE FAMILY HOMES Q1 2013 Q1 2014 Q1 2015 Q1 2016 Q1 2016 vs Q1 2015
Units Sold 1 1 0 0 0%
Sold Dollar Volume $2,000,000 $1,995,000 $0 $0 0%
For Sale at End of Quarter 8 3 5 5 0%
Avg MSI 8.0 0.0 0.0 0.0 0%
Avg DOM 170 266 0 0 0%
Avg List Price $2,049,000 $1,995,000 $0 $0 0%
Avg Sale Price $2,000,000 $1,995,000 $0 $0 0%
Median Sale Price $2,000,000 $1,995,000 $0 $0 0%
Avg LP/Sq. Ft. $447 $389 $0 $0 0%
Avg SP/Sq. Ft. $437 $389 $0 $0 0%
Avg SP/OLP 97.61% 100.00% 0.00% 0.00% 0%
Highest Sold Price $2,000,000 $1,995,000 $0 $0 0%
Lowest Sold Price $2,000,000 $1,995,000 $0 $0 0%
CONDOS Q1 2013 Q1 2014 Q1 2015 Q1 2016 Q1 2016 vs Q1 2015
Units Sold 0 2 0 0 0%
Sold Dollar Volume $0 $3,020,000 $0 $0 0%
For Sale at End of Quarter 3 2 4 3 -25%
Avg MSI 0.0 0.0 0.0 0.0 0%
Avg DOM 0 283 0 0 0%
Avg List Price $0 $1,555,000 $0 $0 0%
Avg Sale Price $0 $1,510,000 $0 $0 0%
Median Sale Price $0 $1,510,000 $0 $0 0%
Avg LP/Sq. Ft. $0 $425 $0 $0 0%
Avg SP/Sq. Ft. $0 $412 $0 $0 0%
Avg SP/OLP 0.00% 97.11% 0.00% 0.00% 0%
Highest Sold Price $0 $1,510,000 $0 $0 0%
Lowest Sold Price $0 $1,510,000 $0 $0 0%
VACANT LAND Q1 2013 Q1 2014 Q1 2015 Q1 2016 Q1 2016 vs Q1 2015
Units Sold 2 0 0 2 200%
Sold Dollar Volume $1,295,000 $0 $0 $4,200,000 420000000%
For Sale at End of Quarter 2 0 1 2 100%
Avg MSI 0.0 0.0 0.0 0.0 0%
Avg DOM 114 0 0 4 400%
Avg List Price $724,500 $0 $0 $2,400,000 240000000%
Avg Sale Price $647,500 $0 $0 $2,100,000 210000000%
Median Sale Price $647,500 $0 $0 $2,100,000 210000000%
Avg SP/OLP 89.37% 0.00% 0.00% 87.50% 88%
Highest Sold Price $775,000 $0 $0 $2,100,000 210000000%
Lowest Sold Price $520,000 $0 $0 $2,100,000 210000000%
Source: PCMLS 2012-2015. This material is based upon information that we consider reliable, but because it has been supplied by third parties, we cannot represent that it is accurate or complete, including price, or withdrawal without notice; square footage is an estimate only. ©MMXV Sotheby’s International Realty Affiliates, Inc. All Rights Reserved. Sotheby’s International Realty® is a licensed trademark to Sotheby’s International Realty Affiliates, Inc. An Equal Opportunity Company.
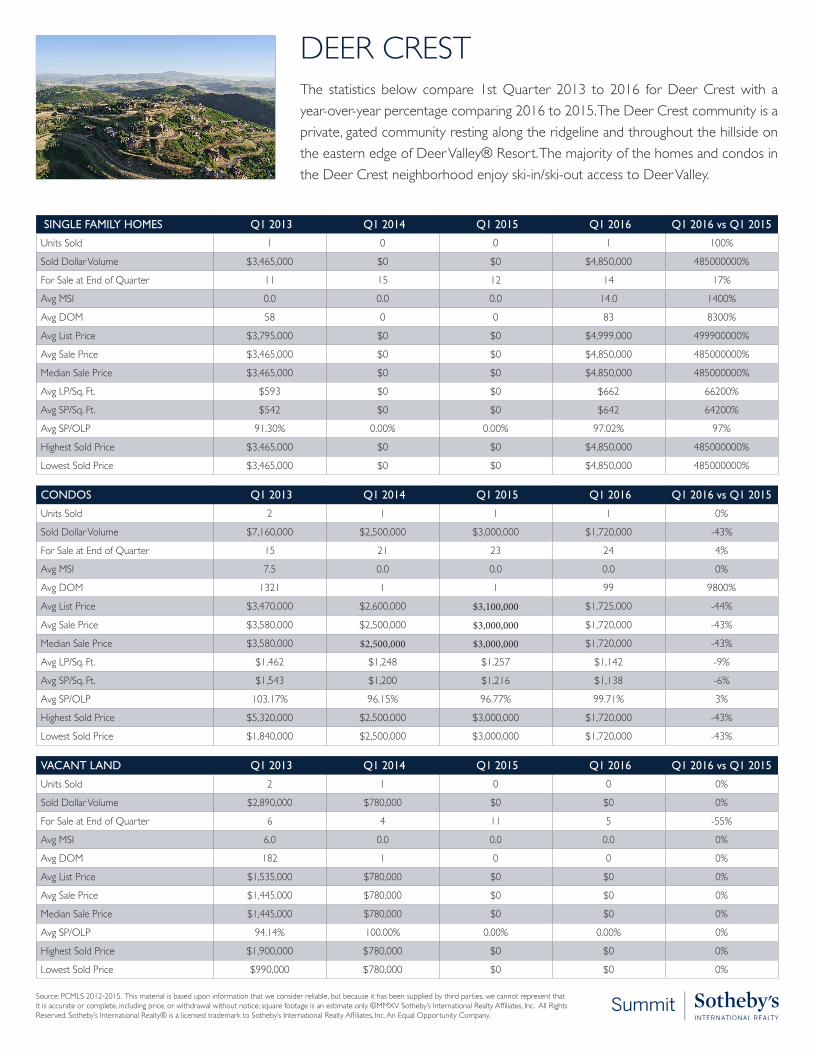
DEER CRESTThe statistics below compare 1st Quarter 2013 to 2016 for Deer Crest with a year-over-year percentage comparing 2016 to 2015. The Deer Crest community is a private, gated community resting along the ridgeline and throughout the hillside on the eastern edge of Deer Valley® Resort. The majority of the homes and condos in the Deer Crest neighborhood enjoy ski-in/ski-out access to Deer Valley.
SINGLE FAMILY HOMES Q1 2013 Q1 2014 Q1 2015 Q1 2016 Q1 2016 vs Q1 2015
Units Sold 1 0 0 1 100%
Sold Dollar Volume $3,465,000 $0 $0 $4,850,000 485000000%
For Sale at End of Quarter 11 15 12 14 17%
Avg MSI 0.0 0.0 0.0 14.0 1400%
Avg DOM 58 0 0 83 8300%
Avg List Price $3,795,000 $0 $0 $4,999,000 499900000%
Avg Sale Price $3,465,000 $0 $0 $4,850,000 485000000%
Median Sale Price $3,465,000 $0 $0 $4,850,000 485000000%
Avg LP/Sq. Ft. $593 $0 $0 $662 66200%
Avg SP/Sq. Ft. $542 $0 $0 $642 64200%
Avg SP/OLP 91.30% 0.00% 0.00% 97.02% 97%
Highest Sold Price $3,465,000 $0 $0 $4,850,000 485000000%
Lowest Sold Price $3,465,000 $0 $0 $4,850,000 485000000%
CONDOS Q1 2013 Q1 2014 Q1 2015 Q1 2016 Q1 2016 vs Q1 2015
Units Sold 2 1 1 1 0%
Sold Dollar Volume $7,160,000 $2,500,000 $3,000,000 $1,720,000 -43%
For Sale at End of Quarter 15 21 23 24 4%
Avg MSI 7.5 0.0 0.0 0.0 0%
Avg DOM 1321 1 1 99 9800%
Avg List Price $3,470,000 $2,600,000 $3,100,000 $1,725,000 -44%
Avg Sale Price $3,580,000 $2,500,000 $3,000,000 $1,720,000 -43%
Median Sale Price $3,580,000 $2,500,000 $3,000,000 $1,720,000 -43%
Avg LP/Sq. Ft. $1,462 $1,248 $1,257 $1,142 -9%
Avg SP/Sq. Ft. $1,543 $1,200 $1,216 $1,138 -6%
Avg SP/OLP 103.17% 96.15% 96.77% 99.71% 3%
Highest Sold Price $5,320,000 $2,500,000 $3,000,000 $1,720,000 -43%
Lowest Sold Price $1,840,000 $2,500,000 $3,000,000 $1,720,000 -43%
VACANT LAND Q1 2013 Q1 2014 Q1 2015 Q1 2016 Q1 2016 vs Q1 2015
Units Sold 2 1 0 0 0%
Sold Dollar Volume $2,890,000 $780,000 $0 $0 0%
For Sale at End of Quarter 6 4 11 5 -55%
Avg MSI 6.0 0.0 0.0 0.0 0%
Avg DOM 182 1 0 0 0%
Avg List Price $1,535,000 $780,000 $0 $0 0%
Avg Sale Price $1,445,000 $780,000 $0 $0 0%
Median Sale Price $1,445,000 $780,000 $0 $0 0%
Avg SP/OLP 94.14% 100.00% 0.00% 0.00% 0%
Highest Sold Price $1,900,000 $780,000 $0 $0 0%
Lowest Sold Price $990,000 $780,000 $0 $0 0%

Source: PCMLS 2012-2015. This material is based upon information that we consider reliable, but because it has been supplied by third parties, we cannot represent that it is accurate or complete, including price, or withdrawal without notice; square footage is an estimate only. ©MMXV Sotheby’s International Realty Affiliates, Inc. All Rights Reserved. Sotheby’s International Realty® is a licensed trademark to Sotheby’s International Realty Affiliates, Inc. An Equal Opportunity Company.
EMPIRE PASSThe statistics below compare 1st Quarter 2013 to 2016 for Empire Pass with a year-over-year percentage comparing 2016 to 2015. Empire Pass is located at the top of Deer Valley on the slopes of Flagstaff Mountain and Empire Canyon and was developed with the highest levels of service and luxury in mind for its homes, townhomes, and condos.
SINGLE FAMILY HOMES Q1 2013 Q1 2014 Q1 2015 Q1 2016 Q1 2016 vs Q1 2015
Units Sold 1 0 0 0 0%
Sold Dollar Volume $5,100,000 $0 $0 $0 0%
For Sale at End of Quarter 8 11 9 10 11%
Avg MSI 0.0 0.0 0.0 0.0 0%
Avg DOM 377 0 0 0 0%
Avg List Price $5,495,000 $0 $0 $0 0%
Avg Sale Price $5,100,000 $0 $0 $0 0%
Median Sale Price $5,100,000 $0 $0 $0 0%
Avg LP/Sq. Ft. $944 $0 $0 $0 0%
Avg SP/Sq. Ft. $877 $0 $0 $0 0%
Avg SP/OLP 92.81% 0.00% 0.00% 0.00% 0%
Highest Sold Price $5,100,000 $0 $0 $0 0%
Lowest Sold Price $5,100,000 $0 $0 $0 0%
VACANT LAND Q1 2013 Q1 2014 Q1 2015 Q1 2016 Q1 2016 vs Q1 2015
Units Sold 0 1 1 0 -100%
Sold Dollar Volume $0 $3,400,000 $3,795,250 $0 -100%
For Sale at End of Quarter 10 10 6 4 -33%
Avg MSI 0.0 10.0 6.0 0.0 -100%
Avg DOM 0 79 124 0 -100%
Avg List Price $0 $3,850,000 $3,995,000 $0 -100%
Avg Sale Price $0 $3,400,000 $3,795,250 $0 -100%
Median Sale Price $0 $3,400,000 $3,795,250 $0 -100%
Avg SP/OLP 0.00% 88.31% 95.00% 0.00% -100%
Highest Sold Price $0 $3,400,000 $3,795,250 $0 -100%
Lowest Sold Price $0 $3,400,000 $3,795,250 $0 -100%
CONDOS Q1 2013 Q1 2014 Q1 2015 Q1 2016 Q1 2016 vs Q1 2015
Units Sold 6 11 11 10 -9%
Sold Dollar Volume $17,168,500 $35,367,500 $42,452,000 $30,308,000 -29%
For Sale at End of Quarter 43 51 53 54 2%
Avg MSI 21.5 10.2 8.8 27.0 207%
Avg DOM 151 136 85 146 72%
Avg List Price $3,135,667 $3,510,818 $4,029,909 $3,134,900 -22%
Avg Sale Price $2,861,417 $3,215,227 $3,859,273 $3,030,800 -21%
Median Sale Price $3,034,250 $3,050,000 $3,230,000 $2,530,125 -22%
Avg LP/Sq. Ft. $1,229 $1,260 $1,398 $1,128 -19%
Avg SP/Sq. Ft. $1,117 $1,146 $1,343 $1,089 -19%
Avg SP/OLP 91.25% 91.58% 95.77% 96.68% 1%
Highest Sold Price $4,900,000 $6,150,000 $7,500,000 $5,350,000 -29%
Lowest Sold Price $1,360,000 $1,675,000 $1,900,000 $1,300,000 -32%

Source: PCMLS 2012-2015. This material is based upon information that we consider reliable, but because it has been supplied by third parties, we cannot represent that it is accurate or complete, including price, or withdrawal without notice; square footage is an estimate only. ©MMXV Sotheby’s International Realty Affiliates, Inc. All Rights Reserved. Sotheby’s International Realty® is a licensed trademark to Sotheby’s International Realty Affiliates, Inc. An Equal Opportunity Company.
GLENWILD – SILVERCREEKThe statistics below compare 1st Quarter 2013 to 2016 for Glenwild/Silver Creek with a year-over-year percentage comparing 2016 to 2015. This private, gated golf community is situated within the Silver Creek area and features tremendous views of all three local ski areas plus a fabulous golf course and clubhouse. Glenwild is also conveniently located close to the Kimball Junction commercial area.
SINGLE FAMILY HOMES Q1 2013 Q1 2014 Q1 2015 Q1 2016 Q1 2016 vs Q1 2015
Units Sold 2 1 12 3 -75%
Sold Dollar Volume $1,743,500 $2,675,000 $17,342,786 $2,100,000 -88%
For Sale at End of Quarter 39 40 36 33 -8%
Avg MSI 39.0 40.0 5.1 16.5 224%
Avg DOM 67 1 195 176 -10%
Avg List Price $912,000 $2,815,800 $1,497,914 $742,967 -50%
Avg Sale Price $871,750 $2,675,000 $1,445,232 $700,000 -52%
Median Sale Price $871,750 $2,675,000 $1,345,250 $715,000 -47%
Avg LP/Sq. Ft. $156 $437 $309 $233 -25%
Avg SP/Sq. Ft. $151 $415 $298 $220 -26%
Avg SP/OLP 95.59% 95.00% 96.48% 94.22% -2%
Highest Sold Price $918,500 $2,675,000 $2,625,000 $745,000 -72%
Lowest Sold Price $825,000 $2,675,000 $646,458 $640,000 -1%
VACANT LAND Q1 2013 Q1 2014 Q1 2015 Q1 2016 Q1 2016 vs Q1 2015
Units Sold 6 11 8 3 -63%
Sold Dollar Volume $2,220,000 $8,573,500 $2,365,050 $1,144,000 -52%
For Sale at End of Quarter 53 41 58 50 -14%
Avg MSI 8.8 6.8 29.0 25.0 -14%
Avg DOM 248 394 263 92 -65%
Avg List Price $414,467 $829,036 $317,917 $401,000 26%
Avg Sale Price $370,000 $779,409 $295,631 $381,333 29%
Median Sale Price $372,500 $479,000 $315,000 $375,000 19%
Avg SP/OLP 89.27% 94.01% 92.99% 95.10% 2%
Highest Sold Price $490,000 $3,700,000 $475,000 $520,000 9%
Lowest Sold Price $225,000 $65,000 $160,000 $249,000 56%

Source: PCMLS 2012-2015. This material is based upon information that we consider reliable, but because it has been supplied by third parties, we cannot represent that it is accurate or complete, including price, or withdrawal without notice; square footage is an estimate only. ©MMXV Sotheby’s International Realty Affiliates, Inc. All Rights Reserved. Sotheby’s International Realty® is a licensed trademark to Sotheby’s International Realty Affiliates, Inc. An Equal Opportunity Company.
JEREMY RANCHThe statistics below compare 1st Quarter 2013 to 2016 for Jeremy Ranch with a year-over-year percentage comparing 2016 to 2015. Jeremy Ranch is a popular family community situated in the outskirts of Park City. In the center of the neighborhood, you’ll find the 18-hole Jeremy Ranch Golf & Country Club. Jeremy Ranch is located near I-80 and makes for a easy commute to Salt Lake City.
SINGLE FAMILY HOMES Q1 2013 Q1 2014 Q1 2015 Q1 2016 Q1 2016 vs Q1 2015
Units Sold 9 9 6 10 67%
Sold Dollar Volume $6,258,000 $8,106,500 $4,755,000 $9,423,500 98%
For Sale at End of Quarter 33 24 20 20 0%
Avg MSI 16.5 12.0 6.7 5.0 -25%
Avg DOM 175 88 191 119 -38%
Avg List Price $811,411 $945,217 $819,450 $976,500 19%
Avg Sale Price $695,333 $900,722 $792,500 $942,350 19%
Median Sale Price $680,000 $660,000 $812,500 $853,250 5%
Avg LP/Sq. Ft. $179 $189 $210 $236 12%
Avg SP/Sq. Ft. $156 $181 $203 $228 12%
Avg SP/OLP 85.69% 95.29% 96.71% 96.50% 0%
Highest Sold Price $1,027,500 $1,870,000 $957,000 $1,940,000 103%
Lowest Sold Price $417,000 $565,000 $537,000 $556,000 0.04
CONDOS Q1 2013 Q1 2014 Q1 2015 Q1 2016 Q1 2016 vs Q1 2015
Units Sold 3 2 3 0 -100%
Sold Dollar Volume $1,128,500 $1,000,000 $1,621,500 $0 -100%
For Sale at End of Quarter 5 3 2 3 50%
Avg MSI 2.5 3.0 0.7 0.0 -100%
Avg DOM 144 121 76 0 -100%
Avg List Price $386,567 $525,000 $547,667 $0 -100%
Avg Sale Price $376,167 $500,000 $540,500 $0 -100%
Median Sale Price $384,500 $500,000 $556,500 $0 -100%
Avg LP/Sq. Ft. $161 $201 $235 $0 -100%
Avg SP/Sq. Ft. $156 $191 $232 $0 -100%
Avg SP/OLP 97.31% 95.24% 98.69% 0.00% -100%
Highest Sold Price $459,000 $500,000 $599,000 $0 -100%
Lowest Sold Price $285,000 $500,000 $466,000 $0 -100%
VACANT LAND Q1 2013 Q1 2014 Q1 2015 Q1 2016 Q1 2016 vs Q1 2015
Units Sold 5 6 5 3 -40%
Sold Dollar Volume $893,000 $3,477,900 $1,267,000 $1,050,000 -17%
For Sale at End of Quarter 10 16 12 9 -25%
Avg MSI 3.3 5.3 6.0 9.0 50%
Avg DOM 368 98 243 38 -84%
Avg List Price $191,200 $638,150 $263,200 $368,000 40%
Avg Sale Price $178,600 $579,650 $253,400 $350,000 38%
Median Sale Price $165,000 $409,750 $240,000 $365,000 52%
Avg SP/OLP 93.41% 90.83% 96.28% 95.11% -1%
Highest Sold Price $233,000 $1,900,000 $340,000 $430,000 26%
Lowest Sold Price $150,000 $120,000 $190,000 $255,000 0.34
Source: PCMLS 2012-2015. This material is based upon information that we consider reliable, but because it has been supplied by third parties, we cannot represent that it is accurate or complete, including price, or withdrawal without notice; square footage is an estimate only. ©MMXV Sotheby’s International Realty Affiliates, Inc. All Rights Reserved. Sotheby’s International Realty® is a licensed trademark to Sotheby’s International Realty Affiliates, Inc. An Equal Opportunity Company.
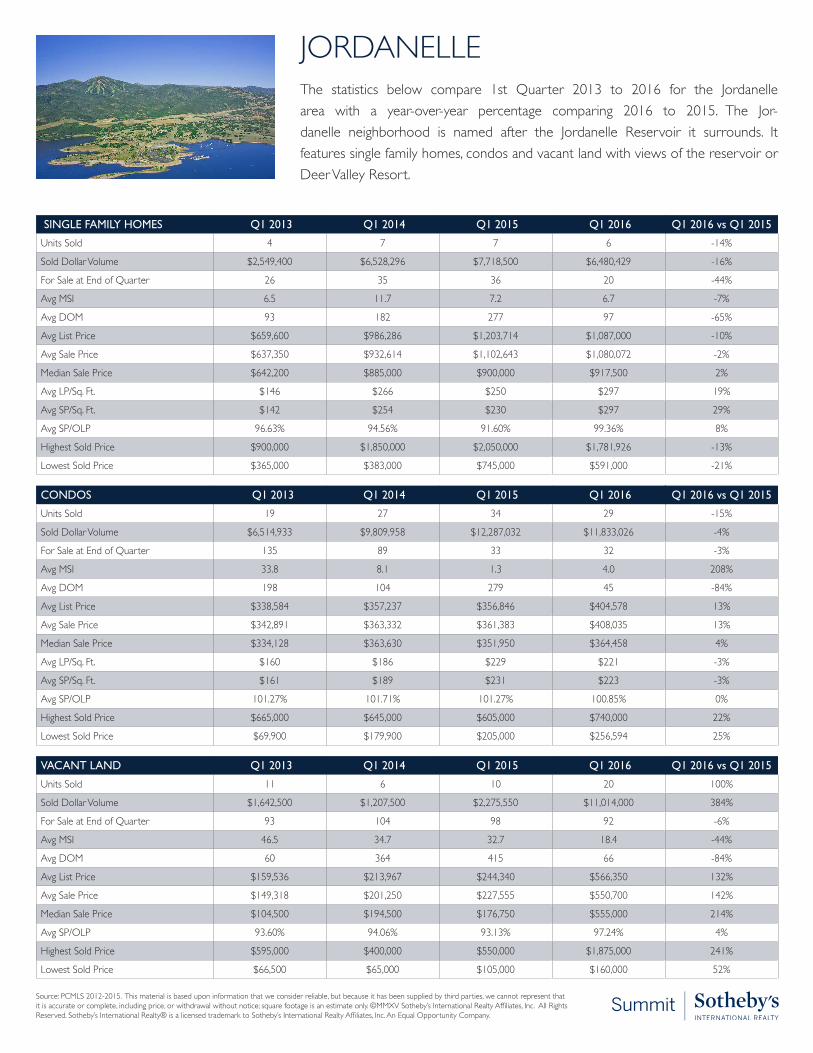
JORDANELLEThe statistics below compare 1st Quarter 2013 to 2016 for the Jordanelle area with a year-over-year percentage comparing 2016 to 2015. The Jor-danelle neighborhood is named after the Jordanelle Reservoir it surrounds. It features single family homes, condos and vacant land with views of the reservoir or Deer Valley Resort.
SINGLE FAMILY HOMES Q1 2013 Q1 2014 Q1 2015 Q1 2016 Q1 2016 vs Q1 2015
Units Sold 4 7 7 6 -14%
Sold Dollar Volume $2,549,400 $6,528,296 $7,718,500 $6,480,429 -16%
For Sale at End of Quarter 26 35 36 20 -44%
Avg MSI 6.5 11.7 7.2 6.7 -7%
Avg DOM 93 182 277 97 -65%
Avg List Price $659,600 $986,286 $1,203,714 $1,087,000 -10%
Avg Sale Price $637,350 $932,614 $1,102,643 $1,080,072 -2%
Median Sale Price $642,200 $885,000 $900,000 $917,500 2%
Avg LP/Sq. Ft. $146 $266 $250 $297 19%
Avg SP/Sq. Ft. $142 $254 $230 $297 29%
Avg SP/OLP 96.63% 94.56% 91.60% 99.36% 8%
Highest Sold Price $900,000 $1,850,000 $2,050,000 $1,781,926 -13%
Lowest Sold Price $365,000 $383,000 $745,000 $591,000 -21%
CONDOS Q1 2013 Q1 2014 Q1 2015 Q1 2016 Q1 2016 vs Q1 2015
Units Sold 19 27 34 29 -15%
Sold Dollar Volume $6,514,933 $9,809,958 $12,287,032 $11,833,026 -4%
For Sale at End of Quarter 135 89 33 32 -3%
Avg MSI 33.8 8.1 1.3 4.0 208%
Avg DOM 198 104 279 45 -84%
Avg List Price $338,584 $357,237 $356,846 $404,578 13%
Avg Sale Price $342,891 $363,332 $361,383 $408,035 13%
Median Sale Price $334,128 $363,630 $351,950 $364,458 4%
Avg LP/Sq. Ft. $160 $186 $229 $221 -3%
Avg SP/Sq. Ft. $161 $189 $231 $223 -3%
Avg SP/OLP 101.27% 101.71% 101.27% 100.85% 0%
Highest Sold Price $665,000 $645,000 $605,000 $740,000 22%
Lowest Sold Price $69,900 $179,900 $205,000 $256,594 25%
VACANT LAND Q1 2013 Q1 2014 Q1 2015 Q1 2016 Q1 2016 vs Q1 2015
Units Sold 11 6 10 20 100%
Sold Dollar Volume $1,642,500 $1,207,500 $2,275,550 $11,014,000 384%
For Sale at End of Quarter 93 104 98 92 -6%
Avg MSI 46.5 34.7 32.7 18.4 -44%
Avg DOM 60 364 415 66 -84%
Avg List Price $159,536 $213,967 $244,340 $566,350 132%
Avg Sale Price $149,318 $201,250 $227,555 $550,700 142%
Median Sale Price $104,500 $194,500 $176,750 $555,000 214%
Avg SP/OLP 93.60% 94.06% 93.13% 97.24% 4%
Highest Sold Price $595,000 $400,000 $550,000 $1,875,000 241%
Lowest Sold Price $66,500 $65,000 $105,000 $160,000 52%

Source: PCMLS 2012-2015. This material is based upon information that we consider reliable, but because it has been supplied by third parties, we cannot represent that it is accurate or complete, including price, or withdrawal without notice; square footage is an estimate only. ©MMXV Sotheby’s International Realty Affiliates, Inc. All Rights Reserved. Sotheby’s International Realty® is a licensed trademark to Sotheby’s International Realty Affiliates, Inc. An Equal Opportunity Company.
KIMBALL JUNCTIONThe statistics below compare 1st Quarter 2013 to 2016 for Kimball Junction with a year-over-year percentage comparing 2016 to 2015. Kimball Junction offers charming single family homes for sale, comfortable condominiums and a constantly growing number of amenities.
SINGLE FAMILY HOMES Q1 2013 Q1 2014 Q1 2015 Q1 2016 Q1 2016 vs Q1 2015
Units Sold 1 2 2 2 0%
Sold Dollar Volume $499,000 $892,000 $951,500 $1,034,500 9%
For Sale at End of Quarter 5 1 0 2 200%
Avg MSI 5.0 0.0 0.0 2.0 200%
Avg DOM 242 747 31 20 -35%
Avg List Price $505,000 $462,000 $491,950 $537,500 9%
Avg Sale Price $499,000 $446,000 $475,750 $517,250 9%
Median Sale Price $499,000 $446,000 $475,750 $517,250 9%
Avg LP/Sq. Ft. $265 $207 $294 $296 1%
Avg SP/Sq. Ft. $262 $200 $287 $285 -1%
Avg SP/OLP 98.81% 96.54% 96.71% 96.23% 0%
Highest Sold Price $499,000 $490,000 $492,500 $522,000 6%
Lowest Sold Price $499,000 $402,000 $459,000 $512,500 12%
CONDOS Q1 2013 Q1 2014 Q1 2015 Q1 2016 Q1 2016 vs Q1 2015
Units Sold 9 11 14 13 -7%
Sold Dollar Volume $2,022,800 $2,499,900 $3,762,330 $4,561,250 21%
For Sale at End of Quarter 24 48 34 10 -71%
Avg MSI 6.0 9.6 6.8 1.4 -79%
Avg DOM 68 40 32 63 97%
Avg List Price $234,833 $235,450 $276,905 $360,642 30%
Avg Sale Price $224,756 $227,264 $268,738 $350,865 31%
Median Sale Price $265,000 $203,000 $267,900 $350,000 31%
Avg LP/Sq. Ft. $206 $239 $254 $321 26%
Avg SP/Sq. Ft. $199 $229 $245 $312 27%
Avg SP/OLP 95.71% 96.52% 97.05% 97.29% 0%
Highest Sold Price $360,000 $459,000 $432,485 $540,000 25%
Lowest Sold Price $112,000 $107,500 $115,000 $129,250 0.12

Source: PCMLS 2012-2015. This material is based upon information that we consider reliable, but because it has been supplied by third parties, we cannot represent that it is accurate or complete, including price, or withdrawal without notice; square footage is an estimate only. ©MMXV Sotheby’s International Realty Affiliates, Inc. All Rights Reserved. Sotheby’s International Realty® is a licensed trademark to Sotheby’s International Realty Affiliates, Inc. An Equal Opportunity Company.
LOWER DEER VALLEY® RESORTThe statistics below compare 1st Quarter 2013 to 2016 for Lower Deer Valley with a year-over-year percentage comparing 2016 to 2015. Many of the homes and condominiums for sale in Lower Deer Valley have fantastic views and are all within a mile from the lift. Real estate here is in great demand during all four seasons due to its ideal location with close proximity to both slopes and Main Street.
SINGLE FAMILY HOMES Q1 2013 Q1 2014 Q1 2015 Q1 2016 Q1 2016 vs Q1 2015
Units Sold 8 4 5 3 -40%
Sold Dollar Volume $9,540,000 $8,415,000 $11,185,000 $5,790,000 -48%
For Sale at End of Quarter 29 19 14 12 -14%
Avg MSI 4.8 6.3 7.0 12.0 71%
Avg DOM 187 203 143 163 14%
Avg List Price $1,279,750 $2,279,250 $2,425,000 $2,116,333 -13%
Avg Sale Price $1,192,500 $2,103,750 $2,237,000 $1,930,000 -14%
Median Sale Price $1,020,000 $2,120,000 $2,225,000 $2,100,000 -6%
Avg LP/Sq. Ft. $292 $403 $409 $290 -29%
Avg SP/Sq. Ft. $273 $372 $379 $268 -29%
Avg SP/OLP 93.18% 92.30% 92.25% 91.20% -1%
Highest Sold Price $2,000,000 $2,875,000 $2,800,000 $2,200,000 -21%
Lowest Sold Price $835,000 $1,300,000 $1,675,000 $1,490,000 -11%
CONDOS Q1 2013 Q1 2014 Q1 2015 Q1 2016 Q1 2016 vs Q1 2015
Units Sold 10 10 21 11 -48%
Sold Dollar Volume $9,035,550 $7,949,800 $16,940,050 $11,360,500 -33%
For Sale at End of Quarter 50 51 34 28 -18%
Avg MSI 50.0 10.2 5.7 7.0 23%
Avg DOM 260 305 98 145 48%
Avg List Price $932,650 $834,950 $839,590 $1,085,991 29%
Avg Sale Price $903,555 $794,980 $806,669 $1,032,773 28%
Median Sale Price $646,525 $750,250 $800,000 $780,000 -3%
Avg LP/Sq. Ft. $450 $394 $405 $452 12%
Avg SP/Sq. Ft. $434 $378 $388 $429 11%
Avg SP/OLP 96.88% 95.21% 96.08% 95.10% -1%
Highest Sold Price $2,350,000 $1,175,000 $1,285,000 $3,800,000 196%
Lowest Sold Price $550,000 $560,000 $569,050 $500,000 -12%
VACANT LAND Q1 2013 Q1 2014 Q1 2015 Q1 2016 Q1 2016 vs Q1 2015
4 0 4 2 -50% -100%
$1,858,000 $0 $2,120,870 $1,280,000 -40% -100%
15 15 8 8 0% -77%
7.5 0.0 4.0 0.0 -100% 0%
721 0 469 137 -71% -100%
$559,500 $0 $548,625 $674,000 23% -100%
$464,500 $0 $530,218 $640,000 21% -100%
$439,500 $0 $532,000 $640,000 20% -100%
83.02% 0.00% 96.64% 94.96% -2% -100%
$630,000 $0 $677,370 $700,000 3% -100%
$349,000 $0 $379,500 $580,000 53% -100%

Source: PCMLS 2012-2015. This material is based upon information that we consider reliable, but because it has been supplied by third parties, we cannot represent that it is accurate or complete, including price, or withdrawal without notice; square footage is an estimate only. ©MMXV Sotheby’s International Realty Affiliates, Inc. All Rights Reserved. Sotheby’s International Realty® is a licensed trademark to Sotheby’s International Realty Affiliates, Inc. An Equal Opportunity Company.
UPPER DEER VALLEY® RESORTThe statistics below compare 1st Quarter 2013 to 2016 for Upper Deer Valley with a year-over-year percentage comparing 2016 to 2015. Known as Park City’s first min-ing settlement, Silver Lake Village is located in Upper Deer Valley. The Upper Deer Valley real estate area is a very popular site for single family subdivisions and luxury condominium lodges.
SINGLE FAMILY HOMES Q1 2013 Q1 2014 Q1 2015 Q1 2016 Q1 2016 vs Q1 2015
Units Sold 5 4 5 6 20%Sold Dollar Volume $16,167,500 $27,572,000 $17,736,250 $46,626,580 163%For Sale at End of Quarter 22 22 28 28 0%Avg MSI 22.0 22.0 9.3 9.3 0%Avg DOM 289 210 103 132 28%Avg List Price $3,546,000 $7,582,500 $3,730,800 $8,473,333 127%Avg Sale Price $3,233,500 $6,893,000 $3,547,250 $7,771,097 119%Median Sale Price $2,750,000 $6,061,000 $2,725,000 $7,907,875 190%Avg LP/Sq. Ft. $611 $833 $593 $1,026 73%Avg SP/Sq. Ft. $554 $760 $564 $973 73%Avg SP/OLP 91.19% 90.91% 95.08% 91.71% -4%
CONDOS Q1 2013 Q1 2014 Q1 2015 Q1 2016 Q1 2016 vs Q1 2015
Units Sold 11 9 7 5 -29%Sold Dollar Volume $19,577,500 $12,002,550 $9,636,203 $7,076,999 -27%For Sale at End of Quarter 39 42 59 33 -44%Avg MSI 6.5 7.0 29.5 33.0 12%Avg DOM 309 180 143 218 52%Avg List Price $1,908,818 $1,387,444 $1,441,136 $1,506,900 5%Avg Sale Price $1,779,773 $1,333,617 $1,376,600 $1,415,400 3%Median Sale Price $1,950,000 $1,325,000 $1,050,000 $1,252,000 19%Avg LP/Sq. Ft. $646 $543 $646 $668 3%Avg SP/Sq. Ft. $603 $521 $618 $630 2%Avg SP/OLP 93.24% 96.12% 95.52% 93.93% -2%

Source: PCMLS 2012-2015. This material is based upon information that we consider reliable, but because it has been supplied by third parties, we cannot represent that it is accurate or complete, including price, or withdrawal without notice; square footage is an estimate only. ©MMXV Sotheby’s International Realty Affiliates, Inc. All Rights Reserved. Sotheby’s International Realty® is a licensed trademark to Sotheby’s International Realty Affiliates, Inc. An Equal Opportunity Company.
OLD RANCH ROADThe statistics below compare 1st Quarter 2013 to 2016 for the Old Ranch Road area with a year-over-year percentage comparing 2016 to 2015. This area located near the Canyons Village at Park City, offers some great opportunities to buy equestrian property with amazing ski area views. Also located in the Old Ranch Road area is the luxury home subdivision of Willow Creek Estates.
SINGLE FAMILY HOMES Q1 2013 Q1 2014 Q1 2015 Q1 2016 Q1 2016 vs Q1 2015
Units Sold 1 3 3 2 -33%
Sold Dollar Volume $2,033,750 $5,682,000 $7,165,000 $3,956,500 -45%
For Sale at End of Quarter 8 7 12 12 0%
Avg MSI 0.0 0.0 4.0 0.0 -100%
Avg DOM 191 157 9 172 1811%
Avg List Price $2,195,000 $2,095,000 $2,498,333 $2,024,000 -19%
Avg Sale Price $2,033,750 $1,894,000 $2,388,333 $1,978,250 -17%
Median Sale Price $2,033,750 $1,720,000 $3,000,000 $1,978,250 -34%
Avg LP/Sq. Ft. $357 $473 $561 $419 -25%
Avg SP/Sq. Ft. $330 $425 $537 $408 -24%
Avg SP/OLP 92.65% 90.41% 95.60% 97.74% 2%
Highest Sold Price $2,033,750 $2,437,000 $3,300,000 $2,138,500 -35%
Lowest Sold Price $2,033,750 $1,525,000 $865,000 $1,818,000 110%
VACANT LAND Q1 2013 Q1 2014 Q1 2015 Q1 2016 Q1 2016 vs Q1 2015
Units Sold 2 3 1 2 100%
Sold Dollar Volume $1,887,500 $4,025,335 $610,000 $1,379,000 126%
For Sale at End of Quarter 5 4 4 5 25%
Avg MSI 5.0 4.0 4.0 0.0 -100%
Avg DOM 259 73 517 196 -62%
Avg List Price $1,047,500 $1,398,300 $649,000 $662,000 2%
Avg Sale Price $943,750 $1,341,778 $610,000 $689,500 13%
Median Sale Price $943,750 $1,499,900 $610,000 $689,500 13%
Avg SP/OLP 90.10% 95.96% 93.99% 104.15% 11%
Highest Sold Price $1,050,000 $1,872,435 $610,000 $904,000 48%
Lowest Sold Price $837,500 $653,000 $610,000 $475,000 -22%

Source: PCMLS 2012-2015. This material is based upon information that we consider reliable, but because it has been supplied by third parties, we cannot represent that it is accurate or complete, including price, or withdrawal without notice; square footage is an estimate only. ©MMXV Sotheby’s International Realty Affiliates, Inc. All Rights Reserved. Sotheby’s International Realty® is a licensed trademark to Sotheby’s International Realty Affiliates, Inc. An Equal Opportunity Company.
OLD TOWNThe statistics below compare 1st Quarter 2013 to 2016 for Old Town with a year-over-year percentage comparing 2016 to 2015. This area is situated between Park City Resort, Lower Deer Valley® Resort, Aerie and Prospector. As a result of historical preservation, the Old Town area has retained its small, old-western mining town charm.
SINGLE FAMILY HOMES Q1 2013 Q1 2014 Q1 2015 Q1 2016 Q1 2016 vs Q1 2015
Units Sold 13 12 12 9 -25%
Sold Dollar Volume $18,335,420 $13,807,000 $16,216,000 $12,310,000 -24%
For Sale at End of Quarter 47 33 40 45 13%
Avg MSI 9.4 11.0 13.3 45.0 238%
Avg DOM 154 144 130 90 -31%
Avg List Price $1,546,445 $1,202,490 $1,435,083 $1,436,889 0%
Avg Sale Price $1,410,417 $1,150,583 $1,351,333 $1,367,778 1%
Median Sale Price $769,000 $1,252,500 $1,130,000 $1,500,000 33%
Avg LP/Sq. Ft. $504 $591 $643 $637 -1%
Avg SP/Sq. Ft. $466 $562 $602 $608 1%
Avg SP/OLP 91.20% 95.68% 94.16% 95.19% 1%
Highest Sold Price $7,973,920 $2,050,000 $2,600,000 $1,950,000 -25%
Lowest Sold Price $344,000 $500,000 $365,000 $765,000 110%
CONDOS Q1 2013 Q1 2014 Q1 2015 Q1 2016 Q1 2016 vs Q1 2015
Units Sold 32 46 26 17 -35%
Sold Dollar Volume $22,736,260 $27,526,325 $19,029,300 $11,026,905 -42%
For Sale at End of Quarter 115 80 69 69 0%
Avg MSI 12.8 4.2 6.3 17.3 175%
Avg DOM 263 137 63 41 -35%
Avg List Price $747,190 $624,428 $746,462 $672,512 -10%
Avg Sale Price $710,508 $598,398 $731,896 $648,641 -11%
Median Sale Price $552,500 $430,500 $465,000 $500,000 8%
Avg LP/Sq. Ft. $402 $396 $508 $519 2%
Avg SP/Sq. Ft. $385 $380 $499 $501 0%
Avg SP/OLP 95.09% 95.83% 98.05% 96.45% -2%
Highest Sold Price $2,150,000 $1,950,000 $3,532,800 $3,324,905 -6%
Lowest Sold Price $135,900 $112,750 $140,000 $233,000 66%
VACANT LAND Q1 2013 Q1 2014 Q1 2015 Q1 2016 Q1 2016 vs Q1 2015
Units Sold 3 0 2 2 0%
Sold Dollar Volume $940,900 $0 $2,300,000 $1,575,000 -32%
For Sale at End of Quarter 7 6 5 7 40%
Avg MSI 7.0 0.0 2.5 0.0 -100%
Avg DOM 397 0 3 5 67%
Avg List Price $344,333 $0 $1,187,500 $856,500 -28%
Avg Sale Price $313,633 $0 $1,150,000 $787,500 -32%
Median Sale Price $235,900 $0 $1,150,000 $787,500 -32%
Avg SP/OLP 91.08% 0.00% 96.84% 91.94% -5%
Highest Sold Price $525,000 $0 $1,775,000 $1,050,000 -41%
Lowest Sold Price $180,000 $0 $525,000 $525,000 0%

Source: PCMLS 2012-2015. This material is based upon information that we consider reliable, but because it has been supplied by third parties, we cannot represent that it is accurate or complete, including price, or withdrawal without notice; square footage is an estimate only. ©MMXV Sotheby’s International Realty Affiliates, Inc. All Rights Reserved. Sotheby’s International Realty® is a licensed trademark to Sotheby’s International Realty Affiliates, Inc. An Equal Opportunity Company.
PARK MEADOWSThe statistics below compare 1st Quarter 2013 to 2016 for Park Meadows with a year-over-year percentage comparing 2016 to 2015. The Park Meadows subdivision is located in town and is the largest community in the Park City limits. Much of the area has ski resort views of Park City and Deer Valley and contains many luxury homes throughout the community and golf course.
SINGLE FAMILY HOMES Q1 2013 Q1 2014 Q1 2015 Q1 2016 Q1 2016 vs Q1 2015
Units Sold 12 13 11 10 -9%
Sold Dollar Volume $23,208,840 $22,348,850 $17,216,000 $14,375,500 -16%
For Sale at End of Quarter 33 27 27 16 -41%
Avg MSI 8.3 3.4 6.8 5.3 -22%
Avg DOM 267 201 122 76 -38%
Avg List Price $2,078,920 $1,779,115 $1,632,945 $1,518,500 -7%
Avg Sale Price $1,934,070 $1,719,142 $1,565,091 $1,437,550 -8%
Median Sale Price $1,660,000 $1,300,000 $1,505,000 $1,274,500 -15%
Avg LP/Sq. Ft. $327 $370 $337 $377 12%
Avg SP/Sq. Ft. $305 $358 $325 $358 10%
Avg SP/OLP 93.03% 96.63% 95.84% 94.67% -1%
Highest Sold Price $4,475,000 $4,050,000 $3,400,000 $2,800,000 -18%
Lowest Sold Price $648,090 $617,500 $831,000 $815,000 -2%
CONDOS Q1 2013 Q1 2014 Q1 2015 Q1 2016 Q1 2016 vs Q1 2015
Units Sold 6 5 9 4 -56%
Sold Dollar Volume $4,295,500 $4,930,000 $7,986,950 $6,663,500 -17%
For Sale at End of Quarter 17 14 14 6 -57%
Avg MSI 17.0 0.0 7.0 3.0 -57%
Avg DOM 67 54 83 70 -16%
Avg List Price $752,317 $1,011,000 $899,778 $1,699,725 89%
Avg Sale Price $715,917 $986,000 $887,439 $1,665,875 88%
Median Sale Price $602,500 $865,000 $585,000 $1,787,500 206%
Avg LP/Sq. Ft. $265 $346 $369 $478 30%
Avg SP/Sq. Ft. $254 $337 $363 $467 29%
Avg SP/OLP 95.16% 97.53% 98.63% 98.01% -1%
Highest Sold Price $1,430,000 $1,737,000 $2,285,000 $2,690,000 18%
Lowest Sold Price $365,500 $409,000 $385,000 $398,500 0.04
VACANT LAND Q1 2013 Q1 2014 Q1 2015 Q1 2016 Q1 2016 vs Q1 2015
Units Sold 3 1 0 2 200%
Sold Dollar Volume $1,395,000 $1,125,000 $0 $1,325,000 132500000%
For Sale at End of Quarter 7 6 4 8 100%
Avg MSI 7.0 6.0 0.0 0.0 0%
Avg DOM 247 180 0 128 12800%
Avg List Price $512,000 $1,200,000 $0 $724,500 72450000%
Avg Sale Price $465,000 $1,125,000 $0 $662,500 66250000%
Median Sale Price $450,000 $1,125,000 $0 $662,500 66250000%
Avg SP/OLP 90.82% 93.75% 0.00% 91.44% 91%
Highest Sold Price $560,000 $1,125,000 $0 $750,000 75000000%
Lowest Sold Price $385,000 $1,125,000 $0 $575,000 57500000%

Source: PCMLS 2012-2015. This material is based upon information that we consider reliable, but because it has been supplied by third parties, we cannot represent that it is accurate or complete, including price, or withdrawal without notice; square footage is an estimate only. ©MMXV Sotheby’s International Realty Affiliates, Inc. All Rights Reserved. Sotheby’s International Realty® is a licensed trademark to Sotheby’s International Realty Affiliates, Inc. An Equal Opportunity Company.
PINEBROOKThe statistics below compare 1st Quarter 2013 to 2016 for Pinebrook with a year-over-year percentage comparing 2016 to 2015. Pinebrook is another great family neighborhood for full-time residents. Shopping and entertainment are close by and the Pinebrook area has its own private trail system for great hiking and biking near your home. It offers an easy commute to Salt Lake City.
SINGLE FAMILY HOMES Q1 2013 Q1 2014 Q1 2015 Q1 2016 Q1 2016 vs Q1 2015
Units Sold 10 10 10 5 -50%
Sold Dollar Volume $7,039,500 $7,092,000 $8,731,750 $4,531,000 -48%
For Sale at End of Quarter 21 21 15 13 -13%
Avg MSI 5.3 5.3 5.0 4.3 -14%
Avg DOM 111 62 83 21 -75%
Avg List Price $737,340 $726,320 $920,000 $948,280 3%
Avg Sale Price $703,950 $709,200 $873,175 $906,200 4%
Median Sale Price $625,000 $740,000 $894,250 $950,000 6%
Avg LP/Sq. Ft. $168 $195 $193 $216 12%
Avg SP/Sq. Ft. $162 $190 $184 $206 12%
Avg SP/OLP 95.47% 97.64% 94.91% 95.56% 1%
Highest Sold Price $1,110,000 $858,000 $1,200,000 $980,000 -18%
Lowest Sold Price $395,500 $390,000 $600,000 $781,000 30%
CONDOS Q1 2013 Q1 2014 Q1 2015 Q1 2016 Q1 2016 vs Q1 2015
Units Sold 6 7 11 6 -45%
Sold Dollar Volume $1,789,400 $2,531,100 $4,369,901 $2,820,000 -35%
For Sale at End of Quarter 7 14 9 6 -33%
Avg MSI 2.3 14.0 4.5 6.0 33%
Avg DOM 143 67 115 58 -50%
Avg List Price $307,817 $368,057 $394,959 $479,133 21%
Avg Sale Price $298,233 $361,586 $397,264 $470,000 18%
Median Sale Price $296,550 $370,000 $416,293 $467,500 12%
Avg LP/Sq. Ft. $188 $228 $246 $252 2%
Avg SP/Sq. Ft. $182 $225 $247 $246 0%
Avg SP/OLP 96.89% 98.24% 100.58% 98.09% -2%
Highest Sold Price $430,000 $470,000 $590,000 $647,000 10%
Lowest Sold Price $154,300 $175,000 $241,500 $300,000 24%
VACANT LAND Q1 2013 Q1 2014 Q1 2015 Q1 2016 Q1 2016 vs Q1 2015
Units Sold 5 1 2 2 0%
Sold Dollar Volume $936,300 $250,000 $410,000 $334,500 -18%
For Sale at End of Quarter 15 11 14 7 -50%
Avg MSI 7.5 0.0 0.0 0.0 0%
Avg DOM 207 337 155 328 112%
Avg List Price $204,980 $299,000 $229,000 $184,900 -19%
Avg Sale Price $187,260 $250,000 $205,000 $167,250 -18%
Median Sale Price $184,300 $250,000 $205,000 $167,250 -18%
Avg SP/OLP 91.36% 83.61% 89.52% 90.45% 1%
Highest Sold Price $225,000 $250,000 $225,000 $190,000 -16%
Lowest Sold Price $157,000 $250,000 $185,000 $144,500 -22%
Source: PCMLS 2012-2015. This material is based upon information that we consider reliable, but because it has been supplied by third parties, we cannot represent that it is accurate or complete, including price, or withdrawal without notice; square footage is an estimate only. ©MMXV Sotheby’s International Realty Affiliates, Inc. All Rights Reserved. Sotheby’s International Realty® is a licensed trademark to Sotheby’s International Realty Affiliates, Inc. An Equal Opportunity Company.
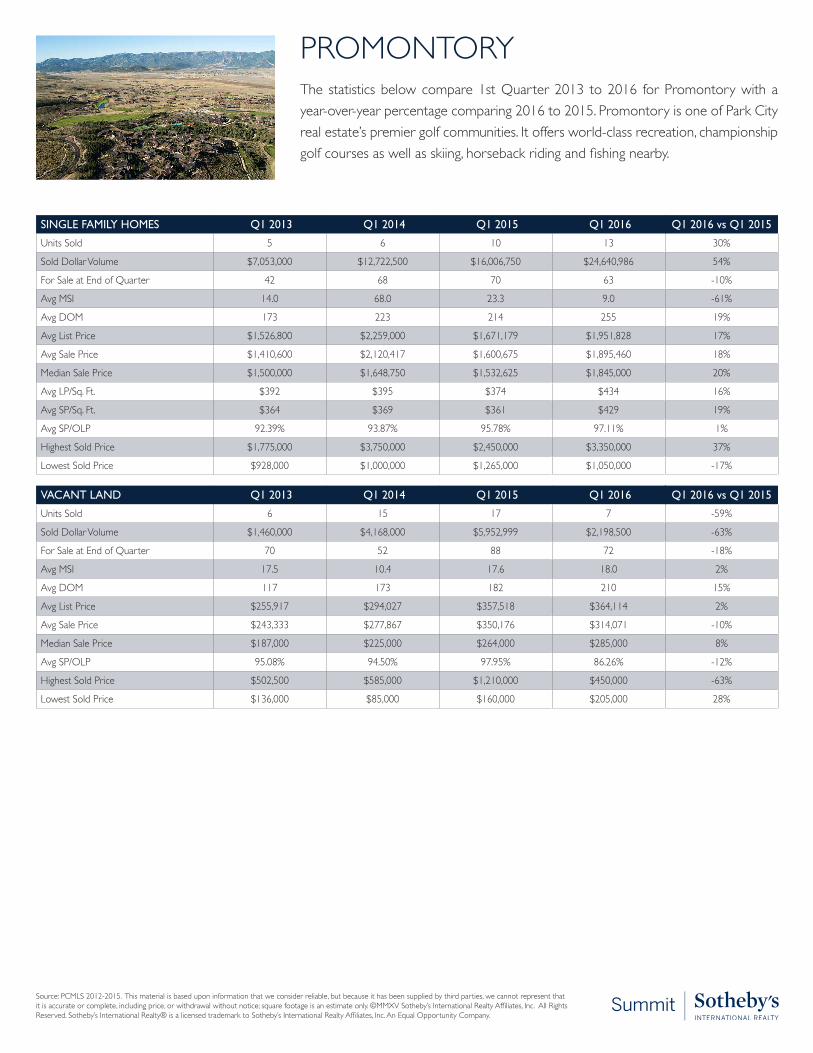
PROMONTORYThe statistics below compare 1st Quarter 2013 to 2016 for Promontory with a year-over-year percentage comparing 2016 to 2015. Promontory is one of Park City real estate’s premier golf communities. It offers world-class recreation, championship golf courses as well as skiing, horseback riding and fishing nearby.
SINGLE FAMILY HOMES Q1 2013 Q1 2014 Q1 2015 Q1 2016 Q1 2016 vs Q1 2015
Units Sold 5 6 10 13 30%
Sold Dollar Volume $7,053,000 $12,722,500 $16,006,750 $24,640,986 54%
For Sale at End of Quarter 42 68 70 63 -10%
Avg MSI 14.0 68.0 23.3 9.0 -61%
Avg DOM 173 223 214 255 19%
Avg List Price $1,526,800 $2,259,000 $1,671,179 $1,951,828 17%
Avg Sale Price $1,410,600 $2,120,417 $1,600,675 $1,895,460 18%
Median Sale Price $1,500,000 $1,648,750 $1,532,625 $1,845,000 20%
Avg LP/Sq. Ft. $392 $395 $374 $434 16%
Avg SP/Sq. Ft. $364 $369 $361 $429 19%
Avg SP/OLP 92.39% 93.87% 95.78% 97.11% 1%
Highest Sold Price $1,775,000 $3,750,000 $2,450,000 $3,350,000 37%
Lowest Sold Price $928,000 $1,000,000 $1,265,000 $1,050,000 -17%
VACANT LAND Q1 2013 Q1 2014 Q1 2015 Q1 2016 Q1 2016 vs Q1 2015
Units Sold 6 15 17 7 -59%
Sold Dollar Volume $1,460,000 $4,168,000 $5,952,999 $2,198,500 -63%
For Sale at End of Quarter 70 52 88 72 -18%
Avg MSI 17.5 10.4 17.6 18.0 2%
Avg DOM 117 173 182 210 15%
Avg List Price $255,917 $294,027 $357,518 $364,114 2%
Avg Sale Price $243,333 $277,867 $350,176 $314,071 -10%
Median Sale Price $187,000 $225,000 $264,000 $285,000 8%
Avg SP/OLP 95.08% 94.50% 97.95% 86.26% -12%
Highest Sold Price $502,500 $585,000 $1,210,000 $450,000 -63%
Lowest Sold Price $136,000 $85,000 $160,000 $205,000 28%

Source: PCMLS 2012-2015. This material is based upon information that we consider reliable, but because it has been supplied by third parties, we cannot represent that it is accurate or complete, including price, or withdrawal without notice; square footage is an estimate only. ©MMXV Sotheby’s International Realty Affiliates, Inc. All Rights Reserved. Sotheby’s International Realty® is a licensed trademark to Sotheby’s International Realty Affiliates, Inc. An Equal Opportunity Company.
PROSPECTORThe statistics below compare 1st Quarter 2013 to 2016 for Prospector with a year-over-year percentage comparing 2016 to 2015. Prospector is a locals favorite for convenience and affordability. Located on the bus route and close to shopping, schools, movie theaters, the Rail Trail and Prospector Square, Prospector is well known for its Victorian-style architecture and neighborhood park and playground.
SINGLE FAMILY HOMES Q1 2013 Q1 2014 Q1 2015 Q1 2016 Q1 2016 vs Q1 2015
Units Sold 2 2 1 1 0%
Sold Dollar Volume $2,165,000 $1,880,000 $1,235,000 $750,000 -39%
For Sale at End of Quarter 8 6 3 2 -33%
Avg MSI 8.0 6.0 3.0 0.0 -100%
Avg DOM 78 4 179 1 -99%
Avg List Price $1,135,000 $947,000 $1,269,000 $750,000 -41%
Avg Sale Price $1,082,500 $940,000 $1,235,000 $750,000 -39%
Median Sale Price $1,082,500 $940,000 $1,235,000 $750,000 -39%
Avg LP/Sq. Ft. $248 $263 $241 $379 57%
Avg SP/Sq. Ft. $238 $260 $235 $379 61%
Avg SP/OLP 95.37% 99.26% 97.32% 100.00% 3%
Highest Sold Price $1,300,000 $1,195,000 $1,235,000 $750,000 -39%
Lowest Sold Price $865,000 $685,000 $1,235,000 $750,000 -39%
CONDOS Q1 2013 Q1 2014 Q1 2015 Q1 2016 Q1 2016 vs Q1 2015
Units Sold 9 4 10 7 -30%
Sold Dollar Volume $1,348,100 $674,900 $3,406,400 $895,500 -74%
For Sale at End of Quarter 16 20 21 25 19%
Avg MSI 8.0 20.0 7.0 8.3 19%
Avg DOM 75 56 113 21 -81%
Avg List Price $153,683 $176,325 $346,430 $135,707 -61%
Avg Sale Price $149,789 $168,725 $340,640 $127,929 -62%
Median Sale Price $93,000 $157,450 $271,450 $120,000 -56%
Avg LP/Sq. Ft. $197 $242 $267 $329 23%
Avg SP/Sq. Ft. $189 $232 $261 $307 18%
Avg SP/OLP 97.47% 95.69% 98.33% 94.27% -4%
Highest Sold Price $389,000 $245,000 $650,000 $275,000 -58%
Lowest Sold Price $47,200 $115,000 $94,000 $70,000 -26%

Source: PCMLS 2012-2015. This material is based upon information that we consider reliable, but because it has been supplied by third parties, we cannot represent that it is accurate or complete, including price, or withdrawal without notice; square footage is an estimate only. ©MMXV Sotheby’s International Realty Affiliates, Inc. All Rights Reserved. Sotheby’s International Realty® is a licensed trademark to Sotheby’s International Realty Affiliates, Inc. An Equal Opportunity Company.
SILVER SPRINGSThe statistics below compare 1st Quarter 2013 to 2016 for Silver Springs with a year-over-year percentage comparing 2016 to 2015. Silver Springs is home for many local residents and is located on next to the Swaner Nature Preserve. It is a peaceful neighborhood with private lakes, tennis courts, basketball courts, volleyball courts, children’s playgrounds, and a picnic pavilion.
SINGLE FAMILY HOMES Q1 2013 Q1 2014 Q1 2015 Q1 2016 Q1 2016 vs Q1 2015
Units Sold 7 7 4 4 0%
Sold Dollar Volume $4,284,000 $5,136,500 $4,363,000 $3,478,000 -20%
For Sale at End of Quarter 8 8 5 4 -20%
Avg MSI 1.1 4.0 1.7 2.0 18%
Avg DOM 26 83 28 90 221%
Avg List Price $642,857 $759,571 $1,160,250 $890,000 -23%
Avg Sale Price $612,000 $733,786 $1,090,750 $869,500 -20%
Median Sale Price $598,000 $765,000 $1,104,000 $862,500 -22%
Avg LP/Sq. Ft. $242 $270 $333 $278 -17%
Avg SP/Sq. Ft. $231 $261 $315 $272 -14%
Avg SP/OLP 95.20% 96.61% 94.01% 97.70% 4%
Highest Sold Price $778,000 $955,000 $1,300,000 $958,000 -26%
Lowest Sold Price $507,000 $568,500 $855,000 $795,000 -7%
CONDOS Q1 2013 Q1 2014 Q1 2015 Q1 2016 Q1 2016 vs Q1 2015
Units Sold 0 0 1 0 -100%
Sold Dollar Volume $0 $0 $489,000 $0 -100%
For Sale at End of Quarter 2 1 2 1 -50%
Avg MSI 0.0 0.0 0.0 0.0 0%
Avg DOM 0 0 4 0 -100%
Avg List Price $0 $0 $495,000 $0 -100%
Avg Sale Price $0 $0 $489,000 $0 -100%
Median Sale Price $0 $0 $489,000 $0 -100%
Avg LP/Sq. Ft. $0 $0 $263 $0 -100%
Avg SP/Sq. Ft. $0 $0 $259 $0 -100%
Avg SP/OLP 0.00% 0.00% 98.79% 0.00% -100%
Highest Sold Price $0 $0 $489,000 $0 -100%
Lowest Sold Price $0 $0 $489,000 $0 -100%

Source: PCMLS 2012-2015. This material is based upon information that we consider reliable, but because it has been supplied by third parties, we cannot represent that it is accurate or complete, including price, or withdrawal without notice; square footage is an estimate only. ©MMXV Sotheby’s International Realty Affiliates, Inc. All Rights Reserved. Sotheby’s International Realty® is a licensed trademark to Sotheby’s International Realty Affiliates, Inc. An Equal Opportunity Company.
SUMMIT PARK The statistics below compare 1st Quarter 2013 to 2016 for Summit Park with a year-over-year percentage comparing 2016 to 2015. Summit Park is tucked on the ridges at the top of Parley’s Summit and features mountain living that is just minutes to Park City and Salt Lake City.
SINGLE FAMILY HOMES Q1 2013 Q1 2014 Q1 2015 Q1 2016 Q1 2016 vs Q1 2015
Units Sold 4 4 2 3 50%
Sold Dollar Volume $1,750,800 $1,897,000 $1,019,000 $1,621,000 59%
For Sale at End of Quarter 9 11 8 4 -50%
Avg MSI 0.0 5.5 8.0 0.0 -100%
Avg DOM 44 82 10 91 810%
Avg List Price $448,200 $485,700 $514,500 $549,000 7%
Avg Sale Price $437,700 $474,250 $509,500 $540,333 6%
Median Sale Price $401,150 $465,500 $509,500 $545,000 7%
Avg LP/Sq. Ft. $152 $149 $188 $198 5%
Avg SP/Sq. Ft. $148 $146 $187 $196 5%
Avg SP/OLP 97.66% 97.64% 99.03% 98.42% -1%
Highest Sold Price $587,000 $592,000 $590,000 $651,000 10%
Lowest Sold Price $361,500 $374,000 $429,000 $425,000 -1%
VACANT LAND Q1 2013 Q1 2014 Q1 2015 Q1 2016 Q1 2016 vs Q1 2015
Units Sold 2 4 2 3 50%
Sold Dollar Volume $67,500 $225,000 $135,000 $223,000 65%
For Sale at End of Quarter 21 15 5 8 60%
Avg MSI 21.0 7.5 2.5 8.0 220%
Avg DOM 385 331 123 41 -67%
Avg List Price $36,000 $60,725 $69,475 $98,333 42%
Avg Sale Price $33,750 $56,250 $67,500 $74,333 10%
Median Sale Price $33,750 $52,750 $67,500 $82,000 21%
Avg SP/OLP 93.75% 92.63% 97.16% 75.59% -22%
Highest Sold Price $37,500 $80,000 $70,000 $110,000 57%
Lowest Sold Price $30,000 $39,500 $65,000 $31,000 -52%

Source: PCMLS 2012-2015. This material is based upon information that we consider reliable, but because it has been supplied by third parties, we cannot represent that it is accurate or complete, including price, or withdrawal without notice; square footage is an estimate only. ©MMXV Sotheby’s International Realty Affiliates, Inc. All Rights Reserved. Sotheby’s International Realty® is a licensed trademark to Sotheby’s International Realty Affiliates, Inc. An Equal Opportunity Company.
SUN PEAK – BEAR HOLLOWThe statistics below compare 1st Quarter 2013 to 2016 for Sun Peak/Bear Hollow with a year-over-year percentage comparing 2016 to 2015. Sun Peak/Bear Hollow covers the area around the base of the Olympic Sports Park as well as the neighbor-hoods around Sun Peak. This area presents a diverse range of housing options, from cozy cottages to high-end homes.
SINGLE FAMILY HOMES Q1 2013 Q1 2014 Q1 2015 Q1 2016 Q1 2016 vs Q1 2015
Units Sold 1 2 7 2 -71%
Sold Dollar Volume $985,000 $3,050,000 $7,917,629 $1,550,000 -80%
For Sale at End of Quarter 8 8 13 6 -54%
Avg MSI 0.0 0.0 6.5 6.0 -8%
Avg DOM 11 151 35 16 -54%
Avg List Price $995,000 $1,662,000 $1,150,400 $797,000 -31%
Avg Sale Price $985,000 $1,525,000 $1,131,090 $775,000 -31%
Median Sale Price $985,000 $1,525,000 $665,000 $775,000 17%
Avg LP/Sq. Ft. $230 $235 $348 $246 -29%
Avg SP/Sq. Ft. $228 $216 $341 $240 -30%
Avg SP/OLP 98.99% 91.76% 98.32% 97.24% -1%
Highest Sold Price $985,000 $1,850,000 $3,900,000 $855,000 -78%
Lowest Sold Price $985,000 $1,200,000 $619,000 $695,000 12%
CONDOS Q1 2013 Q1 2014 Q1 2015 Q1 2016 Q1 2016 vs Q1 2015
Units Sold 4 11 10 5 -50%
Sold Dollar Volume $1,705,494 $4,425,272 $9,747,299 $4,771,294 -51%
For Sale at End of Quarter 10 25 21 11 -48%
Avg MSI 5.0 6.3 7.0 3.7 -47%
Avg DOM 23 56 89 82 -8%
Avg List Price $437,975 $417,516 $895,180 $952,872 6%
Avg Sale Price $426,374 $402,297 $974,730 $954,259 -2%
Median Sale Price $446,250 $445,000 $570,938 $627,000 10%
Avg LP/Sq. Ft. $207 $248 $302 $337 12%
Avg SP/Sq. Ft. $202 $239 $312 $334 7%
Avg SP/OLP 97.35% 96.36% 108.89% 100.15% -8%
Highest Sold Price $490,000 $541,000 $2,302,919 $2,588,500 12%
Lowest Sold Price $322,994 $164,272 $165,971 $270,794 63%
VACANT LAND Q1 2013 Q1 2014 Q1 2015 Q1 2016 Q1 2016 vs Q1 2015
Units Sold 1 0 0 0 0%
Sold Dollar Volume $395,000 $0 $0 $0 0%
For Sale at End of Quarter 3 4 0 1 100%
Avg MSI 3.0 0.0 0.0 0.0 0%
Avg DOM 320 0 0 0 0%
Avg List Price $449,000 $0 $0 $0 0%
Avg Sale Price $395,000 $0 $0 $0 0%
Median Sale Price $395,000 $0 $0 $0 0%
Avg SP/OLP 87.97% 0.00% 0.00% 0.00% 0%
Highest Sold Price $395,000 $0 $0 $0 0%
Lowest Sold Price $395,000 $0 $0 $0 0%

Source: PCMLS 2012-2015. This material is based upon information that we consider reliable, but because it has been supplied by third parties, we cannot represent that it is accurate or complete, including price, or withdrawal without notice; square footage is an estimate only. ©MMXV Sotheby’s International Realty Affiliates, Inc. All Rights Reserved. Sotheby’s International Realty® is a licensed trademark to Sotheby’s International Realty Affiliates, Inc. An Equal Opportunity Company.
THE CANYONSThe statistics below compare 1st Quarter 2013 to 2016 for The Canyons with a year-over-year percentage comparing 2016 to 2015. The Canyons offers world-class lodging properties: Waldorf Astoria, Hyatt Escala Lodge, Sundial Lodge, Silverado, Westgate, Grand Summit and Fairway Springs Villas. Residents of The Colony enjoy exclusive ski-in/ski-out privileges to Park City Mountain Resort.
SINGLE FAMILY HOMES Q1 2013 Q1 2014 Q1 2015 Q1 2016 Q1 2016 vs Q1 2015
Units Sold 0 1 3 5 67%
Sold Dollar Volume $0 $1,605,000 $22,900,000 $34,413,150 50%
For Sale at End of Quarter 25 27 35 27 -23%
Avg MSI 0.0 27.0 35.0 0.0 -100%
Avg DOM 0 32 466 86 -82%
Avg List Price $0 $1,675,000 $8,414,667 $7,209,000 -14%
Avg Sale Price $0 $1,605,000 $7,633,333 $6,882,630 -10%
Median Sale Price $0 $1,605,000 $5,350,000 $6,930,250 30%
Avg LP/Sq. Ft. $0 $433 $601 $810 35%
Avg SP/Sq. Ft. $0 $415 $550 $773 41%
Avg SP/OLP 0.00% 95.82% 90.71% 95.47% 5%
Highest Sold Price $0 $1,605,000 $12,750,000 $8,500,000 -33%
Lowest Sold Price $0 $1,605,000 $4,800,000 $5,440,400 13%
CONDOS Q1 2013 Q1 2014 Q1 2015 Q1 2016 Q1 2016 vs Q1 2015
Units Sold 12 11 22 31 41%
Sold Dollar Volume $4,595,000 $5,106,114 $12,488,000 $24,147,583 93%
For Sale at End of Quarter 84 91 101 95 -6%
Avg MSI 16.8 22.8 10.1 23.8 136%
Avg DOM 175 47 158 112 -29%
Avg List Price $399,825 $479,284 $593,750 $823,739 39%
Avg Sale Price $382,917 $464,192 $567,636 $778,954 37%
Median Sale Price $347,250 $398,933 $362,500 $800,000 121%
Avg LP/Sq. Ft. $348 $416 $515 $580 13%
Avg SP/Sq. Ft. $333 $402 $493 $554 12%
Avg SP/OLP 95.77% 96.85% 95.60% 94.56% -1%
Highest Sold Price $1,167,500 $1,255,681 $1,750,000 $2,100,000 20%
Lowest Sold Price $178,000 $165,000 $130,000 $161,000 24%
VACANT LAND Q1 2013 Q1 2014 Q1 2015 Q1 2016 Q1 2016 vs Q1 2015
Units Sold 4 2 3 5 67%
Sold Dollar Volume $5,310,000 $3,150,000 $5,225,000 $8,715,000 67%
For Sale at End of Quarter 37 28 28 24 -14%
Avg MSI 37.0 28.0 14.0 24.0 71%
Avg DOM 214 632 220 120 -45%
Avg List Price $1,385,000 $1,685,000 $1,800,000 $1,760,000 -2%
Avg Sale Price $1,327,500 $1,575,000 $1,741,667 $1,743,000 0%
Median Sale Price $1,072,500 $1,575,000 $1,745,000 $1,900,000 9%
Avg SP/OLP 95.85% 93.47% 96.76% 99.03% 2%
Highest Sold Price $2,800,000 $2,100,000 $1,900,000 $1,900,000 0%
Lowest Sold Price $365,000 $1,050,000 $1,580,000 $1,150,000 -27%

Source: PCMLS 2012-2015. This material is based upon information that we consider reliable, but because it has been supplied by third parties, we cannot represent that it is accurate or complete, including price, or withdrawal without notice; square footage is an estimate only. ©MMXV Sotheby’s International Realty Affiliates, Inc. All Rights Reserved. Sotheby’s International Realty® is a licensed trademark to Sotheby’s International Realty Affiliates, Inc. An Equal Opportunity Company.
TRAILSIDE PARK The statistics below compare 1st Quarter 2013 to 2016 for Trailside Park with a year-over-year percentage comparing 2016 to 2015. Trailside Park is a family oriented neighborhood. It offers newer luxury homes that tend to be larger and mountain contemporary. It is easy accessible through Kimball Junction or Silver Summit exit off Highway 40.
SINGLE FAMILY HOMES Q1 2013 Q1 2014 Q1 2015 Q1 2016 Q1 2016 vs Q1 2015
Units Sold 10 7 6 8 33%
Sold Dollar Volume $9,819,000 $5,166,300 $4,305,000 $8,209,000 91%
For Sale at End of Quarter 6 8 12 11 -8%
Avg MSI 2.0 2.7 12.0 3.7 -69%
Avg DOM 83 54 65 96 48%
Avg List Price $1,014,590 $765,129 $743,167 $1,065,750 43%
Avg Sale Price $981,900 $738,043 $717,500 $1,026,125 43%
Median Sale Price $542,500 $533,500 $620,000 $884,500 43%
Avg LP/Sq. Ft. $216 $215 $258 $261 1%
Avg SP/Sq. Ft. $211 $208 $248 $251 1%
Avg SP/OLP 96.78% 96.46% 96.55% 96.28% 0%
Highest Sold Price $2,295,000 $1,900,000 $1,270,000 $1,720,000 35%
Lowest Sold Price $310,000 $465,000 $540,000 $600,000 11%
VACANT LAND Q1 2013 Q1 2014 Q1 2015 Q1 2016 Q1 2016 vs Q1 2015
Units Sold 1 1 1 0 -100%
Sold Dollar Volume $400,000 $340,000 $245,000 $0 -100%
For Sale at End of Quarter 5 2 1 4 300%
Avg MSI 5.0 0.0 1.0 0.0 -100%
Avg DOM 29 365 260 0 -100%
Avg List Price $425,000 $349,000 $260,000 $0 -100%
Avg Sale Price $400,000 $340,000 $245,000 $0 -100%
Median Sale Price $400,000 $340,000 $245,000 $0 -100%
Avg SP/OLP 94.12% 97.42% 94.23% 0.00% -100%
Highest Sold Price $400,000 $340,000 $245,000 $0 -100%
Lowest Sold Price $400,000 $340,000 $245,000 $0 -100%

Source: PCMLS 2012-2015. This material is based upon information that we consider reliable, but because it has been supplied by third parties, we cannot represent that it is accurate or complete, including price, or withdrawal without notice; square footage is an estimate only. ©MMXV Sotheby’s International Realty Affiliates, Inc. All Rights Reserved. Sotheby’s International Realty® is a licensed trademark to Sotheby’s International Realty Affiliates, Inc. An Equal Opportunity Company.
HEBER - DANIELS The statistics below compare 1st Quarter 2013 to 2016 for the Heber Valley with a year-over-year percentage comparing 2016 to 2015. Heber is located in a beautiful mountain valley just a short drive from the Wasatch Front. The area offers outstanding year-round outdoor recreation including golf, fly fishing, boating and water sports, plus skiing and other winter sports.
SINGLE FAMILY HOMES Q1 2013 Q1 2014 Q1 2015 Q1 2016 Q1 2016 vs Q1 2015
Units Sold 15 12 22 29 32%
Sold Dollar Volume $6,548,169 $4,713,000 $8,094,114 $12,165,400 50%
For Sale at End of Quarter 79 79 69 92 33%
Avg MSI 19.8 15.8 7.7 4.6 -40%
Avg DOM 79 209 128 96 -25%
Avg List Price $463,813 $446,642 $379,857 $424,759 12%
Avg Sale Price $436,545 $392,750 $367,914 $419,497 14%
Median Sale Price $264,235 $285,000 $288,657 $356,500 24%
Avg LP/Sq. Ft. $117 $157 $147 $134 -9%
Avg SP/Sq. Ft. $111 $140 $142 $132 -7%
Avg SP/OLP 94.12% 87.93% 96.86% 98.76% 2%
Highest Sold Price $2,015,000 $1,300,000 $900,000 $1,239,237 38%
Lowest Sold Price $120,000 $151,000 $150,000 $215,000 43%
VACANT LAND Q1 2013 Q1 2014 Q1 2015 Q1 2016 Q1 2016 vs Q1 2015
Units Sold 5 12 17 12 -29%
Sold Dollar Volume $538,750 $2,090,000 $4,688,750 $2,884,650 -38%
For Sale at End of Quarter 73 71 98 100 2%
Avg MSI 18.3 17.8 14.0 25.0 79%
Avg DOM 214 174 107 80 -25%
Avg List Price $115,300 $195,750 $281,647 $290,325 3%
Avg Sale Price $107,750 $174,167 $275,809 $240,388 -13%
Median Sale Price $118,750 $167,500 $260,000 $200,000 -23%
Avg SP/OLP 93.45% 88.97% 97.93% 82.80% -15%
Highest Sold Price $205,000 $400,000 $451,250 $450,000 0%
Lowest Sold Price $34,000 $75,000 $69,000 $61,000 -12%
Source: PCMLS 2012-2015. This material is based upon information that we consider reliable, but because it has been supplied by third parties, we cannot represent that it is accurate or complete, including price, or withdrawal without notice; square footage is an estimate only. ©MMXV Sotheby’s International Realty Affiliates, Inc. All Rights Reserved. Sotheby’s International Realty® is a licensed trademark to Sotheby’s International Realty Affiliates, Inc. An Equal Opportunity Company.
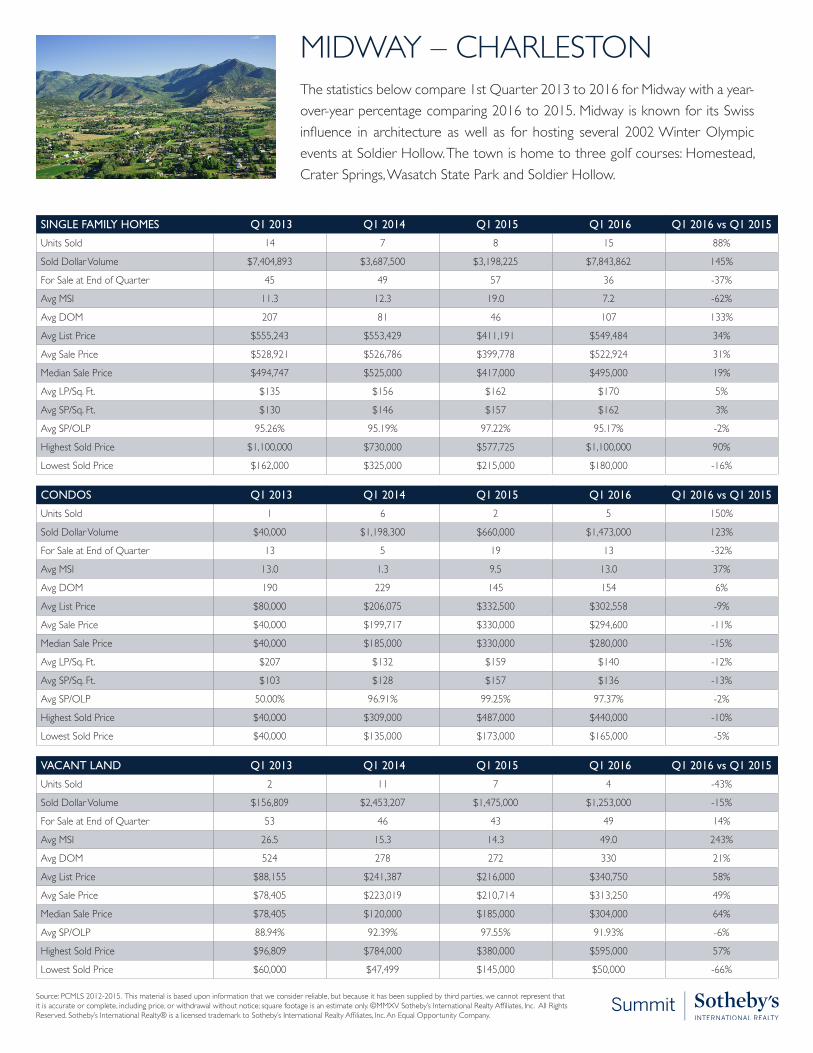
MIDWAY – CHARLESTONThe statistics below compare 1st Quarter 2013 to 2016 for Midway with a year-over-year percentage comparing 2016 to 2015. Midway is known for its Swiss influence in architecture as well as for hosting several 2002 Winter Olympic events at Soldier Hollow. The town is home to three golf courses: Homestead, Crater Springs, Wasatch State Park and Soldier Hollow.
SINGLE FAMILY HOMES Q1 2013 Q1 2014 Q1 2015 Q1 2016 Q1 2016 vs Q1 2015
Units Sold 14 7 8 15 88%
Sold Dollar Volume $7,404,893 $3,687,500 $3,198,225 $7,843,862 145%
For Sale at End of Quarter 45 49 57 36 -37%
Avg MSI 11.3 12.3 19.0 7.2 -62%
Avg DOM 207 81 46 107 133%
Avg List Price $555,243 $553,429 $411,191 $549,484 34%
Avg Sale Price $528,921 $526,786 $399,778 $522,924 31%
Median Sale Price $494,747 $525,000 $417,000 $495,000 19%
Avg LP/Sq. Ft. $135 $156 $162 $170 5%
Avg SP/Sq. Ft. $130 $146 $157 $162 3%
Avg SP/OLP 95.26% 95.19% 97.22% 95.17% -2%
Highest Sold Price $1,100,000 $730,000 $577,725 $1,100,000 90%
Lowest Sold Price $162,000 $325,000 $215,000 $180,000 -16%
CONDOS Q1 2013 Q1 2014 Q1 2015 Q1 2016 Q1 2016 vs Q1 2015
Units Sold 1 6 2 5 150%
Sold Dollar Volume $40,000 $1,198,300 $660,000 $1,473,000 123%
For Sale at End of Quarter 13 5 19 13 -32%
Avg MSI 13.0 1.3 9.5 13.0 37%
Avg DOM 190 229 145 154 6%
Avg List Price $80,000 $206,075 $332,500 $302,558 -9%
Avg Sale Price $40,000 $199,717 $330,000 $294,600 -11%
Median Sale Price $40,000 $185,000 $330,000 $280,000 -15%
Avg LP/Sq. Ft. $207 $132 $159 $140 -12%
Avg SP/Sq. Ft. $103 $128 $157 $136 -13%
Avg SP/OLP 50.00% 96.91% 99.25% 97.37% -2%
Highest Sold Price $40,000 $309,000 $487,000 $440,000 -10%
Lowest Sold Price $40,000 $135,000 $173,000 $165,000 -5%
VACANT LAND Q1 2013 Q1 2014 Q1 2015 Q1 2016 Q1 2016 vs Q1 2015
Units Sold 2 11 7 4 -43%
Sold Dollar Volume $156,809 $2,453,207 $1,475,000 $1,253,000 -15%
For Sale at End of Quarter 53 46 43 49 14%
Avg MSI 26.5 15.3 14.3 49.0 243%
Avg DOM 524 278 272 330 21%
Avg List Price $88,155 $241,387 $216,000 $340,750 58%
Avg Sale Price $78,405 $223,019 $210,714 $313,250 49%
Median Sale Price $78,405 $120,000 $185,000 $304,000 64%
Avg SP/OLP 88.94% 92.39% 97.55% 91.93% -6%
Highest Sold Price $96,809 $784,000 $380,000 $595,000 57%
Lowest Sold Price $60,000 $47,499 $145,000 $50,000 -66%

Source: PCMLS 2012-2015. This material is based upon information that we consider reliable, but because it has been supplied by third parties, we cannot represent that it is accurate or complete, including price, or withdrawal without notice; square footage is an estimate only. ©MMXV Sotheby’s International Realty Affiliates, Inc. All Rights Reserved. Sotheby’s International Realty® is a licensed trademark to Sotheby’s International Realty Affiliates, Inc. An Equal Opportunity Company.
TIMBERLAKESThe statistics below compare 1st Quarter 2013 to 2016 for Timberlakes with a year-over-year percentage comparing 2016 to 2015. Timberlakes Estates subdivision is located just seven miles east of Heber City, Utah. This private gated community is filled with several lakes, numerous ponds and streams and features panoramic views of the Heber Valley and the Wasatch Mountains.
SINGLE FAMILY HOMES Q1 2013 Q1 2014 Q1 2015 Q1 2016 Q1 2016 vs Q1 2015
Units Sold 13 5 9 7 -22%
Sold Dollar Volume $3,436,450 $1,183,900 $3,190,000 $2,550,750 -20%
For Sale at End of Quarter 9 14 12 11 -8%
Avg MSI 1.5 4.7 12.0 5.5 -54%
Avg DOM 153 79 127 165 30%
Avg List Price $273,323 $241,960 $374,694 $380,543 2%
Avg Sale Price $264,342 $236,780 $354,444 $364,393 3%
Median Sale Price $245,000 $231,000 $400,000 $390,000 -3%
Avg LP/Sq. Ft. $112 $136 $125 $145 16%
Avg SP/Sq. Ft. $108 $132 $119 $140 18%
Avg SP/OLP 96.71% 97.86% 94.60% 95.76% 1%
Highest Sold Price $425,900 $318,000 $525,000 $510,000 -3%
Lowest Sold Price $100,700 $174,900 $175,000 $128,750 -26%
VACANT LAND Q1 2013 Q1 2014 Q1 2015 Q1 2016 Q1 2016 vs Q1 2015
Units Sold 1 2 2 3 50%
Sold Dollar Volume $14,000 $165,000 $57,000 $80,000 40%
For Sale at End of Quarter 17 20 19 16 -16%
Avg MSI 0.0 20.0 0.0 8.0 800%
Avg DOM 218 69 133 163 23%
Avg List Price $30,000 $127,500 $31,700 $32,633 3%
Avg Sale Price $14,000 $82,500 $28,500 $26,667 -6%
Median Sale Price $14,000 $82,500 $28,500 $25,000 -12%
Avg SP/OLP 46.67% 64.71% 89.91% 81.72% -9%
Highest Sold Price $14,000 $150,000 $30,500 $35,000 15%
Lowest Sold Price $14,000 $15,000 $26,500 $20,000 -25%

Source: PCMLS 2012-2015. This material is based upon information that we consider reliable, but because it has been supplied by third parties, we cannot represent that it is accurate or complete, including price, or withdrawal without notice; square footage is an estimate only. ©MMXV Sotheby’s International Realty Affiliates, Inc. All Rights Reserved. Sotheby’s International Realty® is a licensed trademark to Sotheby’s International Realty Affiliates, Inc. An Equal Opportunity Company.
KAMAS – MARIONThe statistics below compare 1st Quarter 2013 to 2016 for the Kamas Valley with a year-over-year percentage comparing 2016 to 2015. Kamas is known as “The Gate-way to the Uintas” and is located 15 miles east of Park City. Fishing, camping, hiking, mountain climbing and other outdoor recreational activities are popular among lo-cals.
SINGLE FAMILY HOMES Q1 2013 Q1 2014 Q1 2015 Q1 2016 Q1 2016 vs Q1 2015
Units Sold 4 5 3 2 -33%
Sold Dollar Volume $2,119,000 $1,359,585 $788,635 $1,357,502 72%
For Sale at End of Quarter 15 17 16 14 -13%
Avg MSI 15.0 5.7 5.3 14.0 164%
Avg DOM 170 82 195 85 -56%
Avg List Price $586,200 $279,780 $274,667 $554,500 102%
Avg Sale Price $529,750 $271,917 $262,878 $678,751 158%
Median Sale Price $172,500 $271,920 $264,635 $678,751 156%
Avg LP/Sq. Ft. $138 $112 $136 $242 78%
Avg SP/Sq. Ft. $126 $106 $130 $300 131%
Avg SP/OLP 90.37% 97.19% 95.71% 122.41% 28%
Highest Sold Price $1,625,000 $336,100 $272,000 $1,058,502 289%
Lowest Sold Price $149,000 $187,900 $252,000 $299,000 19%
VACANT LAND Q1 2013 Q1 2014 Q1 2015 Q1 2016 Q1 2016 vs Q1 2015
Units Sold 1 7 2 2 0%
Sold Dollar Volume $110,000 $698,000 $267,500 $440,000 64%
For Sale at End of Quarter 36 34 39 33 -15%
Avg MSI 0.0 11.3 39.0 33.0 -15%
Avg DOM 587 263 64 181 183%
Avg List Price $120,000 $114,557 $142,000 $262,000 85%
Avg Sale Price $110,000 $99,714 $133,750 $220,000 64%
Median Sale Price $110,000 $80,000 $133,750 $220,000 64%
Avg SP/OLP 91.67% 87.04% 94.19% 83.97% -11%
Highest Sold Price $110,000 $225,000 $145,000 $400,000 176%
Lowest Sold Price $110,000 $62,000 $122,500 $40,000 -67%
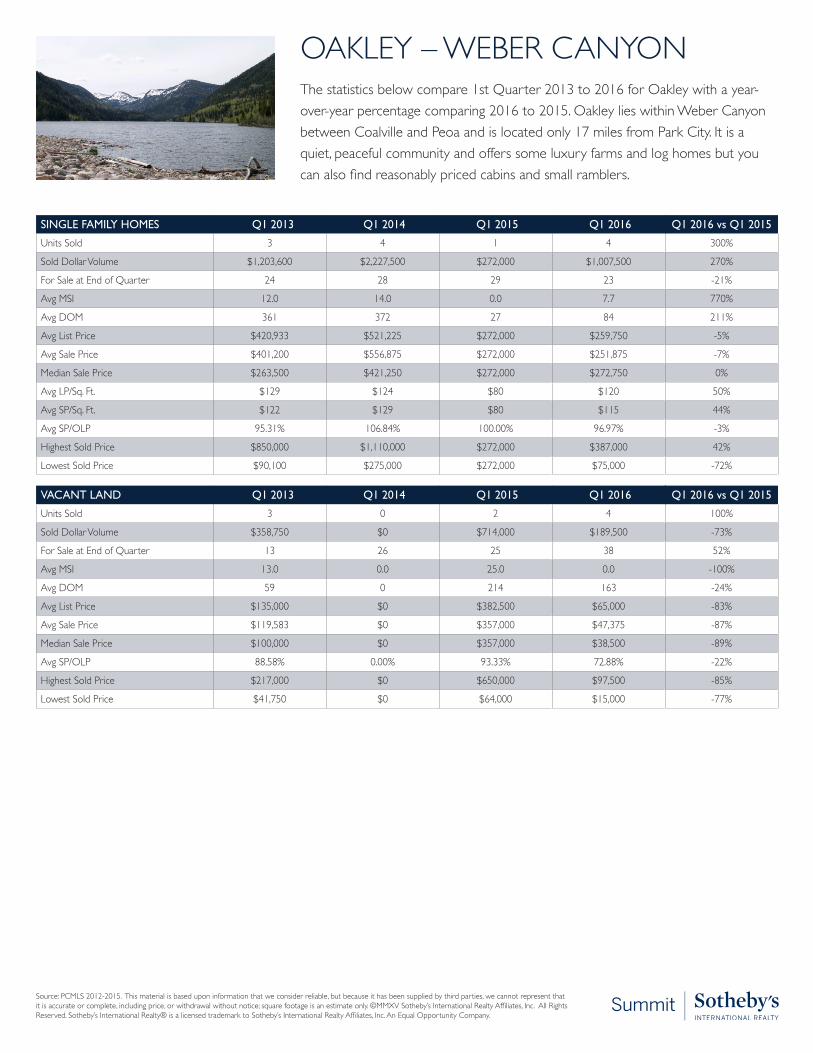
Source: PCMLS 2012-2015. This material is based upon information that we consider reliable, but because it has been supplied by third parties, we cannot represent that it is accurate or complete, including price, or withdrawal without notice; square footage is an estimate only. ©MMXV Sotheby’s International Realty Affiliates, Inc. All Rights Reserved. Sotheby’s International Realty® is a licensed trademark to Sotheby’s International Realty Affiliates, Inc. An Equal Opportunity Company.
OAKLEY – WEBER CANYONThe statistics below compare 1st Quarter 2013 to 2016 for Oakley with a year-over-year percentage comparing 2016 to 2015. Oakley lies within Weber Canyon between Coalville and Peoa and is located only 17 miles from Park City. It is a quiet, peaceful community and offers some luxury farms and log homes but you can also find reasonably priced cabins and small ramblers.
SINGLE FAMILY HOMES Q1 2013 Q1 2014 Q1 2015 Q1 2016 Q1 2016 vs Q1 2015
Units Sold 3 4 1 4 300%
Sold Dollar Volume $1,203,600 $2,227,500 $272,000 $1,007,500 270%
For Sale at End of Quarter 24 28 29 23 -21%
Avg MSI 12.0 14.0 0.0 7.7 770%
Avg DOM 361 372 27 84 211%
Avg List Price $420,933 $521,225 $272,000 $259,750 -5%
Avg Sale Price $401,200 $556,875 $272,000 $251,875 -7%
Median Sale Price $263,500 $421,250 $272,000 $272,750 0%
Avg LP/Sq. Ft. $129 $124 $80 $120 50%
Avg SP/Sq. Ft. $122 $129 $80 $115 44%
Avg SP/OLP 95.31% 106.84% 100.00% 96.97% -3%
Highest Sold Price $850,000 $1,110,000 $272,000 $387,000 42%
Lowest Sold Price $90,100 $275,000 $272,000 $75,000 -72%
VACANT LAND Q1 2013 Q1 2014 Q1 2015 Q1 2016 Q1 2016 vs Q1 2015
Units Sold 3 0 2 4 100%
Sold Dollar Volume $358,750 $0 $714,000 $189,500 -73%
For Sale at End of Quarter 13 26 25 38 52%
Avg MSI 13.0 0.0 25.0 0.0 -100%
Avg DOM 59 0 214 163 -24%
Avg List Price $135,000 $0 $382,500 $65,000 -83%
Avg Sale Price $119,583 $0 $357,000 $47,375 -87%
Median Sale Price $100,000 $0 $357,000 $38,500 -89%
Avg SP/OLP 88.58% 0.00% 93.33% 72.88% -22%
Highest Sold Price $217,000 $0 $650,000 $97,500 -85%
Lowest Sold Price $41,750 $0 $64,000 $15,000 -77%

Source: PCMLS 2012-2015. This material is based upon information that we consider reliable, but because it has been supplied by third parties, we cannot represent that it is accurate or complete, including price, or withdrawal without notice; square footage is an estimate only. ©MMXV Sotheby’s International Realty Affiliates, Inc. All Rights Reserved. Sotheby’s International Realty® is a licensed trademark to Sotheby’s International Realty Affiliates, Inc. An Equal Opportunity Company.
WOODLAND – FRANCISThe statistics below compare 1st Quarter 2013 to 2016 for Woodland/Francis with a year-over-year percentage comparing 2016 to 2015. Woodland is best known for its Wolf Creek Ranch development, which offers the largest residential land parcels in the area. The most recognized neighborhood in Francis is Wild Willow, which fea-tures large home sites and ranch style homes.
SINGLE FAMILY HOMES Q1 2013 Q1 2014 Q1 2015 Q1 2016 Q1 2016 vs Q1 2015
Units Sold 6 2 5 4 -20%
Sold Dollar Volume $14,494,001 $699,000 $1,870,000 $1,615,900 -14%
For Sale at End of Quarter 20 19 14 13 -7%
Avg MSI 6.7 19.0 7.0 13.0 86%
Avg DOM 311 282 227 80 -65%
Avg List Price $2,889,817 $341,950 $382,780 $411,100 7%
Avg Sale Price $2,415,667 $349,500 $374,000 $403,975 8%
Median Sale Price $711,750 $349,500 $363,000 $367,500 1%
Avg LP/Sq. Ft. $398 $112 $108 $135 25%
Avg SP/Sq. Ft. $338 $116 $105 $130 24%
Avg SP/OLP 83.59% 102.21% 97.71% 98.27% 1%
Highest Sold Price $8,500,000 $499,000 $545,000 $680,900 25%
Lowest Sold Price $230,101 $200,000 $180,000 $200,000 11%
VACANT LAND Q1 2013 Q1 2014 Q1 2015 Q1 2016 Q1 2016 vs Q1 2015
Units Sold 0 6 0 5 500%
Sold Dollar Volume $0 $2,029,055 $0 $3,399,775 339977500%
For Sale at End of Quarter 39 40 37 48 30%
Avg MSI 0.0 20.0 0.0 0.0 0%
Avg DOM 0 483 0 226 22600%
Avg List Price $0 $382,467 $0 $732,800 73280000%
Avg Sale Price $0 $338,176 $0 $679,955 67995500%
Median Sale Price $0 $136,450 $0 $180,000 18000000%
Avg SP/OLP 0.00% 88.42% 0.00% 92.79% 93%
Highest Sold Price $0 $1,250,000 $0 $1,930,500 193050000%
Lowest Sold Price $0 $71,155 $0 $105,275 10527500%

Source: PCMLS 2012-2015. This material is based upon information that we consider reliable, but because it has been supplied by third parties, we cannot represent that it is accurate or complete, including price, or withdrawal without notice; square footage is an estimate only. ©MMXV Sotheby’s International Realty Affiliates, Inc. All Rights Reserved. Sotheby’s International Realty® is a licensed trademark to Sotheby’s International Realty Affiliates, Inc. An Equal Opportunity Company.
WANSHIP - HOYTSVILLE - COALVILLEThe statistics below compare 1st Quarter 2013 to 2016 for Wanship, Hoytsville and Coalville with a year-over-year percentage comparing 2016 to 2015. Wanship, Hoytsville, Coalville and Rockport are located off I-80 in Summit County making it an easy four season drive to Park City, Salt Lake City, Ogden and Evanston, Wyoming. Enjoy small town living with many recreational opportunities nearby.
SINGLE FAMILY HOMES Q1 2013 Q1 2014 Q1 2015 Q1 2016 Q1 2016 vs Q1 2015
Units Sold 8 12 7 8 14%
Sold Dollar Volume $2,670,500 $3,519,900 $1,397,600 $2,958,895 112%
For Sale at End of Quarter 39 25 30 16 -47%
Avg MSI 13.0 4.2 7.5 5.3 -29%
Avg DOM 339 308 167 119 -29%
Avg List Price $352,113 $304,617 $211,814 $379,225 79%
Avg Sale Price $333,813 $293,325 $199,657 $369,862 85%
Median Sale Price $250,000 $261,500 $201,000 $360,000 79%
Avg LP/Sq. Ft. $122 $120 $153 $147 -4%
Avg SP/Sq. Ft. $113 $115 $140 $143 2%
Avg SP/OLP 94.80% 96.29% 94.26% 97.53% 3%
Highest Sold Price $895,000 $515,000 $344,600 $499,500 45%
Lowest Sold Price $75,000 $85,000 $80,000 $305,000 281%
VACANT LAND Q1 2013 Q1 2014 Q1 2015 Q1 2016 Q1 2016 vs Q1 2015
Units Sold 1 1 13 11 -15%
Sold Dollar Volume $47,000 $60,000 $1,410,684 $1,132,873 -20%
For Sale at End of Quarter 65 73 91 61 -33%
Avg MSI 0.0 73.0 13.0 12.2 -6%
Avg DOM 336 146 338 165 -51%
Avg List Price $65,000 $65,000 $118,308 $112,921 -5%
Avg Sale Price $47,000 $60,000 $108,514 $102,988 -5%
Median Sale Price $47,000 $60,000 $80,000 $65,000 -19%
Avg SP/OLP 72.31% 92.31% 91.72% 91.20% -1%
Highest Sold Price $47,000 $60,000 $275,000 $335,000 22%
Lowest Sold Price $47,000 $60,000 $15,684 $18,000 15%

Visit parkcitymarketupdate.com to view all of our latest market reports and videos!