Embed Size (px)
Citation preview

Greater Greenville Regional Economic Scorecard, 2009
EDA University Center for Economic Development
Clemson Universitywww.clemson.edu/uced

South Carolina Upstate
Greenville Metropolitan Statistical Area (MSA)
Greenville Combined Statistical Area (CSA)
Oconee
Anderson
Abbeville
Greenwood
Laurens
Pickens
Greenville
Spartanburg
Cherokee
Union

Peer Cities Selected for the Greenville MSA and CSA Regions
Metro Area Population (2000) Population (2007) Percent Change
Greenville MSA 599,940 613,828 2.3%
Jackson, MS CSA 525,246 559,366 6.5%
Lexington, KY CSA 602,733 658,071 9.2%
Charleston, SC MSA 603,178 630,100 4.5%
Little Rock, AR MSA 610,518 672,623 10.2%
Columbia, SC MSA 647,158 712,760 10.1%
Greenville CSA 1,128,104 1,221,881 8.3%
Knoxville, TN CSA 935,659 1,029,155 10.0%
Richmond, VA MSA 1,096,956 1,211,608 10.5%
Jacksonville, FL MSA 1,122,750 1,296,676 15.5%
Birmingham, AL CSA 1,129,721 1,187,319 5.1%
Louisville, KY MSA 1,161,975 1,228,764 5.7%
Greensboro/Winston-Salem CSA 1,414,656 1,535,926 8.6%
Target Cities
Austin, TX MSA 1,249,763 1,593,400 27.5%
Nashville, TN MSA 1,311,789 1,521,751 16.0%
Raleigh/Durham CSA 1,314,589 1,638,019 24.6%
Charlotte, NC MSA 1,330,448 1,650,667 24.1%

U.S. and MSAs (Source: REIS, U.S. Dept. of Commerce)
$0
$5,000
$10,000
$15,000
$20,000
$25,000
$30,000
$35,000
$40,000
$45,000
Figure 1. REAL PER CAPITA INCOMES 1987 AND 2007
(2007 PRICES)R
EA
L P
ER
CA
PIT
A IN
CO
ME
United StatesCharlotte-Gastonia-
Concord, NC-SC (MSA)Charleston-North
Charleston, SC (MSA) Columbia, SC (MSA) Greenville, SC (MSA)
1987 $29,641 $29,937 $24,456 $26,558 $25,719
2007 $38,632 $39,004 $34,133 $33,943 $32,317
% Change 30.3% 30.3% 39.6% 27.8% 25.7%

PC
Y I
N A
RE
A /
PC
Y I
N T
HE
U.S
.FIGURE 2. PER CAPITA INCOME TRENDS RELATIVE TO THE U.S.
U.S. AVERAGE = 100Greenville County
Greenville MSA
Greenville CSA
SOUTH CAROLINA
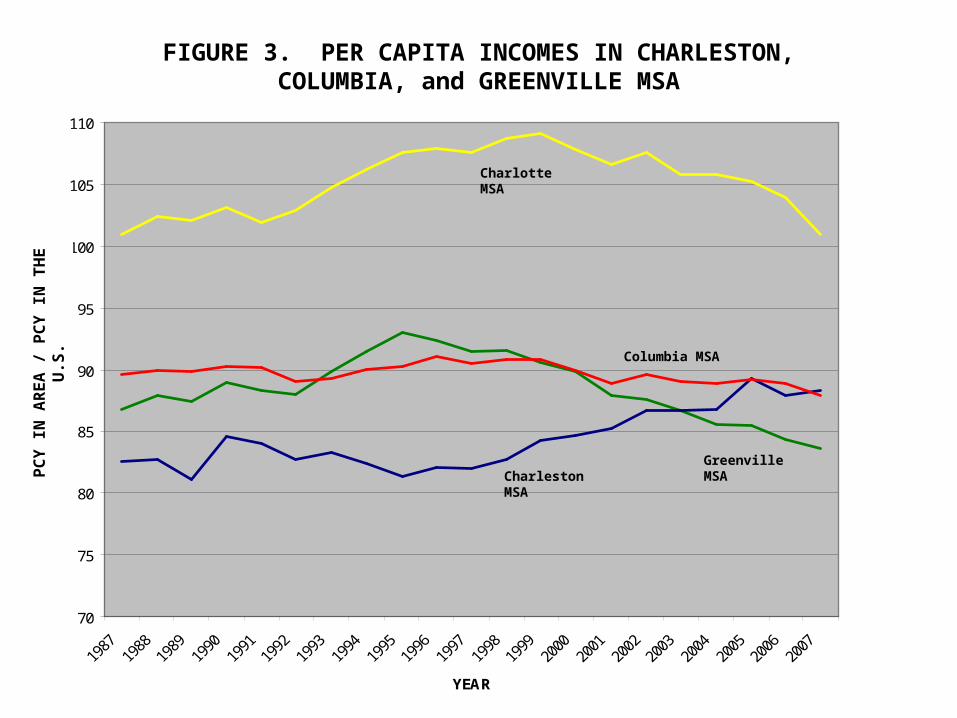
FIGURE 3. PER CAPITA INCOMES (PCY) IN CHARLESTON, COLUMBIA, and GREENVILLE MSA
COMPARED TO CHARLOTTE TARGET, 1987-2007
70
75
80
85
90
95
100
105
110
YEAR
PC
Y In
MS
A /
PC
Y IN
TH
E U
.S.
PC
Y I
N A
RE
A /
PC
Y I
N T
HE
U.S
.FIGURE 3. PER CAPITA INCOMES IN CHARLESTON,
COLUMBIA, and GREENVILLE MSA
Charlotte MSA
Columbia MSA
Greenville MSACharleston MSA

Indices of CompetitivenessLabor Force EducationKnowledge Workforce
Innovative Activity and CapacityEntrepreneurial Environment
Industrial Structure and CompositionIndustrial Diversity and Breadth

Number of patents issued per 1,000 population
Academic R&D expenditures per capita
Doctorates awarded in science and engineering per 1,000 population
Graduate science and engineering students per 1,000 population
Percentage of employment in technical professions - computer science; engineering except civil; natural, physical, and social sciences
Innovative Activity

Greenville86.9
Greensboro/
Winston-Salem91.2
Lexington102.7
Jacksonville98.9
Benchmarking the Index of Labor Force Education
+0.6
Columbia107.3
+2.4
Clemson UniversityCenter for Economic Development

Benchmarking the Index of Knowledge Workers
Greenville90.4
Greensboro/
Winston-Salem92.3
Charleston101.1
Jacksonville97.8
+2.1
Richmond109.2
-1.1
Clemson UniversityCenter for Economic Development

Benchmarking the Index of Innovative Activity
Louisville54.4
Charleston62.1
Lexington139.8
Greenville71.7
-1.0
Richmond76.2
+1.6
Jacksonville37.9
Clemson UniversityCenter for Economic Development
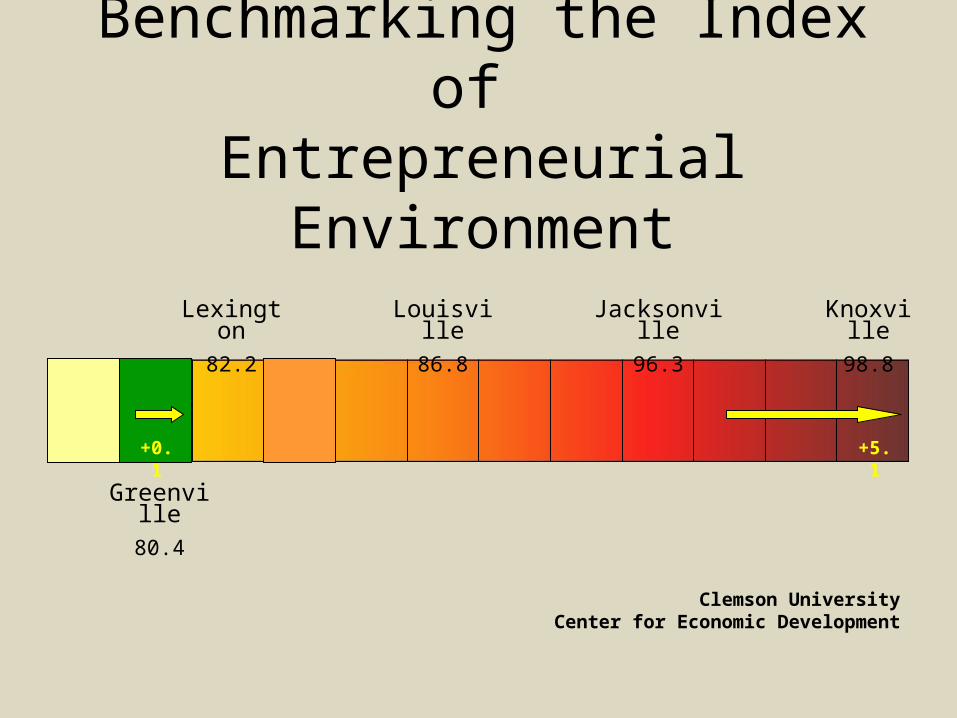
Benchmarking the Index of Entrepreneurial Environment
Knoxville98.8
Jacksonville96.3
Greenville80.4
+0.1
Lexington82.2
Louisville86.8
+5.1
Clemson UniversityCenter for Economic Development

Benchmarking the Index of Diversity and Density
Greenville76.4
Greensboro/
Winston-Salem98.0
Lexington87.7
Columbia82.1
+0.8
Jacksonville119.2
-1.6
Clemson UniversityCenter for Economic Development

Benchmarking the Index of Industrial Structure and Composition
Jacksonville95.4
Jackson92.9
Charleston99.7
+5.6
Knoxville85.2
Greenville90.3
+0.7
Clemson UniversityCenter for Economic Development

Peer Cities’ Average
160
100
ECONOMIC SCORECARD, PART 2: Benchmarking Greenville CSA Versus Small and Large Peer Cities
Industrial Composition and
Structure
Industrial Diversity and
Breadth
Labor Force Education
Knowledge Workers
Innovative Activity and
Capacity
Entrepreneurial Environment
Industrial Legacy Competitiveness Environment
8788
+1.0
40
8991
+2.5
104103
-0.8
9089
-1.0
8082
+2.180
60
120
140
97-0.4
97

Target Cities’ Average
160
100
ECONOMIC SCORECARD, PART 4: Benchmarking Greenville CSA Versus Four Target Cities
(Austin, Charlotte, Nashville, Raleigh-Durham)
Industrial Composition and
Structure
Industrial Diversity and
Breadth
Labor Force Education
Knowledge Workers
Innovative Activity and
Capacity
Entrepreneurial Environment
Industrial Legacy Competitiveness Environment
40
7676
+0.2
7779
+1.6
4545
+0.2
7574
-0.5
5959
+0.3
80
60
120
140
8990 +1.0

ACCRA COST OF LIVING INDEXQTR 4 2007 - QTR 3 2008
URBAN AREA AND STATE COMPOSITE INDEX HOUSING
Knoxville, TN 88.4 75.5Winston-Salem, NC 90.2 75.7Birmingham, AL 90.7 73.2Greenville, SC 91.7 74.6Nashville, TN 91.8 74.6Charlotte, NC 92.8 78.3Louisville, KY 93.8 83.3LittleRock, AR 94.1 78.8Jackson, MS 94.9 88.2Austin, TX 94.9 83.5Lexington, KY 95.4 89.2Charleston, SC 96.8 89.1Columbia, SC 96.8 89.1Jacksonville, FL 97.2 89.8Raleigh, NC 101.5 98.0Richmond, VA 104.4 109.2