Embed Size (px)
Citation preview
Great South Coast
Major Projects
Cumulative Impacts Study
April 2011

2
Table of Contents
Table of Contents ............................................................................................................. 2
Project Statement ............................................................................................................ 3
Executive Summary .......................................................................................................... 4
Projects Summary .................................................................................................................................. 4
PART A – The Great South Coast Region ............................................................................ 6
1.Introduction .............................................................................................................................. 6
2.Regional Overview .................................................................................................................... 8
2.1 Population ......................................................................................................................................... 8
2.2 Work Force ...................................................................................................................................... 10
2.3Economic Profile .............................................................................................................................. 14
2.4Building Activity ............................................................................................................................... 18
2.5Key Findings ..................................................................................................................................... 20
PART B – Investment Portfolio 2011- 2016 ...................................................................... 21
3.Investment Outlook ................................................................................................................ 21
3.1 Summary ......................................................................................................................................... 21
3.2Project List ....................................................................................................................................... 22
3.3 Project Analysis ............................................................................................................................... 24
3.3Project Probability ........................................................................................................................... 31
3.3Economic Analysis ............................................................................................................................ 34
3.5Key Findings ..................................................................................................................................... 41
Key Issues and impacts ......................................................................................................................... 42
4.Project Data Sheets ................................................................................................................. 44
4.1 Data Sheets ..................................................................................................................................... 44
5. Prior Learning......................................................................................................................... 45
5.1 Case Studies .................................................................................................................................... 45
5.2 Key Findings .................................................................................................................................... 47
Key Issues and impacts ......................................................................................................................... 48
PART C – Projecting the Future ....................................................................................... 51
6.Key Impacts ............................................................................................................................ 51
6.1 Workforce ....................................................................................................................................... 51
6.2 Accommodation .............................................................................................................................. 52
6.3 Freight ...........................................................................................................................................55
6.4 Social Infrastructure ........................................................................................................................ 55
7.Response Plan ......................................................................................................................... 57
Appendices .................................................................................................................... 70
Appendix 1 – Project List by Category ......................................................................................... 70
Appendix 2 – Municipal Snapshots ............................................................................................. 71
Appendix 3 – Case Studies .......................................................................................................... 77
Appendix 4 – Fact Sheets ............................................................................................................ 95
3
Project Statement The Great South Coast Cumulative Impacts Study 2011 has been prepared specifically for the six
municipalities that form the Great South Coast Region and Executive.
The Great South Coast Major Projects Cumulative Impact Study 2011 and its contents are not to be
referred to, quoted or used by any party in any statement or application, other than by the Great
South Coast municipalities, without written approval from SED Consulting. Any such act will be
regarded as plagiarism.
The information contained in this document has been gained from anecdotal evidence and research.
It has been prepared in good faith and in conjunction with the Great South Coast member councils.
No attempt has been made to assume proposed values and employment figures. When not
supplied, this detail has been left blank.
Neither SED Consulting, nor its servants, consultants, agents or staff shall be responsible in any way
whatsoever to any person in respect to the Report, including errors or omission therein, however
caused.
SED Consulting
4
Executive Summary
Projects Summary
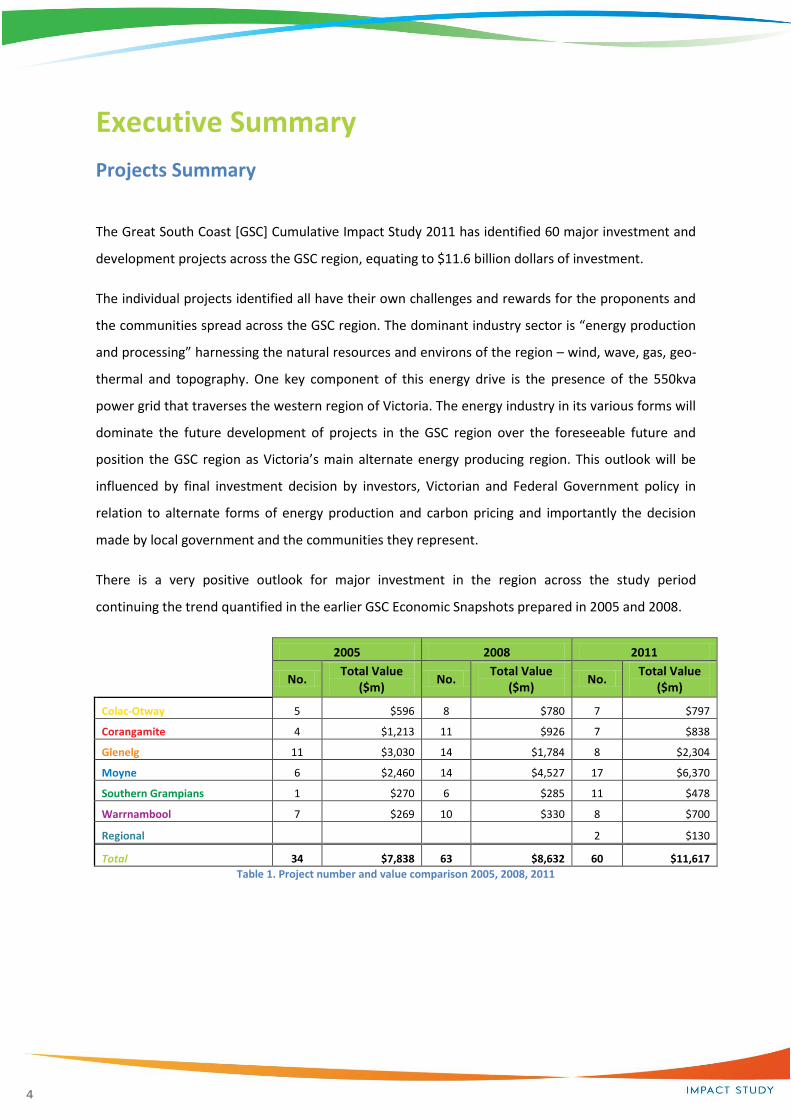
The Great South Coast [GSC] Cumulative Impact Study 2011 has identified 60 major investment and
development projects across the GSC region, equating to $11.6 billion dollars of investment.
The individual projects identified all have their own challenges and rewards for the proponents and
the communities spread across the GSC region. The dominant industry sector is “energy production
and processing” harnessing the natural resources and environs of the region – wind, wave, gas, geo-
thermal and topography. One key component of this energy drive is the presence of the 550kva
power grid that traverses the western region of Victoria. The energy industry in its various forms will
dominate the future development of projects in the GSC region over the foreseeable future and
position the GSC region as Victoria’s main alternate energy producing region. This outlook will be
influenced by final investment decision by investors, Victorian and Federal Government policy in
relation to alternate forms of energy production and carbon pricing and importantly the decision
made by local government and the communities they represent.
There is a very positive outlook for major investment in the region across the study period
continuing the trend quantified in the earlier GSC Economic Snapshots prepared in 2005 and 2008.
2005 2008 2011
No. Total Value
($m) No.
Total Value ($m)
No. Total Value
($m)
Colac-Otway 5 $596 8 $780 7 $797
Corangamite 4 $1,213 11 $926 7 $838
Glenelg 11 $3,030 14 $1,784 8 $2,304
Moyne 6 $2,460 14 $4,527 17 $6,370
Southern Grampians 1 $270 6 $285 11 $478
Warrnambool 7 $269 10 $330 8 $700
Regional 2 $130
Total 34 $7,838 63 $8,632 60 $11,617
Table 1. Project number and value comparison 2005, 2008, 2011
5
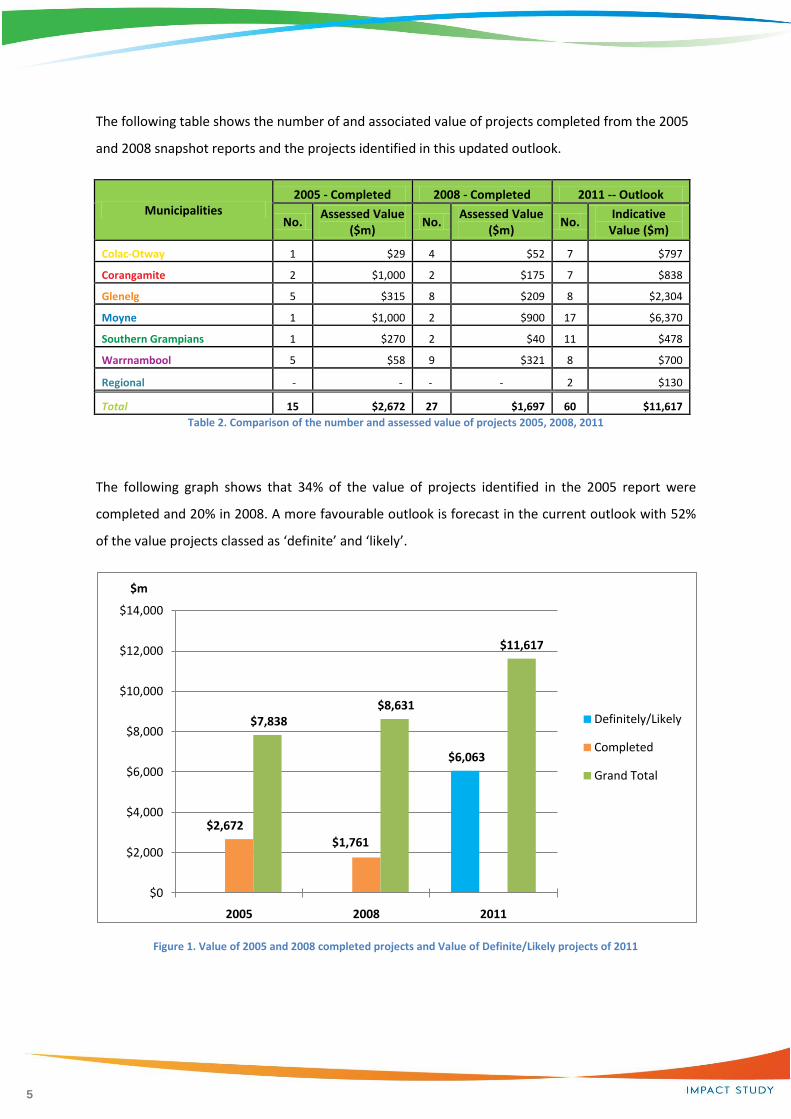
The following table shows the number of and associated value of projects completed from the 2005
and 2008 snapshot reports and the projects identified in this updated outlook.
Municipalities 2005 - Completed 2008 - Completed 2011 -- Outlook
No. Assessed Value
($m) No.
Assessed Value ($m)
No. Indicative
Value ($m)
Colac-Otway 1 $29 4 $52 7 $797
Corangamite 2 $1,000 2 $175 7 $838
Glenelg 5 $315 8 $209 8 $2,304
Moyne 1 $1,000 2 $900 17 $6,370
Southern Grampians 1 $270 2 $40 11 $478
Warrnambool 5 $58 9 $321 8 $700
Regional - - - - 2 $130
Total 15 $2,672 27 $1,697 60 $11,617
Table 2. Comparison of the number and assessed value of projects 2005, 2008, 2011
The following graph shows that 34% of the value of projects identified in the 2005 report were
completed and 20% in 2008. A more favourable outlook is forecast in the current outlook with 52%
of the value projects classed as ‘definite’ and ‘likely’.
Figure 1. Value of 2005 and 2008 completed projects and Value of Definite/Likely projects of 2011
0 0
$6,063
$2,672
$1,761
0
$7,838 $8,631
$11,617
$0
$2,000
$4,000
$6,000
$8,000
$10,000
$12,000
$14,000
2005 2008 2011
$m
Definitely/Likely
Completed
Grand Total
6
PART A – The Great South Coast Region
1. Introduction
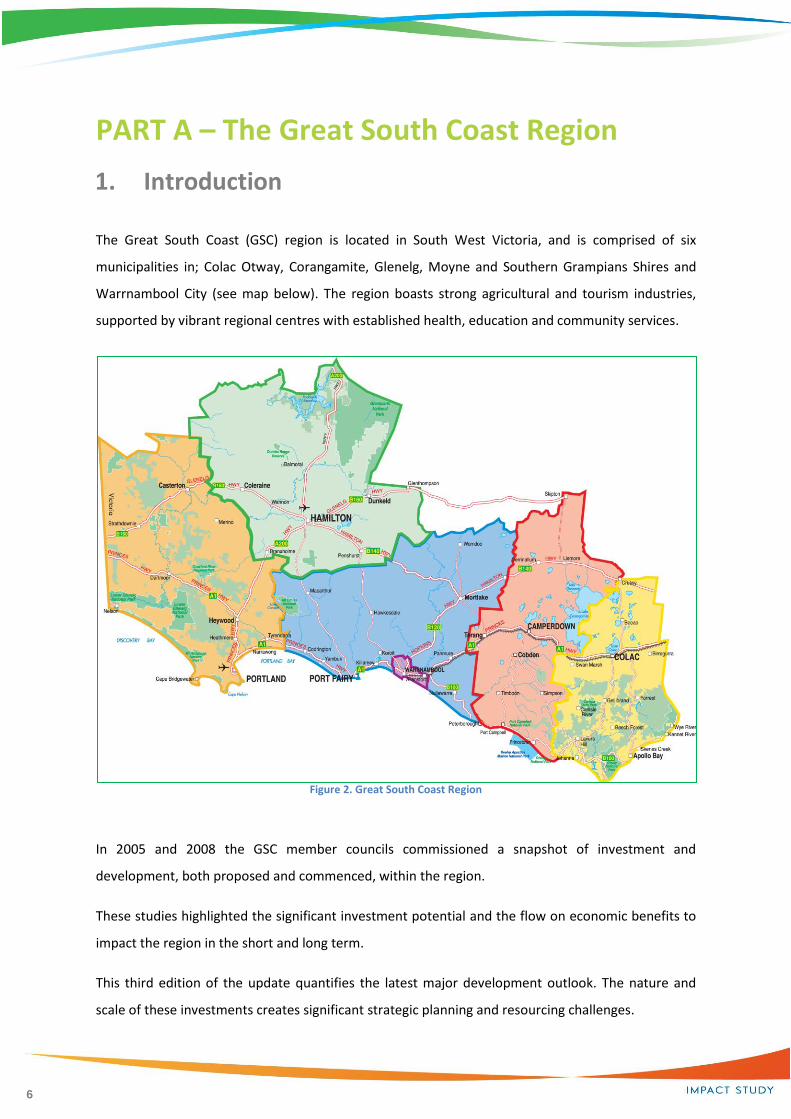
The Great South Coast (GSC) region is located in South West Victoria, and is comprised of six
municipalities in; Colac Otway, Corangamite, Glenelg, Moyne and Southern Grampians Shires and
Warrnambool City (see map below). The region boasts strong agricultural and tourism industries,
supported by vibrant regional centres with established health, education and community services.
Figure 2. Great South Coast Region
In 2005 and 2008 the GSC member councils commissioned a snapshot of investment and
development, both proposed and commenced, within the region.
These studies highlighted the significant investment potential and the flow on economic benefits to
impact the region in the short and long term.
This third edition of the update quantifies the latest major development outlook. The nature and
scale of these investments creates significant strategic planning and resourcing challenges.
7
This report also investigates and analyses the cumulative impacts of four key challenges – workforce,
accommodation, social infrastructure and the freight transport network.
As with the previous studies, this document highlights the opportunities for the region in terms of
investment and development within the next five years.
The threshold value for project inclusion in the study is $4 million. This was the minimum level of
investment identified by the project steering committee as being appropriate for this study.
This study contains both primary and secondary research. Project information has been collected
from member council representatives, particularly economic development and planning units,
industry bodies and private companies.
8
Figure 3. Regional Population Trends
0
5,000
10,000
15,000
20,000
25,000
30,000
35,000
40,000
Colac-Otway Corangamite Glenelg Moyne Southern Grampians
Warrnambool
Population 2004 Population 2007 Population 2010
2. Regional Overview
2.1 Population
Current
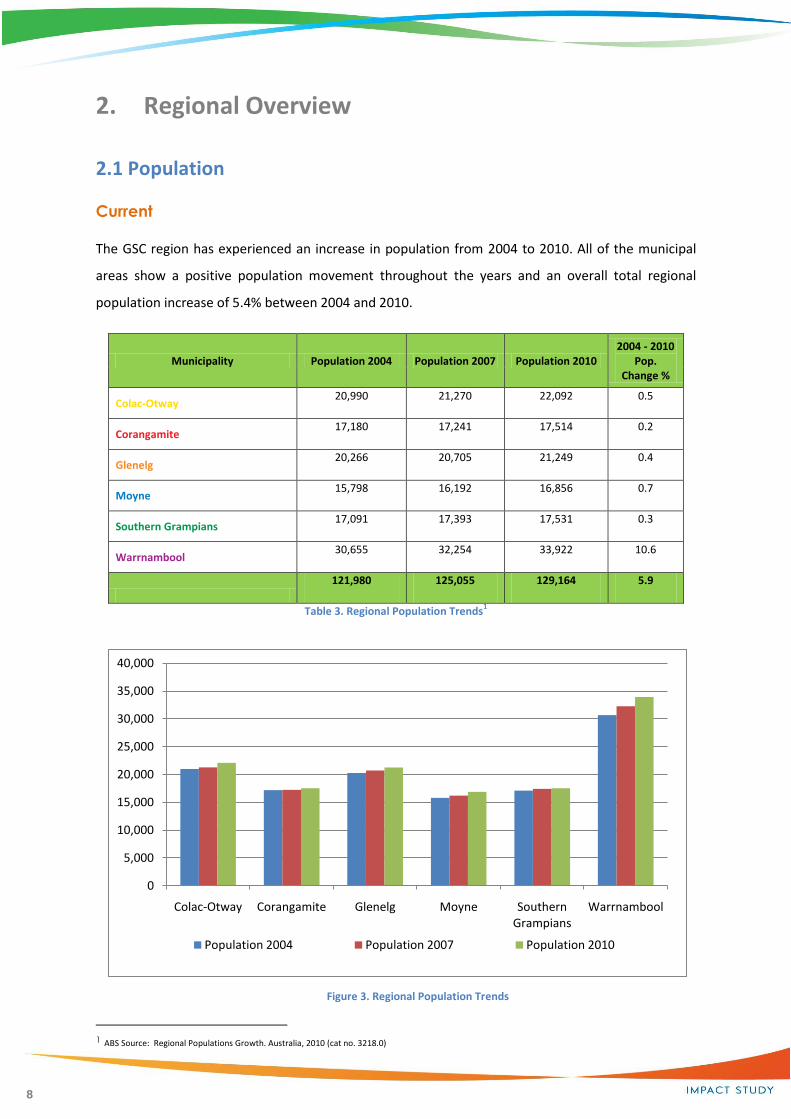
The GSC region has experienced an increase in population from 2004 to 2010. All of the municipal
areas show a positive population movement throughout the years and an overall total regional
population increase of 5.4% between 2004 and 2010.
Municipality Population 2004 Population 2007 Population 2010 2004 - 2010
Pop. Change %
Colac-Otway 20,990 21,270 22,092 0.5
Corangamite 17,180 17,241 17,514 0.2
Glenelg 20,266 20,705 21,249 0.4
Moyne 15,798 16,192 16,856 0.7
Southern Grampians 17,091 17,393 17,531 0.3
Warrnambool 30,655 32,254 33,922 10.6
121,980 125,055 129,164 5.9
Table 3. Regional Population Trends1
1 ABS Source: Regional Populations Growth. Australia, 2010 (cat no. 3218.0)

9
Forecast
The following population forecasts show a range of variation in population growth performance
across the region with Warrnambool City expected to experience strong levels of growth. Moyne
and Colac-Otway indicate moderate growth levels.
Location 2006 2011 2016 2021 2026 2006-
2026 % increase
Colac-Otway 21,036 21,616 22,113 22,613 23,116 10%
Corangamite 17,171 17,479 17,608 17,696 17,884 4%
Glenelg 20,525 21,081 21,405 21,670 21,961 7%
Moyne 16,002 16,509 16,921 17,390 17,958 12%
Southern Grampians 17,181 17,348 17,423 17,563 17,709 3%
Warrnambool 31,501 33,321 35,223 37,267 39,229 25%
Great South Coast 123,416 127,354 130,693 134,199 137,857 12%
Rural Victoria 1,383,318 1,466,224 1,545,205 1,627,247 1,710,327 12%
Victoria 5,128,300 5,549,799 5,942,900 6,332,765 6,711,178 31%
Table 4. Population Forecast - total estimated resident population2
Based on the 2006 population table and the labour force figures for the same year (54,936), the
region had a workforce participation rate of 45% in 2006. Using this percentage against the forecast
population above, the region will need to generate 1,502 new jobs by 2016, a further 1,578 by 1021
and further 1,646 by 2026. Over the 15 year period to 2026, this equates to the creation of over
4,700 new jobs. Warrnambool alone will need to provide over 2,600 new jobs over the 2011-2026
period.
The age range of the GSC population is highest in the 10-19 years and 40-59 years age groups. There
is a sharp decrease in residents aged between 20-29 years, which is consistent with regional trends.
2 ABS 2006 Census of Population and Housing, Community Profile Series, X38 industry of employment(a) by hours worked by sex
10
2.2 Work Force
Employment Data
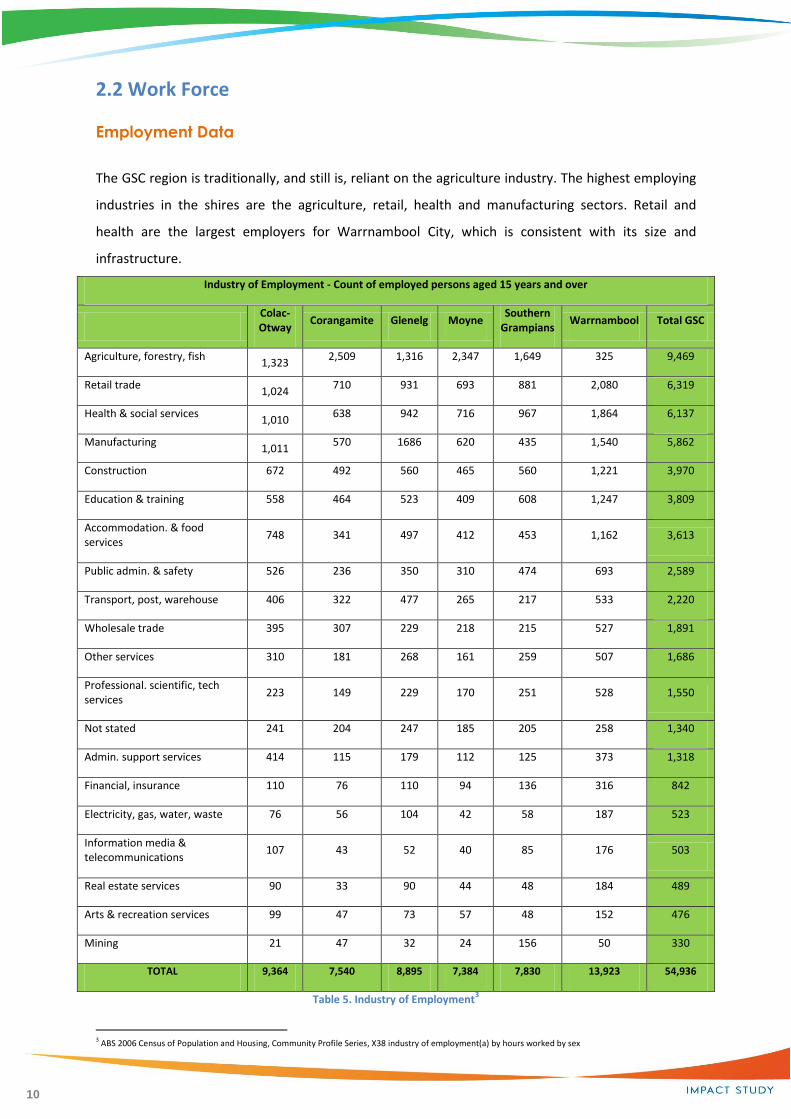
The GSC region is traditionally, and still is, reliant on the agriculture industry. The highest employing
industries in the shires are the agriculture, retail, health and manufacturing sectors. Retail and
health are the largest employers for Warrnambool City, which is consistent with its size and
infrastructure.
Industry of Employment - Count of employed persons aged 15 years and over
Colac-Otway
Corangamite Glenelg Moyne Southern
Grampians Warrnambool Total GSC
Agriculture, forestry, fish 1,323
2,509 1,316 2,347 1,649 325 9,469
Retail trade 1,024
710 931 693 881 2,080 6,319
Health & social services 1,010
638 942 716 967 1,864 6,137
Manufacturing 1,011
570 1686 620 435 1,540 5,862
Construction 672 492 560 465 560 1,221 3,970
Education & training 558 464 523 409 608 1,247 3,809
Accommodation. & food services
748 341 497 412 453 1,162 3,613
Public admin. & safety 526 236 350 310 474 693 2,589
Transport, post, warehouse 406 322 477 265 217 533 2,220
Wholesale trade 395 307 229 218 215 527 1,891
Other services 310 181 268 161 259 507 1,686
Professional. scientific, tech services
223 149 229 170 251 528 1,550
Not stated 241 204 247 185 205 258 1,340
Admin. support services 414 115 179 112 125 373 1,318
Financial, insurance 110 76 110 94 136 316 842
Electricity, gas, water, waste 76 56 104 42 58 187 523
Information media & telecommunications
107 43 52 40 85 176 503
Real estate services 90 33 90 44 48 184 489
Arts & recreation services 99 47 73 57 48 152 476
Mining 21 47 32 24 156 50 330
TOTAL 9,364 7,540 8,895 7,384 7,830 13,923 54,936
Table 5. Industry of Employment3
3 ABS 2006 Census of Population and Housing, Community Profile Series, X38 industry of employment(a) by hours worked by sex
11
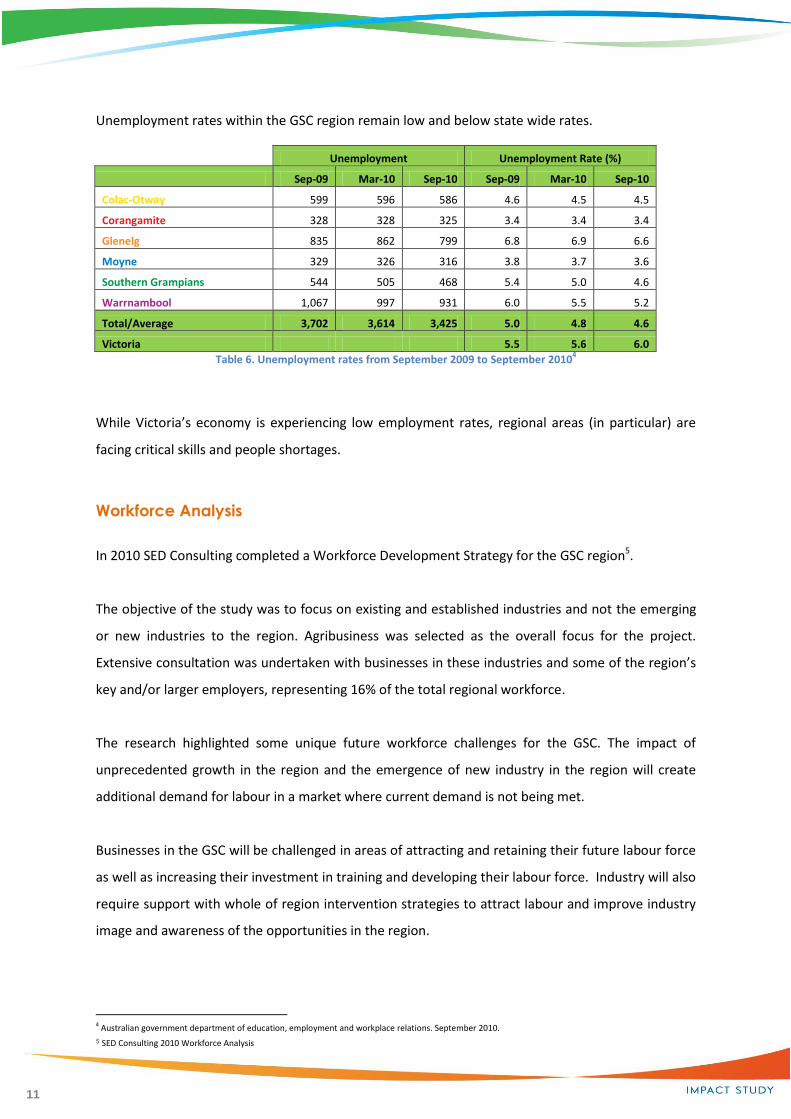
Unemployment rates within the GSC region remain low and below state wide rates.
Unemployment Unemployment Rate (%)
Sep-09 Mar-10 Sep-10 Sep-09 Mar-10 Sep-10
Colac-Otway 599 596 586 4.6 4.5 4.5
Corangamite 328 328 325 3.4 3.4 3.4
Glenelg 835 862 799 6.8 6.9 6.6
Moyne 329 326 316 3.8 3.7 3.6
Southern Grampians 544 505 468 5.4 5.0 4.6
Warrnambool 1,067 997 931 6.0 5.5 5.2
Total/Average 3,702 3,614 3,425 5.0 4.8 4.6
Victoria 5.5 5.6 6.0
Table 6. Unemployment rates from September 2009 to September 20104
While Victoria’s economy is experiencing low employment rates, regional areas (in particular) are
facing critical skills and people shortages.
Workforce Analysis
In 2010 SED Consulting completed a Workforce Development Strategy for the GSC region5.
The objective of the study was to focus on existing and established industries and not the emerging
or new industries to the region. Agribusiness was selected as the overall focus for the project.
Extensive consultation was undertaken with businesses in these industries and some of the region’s
key and/or larger employers, representing 16% of the total regional workforce.
The research highlighted some unique future workforce challenges for the GSC. The impact of
unprecedented growth in the region and the emergence of new industry in the region will create
additional demand for labour in a market where current demand is not being met.
Businesses in the GSC will be challenged in areas of attracting and retaining their future labour force
as well as increasing their investment in training and developing their labour force. Industry will also
require support with whole of region intervention strategies to attract labour and improve industry
image and awareness of the opportunities in the region.
4 Australian government department of education, employment and workplace relations. September 2010. 5 SED Consulting 2010 Workforce Analysis
12
The significant findings from the research presented some clear messages:
1. Almost 40% of GSC businesses currently report job vacancies representing approximately
2.7% of the regional workforce
2. Further, 62% of businesses in the region expect to increase their workforce in the next 3
years as compared with State wide data of 35%.
3. Average annual employment growth in all areas within the GSC region is forecast to outstrip
population growth over the next decade, a rate higher than any other region in the state,
4. Recruitment is currently problematic with 77% of businesses who have attempted to recruit
in the past 2 years having experienced difficulty.
5. The focus industries researched are encumbered with poor industry image, and 53% of
businesses highlighted it a key issue in attracting employees.
6. Businesses have not adequately adjusted to the new workforce reality with employers still
predominantly using traditional recruitment methods that are limited to seeking staff only
from the local area.
7. This approach, combined with increased demand from new industry to the region is creating
competitive labour cost pressures and will ultimately be at the expense of traditional and
established industries without an increase in the labour pool.
8. Retention of employees is not perceived to be a problem generally, however the retention
of employees relocated to the area was reported as a significant issue. Given the growth
trends, this problem will be magnified in future unless the barriers to retention are resolved.
9. Businesses are taking greater responsibility for training their workforce but perceive that a
gap exists in the provision of industry responsive training.
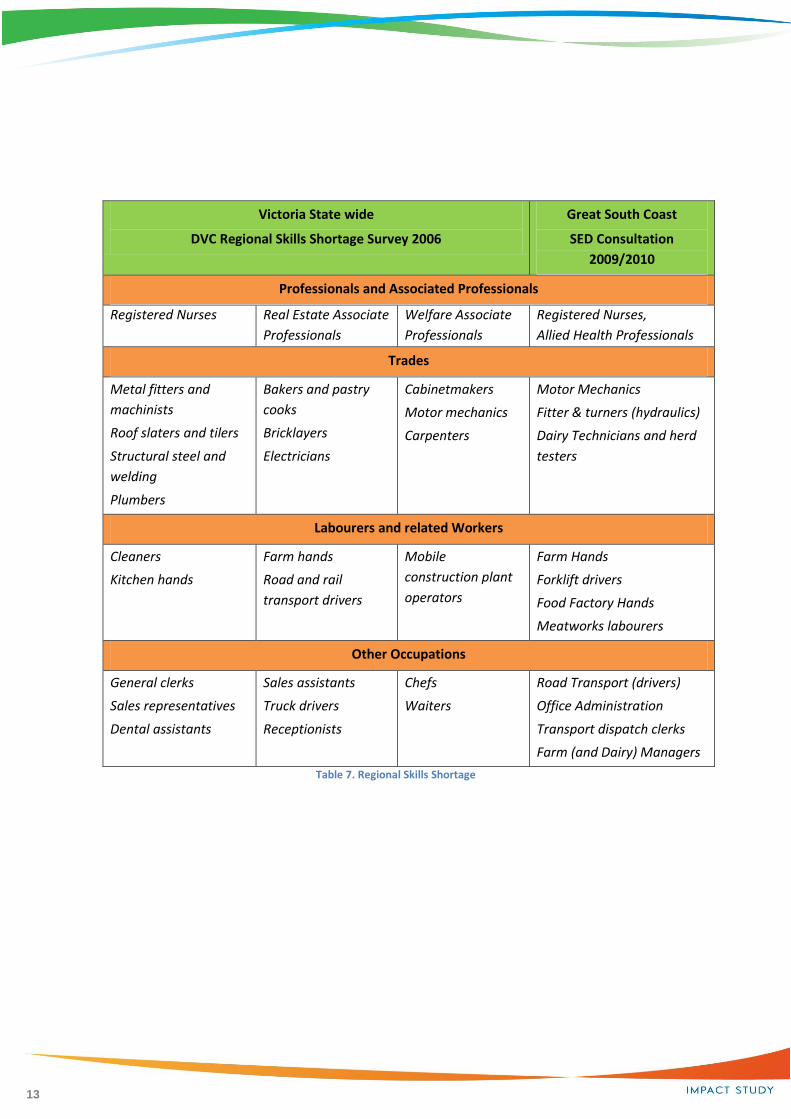
A Regional Skills Shortage Survey, Victoria report (2006), commissioned by the Department for
Victorian Communities (Victorian Government) summarised the following occupations that
employers are having the greatest difficulty filling. This data was cross referenced to the findings
from the GSC Workforce Development Strategy Project.
13
Victoria State wide
DVC Regional Skills Shortage Survey 2006
Great South Coast
SED Consultation
2009/2010
Professionals and Associated Professionals
Registered Nurses Real Estate Associate
Professionals
Welfare Associate
Professionals
Registered Nurses,
Allied Health Professionals
Trades
Metal fitters and
machinists
Roof slaters and tilers
Structural steel and
welding
Plumbers
Bakers and pastry
cooks
Bricklayers
Electricians
Cabinetmakers
Motor mechanics
Carpenters
Motor Mechanics
Fitter & turners (hydraulics)
Dairy Technicians and herd
testers
Labourers and related Workers
Cleaners
Kitchen hands
Farm hands
Road and rail
transport drivers
Mobile
construction plant
operators
Farm Hands
Forklift drivers
Food Factory Hands
Meatworks labourers
Other Occupations
General clerks
Sales representatives
Dental assistants
Sales assistants
Truck drivers
Receptionists
Chefs
Waiters
Road Transport (drivers)
Office Administration
Transport dispatch clerks
Farm (and Dairy) Managers
Table 7. Regional Skills Shortage
14
$0 $500 $1,000 $1,500 $2,000 $2,500 $3,000 $3,500 $4,000 $4,500 $5,000
Manufacturing
Agriculture, Forestry & Fishing
Construction
Rental, Hiring & Real Estate Services
Wholesale Trade
Retail Trade
Health Care & Social Assistance
Mining
Transport, Postal & Warehousing
Accommodation & Food Services
Financial & Insurance Services
Public Administration & Safety
Education & Training
Professional, Scientific & Technical Services
Administrative & Support Services
Other Services
Electricity, Gas, Water & Waste Services
Information Media & Telecommunications
Arts & Recreation Services
GSC Economic output by sector 2011 ($m)
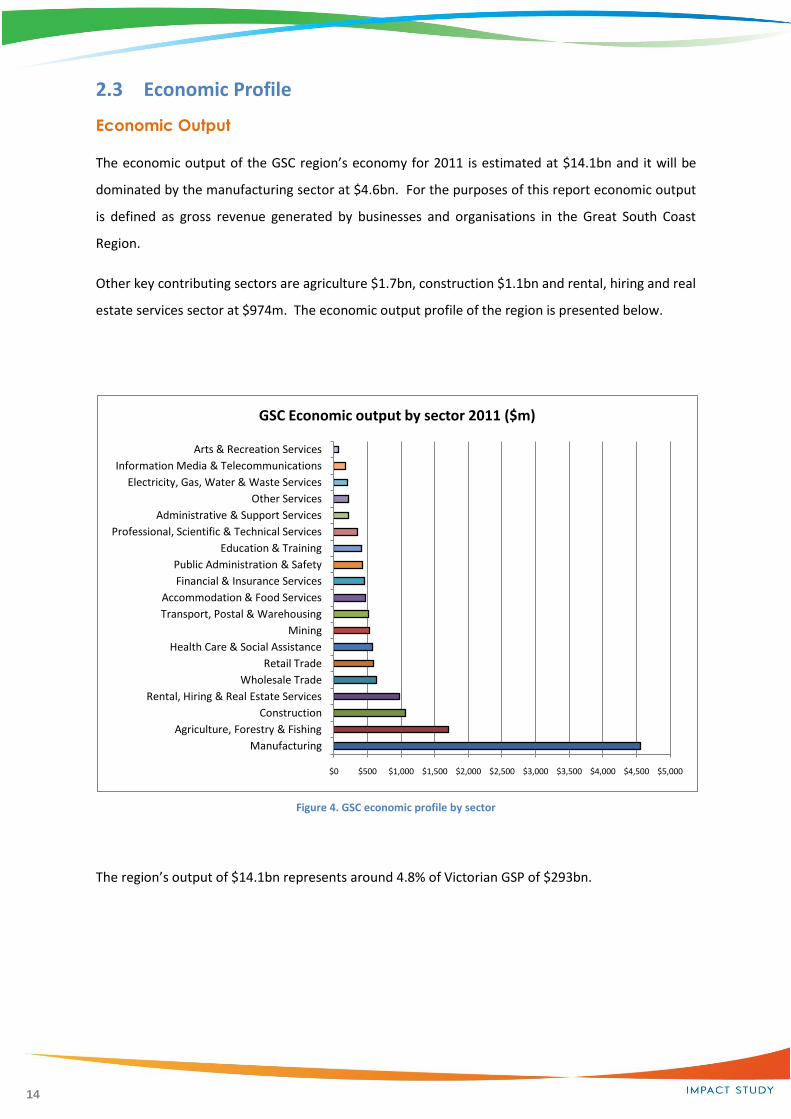
2.3 Economic Profile
Economic Output
The economic output of the GSC region’s economy for 2011 is estimated at $14.1bn and it will be
dominated by the manufacturing sector at $4.6bn. For the purposes of this report economic output
is defined as gross revenue generated by businesses and organisations in the Great South Coast
Region.
Other key contributing sectors are agriculture $1.7bn, construction $1.1bn and rental, hiring and real
estate services sector at $974m. The economic output profile of the region is presented below.
Figure 4. GSC economic profile by sector
The region’s output of $14.1bn represents around 4.8% of Victorian GSP of $293bn.
15
$0 $50 $100 $150 $200 $250 $300 $350 $400 $450 $500
Manufacturing
Health Care & Social Assistance
Education & Training
Retail Trade
Public Administration & Safety
Wholesale Trade
Agriculture, Forestry & Fishing
Construction
Financial & Insurance Services
Transport, Postal & Warehousing
Accommodation & Food Services
Professional, Scientific & Technical Services
Administrative & Support Services
Other Services
Mining
Electricity, Gas, Water & Waste Services
Rental, Hiring & Real Estate Services
Information Media & Telecommunications
Arts & Recreation Services
GSC wages and salaries by sector 2011 ($m)
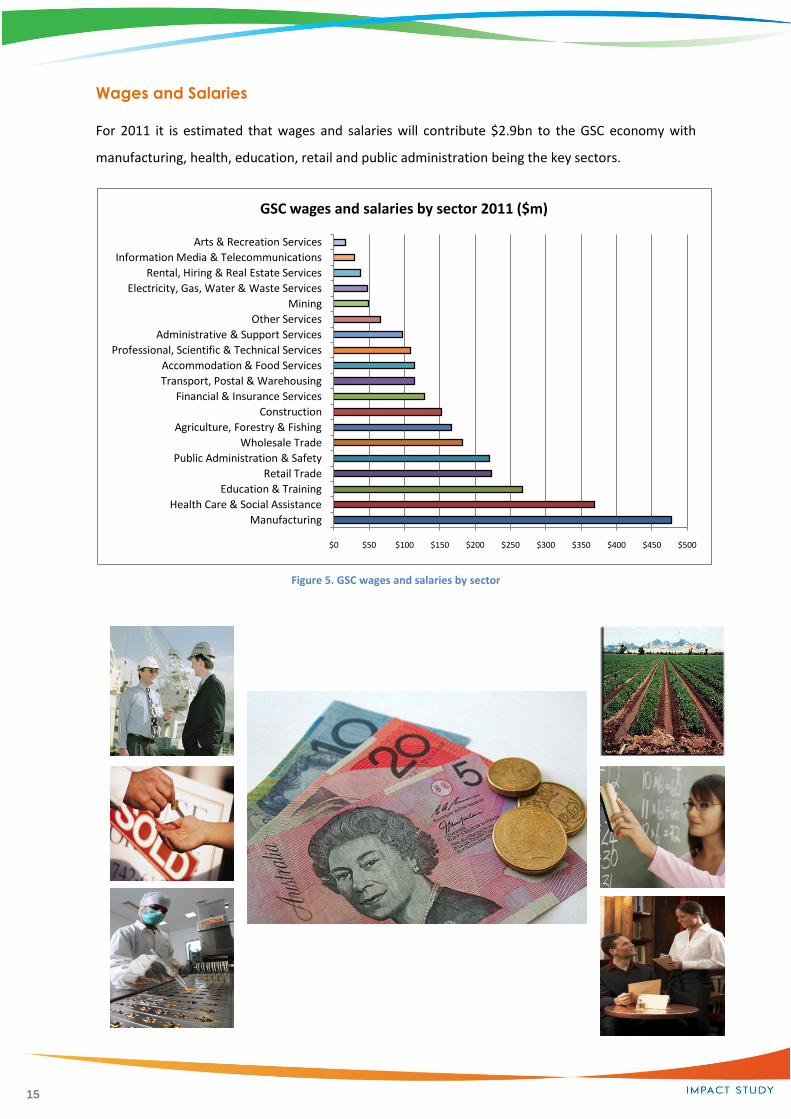
Wages and Salaries
For 2011 it is estimated that wages and salaries will contribute $2.9bn to the GSC economy with
manufacturing, health, education, retail and public administration being the key sectors.
Figure 5. GSC wages and salaries by sector
16
$0 $500 $1,000 $1,500 $2,000 $2,500 $3,000 $3,500
Manufacturing
Agriculture, Forestry & Fishing
Mining
Accommodation & Food Services
Wholesale Trade
Transport, Postal & Warehousing
ConstructionElectricity, Gas, Water & Waste Services
Health Care & Social Assistance
Public Administration & Safety
Education & TrainingFinancial & Insurance Services
Retail Trade
Professional, Scientific & Technical Services
Information Media & Telecommunications
Rental, Hiring & Real Estate Services
Arts & Recreation Services
Administrative & Support ServicesOther Services
GSC exports by sector 2011 ($m)
$0 $100 $200 $300 $400 $500 $600 $700 $800 $900 $1,000
ManufacturingAgriculture, Forestry & Fishing
ConstructionTransport, Postal & Warehousing
Professional, Scientific & Technical ServicesWholesale Trade
Financial & Insurance ServicesAdministrative & Support Services
MiningRental, Hiring & Real Estate Services
Retail TradeOther Services
Information Media & TelecommunicationsElectricity, Gas, Water & Waste Services
Accommodation & Food ServicesPublic Administration & Safety
Education & TrainingArts & Recreation Services
Health Care & Social Assistance
GSC local sales by sector 2011 ($m)
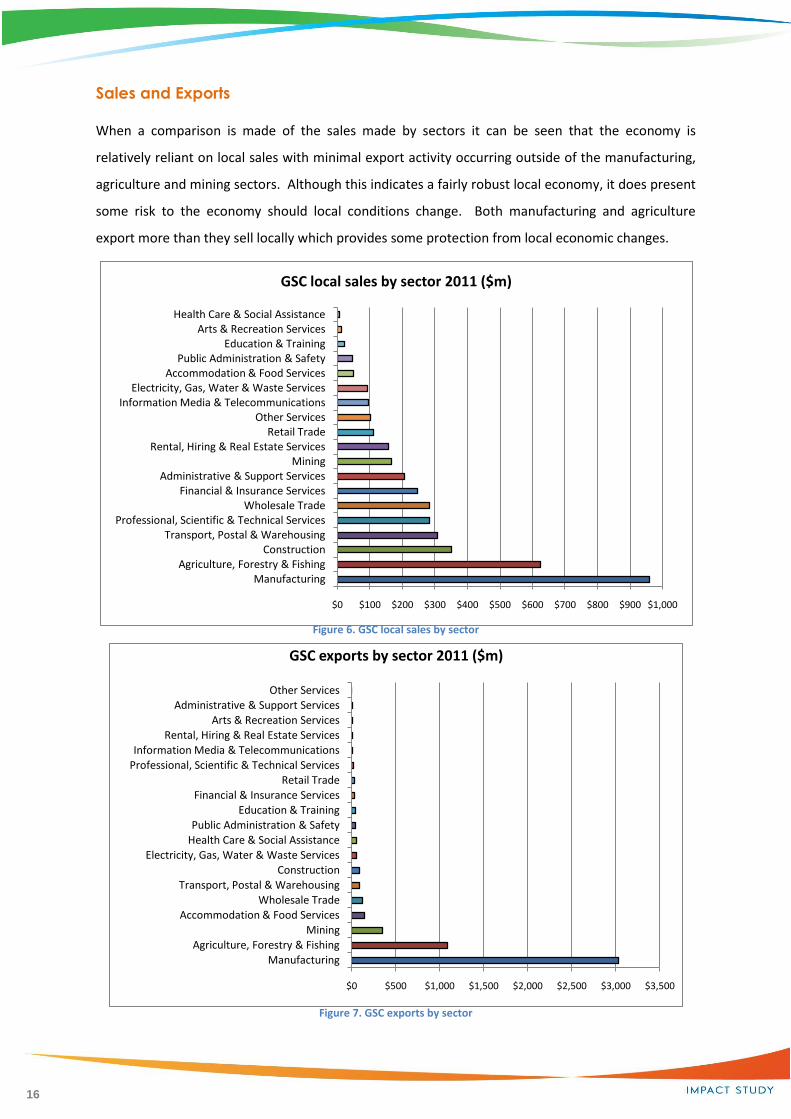
Sales and Exports
When a comparison is made of the sales made by sectors it can be seen that the economy is
relatively reliant on local sales with minimal export activity occurring outside of the manufacturing,
agriculture and mining sectors. Although this indicates a fairly robust local economy, it does present
some risk to the economy should local conditions change. Both manufacturing and agriculture
export more than they sell locally which provides some protection from local economic changes.
Figure 6. GSC local sales by sector
Figure 7. GSC exports by sector
17
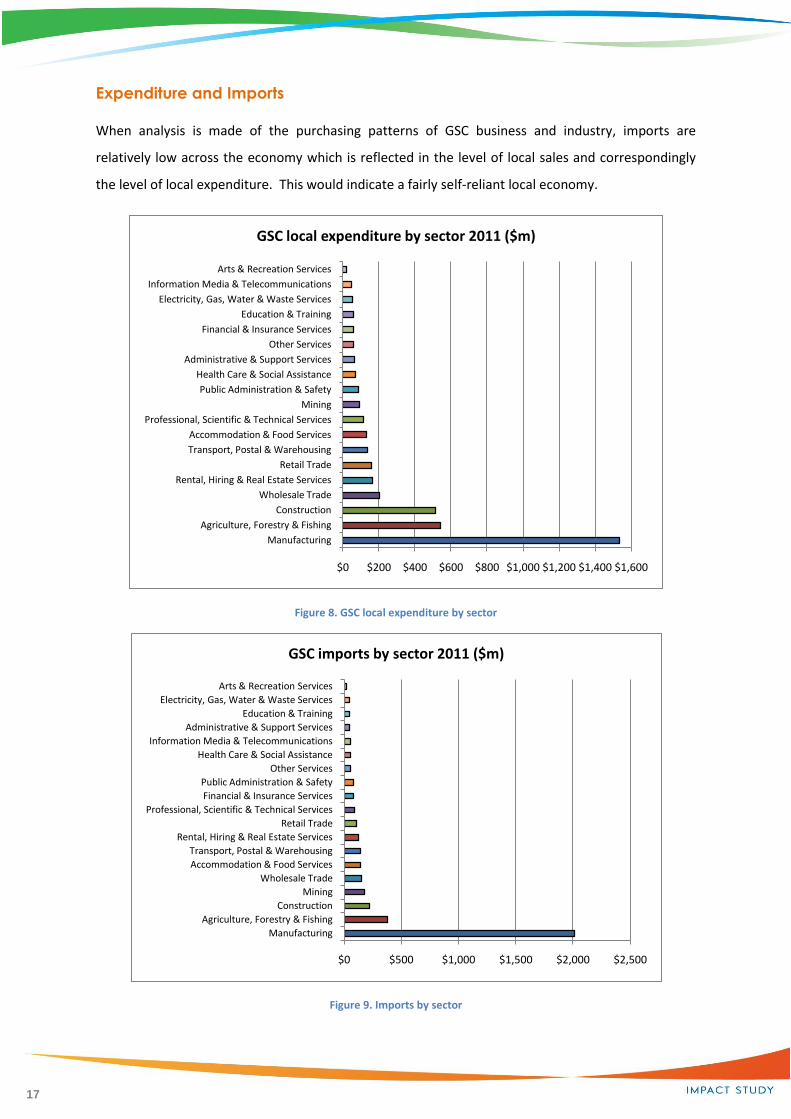
Expenditure and Imports
When analysis is made of the purchasing patterns of GSC business and industry, imports are
relatively low across the economy which is reflected in the level of local sales and correspondingly
the level of local expenditure. This would indicate a fairly self-reliant local economy.
Figure 8. GSC local expenditure by sector
Figure 9. Imports by sector
$0 $200 $400 $600 $800 $1,000 $1,200 $1,400 $1,600
Manufacturing
Agriculture, Forestry & Fishing
Construction
Wholesale Trade
Rental, Hiring & Real Estate Services
Retail Trade
Transport, Postal & Warehousing
Accommodation & Food Services
Professional, Scientific & Technical Services
Mining
Public Administration & Safety
Health Care & Social Assistance
Administrative & Support Services
Other Services
Financial & Insurance Services
Education & Training
Electricity, Gas, Water & Waste Services
Information Media & Telecommunications
Arts & Recreation Services
GSC local expenditure by sector 2011 ($m)
$0 $500 $1,000 $1,500 $2,000 $2,500
Manufacturing
Agriculture, Forestry & Fishing
Construction
Mining
Wholesale Trade
Accommodation & Food Services
Transport, Postal & Warehousing
Rental, Hiring & Real Estate Services
Retail Trade
Professional, Scientific & Technical Services
Financial & Insurance Services
Public Administration & Safety
Other Services
Health Care & Social Assistance
Information Media & Telecommunications
Administrative & Support Services
Education & Training
Electricity, Gas, Water & Waste Services
Arts & Recreation Services
GSC imports by sector 2011 ($m)
18
0
100
200
300
400
500
600
700
800
2005
2007
2009
2005
2007
2009
2005
2007
2009
2005
2007
2009
2005
2007
2009
2005
2007
2009
Colac-Otway Corangamite Glenelg Moyne S. Grampians Warrnambool
Industrial
Hospital/
healthcare
& Public
Buildings
Domestic &
Residential
Commercial
& Retail
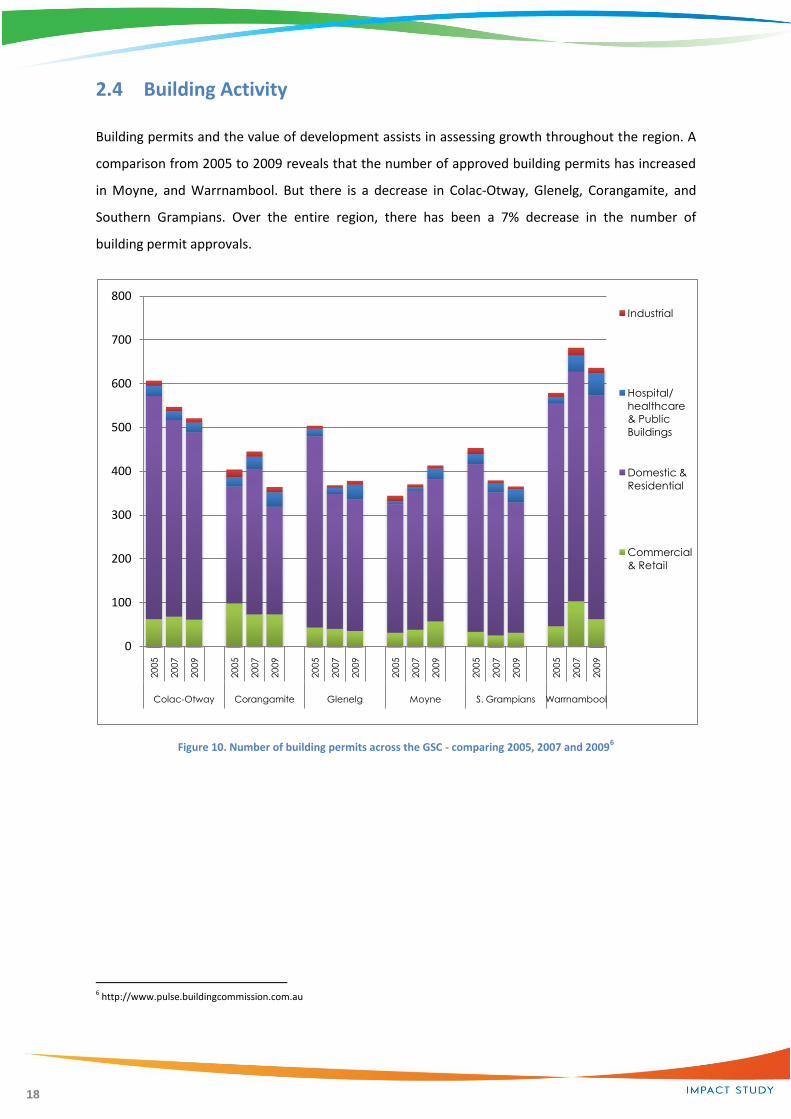
2.4 Building Activity
Building permits and the value of development assists in assessing growth throughout the region. A
comparison from 2005 to 2009 reveals that the number of approved building permits has increased
in Moyne, and Warrnambool. But there is a decrease in Colac-Otway, Glenelg, Corangamite, and
Southern Grampians. Over the entire region, there has been a 7% decrease in the number of
building permit approvals.
Figure 10. Number of building permits across the GSC - comparing 2005, 2007 and 20096
6 http://www.pulse.buildingcommission.com.au
19
0
20,000
40,000
60,000
80,000
100,000
120,000
140,000
160,000
180,000
200,0002005
2007
2009
2005
2007
2009
2005
2007
2009
2005
2007
2009
2005
2007
2009
2005
2007
2009
Colac-Otway Corangamite Glenelg Moyne S. Grampians Warrnambool
Industrial
Hospital/
healthcare
& Public
Buildings
Domestic &
Residential
Commercial
& Retail
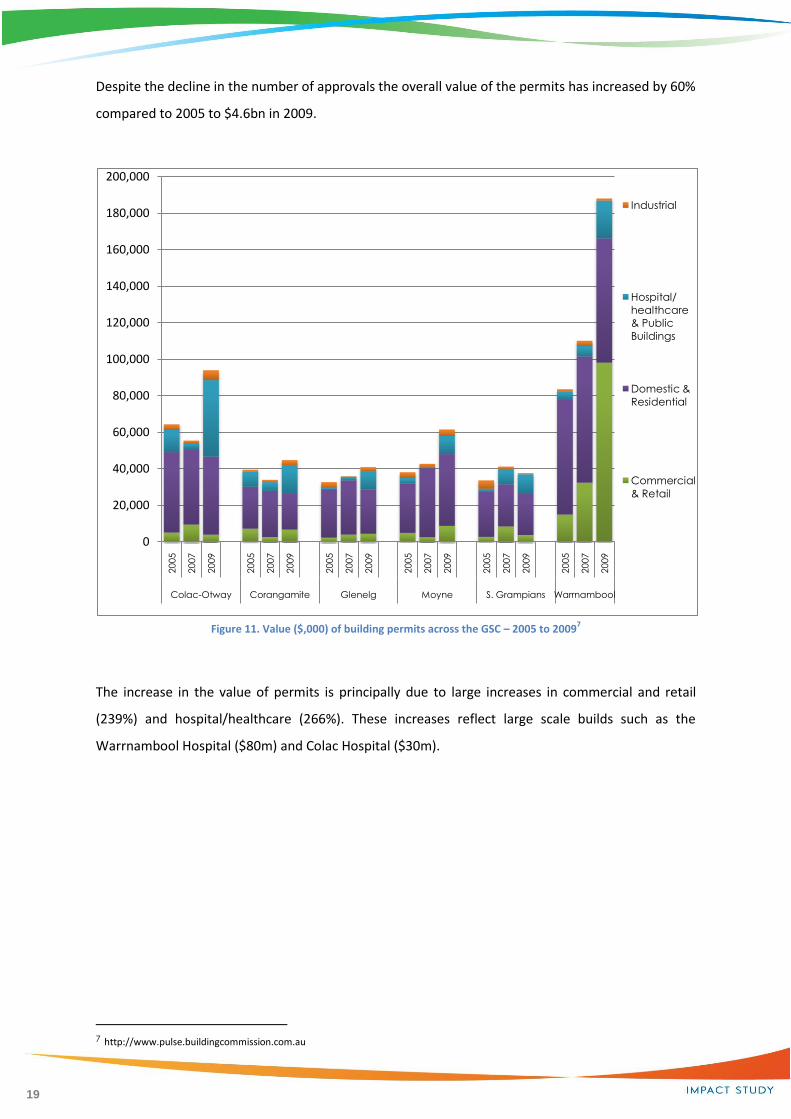
Despite the decline in the number of approvals the overall value of the permits has increased by 60%
compared to 2005 to $4.6bn in 2009.
Figure 11. Value ($,000) of building permits across the GSC – 2005 to 20097
The increase in the value of permits is principally due to large increases in commercial and retail
(239%) and hospital/healthcare (266%). These increases reflect large scale builds such as the
Warrnambool Hospital ($80m) and Colac Hospital ($30m).
7 http://www.pulse.buildingcommission.com.au
20
2.5 Key Findings
Regional Overview
The region has experienced solid population growth over the past 5 years [5.4%] and the
projections to 2026 show a continuation of this trend.
Growth is strongest in Warrnambool City
The potential for jobs growth within the existing economy is solid – over 1,500 new jobs in
the next 5 years
A 2010 workforce study found that 62% of businesses surveyed in the region expected to
increase their workforce in the next 3 years as compared with State wide data of 35%.
Unemployment within the region is below the State wide average
Average annual employment growth in all areas within the GSC region is forecast to outstrip
population growth over the next decade, a rate higher than any other region in the state,
The region is facing critical skills and people shortages
The economic output for the region for 2011 is estimated at $14.1bn and is dominated by
the manufacturing at $4.6bn
Wages and salaries will contribute $2.9bn to the GSC economy in 2011 with manufacturing,
health, education, retail and public administration key sectors
The economy is relatively reliant on local sales with minimal export activity occurring outside
of the manufacturing, agriculture and mining sectors. Although this indicates a fairly robust
local economy, it does present some risk to the economy should local conditions change
A large increase in the value of building approvals over the past 5 years reflects increases in
large scales builds such as the Warrnambool Hospital

21
PART B – Investment Portfolio 2011- 2016
3. Investment Outlook
3.1 Summary This study has identified sixty major investment projects that are planned for the region over the
next five years. The combined value of the projects is estimated at $11.6 bn.
The projects identified for the region are summarized below:
Municipalities 2011-2016
No. Total Value ($m)
Colac-Otway 7 $797
Corangamite 7 $838
Glenelg 8 $2,304
Moyne 17 $6,370
Southern Grampians 11 $478
Warrnambool 8 $700
Regional 2 $130
Total 60 $11,617 Table 8.Identified number and value of projects for the region
The very positive outlook for major investment in the region continues the trend quantified in the
earlier Snapshots prepared in 2005 and 2008.
2005 Snapshot 2008 Snapshot 2011 Snapshot
No. Total Value
($m) No.
Total Value ($m)
No. Total Value
($m)
Colac-Otway 5 $596 8 $780 7 $797
Corangamite 4 $1,213 11 $926 7 $838
Glenelg 11 $3,030 14 $1,784 8 $2,304
Moyne 6 $2,460 14 $4,527 17 $6,370
Southern Grampians 1 $270 6 $285 11 $478
Warrnambool 7 $269 10 $330 8 $700
Regional - - - - 2 $130
Total 34 $7,838 63 $8,631 60 $11,617
Table 9. Comparison of 2005, 2008 and 2011 snapshot

22
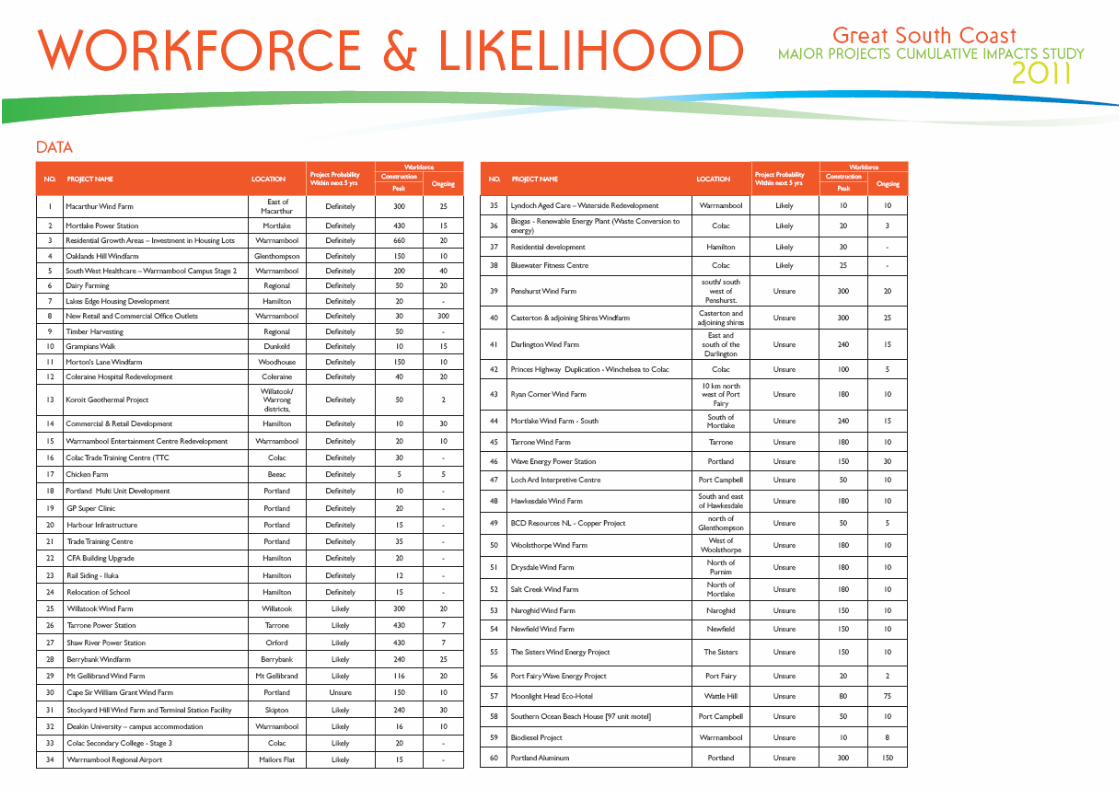
3.2 Project List
Major Projects Portfolio
The major projects portfolio is listed below, sorted by probability and value:
No. Project Name Location
Project Probability Within next
5 yrs
Project Value $M
Workforce
Construction Ongoing
Peak
1 Macarthur Wind Farm East of Macarthur Definitely 1,000 300 25
2 Mortlake Power Station Mortlake Definitely 505 430 10
3 Residential Growth Areas – Investment in Housing Lots
Warrnambool Definitely 404 660 20
4 Oaklands Hill Windfarm Glenthompson Definitely 200 150 10
5 South West Healthcare – Warrnambool Campus Stage 2
Warrnambool Definitely 195 200 40
6 Dairy Farming Regional Definitely 100 100 100
7 Lakes Edge Housing Development Hamilton Definitely 80 20 -
8 New Retail and Commercial Office Outlets
Warrnambool Definitely 50 30 300
9 Timber Harvesting8 Regional Definitely 30 50 -
10 Grampians Walk Dunkeld Definitely 26 10 15
11 Morton's Lane Windfarm Woodhouse Definitely 24 150 10
12 Coleraine Hospital Redevelopment Coleraine Definitely 20 40 20
13 Koroit Geothermal Project Willatook/Warrong districts
Definitely 10 50 2
14 Commercial & Retail Development Hamilton Definitely 9 10 30
15 Warrnambool Entertainment Centre Redevelopment
Warrnambool Definitely 9 20 10
16 Colac Trade Training Centre (TTC) Colac Definitely 6 30 -
17 Chicken Farm Beeac Definitely 6 5 5
18 Portland Multi Unit Development Portland Definitely 5 10
19 GP Super Clinic Portland Definitely 5 20 10
20 Harbour Infrastructure Portland Definitely 5 15 1
21 Trade Training Centre Portland Definitely 4 35 6
22 CFA Building Upgrade Hamilton Definitely 4 20 2
23 Rail Siding - Iluka Hamilton Definitely 4 12 -
24 Relocation of school Hamilton Definitely 4 15 -
25 Willatook Wind Farm Willatook Likely 1,000 300 20
26 Tarrone Power Station Tarrone Likely 500 430 7
27 Shaw River Power Station Orford Likely 500 430 7
28 Berrybank Windfarm Berrybank Likely 484 240 25
29 Mt Gellibrand Wind Farm Mt Gellibrand Likely 460 116 20
30 BCD Resources NL – Copper Project north of Glenthompson
Unsure 100 50 5
Subtotal $ 5,749 3,454 695
Table 10. Major projects portfolio
8 Timber Industry will create additional 1,000 contract positions during harvesting over the five years
23
No. Project Name Location
Project Probability Within next
5 yrs
Project Value $M
Workforce
Construction Ongoing
Peak
31 Stockyard Hill Wind Farm and Terminal Station Facility
Skipton Likely 50 240 30
32 Deakin University – campus accommodation
Warrnambool Likely 13 16 10
33 Colac Secondary College - Stage 3 Colac Likely 13 20 -
34 Warrnambool Regional Airport Mailors Flat Likely 11 15 -
35 Lyndoch Aged Care – Waterside Redevelopment
Warrnambool Likely 8 10 10
36 Biogas - Renewable Energy Plant (Waste Conversion to energy)
Colac Likely 7 20 3
37 Residential development Hamilton Likely 7 30 -
38 Bluewater Fitness centre Colac Likely 5 25 2
39 Penshurst Wind Farm south/ south west of Penshurst
Unsure 1,000 300 20
40 Casterton & adjoining Shires Windfarm Casterton and adjoining shires
Unsure 1,000 300 25
41 Darlington Wind Farm East and south of the Darlington
Unsure 720 240 15
42 Princes Highway Duplication - Winchelsea to Colac
Colac Unsure 300 100 5
43 Ryans Corner Wind Farm 10 km north west of Port Fairy
Unsure 300 180 10
44 Mortlake Wind Farm - South South of Mortlake Unsure 200 240 15
45 Tarrone Wind Farm Tarrone Unsure 200 180 10
46 Wave Energy Power Station Portland Unsure 165 150 30
47 Loch Ard Interpretive Centre Port Campbell Unsure 150 50 10
48 Hawkesdale Wind Farm South and east of Hawkesdale
Unsure 130 180 10
49 Portland Wind Energy Project –Stage 4 Cape Sir William Grant Wind Farm
Portland Likely 120 150 10
50 Woolsthorpe Wind Farm West of Woolsthorpe
Unsure 85 180 10
51 Drysdale Wind Farm North of Purnim Unsure 70 180 10
52 Salt Creek Wind Farm North of Mortlake Unsure 70 180 10
53 Naroghid Wind Farm Naroghid Unsure 66 150 10
54 Newfield Wind Farm Newfield Unsure 50 150 10
55 The Sisters Wind Energy Project The Sisters Unsure 50 150 10
56 Port Fairy Wave Energy Project Port Fairy Unsure 30 20 2
57 Moonlight Head Eco-Hotel Wattle Hill Unsure 23 80 75
58 Southern Ocean Beach House [97 unit motel]
Port Campbell Unsure 15 50 10
59 Biodiesel Project Warrnambool Unsure 10 10 8
60 Portland Aluminium Portland Unlikely 1,000 300 150
Subtotal $ 5,868 2,136 323
TOTAL $ 11,617 5,593 1,118
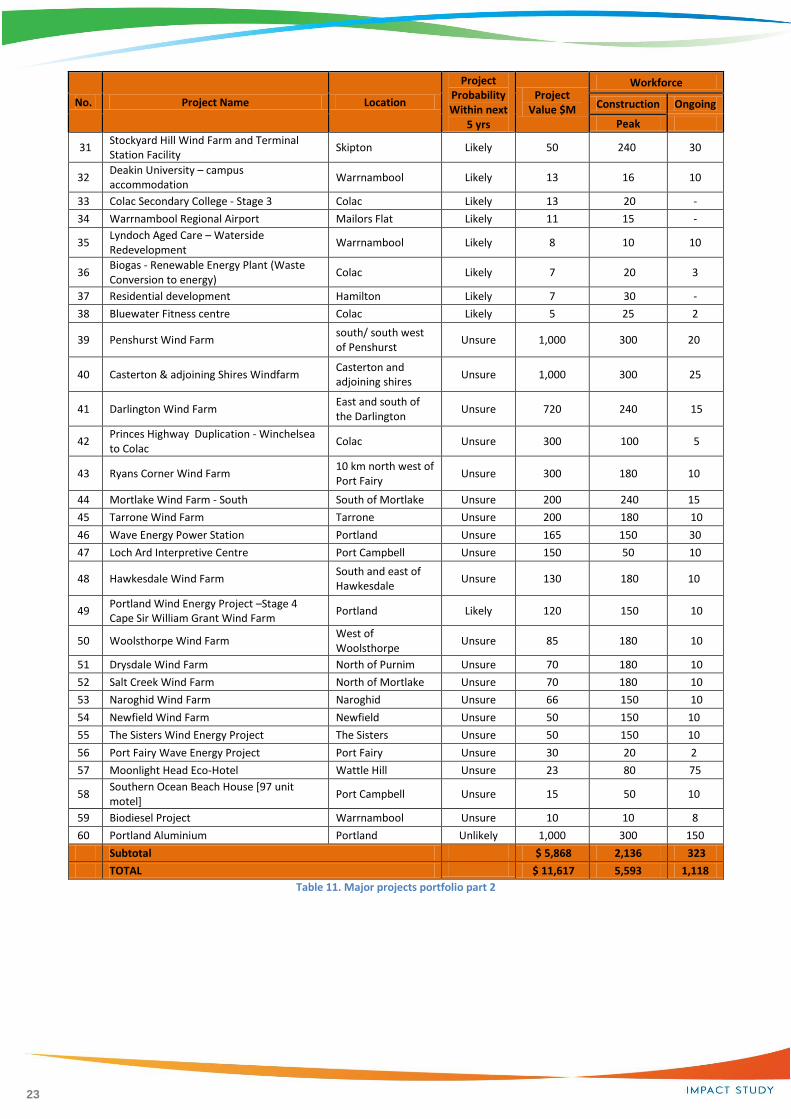
Table 11. Major projects portfolio part 2

24
77%
2%4% 2%3%
9%
Value of Projects by Sector ($m) Energy - $9,006
Dairy/Food Processing - $100
Forestry - $30
Mining - $100
Commercial/Retail - $68
Education - $40
Health - $220
Hospitality/Leisure - $29
Residential - $504
Tourism - $199
Transport - $315
Primary Production - $6
Manufacturing - $1,000
3.3 Project Analysis
All Projects
The projects are dominated, in value, by energy related developments. The energy projects cover a
range of technologies, including wind power, geothermal power, gas fired power, biodiesel and
wave energy.
29
1113
5
3
3
5
3 3 1 1
Number of Projects by SectorEnergy
Dairy/Food Processing
Forestry
Mining
Commercial/Retail
Education
Health
Hospitality/Leisure
Residential
Tourism
Transport
Primary Production
Manufacturing

25
21
3
11 1 2
Number of Energy Projects
Wind
Power
Geothermal
Biogas
Biodiesel
Wave
$7,279
$1,505
$10$7
$10
$195
Value of Energy Projects ($m)
Wind
Power
Geothermal
Biogas
Biodiesel
Wave
Energy Projects
The energy projects cover a range of technologies, including wind power, geothermal power, gas-
fired power, bio-diesel and wave energy totalling 29 projects and $9bn in value. Wind projects
represent 68% by number and 80% by value of total energy projects.

26
$106 $30 $100
$684
$32$215
$24$199
$311
$1,000
Value of Non-Energy Projects ($m)Agriculture
Forestry
Mining
Property
Education
Health
Hospitality/Leisure
Tourism
Transport
Manufacturing
Number of Non-energy projects
Agriculture
Forestry
Mining
Property
Education
Health
Hospitality/Leisure
Tourism
Transport
Manufacturing
Non-energy related projects
The non-energy related projects are dominated by property developments, which include
residential, retail and commercial investments, primarily in the region’s major centres.
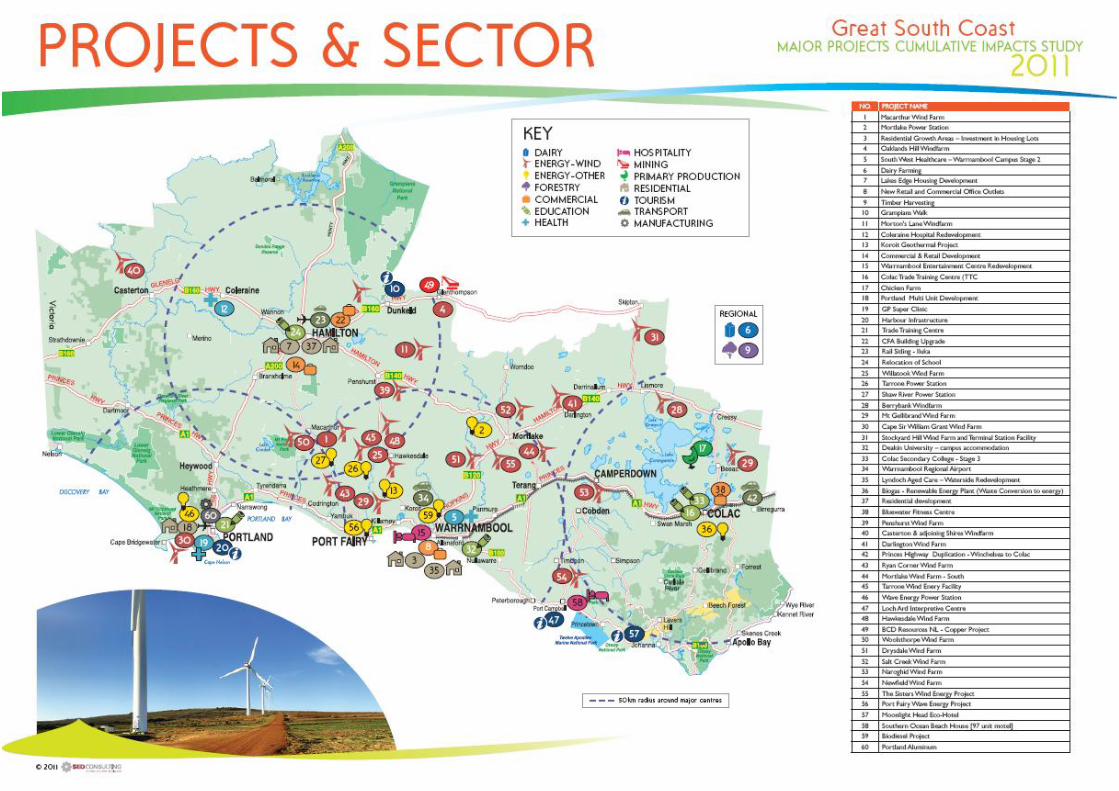
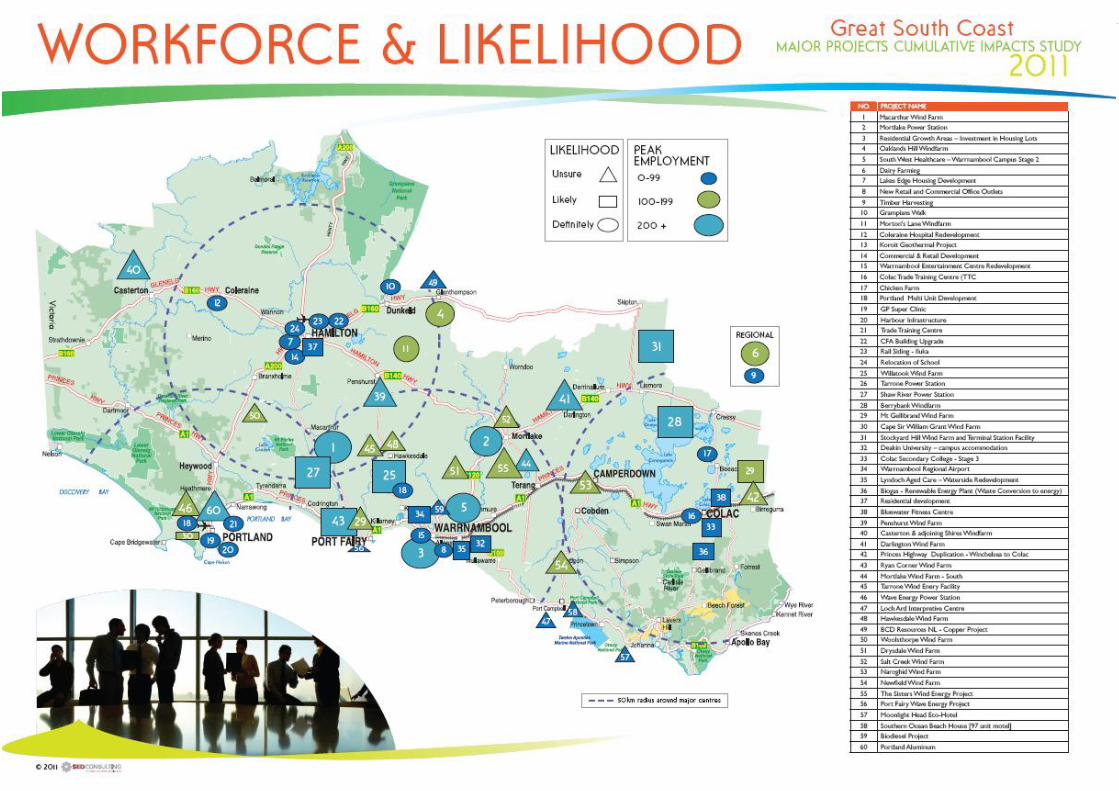
Project locations
The following maps show the location of the projects throughout the GSC by category and by value
27

28

29

30
31
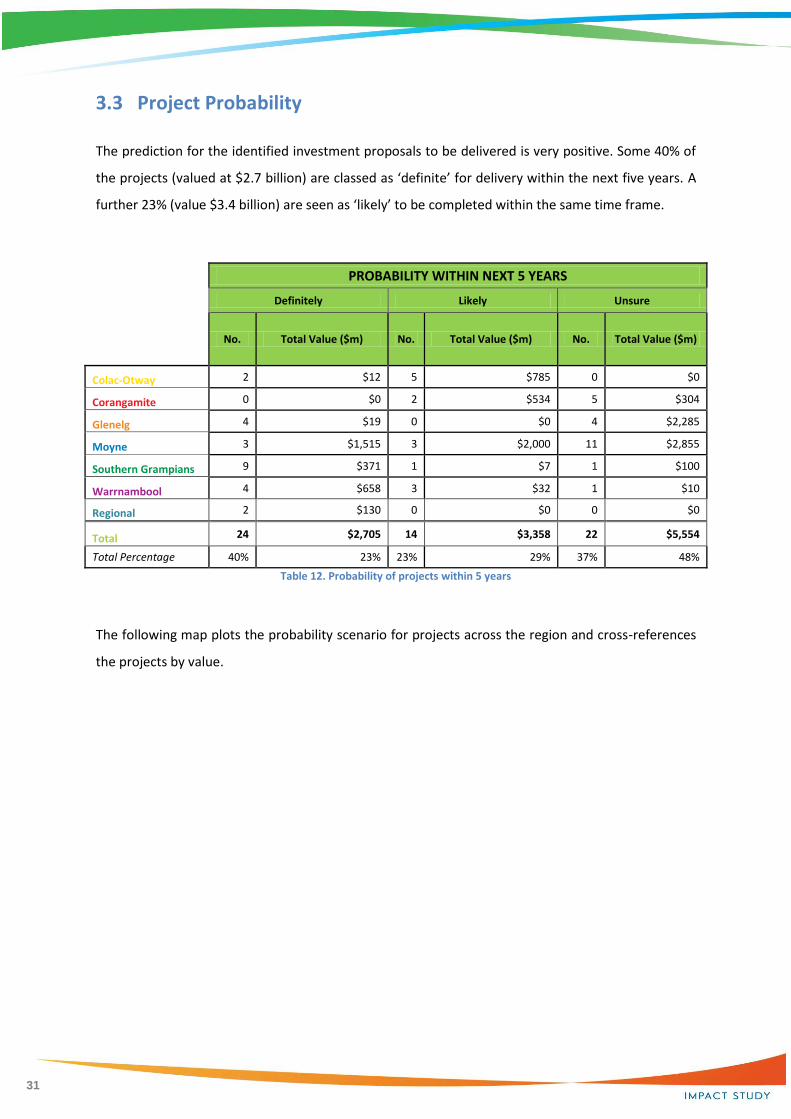
3.3 Project Probability
The prediction for the identified investment proposals to be delivered is very positive. Some 40% of
the projects (valued at $2.7 billion) are classed as ‘definite’ for delivery within the next five years. A
further 23% (value $3.4 billion) are seen as ‘likely’ to be completed within the same time frame.
PROBABILITY WITHIN NEXT 5 YEARS
Definitely Likely Unsure
No. Total Value ($m) No. Total Value ($m) No. Total Value ($m)
Colac-Otway 2 $12 5 $785 0 $0
Corangamite 0 $0 2 $534 5 $304
Glenelg 4 $19 0 $0 4 $2,285
Moyne 3 $1,515 3 $2,000 11 $2,855
Southern Grampians 9 $371 1 $7 1 $100
Warrnambool 4 $658 3 $32 1 $10
Regional 2 $130 0 $0 0 $0
Total 24 $2,705 14 $3,358 22 $5,554
Total Percentage 40% 23% 23% 29% 37% 48%
Table 12. Probability of projects within 5 years
The following map plots the probability scenario for projects across the region and cross-references
the projects by value.

32

33
34
3.4 Economic Analysis
A high level economic analysis of the impact of those projects identified as ‘definite’ has
been undertaken. The analysis focuses on 3 elements:
1. Regional output;
2. Employment; and
3. Value chain analysis
The analysis has been undertaken using REMplan economic modeling software. Consistent
with the scope of this report, the analysis has been conducted over a 5 year timeframe
1. Peak employment numbers from each project identified as definite to proceed
during the construction or build phase; and
2. Using project information, the likely ongoing employment resulting from the project
after the completion of the initial construction or build phase;
The modeling has been summarised to provide:
1. The direct and indirect economic benefit and employment created from the projects
during the construction phase of the projects;
2. The direct and indirect economic benefit and employment that will flow from the
direct project investment after the construction phase; and
3. A value chain analysis of the impacts of the projects on the other sectors of the GSC
economy
35
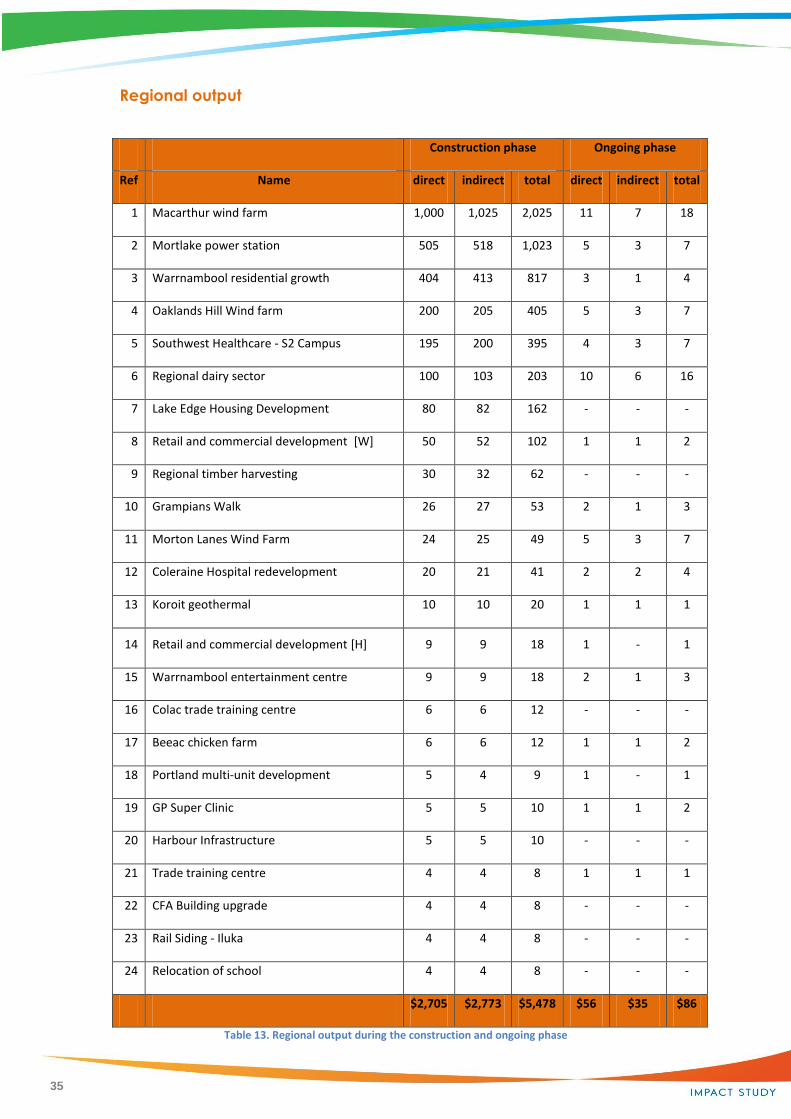
Regional output
Construction phase Ongoing phase
Ref Name direct indirect total direct indirect total
1 Macarthur wind farm 1,000 1,025 2,025 11 7 18
2 Mortlake power station 505 518 1,023 5 3 7
3 Warrnambool residential growth 404 413 817 3 1 4
4 Oaklands Hill Wind farm 200 205 405 5 3 7
5 Southwest Healthcare - S2 Campus 195 200 395 4 3 7
6 Regional dairy sector 100 103 203 10 6 16
7 Lake Edge Housing Development 80 82 162 - - -
8 Retail and commercial development [W] 50 52 102 1 1 2
9 Regional timber harvesting 30 32 62 - - -
10 Grampians Walk 26 27 53 2 1 3
11 Morton Lanes Wind Farm 24 25 49 5 3 7
12 Coleraine Hospital redevelopment 20 21 41 2 2 4
13 Koroit geothermal 10 10 20 1 1 1
14 Retail and commercial development [H] 9 9 18 1 - 1
15 Warrnambool entertainment centre 9 9 18 2 1 3
16 Colac trade training centre 6 6 12 - - -
17 Beeac chicken farm 6 6 12 1 1 2
18 Portland multi-unit development 5 4 9 1 - 1
19 GP Super Clinic 5 5 10 1 1 2
20 Harbour Infrastructure 5 5 10 - - -
21 Trade training centre 4 4 8 1 1 1
22 CFA Building upgrade 4 4 8 - - -
23 Rail Siding - Iluka 4 4 8 - - -
24 Relocation of school 4 4 8 - - -
$2,705 $2,773 $5,478 $56 $35 $86
Table 13. Regional output during the construction and ongoing phase

36
The analysis indicates the following:
Construction phase
The expected $2.7bn worth of initial investment will generate an additional $2.8bn
worth of indirect investment;
This expenditure is of a project nature, it is not reoccurring;
The inherent multiplier across all projects over the region is 2.03, with the highest
project being the Regional Timber Industry development with a multiplier of 2.06, and
the lowest the Portland Multi-unit development with a multiplier of 1.8
If the multiplier could be increased by 10% to 2.23, through for example, increased
use of local firms, improvement in local supply chains, greater local spend then
economic output would increase to $6.0b, and an additional 1,840 jobs would be
created over the 5 year period of this study.
Ongoing phase
After the initial construction phase, the definite projects will result in an additional
$86m worth of economic output per annum
Several projects result in no or very little ongoing economic benefit to the region.
These projects have typically been involved in building infrastructure that of itself is
not productive, for example housing

37
Employment
Construction Phase Ongoing Phase
direct indirect total direct indirect total
1 Macarthur wind farm 330 441 771 25 27 52
2 Mortlake power station 430 574 1,004 10 11 21
3 Warrnambool residential growth 660 860 1,520 7 6 13
4 Oaklands Hill Wind farm 150 200 350 10 11 21
5 Southwest Healthcare - S2 Campus 100 133 233 40 13 53
6 Regional dairy sector 50 67 117 50 17 67
7 Lake Edge Housing Development 20 27 47 1 - 1
8 Retail and commercial development [W] 30 40 70 4 3 7
9 Regional timber harvesting 50 67 117 - - -
10 Grampians Walk 10 13 23 15 6 21
11 Morton Lanes Wind Farm 150 200 350 10 11 21
12 Coleraine Hospital redevelopment 40 52 92 20 7 27
13 Koroit geothermal 50 67 117 2 2 4
14 Retail and commercial development [H] 10 13 23 2 1 3
15 Warrnambool entertainment centre 20 27 47 10 5 15
16 Colac trade training centre 30 40 70 - - -
17 Beeac chicken farm 5 7 12 5 2 7
18 Portland muti-unit development 10 5 15 2 1 3
19 GP Super Clinic 20 27 47 10 3 13
20 Harbour Infrastructure 15 20 35 1 - 1
21 Trade training centre 35 47 82 6 2 8
22 CFA Building upgrade 20 27 47 2 - 2
23 Rail Siding - Iluka 12 16 28 - - -
24 Relocation of school 15 20 35 - - -
2,262 2,990 5,252 232 128 360
Table 14. Employment during construction and ongoing phase

38
The analysis indicates the following:
Construction phase
During the construction phase 2,262 new jobs are directly created with an
additional 2,990 created as a result of the flow on effects of the project
construction
Ongoing phase
Subsequent to the construction phase, the projects will be responsible for an
additional 360 jobs
The low level of ongoing jobs resulting from the initial projects reflects the capital
intensive nature of the projects and the low ongoing operating costs associated
with their operations.
Value chain analysis
Table 15. Value Chain (as shown below), highlights the impact of the projects at both a direct
and ongoing basis on the sectors of the GSC economy. This analysis has been carried out on
a jobs basis so the number of new jobs that will be required in each sector is highlighted.

39
Construction phase Ongoing
Co
nst
ruct
ion
Co
nst
ruct
ion
Re
tail
Man
ufa
ctu
rin
g
PST
S
AFS
ASS
Tran
spo
rt
Oth
er
serv
ice
s
He
alth
Wh
ole
sale
tra
de
Oth
er
TOTA
L
Co
nst
ruct
ion
Re
tail
PST
S
AFS
ASS
Ele
c, G
as
Tran
spo
rt
Oth
er
serv
ice
s
He
alth
Agr
icu
ltu
re,
fore
stry
& f
ish
ing
Oth
er
TOTA
L
1 MacArthur wind farm 330 133 57 47 26 24 22 19 18 16 16 63 771 4 5 26 17 52
2 Mortlake power station 430 174 74 60 33 32 30 25 23 22 20 81 1,004 21 21
3 Residential growth [W] 660 265 110 90 50 50 295 1,520 3 3 1 1 5 13
4 Oaklands Hill Wind farm 150 61 26 21 11 11 10 60 350 2 10 9 21
5 Southwest Healthcare - S2 100 41 18 14 60 233 3 2 41 7 53
6 Regional dairy sector 50 20 9 7 4 4 23 117 55 12 67
7 Lake Edge Housing [H] 20 8 3 3 13 47 1 1
8 Retail and commercial [W] 30 12 5 4 19 70 2 2 1 1 1 7
9 Regional timber harvesting 50 20 9 7 4 4 23 117 0 0
10 Grampians Walk 10 4 2 7 23 6 10 1 4 21
11 Morton Lanes Wind Farm 150 61 26 21 11 11 10 60 350 2 10 9 21
12 Coleraine Hospital 40 16 4 32 92 2 21 4 27
13 Koroit geothermal 50 20 9 7 4 4 23 117 2 2 4
14 Retail and commercial [H] 10 4 2 7 23 1 1 1 3
15 Entertainment centre [W] 20 8 4 3 12 47 1 1 10 3 15
16 Colac trade training centre 30 12 5 4 19 70 0 0
17 Beeac chicken farm 5 2 1 1 3 12 6 1 7
18 Unit development [P] 10 5 15 1 1 1 3
19 GP Super Clinic 20 8 4 3 12 47 1 10 2 13
20 Harbour Infrastructure 15 6 3 2 9 35 1 1
21 Trade training centre 35 14 6 5 3 3 16 82 8 8
22 CFA Building upgrade 20 8 3 3 13 47 2 2
23 Rail Siding - Iluka 12 5 2 2 7 28 0 0
24 Relocation of school 15 6 3 2 9 35 0 0
2,262 908 385 306 146 143 72 44 41 38 36 871 5,252 4 29 7 14 4 48 0 10 72 61 111 360
Table 15. Value Chain

40
The analysis highlights:
In addition to needing 3,170 construction workers over the next 5 years, other sectors
that will need capacity to support these projects include:- retail 385 staff,
manufacturing 306 new jobs, professional, scientific and technical service sectors 146
new jobs, and the accommodation and food sector needing 143 new staff
This increase represents significant growth in the GSC economy over the construction
phase, however they are not sustainable unless other projects are secured in addition
to those identified as definite
Subsequent to construction, the sectors that benefit include health, requiring an
additional 72 workers, agriculture, forestry and fishing requiring an additional 61
workers and the electricity and gas sector requiring an additional 48 staff
The 360 ongoing jobs represent sustainable economic growth. These new jobs are
required to support the ongoing operations of the projects we have identified as
definite.
41
3.5 Key Findings
Investment Outlook
Significant increase in the value of future investments in the region in the five year horizon
Sixty major projects with an estimated value of $11.6bn
The projects combined will create 7,800 jobs during the construction periods.
Ongoing employment creation whilst at a much lower level is still significant with an estimated
1,000 new jobs.
The projects are dominated, in value, by energy related developments, totalling 29 projects and
$9bn in value.
The energy projects cover a range of technologies, including wind power, geothermal power,
gas-fired power, bio-diesel and wave energy.
Wind projects represent 68% by number and 80% by value of total energy projects.
Future investments in new energy projects will depend on government policy in relation to
alternate energy production and carbon pricing.
The prediction for the identified investment proposals to be delivered is very positive. Some
40% of the projects (valued at $2.7bn) are classed as ‘definite’ for delivery within the next five
years.
Definite projects will generate indirect economic support of around $2.8bn, bringing total
output over 5 years to $5.5bn.
The definite projects have a multiplier effect of 2.03x. This could be increased by 10% and
additional $560m worth of economic output and 1,840 jobs would be created over a 5 year
period.
Around 5,250 jobs will be created during the construction phase of the definite projects.
Ongoing annual economic output from definite projects will be around $86m and employment
of 360 jobs.
A further 23% (value $3.4bn) are seen as ‘likely’ to be completed within the same time frame.
The projects also have a considerable multiplier effect on local and regional economies.
The region faces numerous challenges to effectively manage, implement and support the
effects the projects will have on the region’s infrastructure and communities.
42
Key Issues and impacts
Workforce
Educators and community’s understanding of emerging career opportunities
Minimal communication between industry and educators for career paths
Local employment and engagement policy very beneficial
Local work practice and skills need to reflect the project requirements
Established regional employers require access to additional labour
Project workforce demands impacts of local industry employment pool and increases wage
competition
Accommodation
Rapid increase in demand during construction period 1-3 years within 30/40 minutes travel
time of projects
High impact due to demand on residential rents and later the purchase of selected permanent
housing
Competition between local demand and construction workforce for residential housing
Often investment expectations by local investors can be over ambitious
Accommodation of workers in tourism hot spots during peak season maybe problematic
Generally “worker villages” are not preferred by project managers if other options are available
Demand for a range of accommodation types – Private housing, apartments, motels, private
rooms through to caravans
Freight Transport Services and Infrastructure
Bulk freight movement require a mixture of road and rail transport
Road and rail corridors and support infrastructure require safety and efficiency upgrades
Significant increases in heavy and small vehicle movements relating to projects
Bulk transport flow direction within the GSC region is principally in a west to east direction
between Mount Gambier and Melbourne. North to south from the Murray River regions south
to Hamilton and Portland.
43
Consistency in the application of heavy transport road usage regulations across the GSC region
will provide efficiencies, for example consistency of access for B-double vehicles to local roads
Efficient access to and from the Port of Portland for bulk shipping, road and rail transport is
critical for the region’s economic future
Strategic regional air services provide an important service for movement of personnel and
urgent equipment
Social Infrastructure
Access to efficient telecommunications across the GSC region is critical for industry, community
and emergency services
Small towns utility services can be impacted significantly by construction workforce
Quality support services for families such as schools, kindergartens and health services is
important
If new industry offers high numbers of permanent positions then education, health, child
minding services and social services can also receive a positive growth in service demand
A common practice for major project proponents financially support local communities and
regions with community funds
Access to modern leisure and recreation facilities provide a key driver for relocation decisions
44
4. Project Data Sheets
4.1 Data Sheets
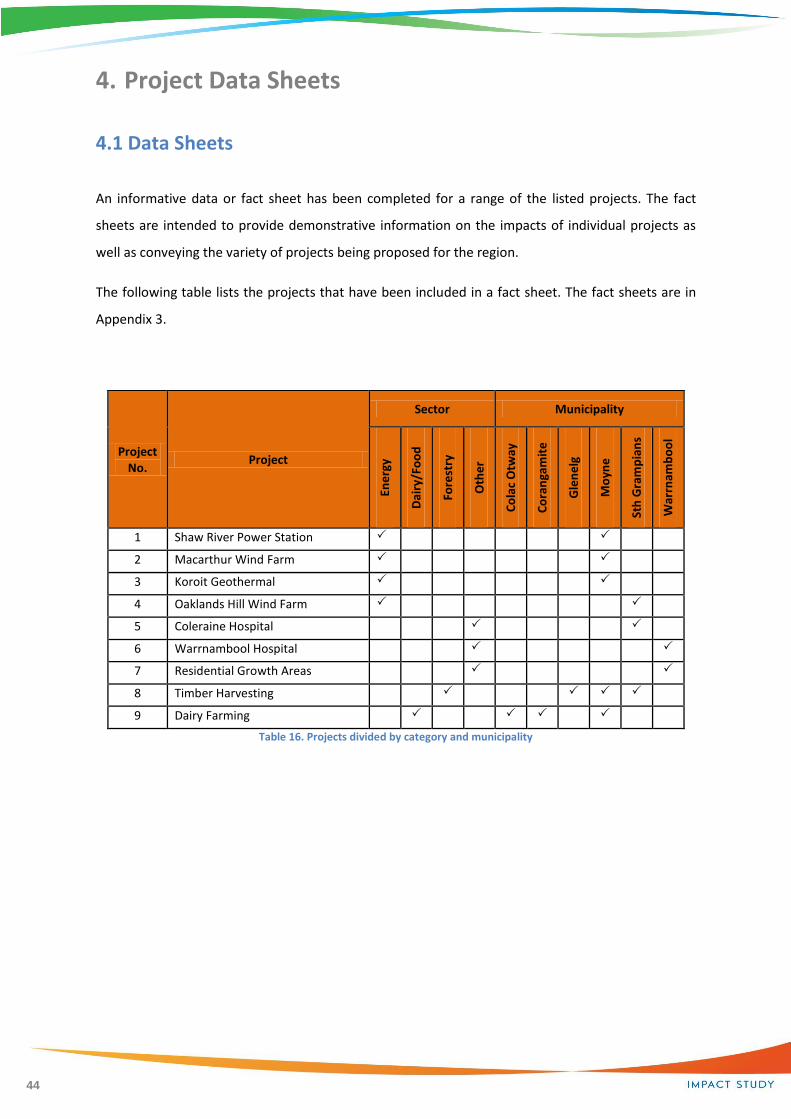
An informative data or fact sheet has been completed for a range of the listed projects. The fact
sheets are intended to provide demonstrative information on the impacts of individual projects as
well as conveying the variety of projects being proposed for the region.
The following table lists the projects that have been included in a fact sheet. The fact sheets are in
Appendix 3.
Project No.
Project
Sector Municipality
Ene
rgy
Dai
ry/F
oo
d
Fore
stry
Oth
er
Co
lac
Otw
ay
Co
ran
gam
ite
Gle
ne
lg
Mo
yne
Sth
Gra
mp
ian
s
War
rnam
bo
ol
1 Shaw River Power Station
2 Macarthur Wind Farm
3 Koroit Geothermal
4 Oaklands Hill Wind Farm
5 Coleraine Hospital
6 Warrnambool Hospital
7 Residential Growth Areas
8 Timber Harvesting
9 Dairy Farming
Table 16. Projects divided by category and municipality

45
5. Prior Learning 5.1 Case Studies
The following four case study projects were selected to be included in this study because they reflect
a change in the focus for new investment within the region that commenced around 1998 -2000 and
is ongoing in the Great South Coast region today.
The case studies provide a reflective snap shot of each project during its construction period, their
impacts on the immediate district and region, plus the long term social and economic opportunities
each project has offered.
Each of the projects are different in their structure and need but linked in that they have provided a
significant catalyst for further development within the GSC region. Two of the case studies relate to
power production but using different energy sources, one case study is a mining and processing
project and the final study is based on off shore gas extraction and on shore processing for delivery
into the Victorian and South Australian distribution networks.
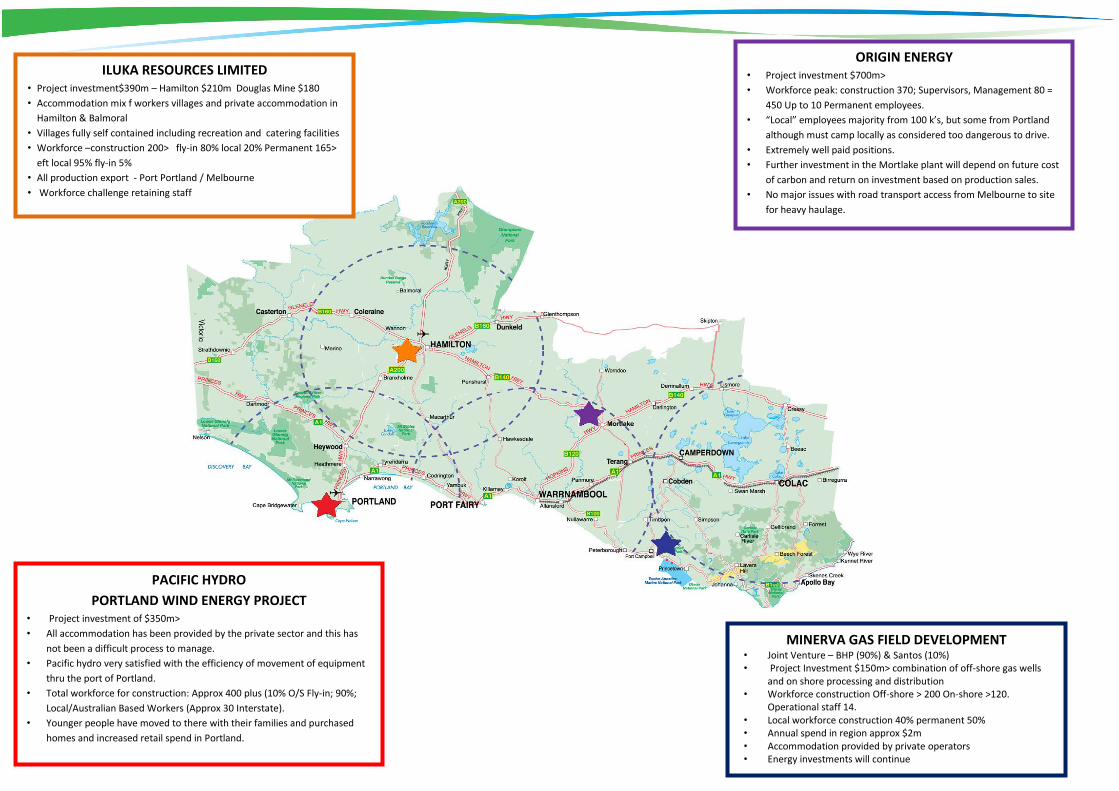
ILUKA RESOURCES LIMITED • Project investment$390m – Hamilton $210m Douglas Mine $180
• Accommodation mix f workers villages and private accommodation in
Hamilton & Balmoral
• Villages fully self contained including recreation and catering facilities
• Workforce –construction 200> fly-in 80% local 20% Permanent 165>
eft local 95% fly-in 5%
• All production export - Port Portland / Melbourne
• Workforce challenge retaining staff
MINERVA GAS FIELD DEVELOPMENT • Joint Venture – BHP (90%) & Santos (10%) • Project Investment $150m> combination of off-shore gas wells
and on shore processing and distribution • Workforce construction Off-shore > 200 On-shore >120.
Operational staff 14. • Local workforce construction 40% permanent 50% • Annual spend in region approx $2m • Accommodation provided by private operators • Energy investments will continue
PACIFIC HYDRO
PORTLAND WIND ENERGY PROJECT • Project investment of $350m>
• All accommodation has been provided by the private sector and this has
not been a difficult process to manage.
• Pacific hydro very satisfied with the efficiency of movement of equipment
thru the port of Portland.
• Total workforce for construction: Approx 400 plus (10% O/S Fly-in; 90%;
Local/Australian Based Workers (Approx 30 Interstate).
• Younger people have moved to there with their families and purchased
homes and increased retail spend in Portland.
ORIGIN ENERGY • Project investment $700m>
• Workforce peak: construction 370; Supervisors, Management 80 =
450 Up to 10 Permanent employees.
• “Local” employees majority from 100 k’s, but some from Portland
although must camp locally as considered too dangerous to drive.
• Extremely well paid positions.
• Further investment in the Mortlake plant will depend on future cost
of carbon and return on investment based on production sales.
• No major issues with road transport access from Melbourne to site
for heavy haulage.
47
5.2 Key Findings
Significant increase in income revenue for local, state and federal governments
Additional expenditure and resources required by local and state government – human
resources; infrastructure and maintenance
Construction projects inject significant outside dollars into the local economy each week in
wages; accommodation, supply chain services, transport and to local business owners
Project workers have a significant higher disposable income than the regions traditional
workforce
Potential for large projects to have a negative impact on local people looking for residential
housing due to increase in prices and limited supply
Case study projects do provide long term benefits for local, regional and state economy in terms
of revenue collected from the projects either directly or indirectly
All case study projects have significantly assisted local communities by establishing a “community
support fund”.
The projects have introduced new industry sectors into the regional economy reducing the
reliance on agriculture; education; health and government sectors for economic stability
All projects have provided the potential for new business opportunities for existing business
owners and contractors
Investment decisions and return on investment for these project studies are influenced by
domestic pricing for utility services and the value of the $A at any given time.
48
Key Issues and impacts
Workforce
Engagement of “fly in” of personnel and skills into the region
General trend during construction by imported workforce is not to relocate their families during
contract period
Increased competition for local workforce skills and knowledge – positive and negative impact on
community
New opportunities for medium to long term employment for all genders in the regional
workforce
Higher remuneration packages attracting outside professionals and trained, young workers back
into the region
Provided a reason for community members who had left the region to return “home” to further
their careers – begin to arrest the leakage of our population in 20 – 29 year age bracket.
Demonstrated some gaps in technology, numeracy and literacy skills within all sectors of the
workforce
Education and training opportunities increased for sections of the workforce directly or indirectly
linked to the projects
Higher awareness of link to employment and social behavior
Raised general awareness of responsibilities by employees, contractors and project managers in
relation to occupational health and safety, responsibility for the environment, therefore
increasing the professionalism of the workforce across the region
Demographic of workforce in the districts where the projects occurred were changed
Education and training standards required by case study project employers for employees and
contractors significantly higher than the accepted local practice

49
Accommodation
Workers villages are not the preferred form of accommodating “fly in” workforce for major
projects within the GSC region
Workers villages are considered by construction companies when workforce construction
numbers may exceed local accommodation capability or the project is in an isolated location
Level of demand for all types of accommodation in a project area reflects the project activity and
type of related skills needed at any time
Service apartment style accommodation is preferred by management during the project
construction and a variety of individual and shared accommodation types for general workforce
Accommodation facilities that are close to recreation and leisure facilities are preferred
Generally for major project construction the “fly in” workforce are allocated a living away from
home allowance
Local community may experience increased competition for certain sectors of rental and private
ownership properties
The supply of accommodation can be a challenge within small towns, if travel distance to larger
towns exceeds accepted safe travel distances
If permanent workforce is significant in numbers then house prices may rise significantly which
may have a flow on impact in towns within a reasonable travel time
Freight Transport Services and Infrastructure
Port of Portland very well regarded for access and efficiency for handling bulk products
Deep water port access is a desired facility for many projects
Additional heavy truck movements on traditional local roads and arterial roads required
significant additional investment and upgrades
Some restriction to efficient road access across the GSC region, greater western Victoria and SE
South Australia
Road infrastructure depreciation has increased and traffic flow around the projects feeder roads
does increase especially during shift changeovers
50
Demand for skilled transport and logistics operators
Rail freight infrastructure and available services needed to be developed
Coordination between project transport operators and community transport providers such as
school buses is critical
Social Infrastructure
Town residents experience additional people accessing the retail and service sectors that may
require adjustment of attitude and improvement in standards
New residents can find difficulty in assimilating into the local communities and social support
networks structures
New residents expectations and experiences on community facilities, public transport and
service levels may not equal the reality
Generally strong support amongst the local community for “real” opportunities to assist the
development of their region
Project owners do willingly embrace community projects with strong financial support through
community funds and access to their staff
Mobile phone coverage, internet access and delivery speed needs to dramatically improve
Generally health, education, children’s services and sporting clubs have benefited by additional
people into the region especially within small townships
The network of people with an increased awareness of the GSC region and its towns has been
significantly expanded which will have a very positive, long term trickle down impact
Very minimal historical data collected or retained on the case study projects and the social and
economic changes to the region

51
PART C – Projecting the Future
6. Key Impacts
6.1 Workforce
The potential for jobs growth within the existing economy is solid – over 1,500 new jobs in the
next 5 years
A 2010 workforce study found that 62% of businesses surveyed in the region expected to increase
their workforce in the next 3 years as compared with State wide data of 35%.
Unemployment within the region is below the State wide average
Employment skills and workplace compliance intelligence requires up skilling by regional
workforce
Average annual employment growth in all areas within the GSC region is forecast to outstrip
population growth over the next decade, a rate higher than any other region in the state,
The region is facing critical skills and people shortages
The projects combined will create 7,800 jobs during the construction periods
Ongoing employment creation whilst at a much lower level is still significant with an estimated
1,000 new jobs
Significant opportunity for skilled, trained local workforce
Conditions of employment often very different to past experiences, eg 12 hour work days and
shift work

52
6.2 Accommodation
Forward planning for stronger demand for residential and commercial accommodation within the
stronger growth sectors of the region needs a collaborative approach between private and public
sectors
Within the growth sectors competition for medium term rental properties will strengthen
Living away from home allowance provided to construction workers
Shared accommodation is common during construction period
Accommodation within 30 minutes travel to the project site is preferred
Accommodation within or close to a town with entertainment and recreational facilities is keenly
sought after
Apartment style accommodation is preferred at management level
Permanent employee’s preference is for modern, traditional residential and lifestyle
accommodation located near all essential and recreational services and within easy travel
distance to their place of employment
53
54

55
6.3 Freight Transport
Port of Portland very well regarded for access and efficiency for bulk products
Increasing truck movements in and around Portland will require additional planning and
investment
Efficient road access across the GSC region, greater western Victoria and SE South Australia
is a rapidly growing impediment to effective and profitable movement of goods and
resources
Depreciation of road infrastructure has increased due to load weights and volume of vehicle
movements along road networks
Coordination of traffic management services for the movement of over sized, heavy
equipment is effective
Rail freight infrastructure and services need major improvements within the region to cater
for increasing freight traffic
6.4 Social Infrastructure
Towns and communities near major projects need assistance in preparing for an influx of
workers and additional demand on services
Education and community support providers require forward knowledge of the future level
of demand for their services
Telecommunication access and service delivery must meet future community and industry
expectation
A variety of leisure and recreation activities will be required for indoor and outdoor activities
Education and assistance to local community members and new residents is need to assist in
a harmonious, sustained relocation of new workforce
56
Large project investment will provide opportunities to leverage additional government
funding for many community developments in partnership with the project proponents
Modern acute and allied health services are an expected part of a modern society and a key
consideration for population relocation
Access to public transport including air services is important for building a modern, vibrant
regional location
57
7. Response Plan
The Great South Coast region has historically been known as a very reliable, efficient and profitable
region for agricultural production and the manufacturing industries allied to these activities. This
reputation has been supported and strengthened over the past ten years with the expansion of the
dairy industry into non traditional dairy country, the growth of investments relating to plantation
timbers, strong demand for sheep and beef products and by increasing interest from competing
investor groups looking for reliable climate patterns in areas with reasonable soil fertility.
In addition to the traditional investments relating to primary production, the region is now being
targeted by a range of potential investors including public, national, international companies,
superannuation funds and very well resourced private companies interested in a variety of industry
sectors - mining, large scale energy production, oil and gas exploration, bulk transport, food security
and food processing projects.
The Australian economy is currently experiencing (2010/2011) a period of extremely low
unemployment but at the same time an increase in demand for labour and new skills. This situation
is not isolated to our capital cities but being experienced throughout all regional areas across
Australia. The Great South Coast region has lower unemployment statistics than the national
average and is now linked to the global labour market which has both positive and negative
implications for our growth industries and our working population.
The Great South Coast region is leading Victoria in relation to investment in the dairy and milk
processing, plantation timber harvesting, wood chip and log export and innovative clean energy
projects.
The cumulative impacts on the Great South Coast region of the nationally significant socio-economic
investment into the region over the next 5 years will require the 3 tiers of government to
strategically forward plan agreed responses to the investors and project managers to achieve long
term sustainable benefits across a diverse range of social, environmental and economic sectors.

58
To manage this evolving change to the region’s physical, social and economic landscape it will be
strategically important that the Great South Coast region is represented by a united, collaborative
voice to identify and direct sustainable long term benefits for individual towns, shires and the whole
of the region, as many of the new investment projects will have short and long term impacts across
the GSC region. It is important that councils collect and update data on the key projects within their
boundaries as the review of the case studies has revealed a gap in the retained project intelligence
on the experiences of the past and the challenges faced.
The economic stimulation and project interest across the region is currently very strong but over the
next 15 to 25 years a number of the industry specific projects will reach the end of their project life
and will require a decision by their owners and share holders for significant reinvestment. The
majority of the energy projects during the construction phase require a large construction workforce
but once commissioned, provide reasonably low permanent employment opportunities as individual
projects but due to the number of projects in the region will be a volume industry employer for
permanent positions. During this same period of time the region will experience peak saturation for
investment in new major energy projects as the regions infrastructure and physical environment will
not be able to continue to accommodate new investment in these large scale projects.
Regional strategic planning and a cooperative response for future large scale investment projects
will be critical to achieve the maximum benefits for the region’s communities in relation to improved
infrastructure, social and community services, provision of education and training, whole of
environment management and provision of sustainable economic and employment outcomes.
59
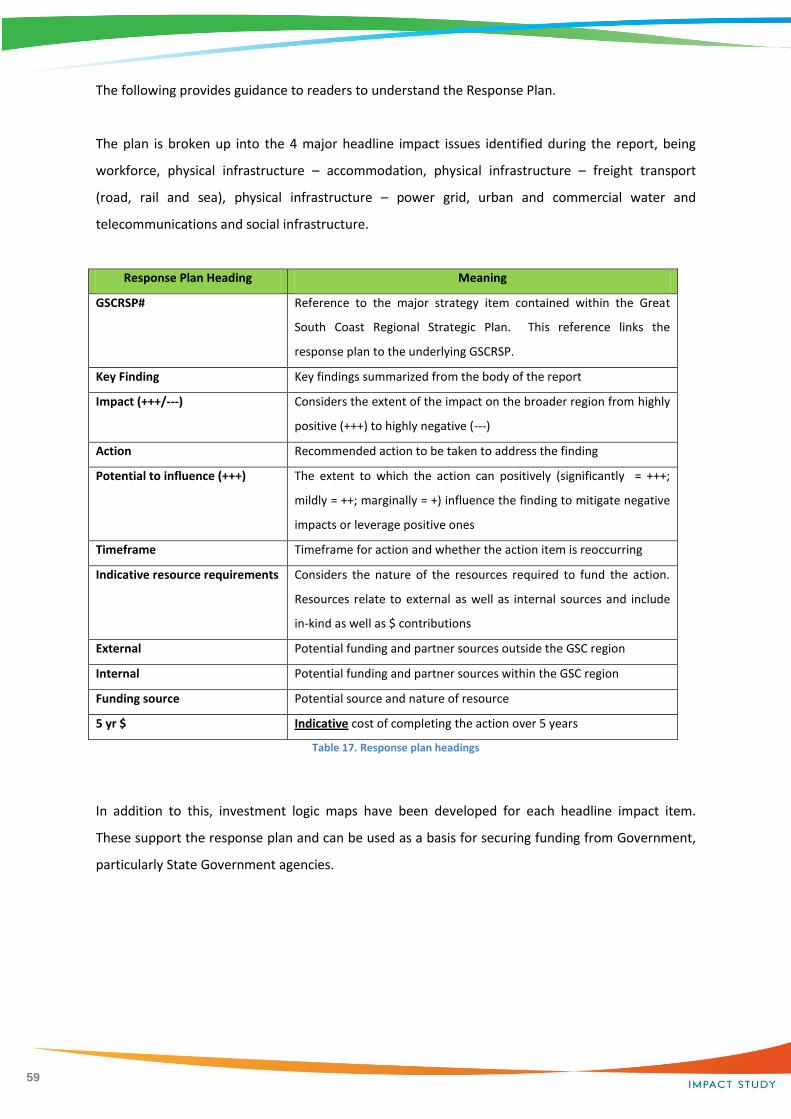
The following provides guidance to readers to understand the Response Plan.
The plan is broken up into the 4 major headline impact issues identified during the report, being
workforce, physical infrastructure – accommodation, physical infrastructure – freight transport
(road, rail and sea), physical infrastructure – power grid, urban and commercial water and
telecommunications and social infrastructure.
Response Plan Heading Meaning
GSCRSP# Reference to the major strategy item contained within the Great
South Coast Regional Strategic Plan. This reference links the
response plan to the underlying GSCRSP.
Key Finding Key findings summarized from the body of the report
Impact (+++/---) Considers the extent of the impact on the broader region from highly
positive (+++) to highly negative (---)
Action Recommended action to be taken to address the finding
Potential to influence (+++) The extent to which the action can positively (significantly = +++;
mildly = ++; marginally = +) influence the finding to mitigate negative
impacts or leverage positive ones
Timeframe Timeframe for action and whether the action item is reoccurring
Indicative resource requirements Considers the nature of the resources required to fund the action.
Resources relate to external as well as internal sources and include
in-kind as well as $ contributions
External Potential funding and partner sources outside the GSC region
Internal Potential funding and partner sources within the GSC region
Funding source Potential source and nature of resource
5 yr $ Indicative cost of completing the action over 5 years
Table 17. Response plan headings
In addition to this, investment logic maps have been developed for each headline impact item.
These support the response plan and can be used as a basis for securing funding from Government,
particularly State Government agencies.
60
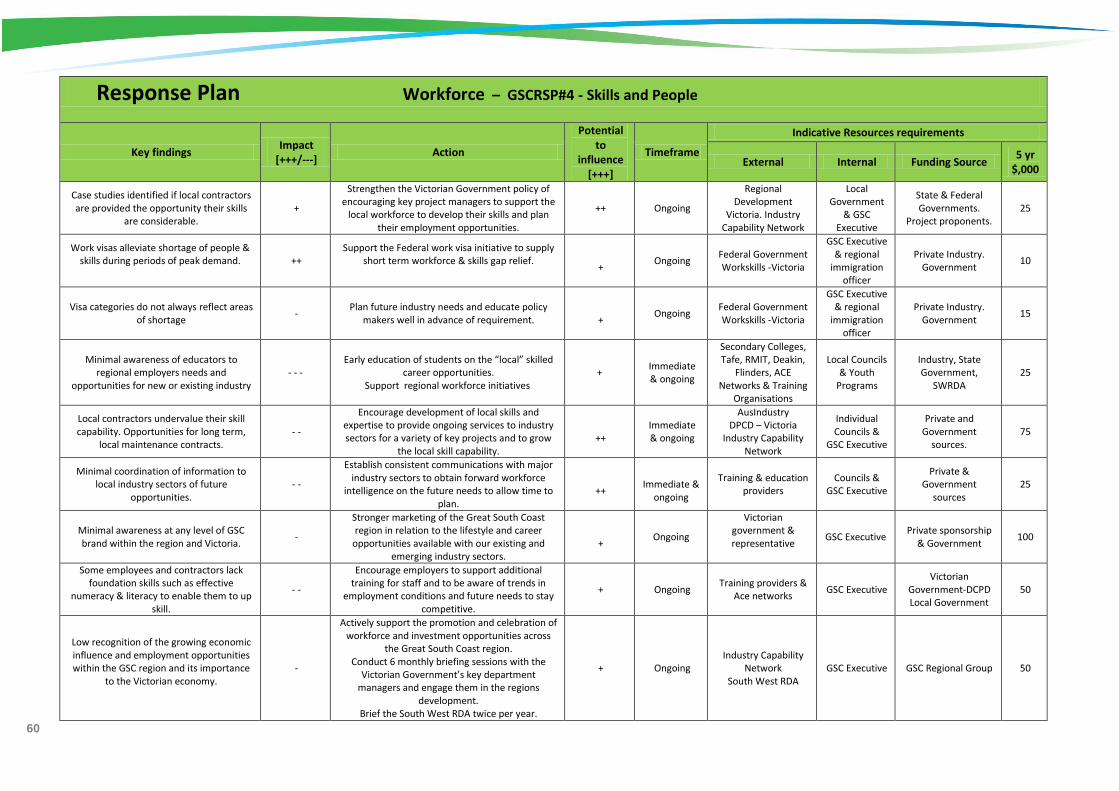
Response Plan Workforce – GSCRSP#4 - Skills and People
Key findings Impact
[+++/---] Action
Potential to
influence [+++]
Timeframe
Indicative Resources requirements
External Internal Funding Source 5 yr
$,000
Case studies identified if local contractors are provided the opportunity their skills
are considerable. +
Strengthen the Victorian Government policy of encouraging key project managers to support the
local workforce to develop their skills and plan their employment opportunities.
++ Ongoing
Regional Development
Victoria. Industry Capability Network
Local Government
& GSC Executive
State & Federal Governments.
Project proponents. 25
Work visas alleviate shortage of people & skills during periods of peak demand.
++
Support the Federal work visa initiative to supply short term workforce & skills gap relief.
+
Ongoing Federal Government Workskills -Victoria
GSC Executive & regional
immigration officer
Private Industry. Government
10
Visa categories do not always reflect areas of shortage
- Plan future industry needs and educate policy
makers well in advance of requirement.
+ Ongoing
Federal Government Workskills -Victoria
GSC Executive & regional
immigration officer
Private Industry. Government
15
Minimal awareness of educators to regional employers needs and
opportunities for new or existing industry - - -
Early education of students on the “local” skilled career opportunities.
Support regional workforce initiatives +
Immediate & ongoing
Secondary Colleges, Tafe, RMIT, Deakin,
Flinders, ACE Networks & Training
Organisations
Local Councils & Youth
Programs
Industry, State Government,
SWRDA 25
Local contractors undervalue their skill capability. Opportunities for long term,
local maintenance contracts. - -
Encourage development of local skills and expertise to provide ongoing services to industry sectors for a variety of key projects and to grow
the local skill capability.
++
Immediate & ongoing
AusIndustry DPCD – Victoria
Industry Capability Network
Individual Councils &
GSC Executive
Private and Government
sources. 75
Minimal coordination of information to local industry sectors of future
opportunities. - -
Establish consistent communications with major industry sectors to obtain forward workforce
intelligence on the future needs to allow time to plan.
++
Immediate &
ongoing
Training & education providers
Councils & GSC Executive
Private & Government
sources 25
Minimal awareness at any level of GSC brand within the region and Victoria.
-
Stronger marketing of the Great South Coast region in relation to the lifestyle and career
opportunities available with our existing and emerging industry sectors.
+
Ongoing
Victorian government & representative
GSC Executive Private sponsorship
& Government 100
Some employees and contractors lack foundation skills such as effective
numeracy & literacy to enable them to up skill.
- -
Encourage employers to support additional training for staff and to be aware of trends in
employment conditions and future needs to stay competitive.
+ Ongoing Training providers &
Ace networks GSC Executive
Victorian Government-DCPD Local Government
50
Low recognition of the growing economic influence and employment opportunities within the GSC region and its importance
to the Victorian economy.
-
Actively support the promotion and celebration of workforce and investment opportunities across
the Great South Coast region. Conduct 6 monthly briefing sessions with the
Victorian Government’s key department managers and engage them in the regions
development. Brief the South West RDA twice per year.
+ Ongoing Industry Capability
Network South West RDA
GSC Executive GSC Regional Group 50
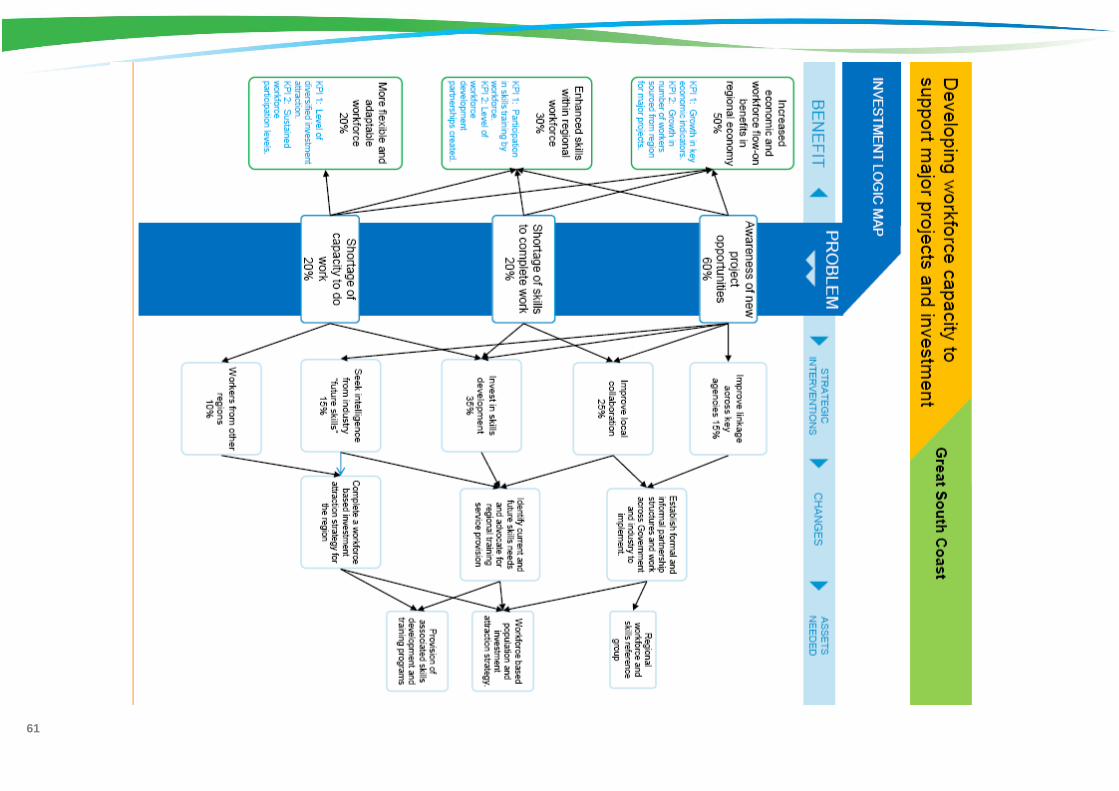
61

62
Response Plan Physical Infrastructure - GSCRSP #3 - Accommodation
Key findings Impact
[+++/---] Action
Potential to
influence [+++]
Timeframe
Indicative Resources requirements
External Internal Funding Source 5 yr
$,000
Positive population growth in the region at key strategic locations.
+
Develop a united regional approach to achieve additional government funding to manage the hot
spot population growth areas and to reflect the service infrastructure needs and funding required
in the region.
+ Ongoing DPCD; SW-RDA Major
Developers Local
Government Government and
industry 30
Residential and commercial
accommodation demand is very diverse
and sometimes opportunistic depending on
economic and tourism activity.
- - -
Annual forum to plan 2 years in advance, with
residential and industrial land developers as to the
regions ability to supply adequate residential,
industrial and recreational land including delivery
of essential services that reflects the regions
investment growth.
+ Ongoing Developers GSC Executive
Department of
Planning &
Community
Development.
Local Government
25
Demand during construction period differs from after commissioning for operation.
- - - Plan for a mix of housing type and affordability
models in the future identification of residential land release, based on access to services.
++
Ongoing DPCD Councils
Private & Government
25
Ongoing demand for serviced apartment style accommodation.
+ Encourage apartment development for short term
accommodation needs –commercial, residential and tourism.
+ Ongoing Private Council
Planners Private 10
Need to manage community expectations of returns for first time investors in the
accommodation markets. -
Conduct analysis of the likely impact for investors in the accommodation sector by clients with
higher disposable income and accommodation allowances on the permanent resident population
(rents & new home purchases) in active areas.
+ Ongoing DPCD GSC Executive
& Councils
SWRDA Councils
DPCD 50
Community perception of projects will be varied, plan for management of short term,
high impact of influx of workers into specific areas.
- Discuss options for workers villages with
community or private rentals and locality in relation to access to services.
+ Ongoing DPCD & Vic Urban Local Council Councils 10
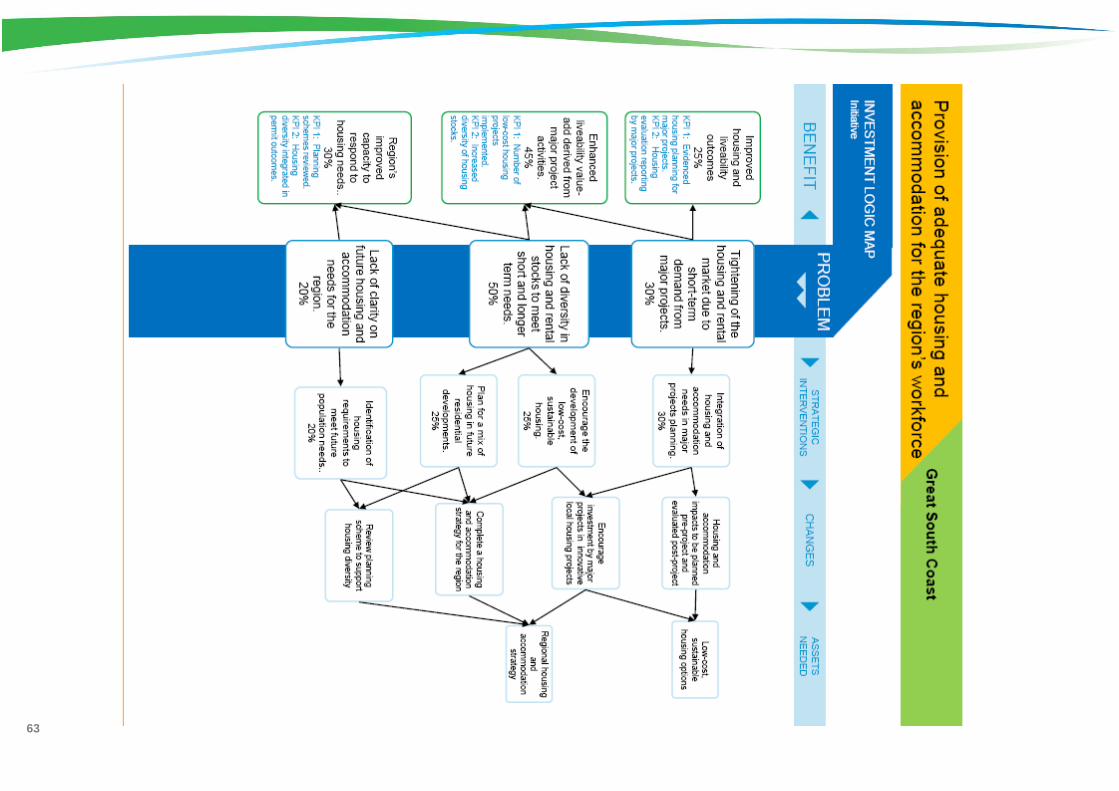
63
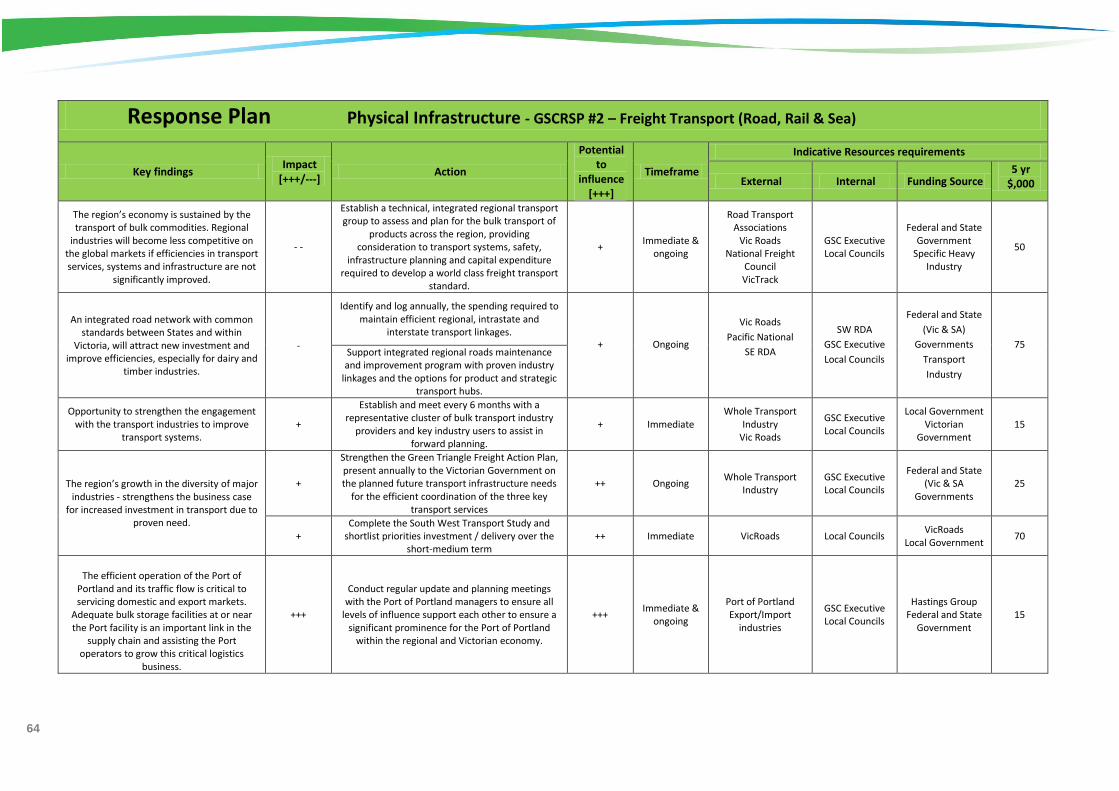
64
Response Plan Physical Infrastructure - GSCRSP #2 – Freight Transport (Road, Rail & Sea)
Key findings Impact
[+++/---] Action
Potential to
influence [+++]
Timeframe
Indicative Resources requirements
External Internal Funding Source 5 yr
$,000
The region’s economy is sustained by the transport of bulk commodities. Regional
industries will become less competitive on the global markets if efficiencies in transport services, systems and infrastructure are not
significantly improved.
- -
Establish a technical, integrated regional transport group to assess and plan for the bulk transport of
products across the region, providing consideration to transport systems, safety,
infrastructure planning and capital expenditure required to develop a world class freight transport
standard.
+ Immediate &
ongoing
Road Transport Associations
Vic Roads National Freight
Council VicTrack
GSC Executive Local Councils
Federal and State Government
Specific Heavy Industry
50
An integrated road network with common standards between States and within
Victoria, will attract new investment and improve efficiencies, especially for dairy and
timber industries.
-
Identify and log annually, the spending required to maintain efficient regional, intrastate and
interstate transport linkages. + Ongoing
Vic Roads
Pacific National
SE RDA
SW RDA
GSC Executive
Local Councils
Federal and State
(Vic & SA)
Governments
Transport
Industry
75 Support integrated regional roads maintenance and improvement program with proven industry
linkages and the options for product and strategic transport hubs.
Opportunity to strengthen the engagement with the transport industries to improve
transport systems. +
Establish and meet every 6 months with a representative cluster of bulk transport industry
providers and key industry users to assist in forward planning.
+ Immediate Whole Transport
Industry Vic Roads
GSC Executive Local Councils
Local Government Victorian
Government 15
The region’s growth in the diversity of major industries - strengthens the business case
for increased investment in transport due to proven need.
+
Strengthen the Green Triangle Freight Action Plan, present annually to the Victorian Government on the planned future transport infrastructure needs
for the efficient coordination of the three key transport services
++ Ongoing Whole Transport
Industry GSC Executive Local Councils
Federal and State (Vic & SA
Governments 25
+ Complete the South West Transport Study and
shortlist priorities investment / delivery over the short-medium term
++ Immediate VicRoads Local Councils VicRoads
Local Government 70
The efficient operation of the Port of
Portland and its traffic flow is critical to servicing domestic and export markets.
Adequate bulk storage facilities at or near the Port facility is an important link in the
supply chain and assisting the Port operators to grow this critical logistics
business.
+++
Conduct regular update and planning meetings with the Port of Portland managers to ensure all
levels of influence support each other to ensure a significant prominence for the Port of Portland
within the regional and Victorian economy.
+++ Immediate &
ongoing
Port of Portland Export/Import
industries
GSC Executive Local Councils
Hastings Group Federal and State
Government 15
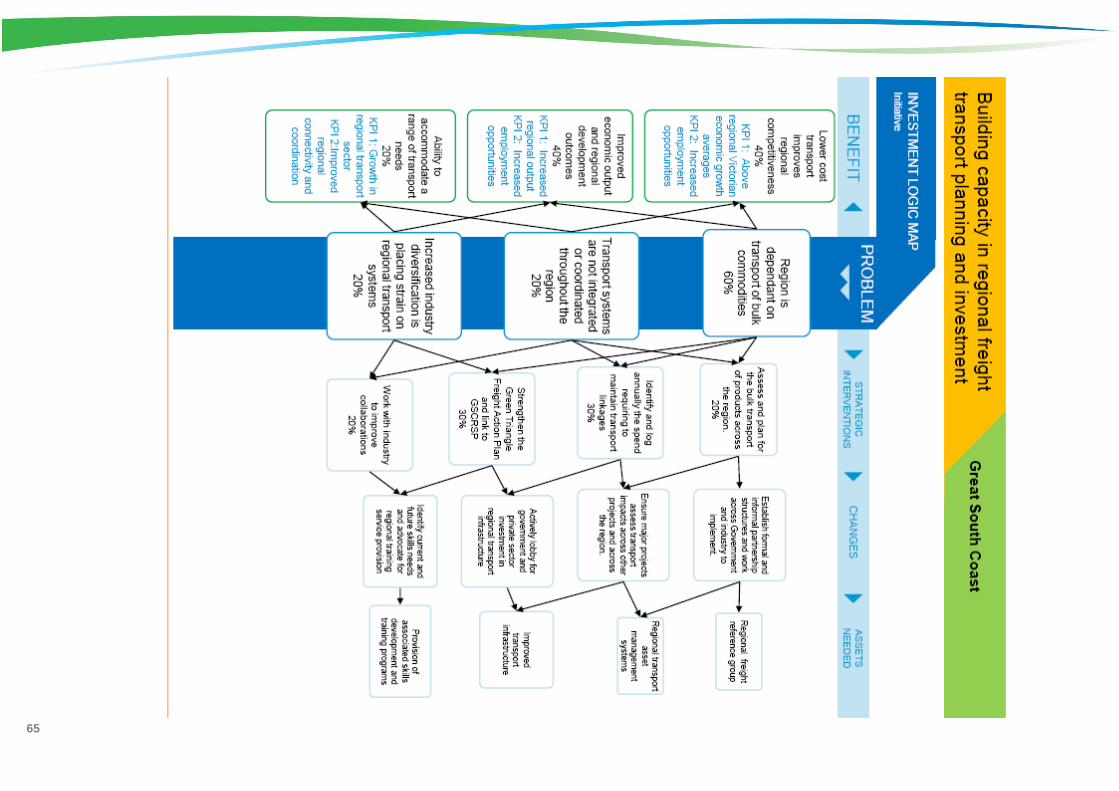
65

66
Response Plan Physical Infrastructure - GSCRSP #2 and #3 – Power Grid, Urban & Commercial Water and Telecommunications
Key findings Impact
[+++/---] Action
Potential to
influence [+++]
Timeframe
Indicative Resources requirements
External Internal Funding Source 5 yr
$,000
New industry sectors require significant power and continuity of supply with
minimum fluctuations in delivery, often reduces future access for other industries.
- -
Annual planning meetings with major users and suppliers to identify and manage demand and required infrastructure upgrades for improved
service delivery.
+ Ongoing
Powercor Energy Commission
Victorian Government
GSC Executive Local Councils
Federal & State Governments
5
Dairy industry continues to expand into broad acre farming districts where power
supply becomes problematic. - -
Support power upgrades to developing industrial and agriculture locations across the region. Consult
with industry to map need. ++ Ongoing
Dairy Australia Regional dairy
Processors
GSC Executive Local Councils
Gardiner Foundation
Federal & State Governments
5
Power cost will increase significantly for households and business.
- Investigate regional purchasing opportunities and
joint ventures with major energy producers to share with the community the regions competitive
advantage and emerging prominence in clean energy production.
++ Immediate Energy Retail
Companies and Brokers
GSC Executive Local Councils
State Government
Milk Processors 15
Collectively the region has a potential strong purchasing power.
++
Town water supplies have been developed on historical population growth patterns. Additional people in a towns for projects will impact on use and possibly quality.
-
Plan with Wannon Water the future population increases in towns with major projects to ensure
no decrease to customer service during peak activity periods.
+ Immediate &
ongoing
Wannon Water Local Development
Associations
GSC Executive Local Councils
State
Government Wannon water
10
Great variety of town water quality across the region which can attract negative
comment from fly-in workers and visitors. -
Support the upgrade of water quality across the region to meet community and visitor
expectations. + Ongoing Wannon Water Local Councils
Town Water Users
Wannon Water Victorian
Government
5
Availability of high standard services, especially water is key determinant in
making decisions for relocation. -
Support expansion of town water supplies to residential growth areas and developing industrial
estates. + Ongoing
Wannon Water
Local Councils Victorian
Government SW RDA
10
Industry is open to the opportunity to reduce costs and their environmental
impact. ++
Develop joint opportunities to promote the commercial opportunities for the increased supply
and demand for re-use water. +
Immediate & ongoing
Wannon Water Local Councils Wannon Water Private Industry
10
The region continues to experience a variety of service standards which significantly
impairs business and lifestyle. -
Develop a regional strategy for a significant improvement to access and speed of delivery for
the internet and mobile communications. ++ Immediate Service Providers Local Councils
SW RDA Federal
Government 25
Proponents of large scale projects often provide opportunistic leverage with governments and service providers.
- Use new projects to lever for increased roll out of
communication technology for commercial growth potential and risk management.
+ Ongoing Service Providers
Project Proponents GSC Executive Local Councils
Victorian and Federal
Governments 10
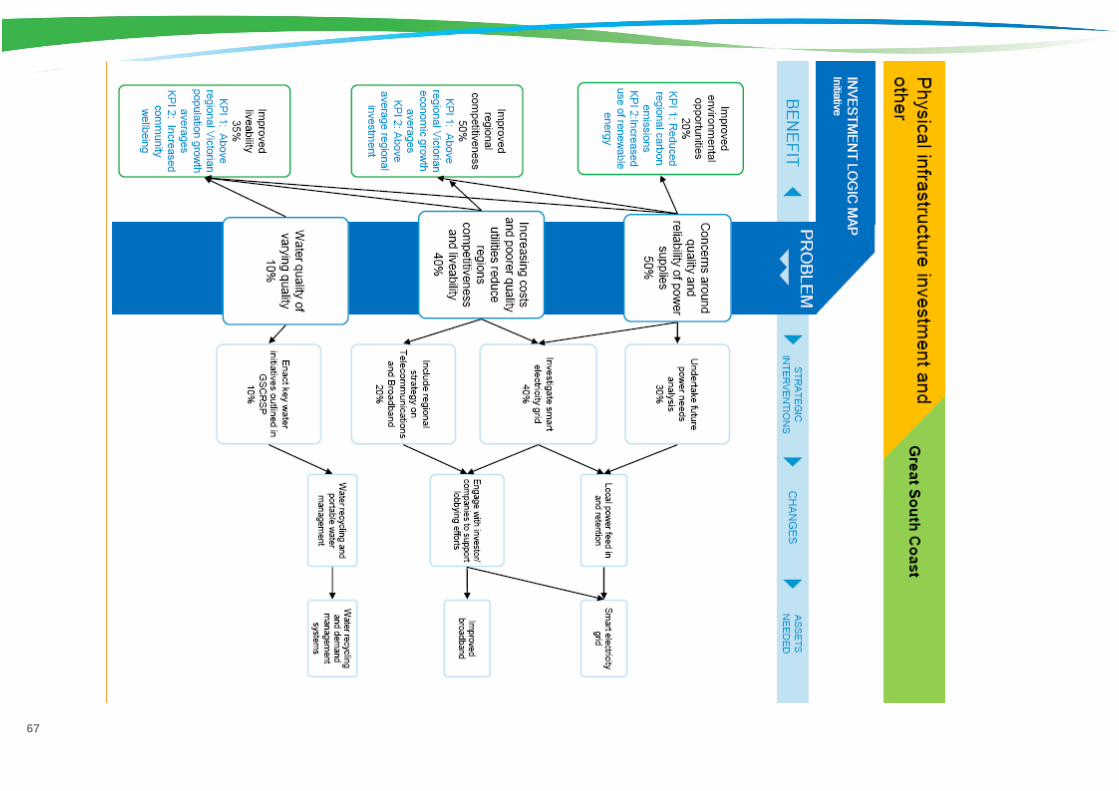
67
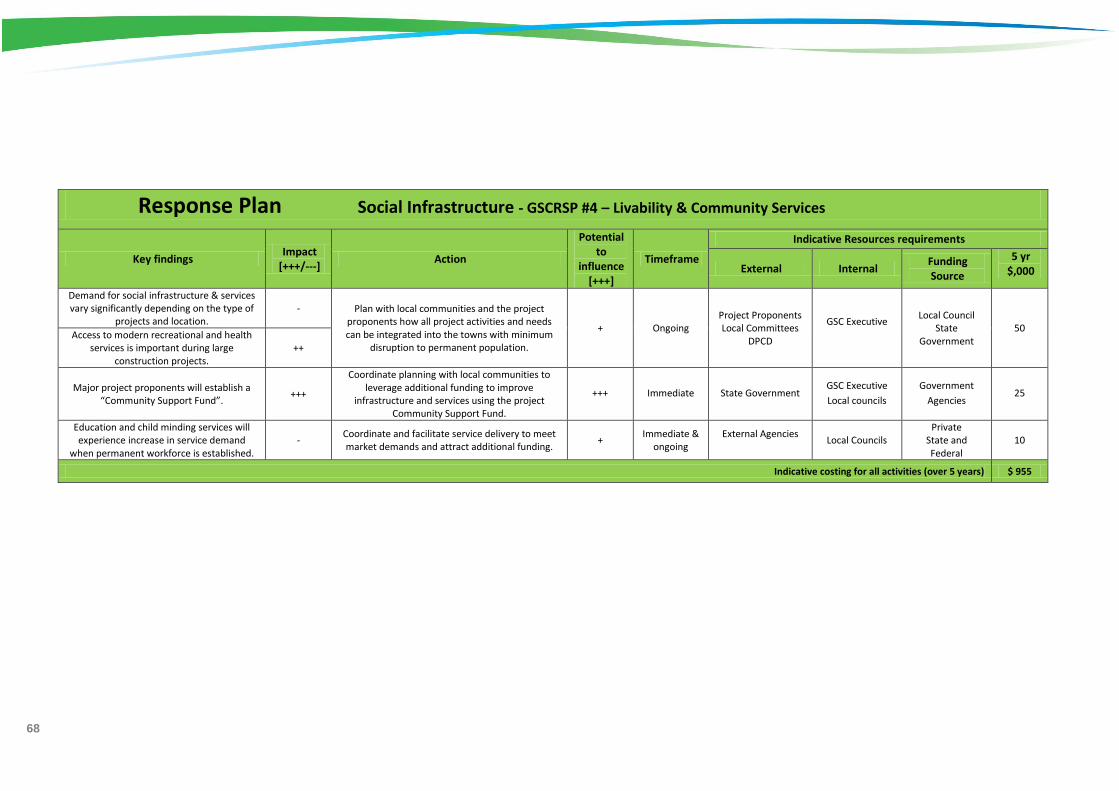
68
Response Plan Social Infrastructure - GSCRSP #4 – Livability & Community Services
Key findings Impact
[+++/---] Action
Potential to
influence [+++]
Timeframe
Indicative Resources requirements
External Internal Funding Source
5 yr $,000
Demand for social infrastructure & services vary significantly depending on the type of
projects and location. - Plan with local communities and the project
proponents how all project activities and needs can be integrated into the towns with minimum
disruption to permanent population.
+ Ongoing Project Proponents Local Committees
DPCD
GSC Executive
Local Council State
Government 50
Access to modern recreational and health services is important during large
construction projects. ++
Major project proponents will establish a “Community Support Fund”.
+++
Coordinate planning with local communities to leverage additional funding to improve
infrastructure and services using the project Community Support Fund.
+++ Immediate
State Government
GSC Executive
Local councils
Government
Agencies 25
Education and child minding services will experience increase in service demand
when permanent workforce is established. -
Coordinate and facilitate service delivery to meet market demands and attract additional funding.
+ Immediate &
ongoing External Agencies
Local Councils
Private State and Federal
10
Indicative costing for all activities (over 5 years) $ 955
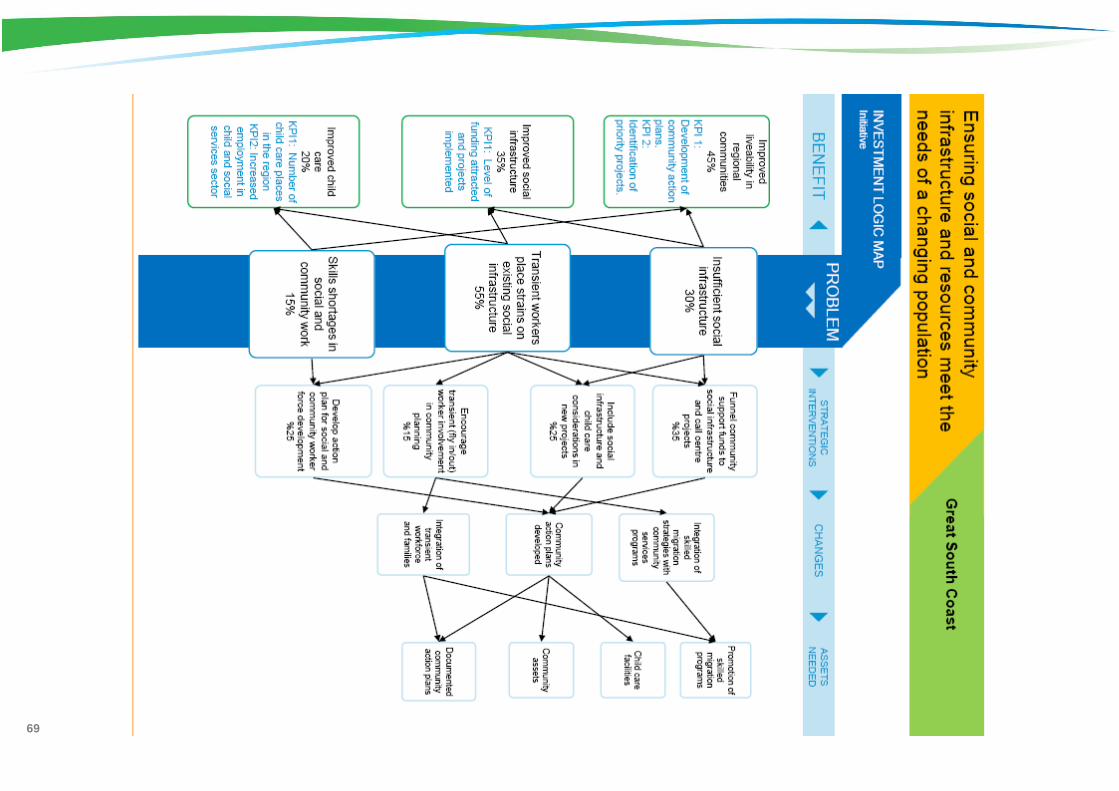
69
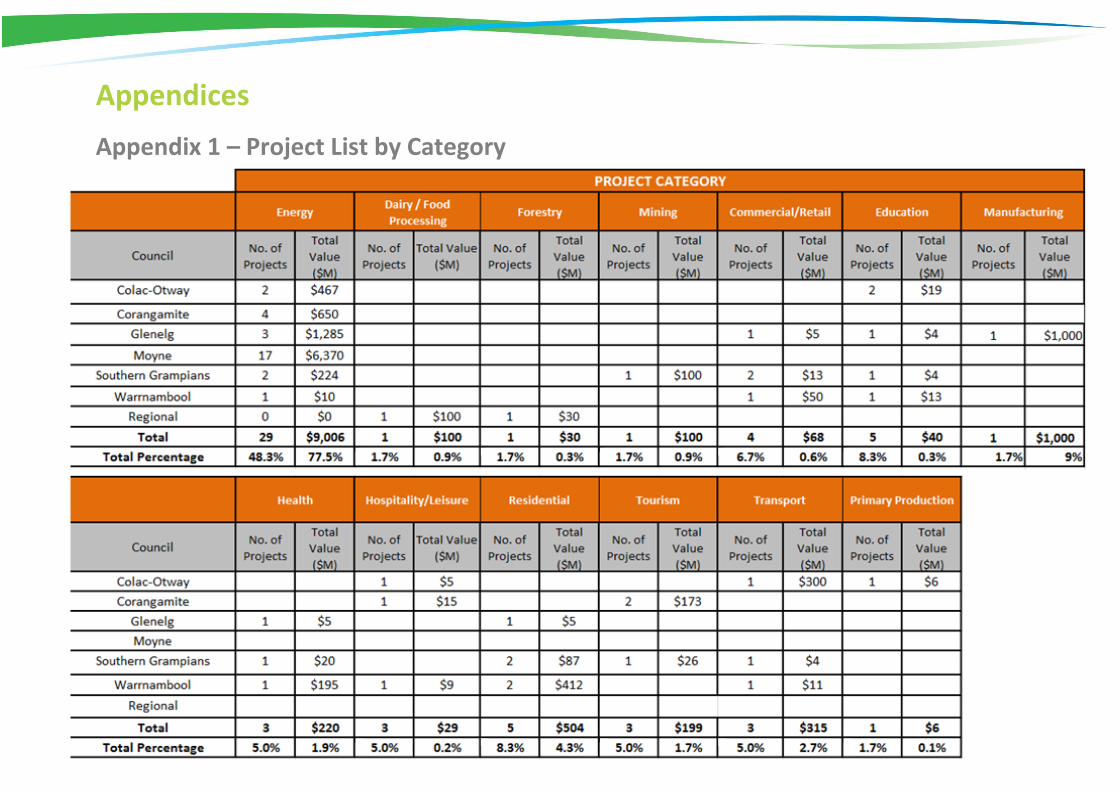
Page 70
Appendices
Appendix 1 – Project List by Category
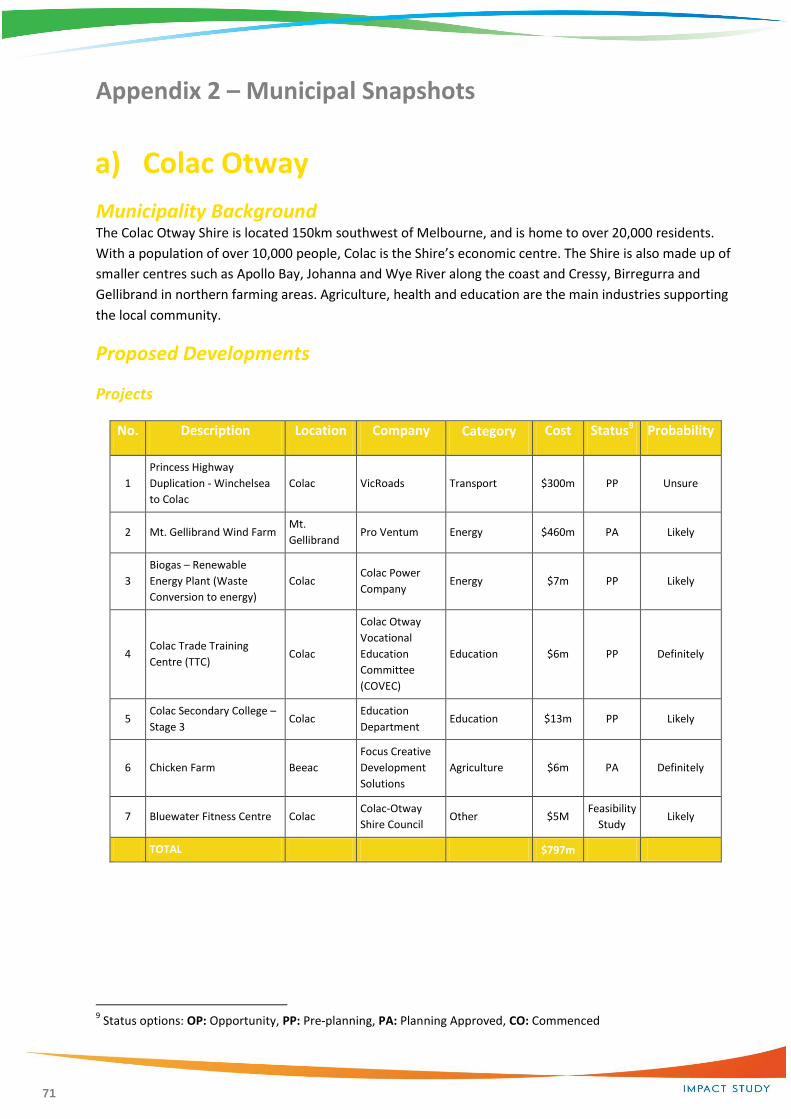
71
Appendix 2 – Municipal Snapshots
a) Colac Otway
Municipality Background The Colac Otway Shire is located 150km southwest of Melbourne, and is home to over 20,000 residents.
With a population of over 10,000 people, Colac is the Shire’s economic centre. The Shire is also made up of
smaller centres such as Apollo Bay, Johanna and Wye River along the coast and Cressy, Birregurra and
Gellibrand in northern farming areas. Agriculture, health and education are the main industries supporting
the local community.
Proposed Developments
Projects
No. Description Location Company Category Cost Status9 Probability
1
Princess Highway
Duplication - Winchelsea
to Colac
Colac VicRoads Transport $300m PP Unsure
2 Mt. Gellibrand Wind Farm Mt.
Gellibrand Pro Ventum Energy $460m PA Likely
3
Biogas – Renewable
Energy Plant (Waste
Conversion to energy)
Colac Colac Power
Company Energy $7m PP Likely
4 Colac Trade Training
Centre (TTC) Colac
Colac Otway
Vocational
Education
Committee
(COVEC)
Education $6m PP Definitely
5 Colac Secondary College –
Stage 3 Colac
Education
Department Education $13m PP Likely
6 Chicken Farm Beeac
Focus Creative
Development
Solutions
Agriculture $6m PA Definitely
7 Bluewater Fitness Centre Colac Colac-Otway
Shire Council Other $5M
Feasibility
Study Likely
TOTAL $797m
9 Status options: OP: Opportunity, PP: Pre-planning, PA: Planning Approved, CO: Commenced

72
b) Corangamite
Municipality Background Home to Camperdown, Terang, Cobden and other smaller farming communities, Corangamite Shire’s
economy is largely based around the agriculture industry, employing nearly half of the labour force. The
Shire also boasts a strong tourism industry, due to its rugged coastline and in particular the world-famous
Twelve Apostles.
Proposed Developments
Projects
No. Description Location Company Category Cost Status10 Probability
1 Moonlight Head Eco-Hotel Wattle Hill
Moonlight Head
Properties
PtyLtd
Tourism $23m PA Unsure
2
Stockyard Hill Wind Farm
and Terminal Station
Facility
Skipton
Stockyard Hill
Wind Farm Pty
Ltd
Energy $50m PA Likely
3 Berrybank Wind Farm Berrybank Union Fenosa Energy $484m PP Likely
4 Southern Ocean Beach
House [97 unit motel]
Port
Campbell
Riverland
Retreat Pty
Ltd/Southern
Ocean Group
Pty Ltd
Barraclough
Property Group
Hospitality $15m PA Unsure
5 Loch Ard Interpretive
Centre
Port
Campbell Parks Victoria Tourism $150m PP Unsure
6 Newfield Wind Farm Newfield Acciona Energy Energy $50m PA Unsure
7 Naroghid Wind Farm Naroghid
Naroghid Wind
Farm Pty
Ltd/Wind Farm
Developments
Pty Ltd
Energy $66m PA Unsure
TOTAL $838m
10 Status options: OP: Opportunity, PP: Pre-planning, PA: Planning Approved, CO: Commenced
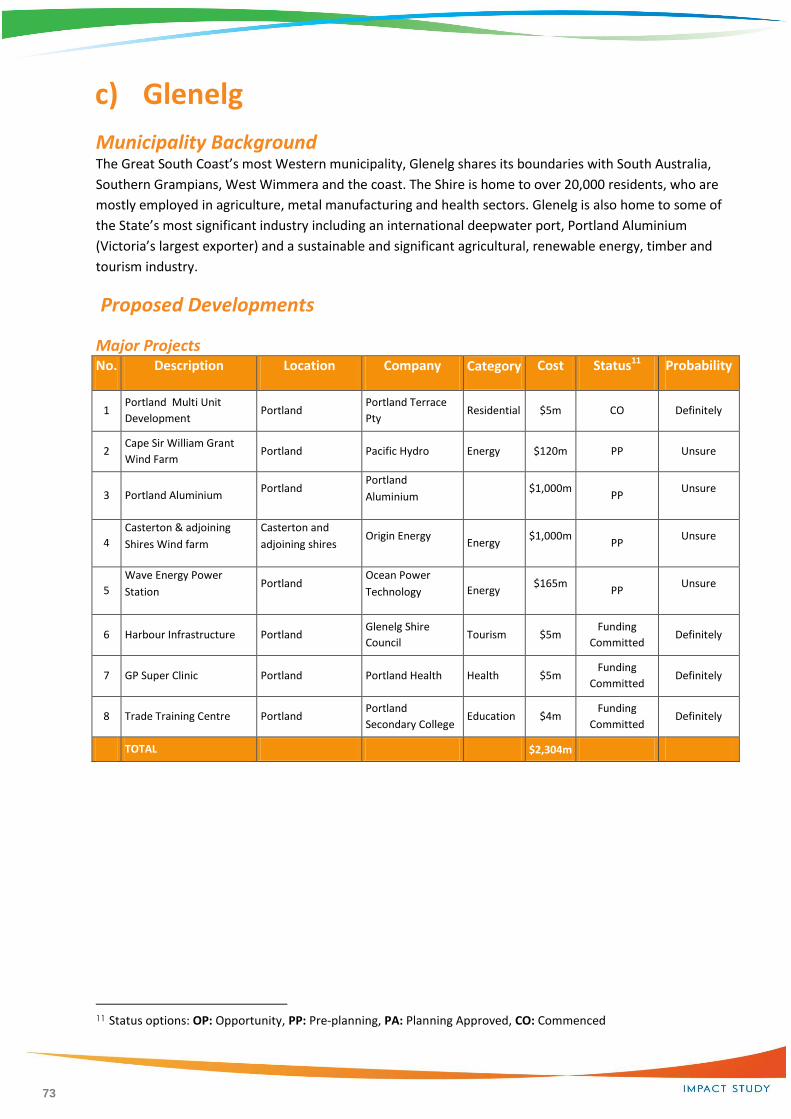
73
c) Glenelg
Municipality Background The Great South Coast’s most Western municipality, Glenelg shares its boundaries with South Australia,
Southern Grampians, West Wimmera and the coast. The Shire is home to over 20,000 residents, who are
mostly employed in agriculture, metal manufacturing and health sectors. Glenelg is also home to some of
the State’s most significant industry including an international deepwater port, Portland Aluminium
(Victoria’s largest exporter) and a sustainable and significant agricultural, renewable energy, timber and
tourism industry.
Proposed Developments
Major Projects No. Description Location Company Category Cost Status11 Probability
1 Portland Multi Unit
Development Portland
Portland Terrace
Pty Residential $5m CO Definitely
2 Cape Sir William Grant
Wind Farm Portland Pacific Hydro Energy $120m PP Unsure
3 Portland Aluminium Portland
Portland
Aluminium $1,000m
PP Unsure
4
Casterton & adjoining
Shires Wind farm
Casterton and
adjoining shires Origin Energy
Energy $1,000m
PP Unsure
5
Wave Energy Power
Station Portland
Ocean Power
Technology Energy $165m
PP Unsure
6 Harbour Infrastructure Portland Glenelg Shire
Council Tourism $5m
Funding
Committed Definitely
7 GP Super Clinic Portland Portland Health Health $5m Funding
Committed Definitely
8 Trade Training Centre Portland Portland
Secondary College Education $4m
Funding
Committed Definitely
TOTAL $2,304m
11 Status options: OP: Opportunity, PP: Pre-planning, PA: Planning Approved, CO: Commenced
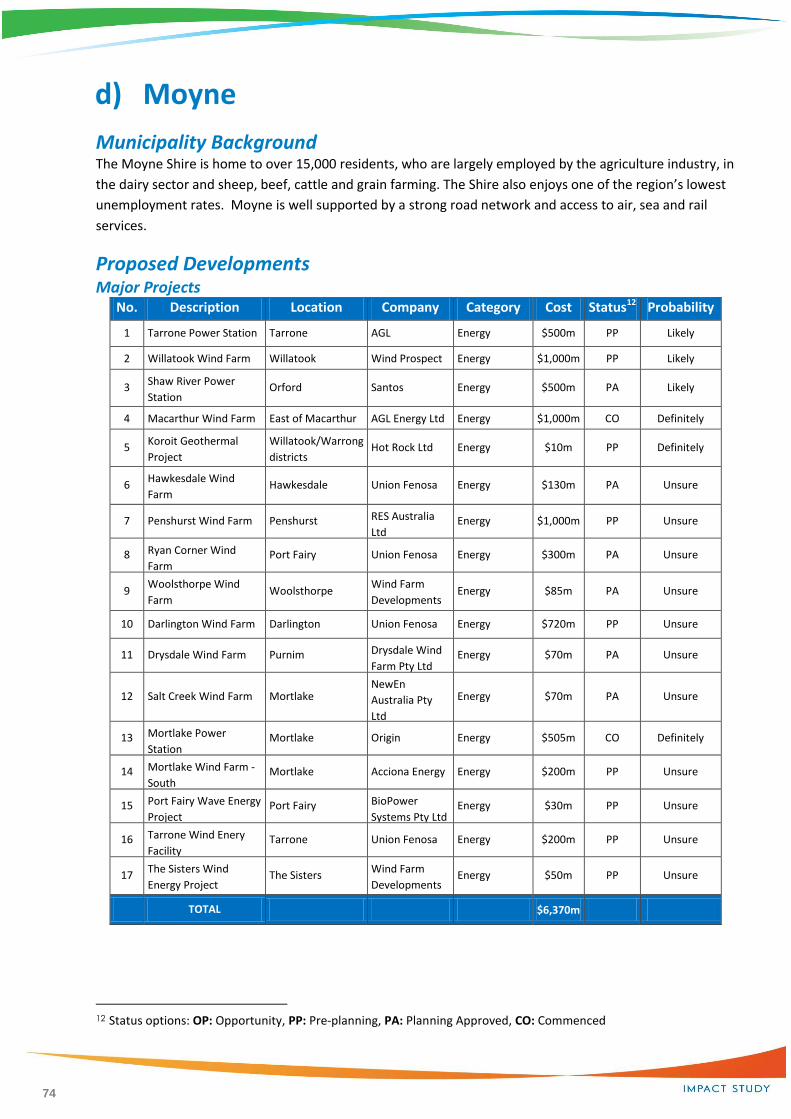
74
d) Moyne
Municipality Background The Moyne Shire is home to over 15,000 residents, who are largely employed by the agriculture industry, in
the dairy sector and sheep, beef, cattle and grain farming. The Shire also enjoys one of the region’s lowest
unemployment rates. Moyne is well supported by a strong road network and access to air, sea and rail
services.
Proposed Developments Major Projects
No. Description Location Company Category Cost Status12 Probability
1 Tarrone Power Station Tarrone AGL Energy $500m PP Likely
2 Willatook Wind Farm Willatook Wind Prospect Energy $1,000m PP Likely
3 Shaw River Power
Station Orford Santos Energy $500m PA Likely
4 Macarthur Wind Farm East of Macarthur AGL Energy Ltd Energy $1,000m CO Definitely
5 Koroit Geothermal
Project
Willatook/Warrong
districts Hot Rock Ltd Energy $10m PP Definitely
6 Hawkesdale Wind
Farm Hawkesdale Union Fenosa Energy $130m PA Unsure
7 Penshurst Wind Farm Penshurst RES Australia
Ltd Energy $1,000m PP Unsure
8 Ryan Corner Wind
Farm Port Fairy Union Fenosa Energy $300m PA Unsure
9 Woolsthorpe Wind
Farm Woolsthorpe
Wind Farm
Developments Energy $85m PA Unsure
10 Darlington Wind Farm Darlington Union Fenosa Energy $720m PP Unsure
11 Drysdale Wind Farm Purnim Drysdale Wind
Farm Pty Ltd Energy $70m PA Unsure
12 Salt Creek Wind Farm Mortlake NewEn
Australia Pty
Ltd
Energy $70m PA Unsure
13 Mortlake Power
Station Mortlake Origin Energy $505m CO Definitely
14 Mortlake Wind Farm -
South Mortlake Acciona Energy Energy $200m PP Unsure
15 Port Fairy Wave Energy
Project Port Fairy BioPower
Systems Pty Ltd Energy $30m PP Unsure
16 Tarrone Wind Enery
Facility Tarrone Union Fenosa Energy $200m PP Unsure
17 The Sisters Wind
Energy Project The Sisters
Wind Farm
Developments Energy $50m PP Unsure
TOTAL $6,370m
12 Status options: OP: Opportunity, PP: Pre-planning, PA: Planning Approved, CO: Commenced
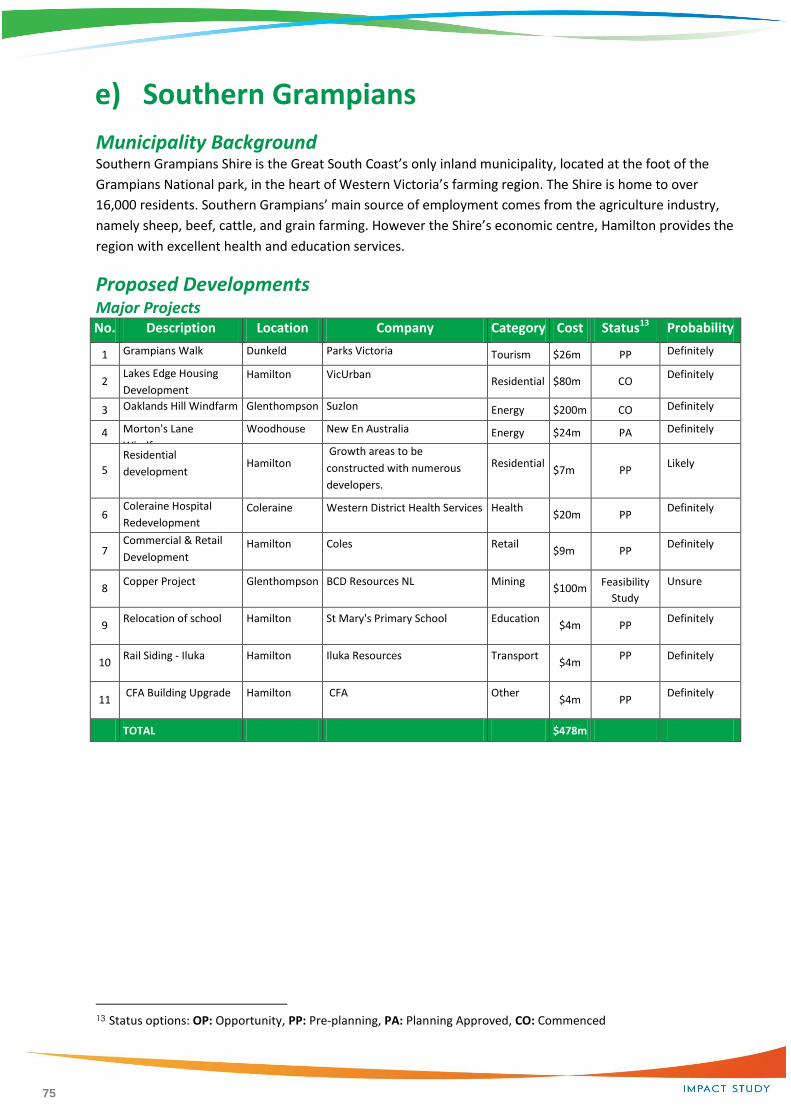
75
e) Southern Grampians
Municipality Background Southern Grampians Shire is the Great South Coast’s only inland municipality, located at the foot of the
Grampians National park, in the heart of Western Victoria’s farming region. The Shire is home to over
16,000 residents. Southern Grampians’ main source of employment comes from the agriculture industry,
namely sheep, beef, cattle, and grain farming. However the Shire’s economic centre, Hamilton provides the
region with excellent health and education services.
Proposed Developments Major Projects No. Description Location Company Category Cost Status13 Probability
1 Grampians Walk Dunkeld Parks Victoria Tourism $26m PP Definitely
2 Lakes Edge Housing
Development
Hamilton VicUrban Residential $80m CO
Definitely
3 Oaklands Hill Windfarm Glenthompson Suzlon Energy $200m CO Definitely
4 Morton's Lane
Windfarm
Woodhouse New En Australia Energy $24m PA Definitely
5
Residential
development Hamilton
Growth areas to be
constructed with numerous
developers.
Residential $7m PP
Likely
6 Coleraine Hospital
Redevelopment
Coleraine Western District Health Services Health $20m PP
Definitely
7 Commercial & Retail
Development Hamilton Coles Retail
$9m PP Definitely
8 Copper Project Glenthompson BCD Resources NL Mining
$100m Feasibility
Study
Unsure
9 Relocation of school Hamilton St Mary's Primary School Education
$4m PP Definitely
10 Rail Siding - Iluka Hamilton Iluka Resources Transport
$4m PP Definitely
11 CFA Building Upgrade Hamilton CFA Other
$4m PP Definitely
TOTAL $478m
13 Status options: OP: Opportunity, PP: Pre-planning, PA: Planning Approved, CO: Commenced
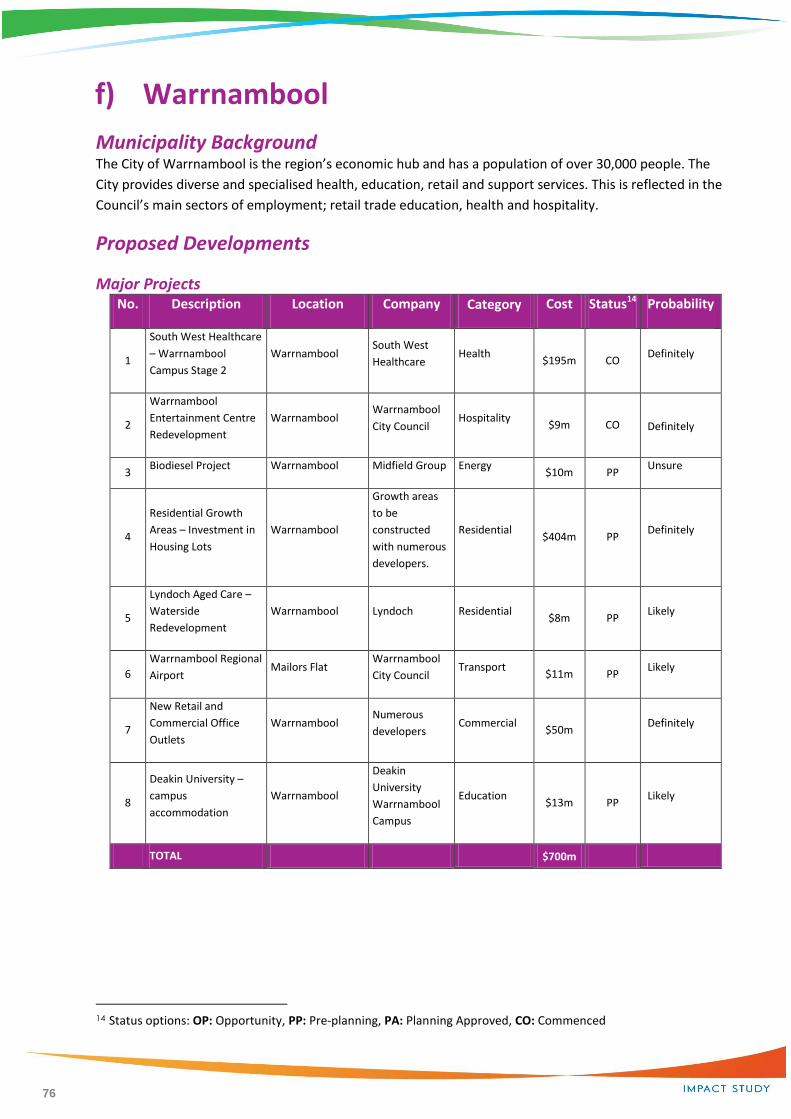
76
f) Warrnambool
Municipality Background The City of Warrnambool is the region’s economic hub and has a population of over 30,000 people. The
City provides diverse and specialised health, education, retail and support services. This is reflected in the
Council’s main sectors of employment; retail trade education, health and hospitality.
Proposed Developments
Major Projects No. Description Location Company Category Cost Status14 Probability
1
South West Healthcare
– Warrnambool
Campus Stage 2
Warrnambool South West
Healthcare Health
$195m CO Definitely
2
Warrnambool
Entertainment Centre
Redevelopment
Warrnambool Warrnambool
City Council Hospitality
$9m CO
Definitely
3 Biodiesel Project Warrnambool Midfield Group Energy
$10m PP Unsure
4
Residential Growth
Areas – Investment in
Housing Lots
Warrnambool
Growth areas
to be
constructed
with numerous
developers.
Residential $404m PP
Definitely
5
Lyndoch Aged Care –
Waterside
Redevelopment
Warrnambool Lyndoch Residential $8m PP
Likely
6
Warrnambool Regional
Airport Mailors Flat
Warrnambool
City Council Transport
$11m PP Likely
7
New Retail and
Commercial Office
Outlets
Warrnambool Numerous
developers Commercial
$50m Definitely
8
Deakin University –
campus
accommodation
Warrnambool
Deakin
University
Warrnambool
Campus
Education $13m PP
Likely
TOTAL $700m
14 Status options: OP: Opportunity, PP: Pre-planning, PA: Planning Approved, CO: Commenced
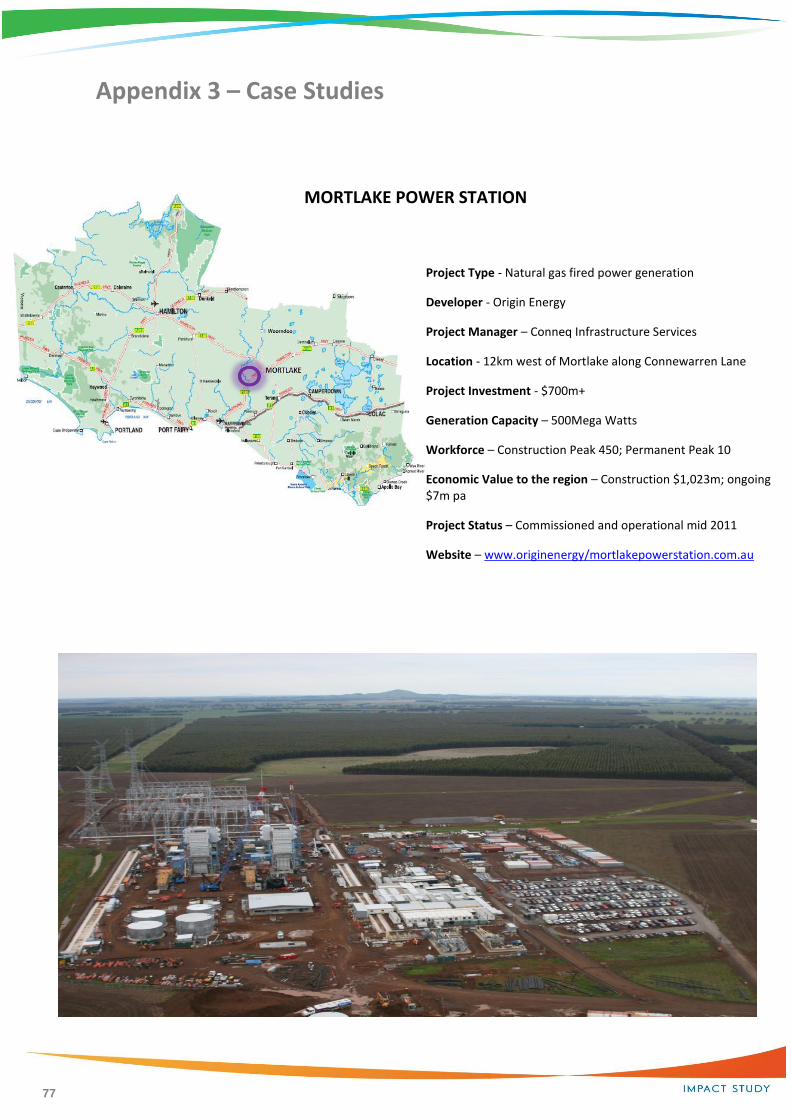
77
Appendix 3 – Case Studies
MORTLAKE POWER STATION
Project Type - Natural gas fired power generation
Developer - Origin Energy
Project Manager – Conneq Infrastructure Services
Location - 12km west of Mortlake along Connewarren Lane
Project Investment - $700m+
Generation Capacity – 500Mega Watts
Workforce – Construction Peak 450; Permanent Peak 10
Economic Value to the region – Construction $1,023m; ongoing $7m pa
Project Status – Commissioned and operational mid 2011
Website – www.originenergy/mortlakepowerstation.com.au
78
Project Description
The Mortlake Power Station is owned by Origin Energy and located along Connewarren Lane on a 100 ha
site with the Power Station occupying 20ha. The Power Station has been designed to produce 550 MW of
electricity annually from the open cycle natural gas fired power plant. The economic driver for the
investment in the project is to supply clean power to the Victorian market during high electricity demand
periods. The design of the plant will allow Origin to further develop the capacity of the plant if future
demand and carbon pricing requires further investment.
The Mortlake location was chosen due to its proximity to the 500KV high voltage power line, proximity to
Origin’s gas reserves and processing plant near Port Campbell, access to and suitability of the chosen site
and road networks. Conneq Infrastructure Services was the responsible Project Manager during the
construction period and up until the commissioning period is completed. For this project it was decided
that all the accommodation needs for the construction teams would be provided by the existing
accommodation facilities and operators within the immediate Mortlake, Terang and Warrnambool districts.
In addition to the main Power Station, construction of another two significant projects was required to
support the Mortlake Power Station. The first, to construct 83 km of gas transmission pipeline from Origin’s
gas processing plant near Port Campbell to deliver a continuous supply of natural gas to the Mortlake
Power Station. The pipeline was commenced in February 2009 and completed in March 2010. The second
support project was to construct a 15km reused water pipeline extending from the Wannon water facility
to the southeast of Mortlake to the newly constructed Mortlake power station.
Workforce/Employment
Power Station Construction Peak 370
Management / Supervisors 80
Gas and Water supply pipelines > 120
8 Apprenticeships and 4 Indigenous training opportunities were created
Approximately 20% (90) of total workforce were selected from the local and regions community
Local skilled workforce very suitable for project
Registration of interest for work exceeded 2600 applications
Majority of construction workers supplied by Conneq and contract teams who work around
Australia and overseas
79
“Code of Behaviour”, all workers inducted and expected to comply
Safe working environment guides all actions
Local contractors used in the supply chain
Skills – plant operators, mechanics, electrical, plumbers, engineering, surveying, truck drivers , crane
operators, labourers, etc
Accommodation
No preference for “camps”, prefer integration into district community
Very generous living away from home allowance
Use of broad range of accommodation from shearers huts, caravan parks, private housing, motels to
executive apartments
Prefer access to accommodation no further than 45mins travel time to reduce fatigue
All employees and contractors were able to find accommodation in the Koroit, Warrnambool, Port
Fairy, Terang and Mortlake districts
Responsibility of workers to find own accommodation
Transport
Heavy vehicle and over sized transport all came from Melbourne direction including escort vehicles
General satisfaction with highway, arterial and local road networks
Very good cooperation between Victorian Police, Vicroads, Local Councils, transport operators and
community of Mortlake
Access to site suitable to all weather conditions
Truck movements varied depending on operation
Significant increase in local traffic in Mortlake and Connewarren Lane feeder roads
80
PROJECT IMPACT
Medium Term (2 years)
Significant local employment opportunities
Opportunity to develop new regional skilled workforce
Significant increase in house prices and rental properties in Mortlake and district
Mortlake house prices increased by 30-50%>; rental properties in high demand reflecting similar
percentage increases to housing prices
Opportunistic accommodation demand for on farm, caravan park and casual accommodation
Significant increase in spending patterns within the Mortlake township and the larger region – food,
entertainment venues, recreation pursuits, service industry etc
Additional exposure to different cultures and work practices for the broader population
Estimated spend in local district economy by workers of $500,000 per week at peak employment
period
There is the potential that some of these impacts maybe of a ‘spiking’ nature with subsequent
declines occurring once the construction phase of the project is completed
Long Term (After commissioning)
New families and skills to the region
New career and business opportunities for local people
Potential full time positions in power station operations, up to 10 full time positions
Potential for ongoing maintenance and supply contracts
Opportunity for social service providers, health sector and education providers to increase their
market share
Recognition of Mortlake and larger region as a new hub for the production of clean energy
Community funding program to be established by Origin will present opportunities for funding
partnerships for community projects and programs
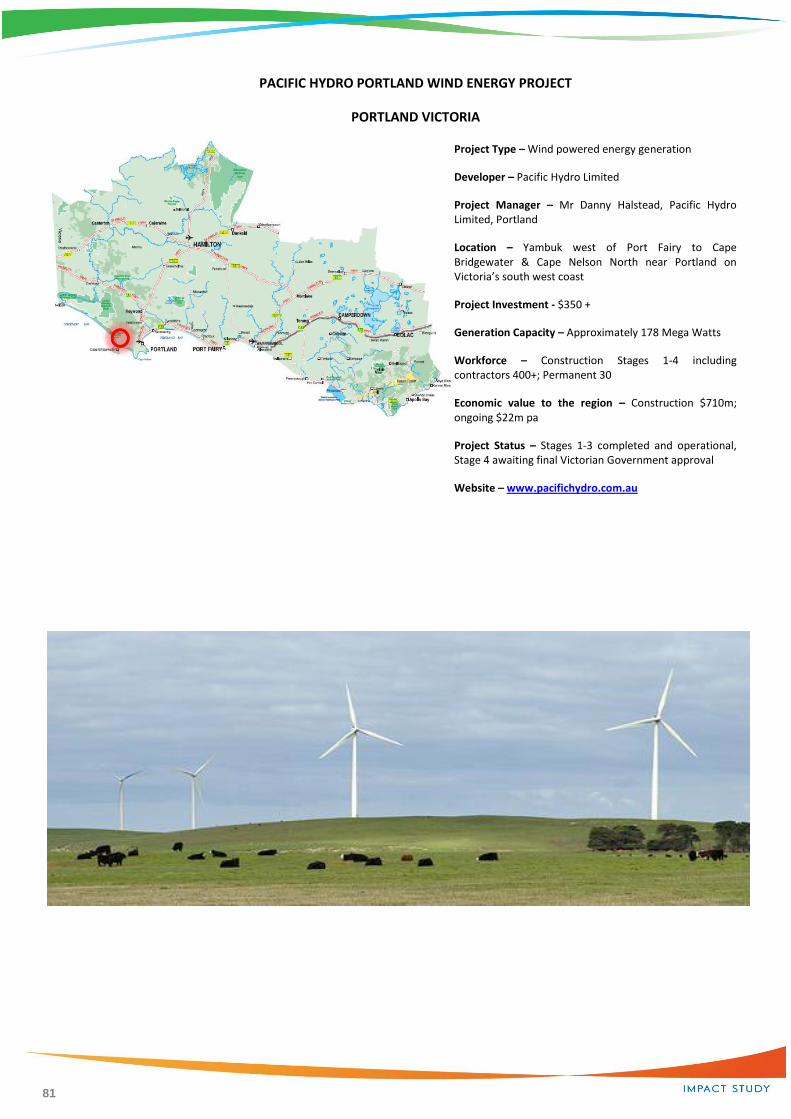
81
PACIFIC HYDRO PORTLAND WIND ENERGY PROJECT
PORTLAND VICTORIA
Project Type – Wind powered energy generation
Developer – Pacific Hydro Limited
Project Manager – Mr Danny Halstead, Pacific Hydro Limited, Portland
Location – Yambuk west of Port Fairy to Cape Bridgewater & Cape Nelson North near Portland on Victoria’s south west coast
Project Investment - $350 +
Generation Capacity – Approximately 178 Mega Watts
Workforce – Construction Stages 1-4 including contractors 400+; Permanent 30
Economic value to the region – Construction $710m; ongoing $22m pa
Project Status – Stages 1-3 completed and operational, Stage 4 awaiting final Victorian Government approval
Website – www.pacifichydro.com.au

82
Project Description
The Portland Wind Energy Project is a four part strategic wind energy project owned and operated by
Pacific Hydro Limited. The project focuses on the establishment of four separate wind farms located along
the south west coast of Victoria. The location of the wind towers and their configurations are negotiated
between Pacific Hydro, the land owners, local community, State and Local Governments.
Stages 1- 3 have been completed and are operational, producing wind generated power for the Victorian
grid network. Stage 4 is awaiting final planning approval from the Victorian Government which is
anticipated to be approved in 2011. When stage 4 is completed and operational the Portland Wind Energy
Project will generate approximately 178 MW of power from 94 wind turbines, eliminating approximately
600,000 tonnes of green house gas emissions per annum.
Portland is the main centre for administration and project management for this project and a specialist
workforce within the Portland district has developed specific skills to support this new industry. Pacific
Hydro will employ approximately 30 full time staff to manage and operate their wind farm in the Great
south coast region of Victoria. The future workforce opportunities are for the development of local skills to
service this emerging industry for the longer term maintenance of the wind farms and the associated
infrastructure.
Workforce/Employment
Construction Stages 1-4 peak employment 400+
Over 500 inductions completed to date
Permanent operational workforce 30 EFT fully trained
During construction approximately 10% of expertise imported from overseas, 90% from within
Australia
Portland district community have developed specific skills related to the wind energy construction
and maintenance – civil engineering, fitter & turners, industrial electricians, plant operations, civil
engineering, heavy haulage, escort logistics, assembly line management.
Preference to use skilled local workforce and contractors
Site and workers safety critical importance
Opportunity for young, skilled professionals to return to Portland district for permanent employment
Ongoing opportunity to develop skilled work teams
83
Accommodation
Portland the key centre for accommodation either casual or permanent
Style of accommodation – apartment, hotel, motel, private rental, caravan parks, etc
Accommodation adequately supplied by private enterprise
Transport
Port of Portland very efficient with handling of imported equipment such as turbines, blades, etc
Port of Portland important strategic asset for wind energy projects and bulk handling
Oversized and heavy haulage transport and escort vehicle expertise very good in the region
Estimated 110 heavy vehicle movements per constructed wind tower
Cultural / Social Economic Influences
Attraction for young, skilled professionals to return home to further their careers bringing enhanced
skills to the region
Reuniting regional families
Small number of international workers have now made Portland their home
Increase local community exposure to different cultures
Employment packages above local average – increase in residential investment in Portland district
Increase in retail activity, local shopping, recreation and entertainment
Catalyst for increased financial support to education, child care service providers
Pacific Hydro’s social policy of financially supporting the Portland and regional communities. A
number of regional community projects and associations receive financial assistance each year.
84
General Comment
Portland community very welcoming and supportive of the projects and workforce
Financial returns on wind energy projects in Australia are significantly less than in Chile due to the
retail cost of power
Political decisions on carbon pricing will influence future wind energy investments
Victorian Planning process very arduous and lengthy
Opportunities to develop teams of skilled maintenance personnel specific to the wind generation
industry
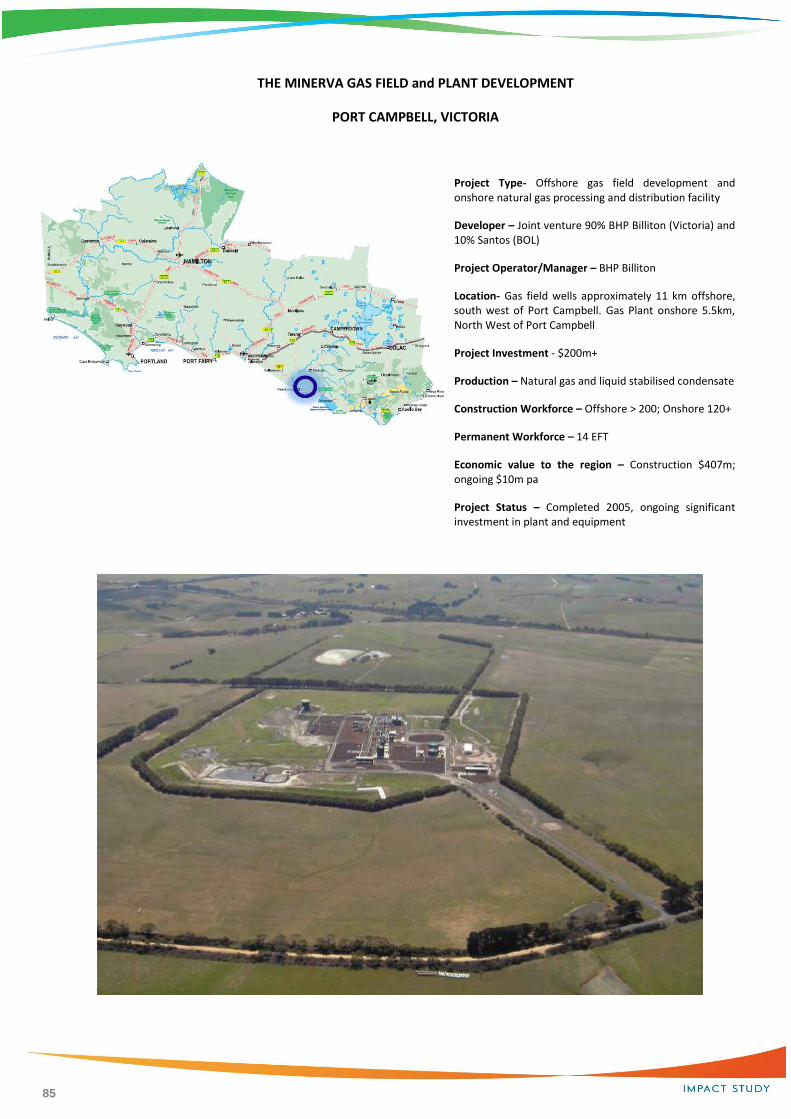
85
THE MINERVA GAS FIELD and PLANT DEVELOPMENT
PORT CAMPBELL, VICTORIA
Project Type- Offshore gas field development and onshore natural gas processing and distribution facility
Developer – Joint venture 90% BHP Billiton (Victoria) and 10% Santos (BOL)
Project Operator/Manager – BHP Billiton
Location- Gas field wells approximately 11 km offshore, south west of Port Campbell. Gas Plant onshore 5.5km, North West of Port Campbell
Project Investment - $200m+
Production – Natural gas and liquid stabilised condensate
Construction Workforce – Offshore > 200; Onshore 120+
Permanent Workforce – 14 EFT
Economic value to the region – Construction $407m; ongoing $10m pa
Project Status – Completed 2005, ongoing significant investment in plant and equipment

86
Project Description
The Minerva Gas Field and Gas Plant is a joint venture project between BHP Billiton (Victoria) the operator
who has a 90% holding and Santos (BOL) with a 10% holding in the project. The gas field was first
discovered in 1993 and is situated approximately 11 km off-shore south west of Port Campbell. Drilling of
the gas wells commenced in late 2002 and were completed in January 2003. The construction of the gas
plant which is situated 5.5 km north west of Port Campbell, was project managed by Kellogg Brown and
Root Pty Ltd (KBR) and was completed in December 2004. After commissioning the first processed gas
flowed into the pipeline distribution network in January 2005.
Prior to the commencement of drilling, BHP Billiton negotiated a 10 year sale and supply agreement with
Pelican Power P/L for the majority of the Minerva gas field production. After processing at the Minerva Gas
Plant the gas is delivered to the Pelican Point Power Station near Adelaide, South Australia via a 680km gas
pipeline owned and operated by SEA Gas. The Minerva Gas Plant at Port Campbell also distributes gas into
the Victorian market networks. The Plant also produces condensate which is stored and transported to
Geelong along a designated route.
The initial capital investment in the Minerva Gas Field joint venture was approximately $200m but
significant reinvestment has been made since commissioning of the production facilities in 2005.
This project has been a successful long term investment decision by the joint venture partners and
demonstrates the critical importance of a coordinated planning approach between the investment
partners, the Victorian and South Australian Governments, the Corangamite Shire and the local
government agencies and local communities through which the pipelines were constructed.
WORKFORCE/EMPLOYMENT
The workforce participation is separated into two categories –
Offshore Activity
Offshore drilling of gas wells and associated pipe laying require very specialist skills which was
provided by contract teams- 100 – 200 depending on work activity
High level of training for workplace safety and management of the natural environment
Some limited local logistic support from the region was provided for the pipe laying barge, diving
boat and support vessel.
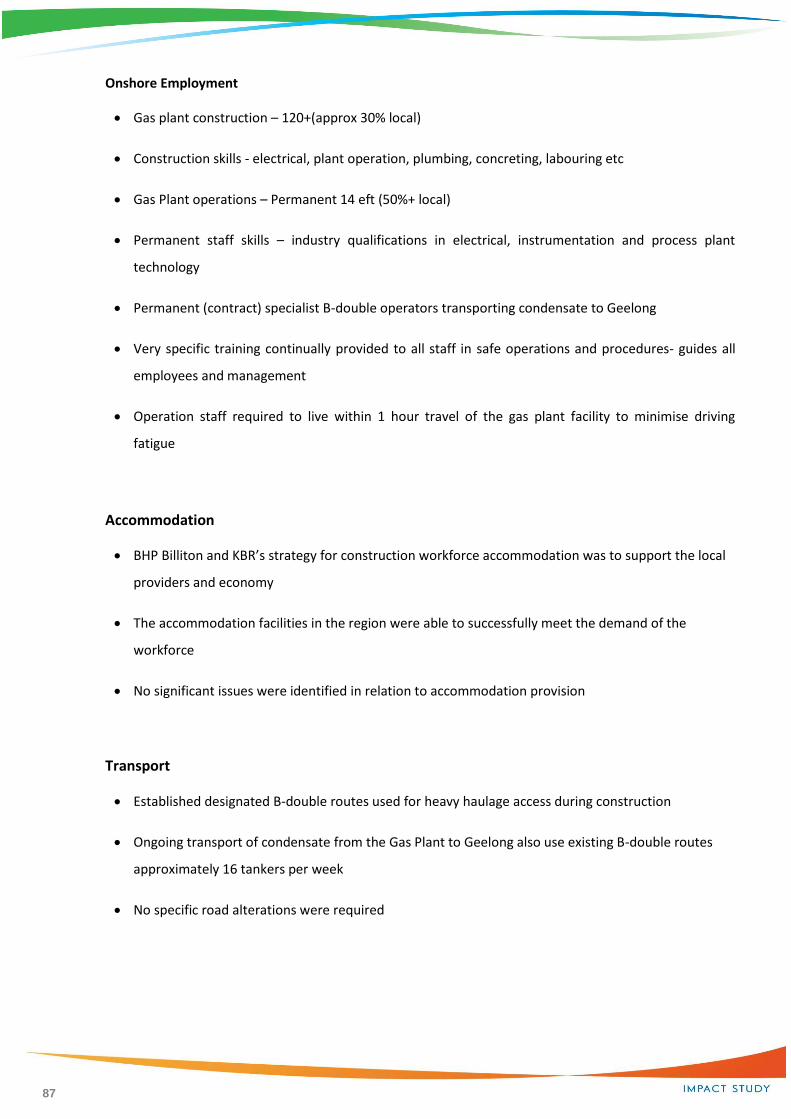
87
Onshore Employment
Gas plant construction – 120+(approx 30% local)
Construction skills - electrical, plant operation, plumbing, concreting, labouring etc
Gas Plant operations – Permanent 14 eft (50%+ local)
Permanent staff skills – industry qualifications in electrical, instrumentation and process plant
technology
Permanent (contract) specialist B-double operators transporting condensate to Geelong
Very specific training continually provided to all staff in safe operations and procedures- guides all
employees and management
Operation staff required to live within 1 hour travel of the gas plant facility to minimise driving
fatigue
Accommodation
BHP Billiton and KBR’s strategy for construction workforce accommodation was to support the local
providers and economy
The accommodation facilities in the region were able to successfully meet the demand of the
workforce
No significant issues were identified in relation to accommodation provision
Transport
Established designated B-double routes used for heavy haulage access during construction
Ongoing transport of condensate from the Gas Plant to Geelong also use existing B-double routes
approximately 16 tankers per week
No specific road alterations were required

88
Cultural/Social/Economic Influences
Estimated annual ongoing direct economic benefit to the immediate economy around $2m
Long term project for the region and establishment of two, large, international energy producers in
the region
Significant short term boost to local economy during construction
Catalyst for ongoing investment in the region
Relocation of additional industry professionals into the Port Campbell region, including their families
Local employees were trained to world best practice standards for gas production
Higher wage levels for local employees engaged by BHP Billiton
Local retailers, service providers, accommodation and leisure providers experienced additional
trading over their traditional market
BHP established a Environmental Review Committee (ERC) to provide a forum for the local residents,
Corangamite Shire and BHP staff to discuss the construction and ongoing operation of the plant
BHP Billiton recognise the sensitivity of the local coastal environment and the proximity to the
Twelve Apostles
Established a community support program especially to assist in environmental projects, community
sustainability and education projects.
Established a strong relationship with the Timboon P-12 College and assist senior students with work
experience and annual careers day
Ongoing local employment opportunities both in the permanent workforce and contract
opportunities when maintenance and upgrades are required

89
ILUKA RESOURCES LIMITED – MINERAL SANDS SEPARATION PLANT HAMILTON,
VICTORIA
Project Type – Construction and operation of a mineral sands separation and processing plant at Hamilton. Development of a mining operation and primary processing plant at Douglas n-west of Balmoral
Developer – Iluka Resources Limited
Project Manager – Construction -Roche Mining Pty Ltd
Operation –Iluka Resources
Location – Mineral Separation Plant -159 Burgins Road, Hamilton
Mine site – Douglas near Balmoral
Project Investment – Douglas Mine & Primary Plant $180m; Separation Plant, Hamilton $210m
Production Capacity – 330 ktpa
Workforce – Construction Peak - 200+; Permanent - 165
Economic value to the region – Construction $785m; ongoing $178m pa
Project status – Douglas mine operational since 2006 and the Hamilton Separation Plant commissioned in 2007 - key products Zircon & Rutile
Website – www.iluka.com
90
Project Description
Iluka Resources global head office is based in Perth and they are recognised as one of the world’s leading
miners and processor of heavy mineral sands and lead the international value chain in the supply of zircon
and titanium dioxide products.
The Murray Basin region comprising of western Victoria and southern NSW (north of Mildura) contain very
extensive deposits of heavy mineral sands. In 2002/3 Iluka made a strategic decision to acquire and
develop significant tenements in the Murray Basin to ensure their position in the global market place
would be maintained for many decades. The Murray Basin mineral sands are rich in zircon and rutile
deposits and have an estimated productive cycle till at least 2023. The first mine to commence operations
was at Douglas near Balmoral during 2004. In future years the mining operations will progressively move
north towards Ouyen and Pooncarie. As the mining is completed in one area the land is rehabilitated with
trees and pasture. After primary processing at the Douglas mine site, the mineral sands are transported in
specially designed B-doubles south to Hamilton for further processing before being transported to Portland
or Melbourne, where the minerals are stored awaiting shipment to the international market place.
Construction of the Hamilton Heavy Mineral Separation Plant was commenced in 2005 and commissioned
in 2007. The plant is located approximately 10 km west of Hamilton on the Glenelg Highway. Roche Mining
were the project managers for the construction of the separation plant at Hamilton and the construction of
the primary treatment plant and mining operation at Douglas. During construction Roche managed two
construction villages, one near Hamilton and the other at Balmoral. A contract transport service was
provided from both locations to move the workers to and from the work sites.
The Hamilton plant is strategically located next to a large reuse water storage facility owned by Wannon
Water who in partnership with the Victorian Government and Iluka built a Class A Water Treatment Plant
to provide reuse water for Iluka’s processing systems. During 2010 the separation plant at Hamilton was
upgraded to increase its capacity and in 2011 a rail siding is being constructed into the Hamilton plant,
which will allow for some of the transport to be provided by rail from the Kulin mine near Ouyen into
Hamilton. This additional investment of $6m in rail upgrades will be in a partnership between Iluka and the
Victorian Government.
Iluka’s capital investment into the western region of Victoria, known as the Murray Basin region, has
permanently changed the economic profile of the whole region and provided “real” opportunity for people
to consider relocating to Hamilton and the broader region and investing in the social capital of our
community. The Hamilton and Balmoral communities were very engaged and supported Iluka’s Murray
Basin project in a variety of ways.
91
Workforce/Employment
Hamilton & Douglas Construction period 3 years - 200> construction workforce
Operations Permanent – currently 165 Iluka employees
During construction 80% of workers were from outside the region and 20% were local
Over 70 local businesses in the Hamilton & Balmoral districts provided services to Roche Mining and
Iluka Resources during construction
All levels of construction skills, plant operations and trade skills were required. A number of
administration positions were also created.
Workplace safety and management of environment were mandatory requirements for all workers
Significant investment in numerous training programs for construction and long term employment
positions
Number of local staff sent to Western Australia for training courses
At start up of operations senior and middle management positions occupied by people outside the
region, most with previous mining/processing experience
Local industry intelligence and skills are developing and opportunities for higher levels of operational
responsibility are available for local people
Encouraged relocation to Hamilton of companies in the supply chain such as Kempe Engineering
Services, Krueger Engineering
Long term contracts with local companies have been negotiated such as Kalari Transport for the
transport of the mineral sands which has created 60 + new positions in the Hamilton, Horsham and
Portland areas

92
Accommodation
Construction Period
Workers villages were established in Hamilton and Balmoral to provide short term accommodation
during the construction period
Rental properties experienced strong demand especially apartment type accommodation
Demand strong for short term apartment rental, 1-3 months
High demand for caravan park and motel accommodation
Commencement period for private home purchase demand
Local residential market supply able to meet demand
Permanent Operations
Significant increase in demand for residential housing within Hamilton and surrounding areas
Demand for rental properties both short and long term strong
Hamilton house prices rose approximately 30-80% over 2 years within selected areas
Balmoral house prices increased significantly
Demand for lifestyle properties increased, such as small acreage farms
Small towns within 60km of Hamilton experienced increase in housing demand
93
TRANSPORT
During construction of Hamilton Separation Plant heavy haulage and B-double trucks were used
Realignment of the approach to the Burgins road rail crossing and warning signals completed
Turning lanes installed into Burgins Road from Glenelg Highway
Hamilton to Douglas mine site designated B-double route required minor strengthen works on
culverts and bridges
Road maintenance demand increase
Radio communication between trucks and school buses & driving protocols introduced and strictly
enforced for travelling through small towns – Balmoral & Cavendish
Transport of product between Hamilton and the mine sites and Hamilton to Portland is provided by
B-double trucks operating 24hours per day, 7 days a week, 365 days per year
Rail transport will be utilised between Hopetoun and Hamilton when track upgrades, loading facility
at Hopetoun and a new rail siding at the Hamilton Separation Plant is completed during2011
Saline water transported from Hamilton to Wannon Water’s treatment plant at Warrnambool, 7
days per week, 365 days per year using two B-double trucks
Majority of product for export is shipped from the Port of Portland as bulk product
94
CULTURAL /SOCIAL/ECONOMIC INFLUENCES
Migration of people with new skills to the regions of Balmoral, Hamilton, Horsham and Portland
Families relocating from interstate and overseas to the region, reason for the return of young
professionals
Introduction of new cultures and religion into the communities
Adjustment required from recently arrived and established community members to assist new
residents to integrate into the communities
Greater awareness in secondary colleges of the careers available in the mining industry in the region
where students live
Demand for increased leisure, recreation facilities
Hamilton industrial estate was developed with new and existing businesses expanding
Catalyst for the joint venture between Southern Grampians Shire and Vicurban to develop
Hamilton’s “Lakes Edge” 300 lot residential subdivision and development
Strong social and financial commitment by Iluka to support community programs, ie- HILAC at
Hamilton, local business awards, numerous community and environmental projects
Increase in service and sporting club memberships
Private and public school enrolments significantly increased in Hamilton region
Hamilton district no longer reliant on the public sector or agriculture for volume numbers of
employment opportunities
Local businesses exposed to new business standards, codes of operation and improved business
practices including OH&S
Iluka employees have high disposable incomes
Recreation services and holiday accommodation demand increase within 100 km of Hamilton
Increased traffic flows in and out of Hamilton with light commercial vehicles
Significant increase in awareness and focus from Victorian Government on the Great South Coast
region and its future opportunities
95
Appendix 4 – Fact Sheets
1) Shaw River Power Station
2) Macarthur Wind Farm
3) Koroit Geothermal Project
4) Oaklands Hill Wind Farm
5) Coleraine Hospital Redevelopment
6) South West Healthcare: Warrnambool Campus Stage 2
7) Warrnambool residential growth areas
8) Regional timber harvesting
9) Regional dairy farming sector
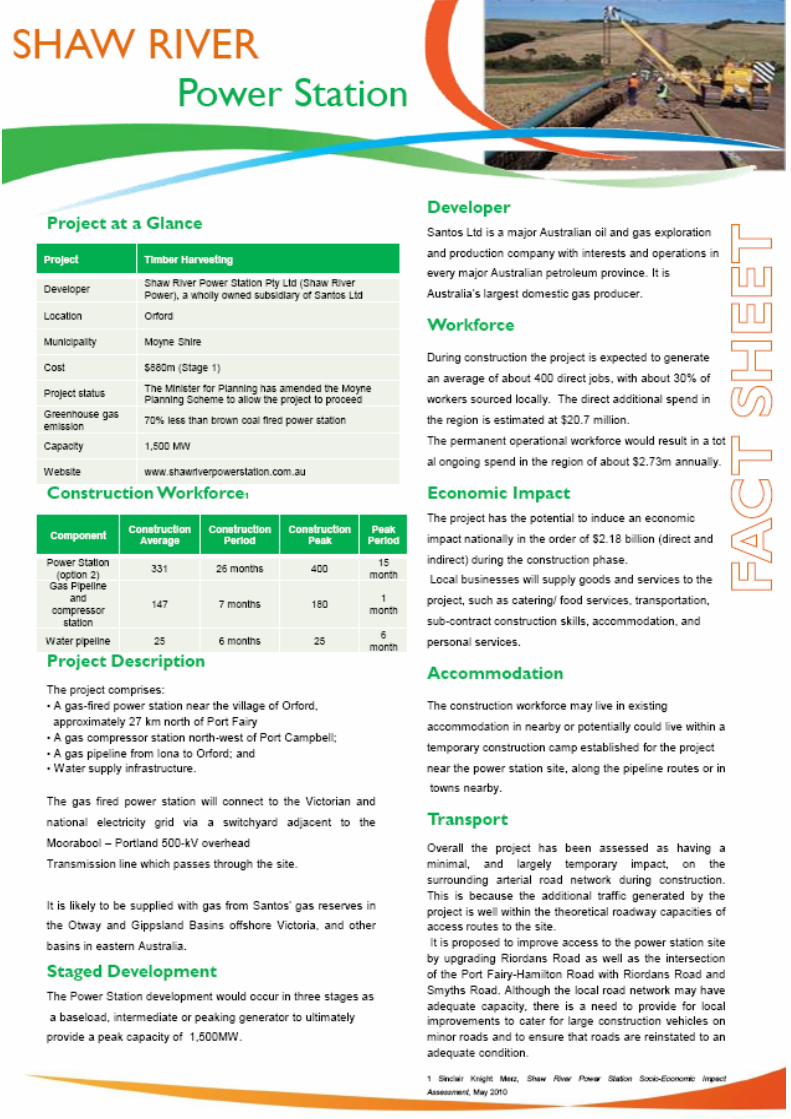
96

97

98
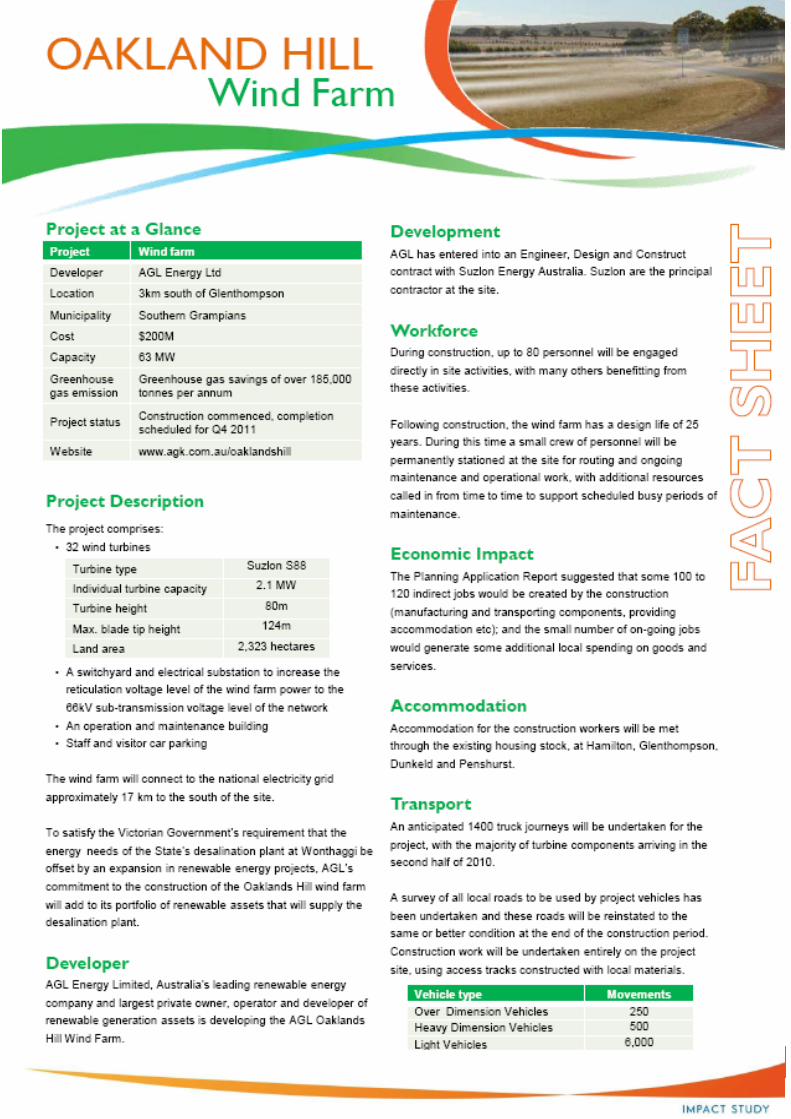
99

10
0
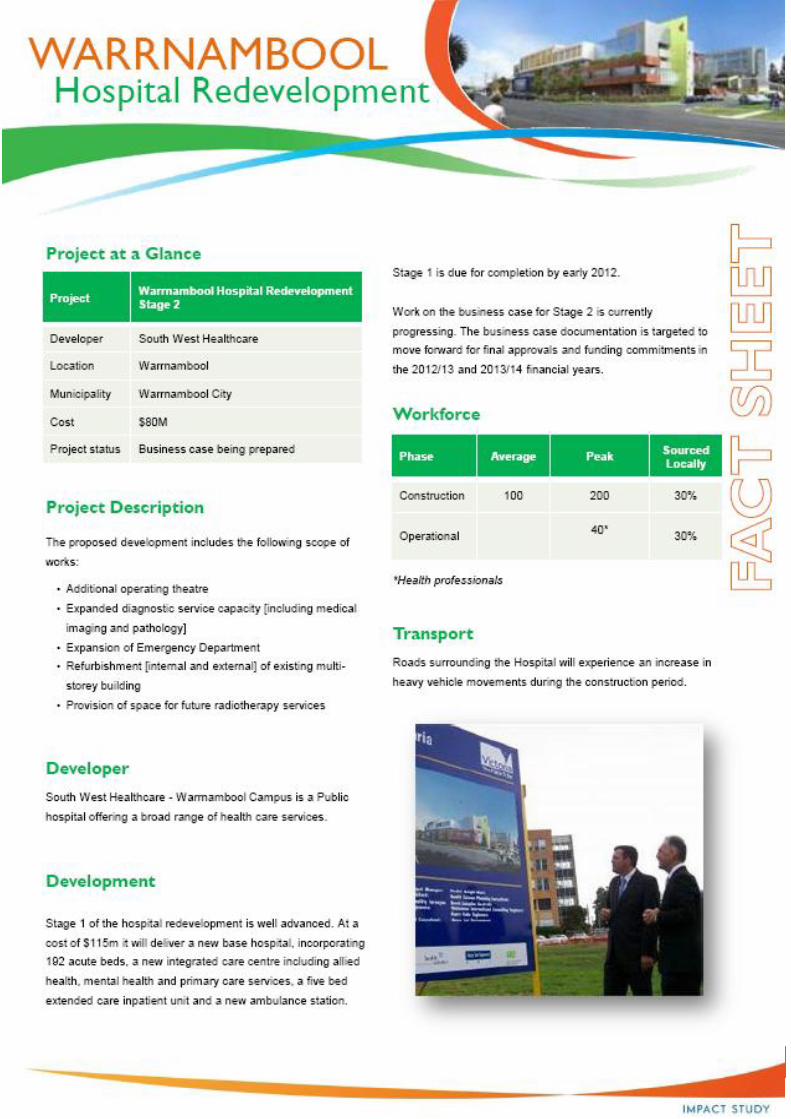
10
1
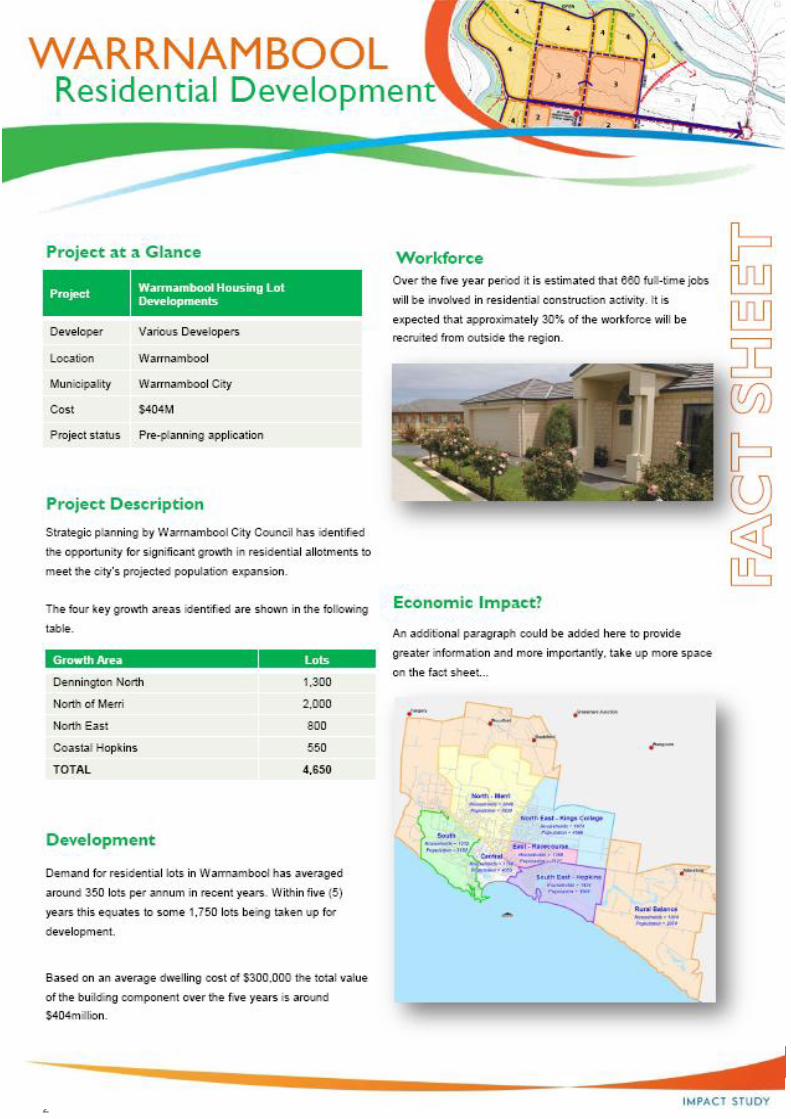
10
2

10
3
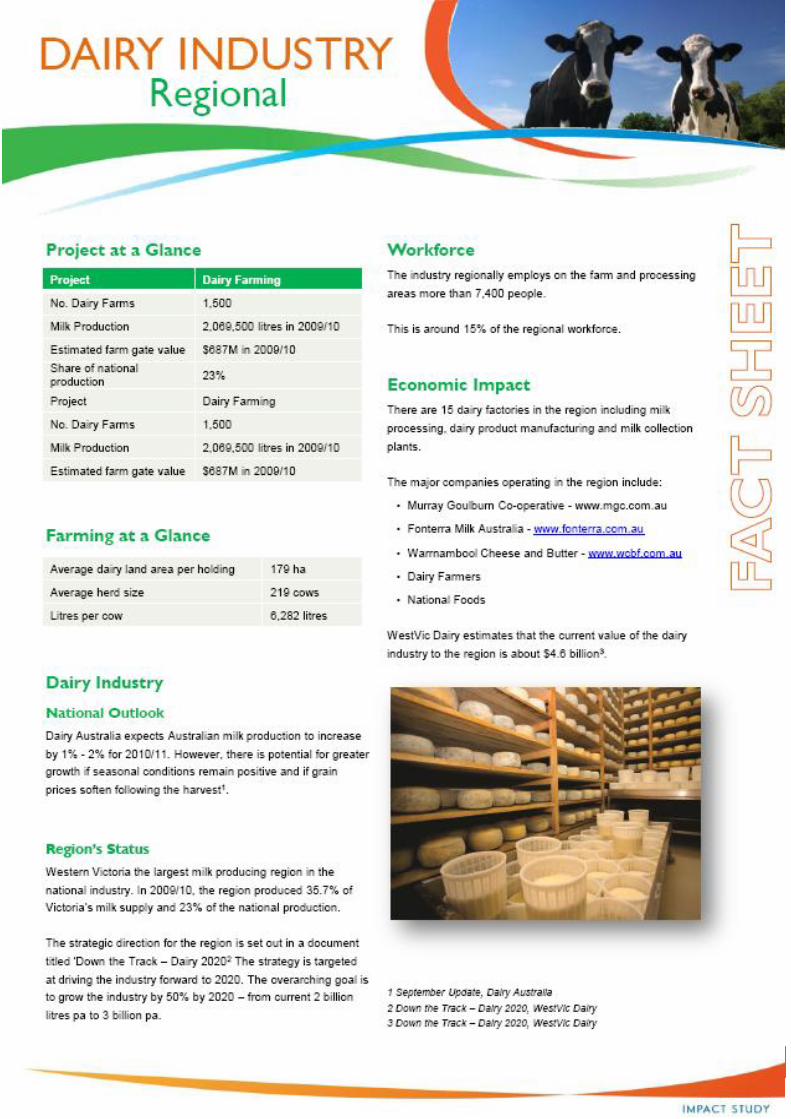
10
4