Embed Size (px)
Citation preview

Interim Results Presentation 2013

Agenda
Introduction Toby Courtauld, Chief Executive
Financial Results Nick Sanderson, Finance Director
Market Toby Courtauld, Chief Executive
Disposals & Acquisitions
Asset Management Neil Thompson, Portfolio Director
Development
Outlook Toby Courtauld, Chief Executive
1
To September 2013 6 months Q2 Q1 12 months
Property Valuation1 +6.7% +3.3% +3.3% +10.9%
Portfolio ERV movement1 +3.6% +1.4% +2.1% +6.7%
Total Property Return +8.3% +4.0% +4.1% +14.3%
EPRA NAV +9.2% +5.0% +4.0% +14.9%
Headline Results
1. Like-for-like, including share of joint ventures 2

-30
-20
-10
0
10
20
30
40
50
60
-20
-10
0
10
20
30
40
2002 2004 2006 2008 2010 2012
Relative (RHS) IPD central London GPE
GPE IPD Relative
Total return 14.3% 14.1% +0.2%
Capital return 11.0% 9.7% +1.3%
TPR % pa, Years to 30 Sept
Outperforming Relative returns vs IPD
Source: IPD 3
Relative TPR over 5 years (%), years to 30 Sept
70
80
90
100
110
120
130
140
150
160
170
2008 2009 2010 2011 2012 2013
GPE
IPD central London
IPD Universe
Successful Strategy is Delivering
4
- 2 projects completed, 49.6% profit on cost
- 3 on-site
- 67% pre-let
- 37% profit on cost
- More to come …
- 5 schemes near term
- 502,100 sq ft West End planning permissions
- 17 schemes longer term
- 22 scheme total pipeline, 1.9m sq ft:
- 88% in supply-constrained West End
- Major opportunity
- £113.5m sold2
- 4% > book value
- £90.0m bought
- East Oxford St regeneration
- Crystallised at Hanover Sq
- Sold into 50:50 JV
- £202m
3. Accretive recycling
- 38 new lettings; £18.1m pa rent1
- 3.2% > March ERV
- Rental income 21%
- Since half year1
- £2.6m leased
- £2.4m under offer
- 5.8% > March ERV
- Reversionary potential 18.1% (12.3% March)
- More to come
- Actively increased void rate, 4.0% today
2. Strong asset management 1. Significant development surpluses
Strong start – Great shape
2. Including share of JVs
- 3.2% average interest rate – record low
- LTV to 28.7%
- £503m firepower
4. Financial position - strong
1. Includes 100% of JV

More to Come
5 1. Including share of JVs
Market conditions supportive - Rents to grow
Investment portfolio primed - Capture rental growth
Exceptional development programme - Material surpluses
Entrepreneurial selling & buying - Surpluses & replenish pipeline
Financial strength - Exploit opportunity
Agenda
Introduction Toby Courtauld, Chief Executive
Financial Results Nick Sanderson
Finance Director
Market Toby Courtauld, Chief Executive
Disposals & Acquisitions
Asset Management Neil Thompson, Portfolio Director
Development
Outlook Toby Courtauld, Chief Executive
6

Balance Sheet Sept 13 March 13 Change
Portfolio value1 £2,500m £2,387m 6.7%3
Adjusted NAV per share2 487p 446p 9.2%
Adjusted NNNAV per share2 476p 434p 9.7%
Loan-to-property value 28.7%4 32.7% (4.0pps)
Income Statement Sept 13 Sept 12 Change (%)
Adjusted PBT £18.1m £8.9m 103.4%
Adjusted EPS2 5.3p 2.9p 82.8%
Dividend per share 3.4p 3.3p 3.0%
4. Pro Forma for deferred consideration due on 100 Bishopsgate, EC2 selldown and
announced property sales which had not completed at period end (including creation of The GHS Limited Partnership)
Financial Highlights
1. Including share of JVs 2. On a diluted basis 3. Like-for-like change 7
9.2%
446
22
6
15 1 5
-5 -3
487
400
410
420
430
440
450
460
470
480
490
500
March-13 Wholly-ownedproperties
Joint ventureproperties
Developmentproperties
Profit ondisposal
Adjusted EPS Final Dividend Other Sep-13
Pence
Adjusted NAV per share1 Movement since 31 Mar 2013
8 1. In accordance with EPRA guidance and adjusted to reflect £150m convertible bond at nominal value
Revaluations
6
New Fetter Lane, EC4

103%
Adjusted Profit Before Tax1 6 months to Sept 2013
9 1. In accordance with EPRA guidance and adjusted to remove fair value movement of £150m convertible bond and the associated one-off issue costs
Six months to
Sep 12 Rental income
Joint Venture
profits Property costs Admin costs Net interest
Six months to
Sept 13
£m
8.9
8.3
1.4
-1.4
0.2 0.7
18.1
0
2
4
6
8
10
12
14
16
18
20
Six months to Mar 13Rental and joint venture fee incomeJoint Venture profits Property costs Admin costs Net interest Six months to Sept 13
4.0 4.0
3.6
3.2
3.0
3.5
4.0
Jan-10 Jan-11 Jan-12 Jan-13Sep 10 Sep 11 Sep 12 Sep 13
Debt Financing
Record low cost and diversified sources1
1. Drawn debt, JV shown at GPE share 2. Weighted average interest rate (including share of JV debt) at balance sheet date (excluding costs)
• £150m convertible bond issued Sept 2013
- 5 year term, flexible settlement options
- Annual fixed coupon of 1.0%
- Conversion price of £7.15
• £1.2bn of debt financing since summer 2010
Decreasing Group interest rate2 (%)
Group bank
Debenture
JV Bank
JV non-bank
USPP
Convertible
Sept 2013
10
Sept 2010
33% unsecured
32% non-bank
72% unsecured
69% non-bank

0
5
10
15
20
25
30
35
40
45
50
Sep-10 Sep-11 Sep-12 Sep-13 Pro Forma
Access to new property Risk sharing Bank work out
Joint Venture Business Contribution to Group
11
% of net assets held in JV
£144.3m
£101.0m
£70.7m
£100.7m
£45.4m
Total £462.1m
As % of
Group net assets 27.7%
1
Pro forma net assets held in JV
1. Pro forma for creation of The GHS Limited Partnership
Pro Forma1 Sept 2013 March 2013
Net debt excluding JVs (£m) 589.1 782.7 658.9
Net gearing 35.2% 46.9% 42.8%
Total net debt including 50% JV (£m) 691.0 884.6 761.1
Loan-to-property value 28.7% 35.4% 32.7%
Interest cover2 2.8x 2.4x
Weighted average cost of debt3 3.7% 4.3%
% of debt fixed / hedged 78% 71%
Cash & undrawn facilities £503m £310m £282m
1. Pro forma for deferred consideration due on 100 Bishopsgate, EC2 selldown and announced property sales which had not completed at period end
(including creation of The GHS Limited Partnership) 12
2. Calculated in accordance with unsecured debt covenants 3. For the period (including costs)
Debt Analysis Strong financing metrics

26.9 37.4 15.1
24.0
77.8
177.7
60.4
2.8 0
50
100
150
200
250
300
Near Term (Uncommitted)
Committed2 £79.4m
£342.7m
Total £422.1m
Near Term £m
Rathbone Place 243.5
73/89 Oxford St 50.7
St Lawrence House 32.0
St James’s St 13.2
48/50 Broadwick St 3.3
342.7
6 months to
Mar-14
Year to
Mar-15
Year to
Mar-16
Year to
Mar-17
Year to
Mar-18
Capex1 Forecast Committed and Near Term schemes
£m
13 1 Projected Capital Expenditure excludes sales / marketing expenses, void costs and interest, including share of JVs 2. Includes capex to come at recently completed schemes 3. Excludes development surpluses to come and potential sales receipts 4. Based on CBRE estimates at 30 Sept 2013
Additional rent roll4 £47.8m
Residential receipts4 c.£250m
Pro forma LTV <40%3
Key Financial Messages
• Sustained growth in portfolio and NAV per share
- Development and leasing successes continue to drive values
• Significantly increased EPS in line with our activities and expectations
- Full dividend cover anticipated for current financial year
• Record low cost of debt and further diversification of funding sources
- Well-timed financing activity and strategy of consistently low leverage
• Joint ventures continue to enhance shareholder value
- Risk sharing, profit crystallisation, capital recycling and quality relationships
• Strong financial position and positive outlook
- Firepower to deliver development programme
14

Agenda
Introduction Toby Courtauld, Chief Executive
Financial Results Nick Sanderson, Finance Director
Market Toby Courtauld, Chief Executive
Disposals & Acquisitions
Asset Management Neil Thompson, Portfolio Director
Development
Outlook Toby Courtauld, Chief Executive
15
Occupational market: More growth in rents
London’s
economy
- Strengthening further, outperforming UK
- Sharp increase in business confidence
- Jobs being created
Demand - Take-up increasing
- West End pre-lets at record level
Supply - Remains tight
Investment market: Competitive, but yields stable
Supply - Down since May
Demand - Up since May
Yields
Prime
Secondary
London Market Main messages
16
Office Rents
Near term Selective growth
Medium term Healthy growth
Strong returns: Repositioning & rental growth

-6.0%
-5.0%
-4.0%
-3.0%
-2.0%
-1.0%
0.0%
1.0%
2.0%
3.0%
4.0%
5.0%
1 3 5 7 9 11
London UK
2008 2010 2012 2014 2016 2018
London outperforming Businesses growing
17
40
45
50
55
60
65
70
Jan-07 Jan-08 Jan-09 Jan-10 Jan-11 Jan-12 Jan-13
London Business Activity2
2. Source: PMI London Report
40
45
50
55
60
65
Jan-07 Jan-08 Jan-09 Jan-10 Jan-11 Jan-12 Jan-13
50% = growth point
London New Orders2
50% = growth point
GDP1 (2008-2018)
Forecast
1. Source: ONS / PMA
0%
10%
20%
30%
40%
0
2
4
6
8
20
06
…
20
07
…
20
08
…
20
09
…
20
10
…
20
11
…
20
12
…
20
13
…
0%
10%
20%
30%
0
2
4
6
20
06
20
07
20
08
20
09
20
10
20
11
20
12
20
13
Annual Take up (LHS) Pre-let as % of total
Take Up Increasing: Pre-lets London Employment Supportive
1. Source: Lloyds TSB PMI
West End2
City3
18 2. Source: CBRE (including Kings Cross and west Southbank) 3. Source: CBRE (Including east Southbank)
35
40
45
50
55
Dec-08 Jun-10 Dec-11 Jun-13
London Economy: Jobs1
Growth point Nov 2012
Nov 2012
GPE pre-lets since 2009 - £33.4m pa rent4
4. 100%. GPE share £27.5m
Professional
Services 58%
TMT 29%
Retailers 5%
Financial Services 8% Bird & Bird
Boodle Hatfield
Lane, Clark &
Peacock
Savills Double Negative
UBM
Bridgepoint Advisers
Kurt Geiger
m sq ft
m sq ft

0
2
4
6
8
10
12
14
16
20
03
20
04
20
05
20
06
20
07
20
08
20
09
20
10
20
11
20
12
20
13
20
14
20
15
20
16
20
17
Tight Supply remains supportive Development Completions
Central London Office Potential Completions1, Million sq ft
Source: CBRE / GPE 1. Excluding pre-lets 2. Includes W1 & SW1 postcodes 3. Source: GPE 19
0.0
2.0
4.0
6.0
2013 2014 2015 2016 2017
Completed
GPE projections
West End
Core Grade A vacancy rates
May 13 Sep 13
City 4.3% 3.1%
West End 2.4% 1.7%
Change in forecast
since May 20133 +2%
-34%
-12%
-6%
+25% +27%
West End Core2 = 3.2m sq ft / 5.5% of total stock
in WE Core c.1% pa
20
40
60
80
100
120
2006 2008 2010 2012 2014 2016 2018
0
10
20
30
40
50
60
2001 2003 2005 2007 2009 2011 2013 2015 2017
City West End
& Rental Forecasts
Market Balance
Source: PMA / GPE
Office Market Balance (months supply)
Rental Equilibrium
GPE current office rent passing
£41.80 per sq ft
Forecasts
Headline rents (£ per sq ft)
PMA Prime West End
PMA Prime City
Agent Survey
2018 rent psf
Source: PMA / GPE / JLL / KF / CBRE / DTZ
Forecasts
20
Rent rising
Rent falling

0
100
200
300
400
500
600
19
66
19
72
19
78
19
84
19
90
19
96
20
02
20
08
Particularly to international capital
-8
-6
-4
-2
0
2
4
6
19
82
19
85
19
88
19
91
19
94
19
97
20
00
20
03
20
06
20
09
20
12
Nominal Yield Gap
Real Yield Gap
London Remains Attractive
21
Prime West End Yields vs. Bonds (%)1
1. Source: PMA 2. 2013 Year End projections
Prime Real Capital Values (£ psf)
West End
City
20
13
2
20
13
30
50
70
90
2007 2008 2009 2010 2011 2012 2013
Capital value index, Q2 2007 – Q3 2013, June 2007 = 100
West End 100
£:9%
Fall
from
peak
SGD:40%
USD:27% €:27%
MYR:31%
Value in
GBP £ € $ Malaysian Ringgit Singapore $
Source: Knight Frank
0.0
0.5
1.0
1.5
2.0
2.5
3.0
Nov 2012 May 2013 Nov 2013
>£100m
£25m-£100m
<£25m
May
2013
Sep
2013
%
change
Equity
Demand1 £22.5bn £25.0bn +11%
More Investment Demand than Supply
22 1. Source: CBRE
London Equity Demand and Asset Supply West End Property on the Market (£bn)
Asset Supply2
City £1.8bn £1.2bn -33%
West End £0.8bn £1.1bn +38%
£2.6bn £2.3bn -12%
Value Band
2. Source: GPE. Net of assets withdrawn and under offer
Demand
Multiple
8.7x 10.9x

Agenda
Introduction Toby Courtauld, Chief Executive
Financial Results Nick Sanderson, Finance Director
Market Toby Courtauld, Chief Executive
Disposals & Acquisitions
Asset Management Neil Thompson, Portfolio Director
Development
Outlook Toby Courtauld, Chief Executive
23
Disposals
Hanover Square, Joint Venture
Since March 2013
‒ £214.5m1, 3 deals
‒ 7.1%1 > March 2013 BV
‒ 2.4%1 NIY
‒ £905psf1 Capital Value
90 Queen Street, EC4
‒ £61m
‒ 1.7% > March 2013 BV
‒ NIY 5.4%
‒ £891 psf Capital Value
‒ Deferred completion to Dec 2013
‒ 13% pa ungeared IRR since purchase
Park Crescent West, W1
‒ £105m (GPE share £52.5m)
‒ 8.6% > March 2013 BV
‒ NIY c.2%
‒ £813 psf cap val
‒ Last GCP asset
24 1. GPE share

GHS Partnership A new JV for Hanover Square
New 50:50 JV
– Own & develop Hanover Square Estate
– GPE asset & development manager
– Transfer price £202m
Why Now?
– Pricing
– Crystallise efforts
– Reduce our risk
– HKMA: World-class partner
Next Steps
– Detailed design
– Land buy back c.2016
– On-site c.2016
25
West End Acquisition History
Since Aug 2009
– £1.2bn invested
– £847m West End
Since Nov 2012
‒ £202m invested
‒ 1.5x placing capital
Overall
‒ 3.7x total equity capital raised
‒ 53% of today’s portfolio acquired
‒ Blended ungeared IRR of 16.1%pa 26
Acquisitions since Aug 2009
East Oxford Street

50
100
Office Retail Residential
Prime West End East End Oxford Street
East Oxford Street, W1
Discount to Prime West End Rent
£1003
£67.50
33%
£8003
£450
44%
£3,5003
£1,800
49%
31.6
108.3
2013 2026
Tottenham Court Road Station Million passengers pa
1. Source: TfL, ARUP 2. Year to August
%age of prime
Rathbone Place
Oxford
House
73/89
Oxford St
27
2 2
1
x3.4
3. CBRE
Acquisitions Oxford House, 76 Oxford Street, W1
˗ £90m
˗ 3.5% NIY; 6% post refurb
˗ Office rent passing £26 psf
˗ Retail rent passing £238 ZA
Short Term
˗ WAULT < 1 year
˗ Work the income
˗ Refurbishment
Medium Term
˗ Post completion of Rathbone Place
& Crossrail opening
˗ Redevelopment
28
20
100
Office RetailAvg Prime West End Oxford House
£1001
£26
74%
£8001
£238
70%
1. CBRE
Agenda
Introduction Toby Courtauld, Chief Executive
Financial Results Nick Sanderson, Finance Director
Market Toby Courtauld, Chief Executive
Disposals & Acquisitions
Asset Management Neil Thompson, Portfolio Director
Development Update
Outlook Toby Courtauld, Chief Executive
29
6.3
3.7 3.7 2.7 3.2 3.3
2.4 2.3
4.4
0
2
4
6
Sep09
Mar10
Sep10
Mar11
Sep11
Mar12
Sep12
Mar13
Sep13
£67m £72m £80m £95m £94m
-
20
40
60
80
100
0%
5%
10%
15%
20%
Sep 11 Mar 12 Sep 12 Mar 13 Sep 13
Millio
ns
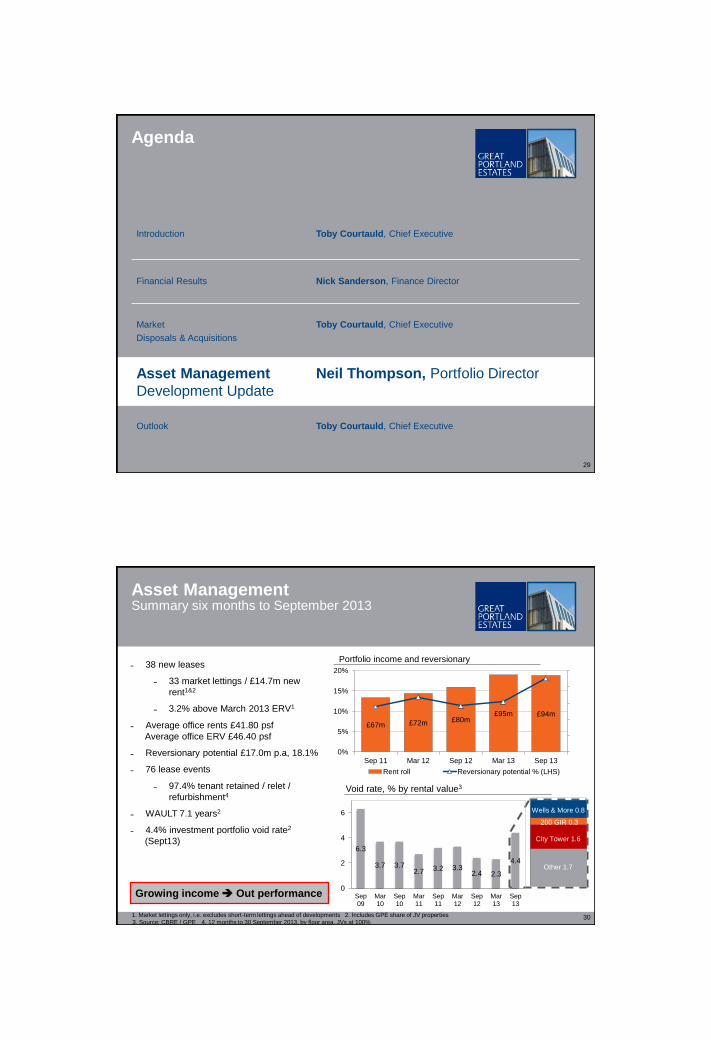
Portfolio income and reversionary
Rent roll Reversionary potential % (LHS)
Growing income Out performance
Asset Management Summary six months to September 2013
30
˗ 38 new leases
˗ 33 market lettings / £14.7m new
rent1&2
˗ 3.2% above March 2013 ERV1
˗ Average office rents £41.80 psf
Average office ERV £46.40 psf
˗ Reversionary potential £17.0m p.a, 18.1%
˗ 76 lease events
˗ 97.4% tenant retained / relet /
refurbishment4
˗ WAULT 7.1 years2
˗ 4.4% investment portfolio void rate2
(Sept13)
1. Market lettings only, i.e. excludes short-term lettings ahead of developments 2. Includes GPE share of JV properties
3. Source: CBRE / GPE 4. 12 months to 30 September 2013, by floor area. JVs at 100%
Wells & More 0.8
Void rate, % by rental value3
Other 1.7
City Tower 1.6
200 GIR 0.3

Asset Management 200 Gray’s Inn Road, WC11
– 246,109 sq ft office building
– Acquired 2011, £455 psf
- beneath replacement cost
– ITN and ITV occupy space 76%
– Low passing building rent £29.32 psf
– WAULT 5.8 years
– Major opportunity for income growth
– 29,000 sq ft refurbished
– Tech and media market
– £46 psf ERV Sept 2013
(£35 previous rent)
– 9,000 sq ft under offer
31 31
Redefining the building for income growth
1. Excluding 214 Gray’s Inn Road
Agenda
Introduction Toby Courtauld, Chief Executive
Financial Results Nick Sanderson, Finance Director
Market Toby Courtauld, Chief Executive
Disposals & Acquisitions
Asset Management Neil Thompson, Portfolio Director
Development Update
Outlook Toby Courtauld, Chief Executive
32

Property5 PC
New build
area
Sq ft
Cost
£m
Profit on
cost1
£m
Yield
on
cost2
Rent
£m
pa2 WAULT3
% Let
at PC4
184/190 Oxford St, W1 Apr 2011 26,400 28.7 9.8 SOLD SOLD SOLD 100%
Newman St, W1 (Residential) Oct 2011 24,900 26.4 2.8 SOLD SOLD SOLD -
24 Britton St, EC1 Nov 2011 51,300 19.3 10.9 8.2% 1.6 13.0 100%
160 Great Portland St, W1 May 2012 92,900 63.3 43.2 8.2% 4.8 18.6 100%
33 Margaret St, W1 Dec 2012 103,700 65.5 91.2 8.5% 7.3 19.2 97%
95 Wigmore St, W1 Jul 2013 112,300 54.3 30.4 7.5% 4.0 11.6 92%
City Tower / Skylight,
Basinghall St, EC2 Sep 2013 138,300 35.5 2.9 5.9% 3.1 1.6 24%
549,800 293.0 191.22 6.7% 20.8 15.2
Development Scheme Review Completions since May 2009
33 1. Based on CBRE September 2013 valuation where held or sold 2. Rent / yield on costs for assets held only 3. WAULT based on office rents
4. Based on ERV of property 5. JV properties include 100% of area
Continued strong performance
67%
Completed Project 95 Wigmore St, W1
34
- Prime 112,300 sq ft retail and office
building
- Development Sept 2010 – July 2013
- Offices (100% let)
- Rent £84.50 psf average
- WAULT 11.6 years
- Sept 13 ERV £88psf
- Retail 31% let / under offer
- £155 ZA
- Good interest
GPE profit on cost 61.4%
Ungeared IRR 29.1%
Yield on cost 7.5%

Completed Project City Tower and Sky Light, Basinghall St, EC2
35
- Asset repositioning
- Refurbishment July 2012 – Sep 2013
- 138,300 sq ft offices
- 63% refurbished
- 37% occupied - £37.50 psf avg
- Tower
- Refurbished 60,100 sq ft (10 floors)
£46.25 psf avg
- Sky Light
- Refurbished 25,400 sq ft self-contained unit
- Avg refurbished ERV £46.25 psf
- 30,000 sq ft refurbished space let / under offer
GPE profit on cost 31.5%
Ungeared IRR 25.3%
Yield on cost 5.9%1
1. Yield based on ERV for refurbished space and passing rent
Development value £300.5m £892 psf
36
Development Committed projects
1. Areas are in sq ft and at 100%. 2. Cost to complete, GPE share. JV assets shown at 50%. 3. Agreed pre-let rent or CBRE Sep 2013 ERV, shown at 50% for JV assets 4. Based on CBRE estimate of completed value 5. By ERV
Expected profit on cost £79.5m 37%
Development yield 7.8%
Anticipated
Finish
New
building
area1
Cost2
£m
ERV3 Income
secured
£m % let5
Profit
on
cost4 £m
Office
avg £psf
Walmar House,
288/300 Regent St, W1 Jun 2014 60,300 8.8 3.8 67.25 0.3 8% 27%
240 Blackfriars Road,
SE1 (GRP) Feb 2014 236,600 13.4 5.4 48.00 3.1 57% 47%
12/14 New Fetter Lane, EC4 Sep 2015 142,500 54.3 8.3 58.25 8.3 100% 36%
Committed projects 439,400 76.5 17.5 11.7 67% 37%
47.5% of expected profit taken Sept 20136
6. Profit included in CBRE Sep 2013 Valuation
£m
Yield
+0.25% Current -0.25%
Rent
psf1
Current £68.1m £79.5m £92.0m
+£2.50 £71.5m £83.0m £95.8m
+£5.00 £74.9m £86.6m £99.5m
Profit sensitivity to shifts in yield and rent6

37
Committed Project 240 Blackfriars Road, SE1
- 57% let to date
- 236,600 sq ft prominent South Bank building
- WAULT 14.0 years
- 23,600 sq ft let to Boodle Hatfield
- £50 psf 10 years, no break
- Good tenant interest
- Completion February 2014
GPE profit on cost 47.4%
Ungeared IRR 29.4%
Yield on cost 8.5%
37
38
Committed Project Walmar House, 288/300 Regent St, W1
- Early interest in retail and office
- 60,300 sq ft West End building
- 18,800 sq ft retail
- 37,300 sq ft offices
- Only 50m from Oxford Circus
- £67.25 psf Office ERV
- £280 ZA retail ERV
- Completion Q2 2014
GPE profit on cost 27.1%
Ungeared IRR 17.7%
Yield on cost 6.5%
38

Planning Status New build area (sq ft) Start Ownership
Near Term
Rathbone Place, W1 Consented 414,000 2014 100%
48/50 Broadwick St, W1 Consented 6,500 2014 100%
St Lawrence House, 26/34 Broadwick St, W1 Application 94,000 2014 100%
73/89 Oxford St and 1 Dean St, W1 Consented 88,100 2015 100%
20 St James’s St, SW1 Consented 56,600 2015 100%
Pipeline
Tasman House, 59/63 Wells St, W1 Design 37,800 2014 100%
84/86 Great Portland St, W1 Design 15,100 2014 100%
Mortimer House, Mortimer St & 39/41 Wells St, W1 Design 25,000 2015 100%
78/82 Great Portland St, W1 Application 18,700 2015 100%
52/54 Broadwick St & 10/16 Dufours Place, W1 Design 47,000 2016 100%
90/92 Great Portland St, W1 Consented 8,400 2015 100%
Kingsland/Carrington House, 122/130 Regent Street, W1 Design 51,400 2015 100%
148 Old Street, EC1 Design 111,700 2015 GRP
Oxford House, 76 Oxford Street, W1 Consented 85,000 2016 100%
Hanover Square, W1 Consented 208,000 2016 GHS
103/113 Regent Street, W1 Design 65,000 2016+ GRP
35 Portman Square, W1 Design 73,000 2021 100%
40/48 Broadway & 1/11 Carteret St, SW1 Consented 82,100 2022 GVP
Jermyn St Estate, SW1 Design 132,400 2022 100%
French Railways House & 50 Jermyn St, SW1 Design 75,000 2022 100%
Mount Royal, 508/540 Oxford St, W1 Design 92,100 2022 GVP
Minerva House, 5 Montague Close, SE1 Design 120,000 2022 100%
1,906,900
Development Near Term and Pipeline
39
1,675,200 – 88% West End
55% Planning permission / applications
Near Term Project Rathbone Place, W1
40

Near Term Project Rathbone Place, W1
41
– Excellent progress
– Purchase Sep 2011 £120m
(£289 psf)
– Delivery milestones
– VP achieved
– Enabling works commenced
– Planning consent achieved
– 414,000 sq ft
(+8% RMG application)
– 217,000 sq ft offices,
34,000 sq ft floorplate
– 155,000 sq ft residential,
162 units
– 42,000 sq ft retail, 58% A3
– New public square
Near Term Project Rathbone Place, W1
42
Next Steps
– Continue design progress
– Construction procurement
– Potential demolition Q1 2014
– Third party deals on-going
– Potential off-plan residential sales
– Anticipated completion Q3 2016
– Major benefit from Crossrail / GPE projects
– £64 psf office ERV
– £1,800 psf residential value

Near Term Project 73/89 Oxford St & 1 Dean St, W1
– Planning consent achieved
– 88,100 sq ft
– 33,500 sq ft retail
– 54,600 sq ft office
– Next to Crossrail station
– High demand for retail
– Flexible space
– Opportunity to pre-let
– Development
Q1 2015 – Q2 2017
43
Near Term Project St Lawrence House, 26/34 Broadwick St, W1
– Planning application submitted
– 94,000 sq ft (+56%)
– Offices 83,000 sq ft
– Retail / restaurant 11,000 sq ft
– Low supply Soho Market
– £36.50 psf passing rent £64.00 psf office ERV
– Valuation space on planning
– Development Q2 2014 – Q4 2015
Existing
Proposed
44

Committed 12%
Near Term 12%
Pipeline 27%
Investment property
49%
Completed
Developments 20%
Development Summary
45
Total portfolio 3.61m sq ft – Completed projects
– 67% profit on cost
– Leasing strategy delivering results
– Committed projects
– 67% pre-let
– 37% profit on cost
– Pre-letting has continued
– Joint ventures / forward selling
– Valuable planning permissions
– Exceptional programme
Significant shareholder value to come
Development
Programme
51%
Agenda
Introduction Toby Courtauld, Chief Executive
Financial Results Nick Sanderson, Finance Director
Market Toby Courtauld, Chief Executive
Portfolio
Disposals & Acquisitions
Asset Management Neil Thompson, Portfolio Director
Development
Outlook Toby Courtauld, Chief Executive
46

Crystallising the Opportunity
Strategy: Consistent and clear
- Repositioning: Off low rents & low capital values
- Central London only: West End bias (82% today)
- Recycling: Crystallise profits, replenish pipeline
- Read the cycle:
- Bought 53% of portfolio @ opportune pricing
- Position Group for maximum advantage
47
Markets supporting Strategy
- Supply to remain tight
- Demand for GPE space is strong
- Investment market competitive
- Pricing support, yields stable
Portfolio primed for further growth
˗ Reversions to capture: beating ERVs
˗ Asset management to exploit: ERVs higher
˗ Near term development profits
˗ Exceptional pipeline
˗ Total programme covers 51% of portfolio
- 88% in West End
£182m 10%
£423m 23%
£1,219m 67%
Sept 2011
Crystallising the Opportunity Portfolio split by Value
48 1. Net valuation surplus post capex, including profit on sale
£172m 7%
£347m 14%
£1,980m 79%
Sept 2013
Investment portfolio
Development on-site
Land
Performance
+26%
+£142m1
£514m 21%
£101m 4%
£1,794m 75%
If we commit to Near Term schemes

Outlook
Strategy is delivering results
- Continue to beat IPD
Portfolio positioning excellent
Growth opportunity is material
Rents and capital values to rise
Financial strength
Confident outlook
49
Interim Results Presentation 2013

Disclaimer
This presentation contains certain forward-looking statements. By their nature, forward-looking statements
involve risk and uncertainty because they relate to future events and circumstances. Actual outcomes and
results may differ materially from any outcomes or results expressed or implied by such forward-looking
statements.
Any forward-looking statements made by or on behalf of Great Portland Estates plc (“GPE”) speak only as of
the date they are made and no representation or warranty is given in relation to them, including as to their
completeness or accuracy or the basis on which they were prepared. GPE does not undertake to update
forward-looking statements to reflect any changes in GPE’s expectations with regard thereto or any changes
in events, conditions or circumstances on which any such statement is based.
Information contained in this presentation relating to the Company or its share price, or the yield on its
shares, should not be relied upon as an indicator of future performance.
51
Balance Sheet Proportionally Consolidated for Joint Ventures
30 September 2013
£m Group JVs Total March 13
Investment property 2,022.6 476.9 2,499.5 2,328.7
Other assets 123.8 3.0 126.8 71.5
Net debt1 (782.7) (101.9) (884.6) (761.1)
Other liabilities (57.2) (16.2) (73.4) (101.4)
Net assets 1,306.5 361.8 1,668.3 1,537.7
Adjusted net assets per
share2 382p’ 105p’ 487p 446p
52 1. Excludes fair value element of convertible bond 2. On a diluted basis

Income Statement Proportionally Consolidated for Joint Ventures
53
£m, 30 September 2013 Group JVs Total September 12
Rental income 34.9 10.0 44.9 37.1
Fees from Joint Ventures 3.7 - 3.7 3.8
Property and Administration costs (16.1) (1.3) (17.4) (16.6)
Finance costs (29.3) (2.7) (32.0) (27.2)
(Loss) / profit before surplus on investment property (6.8) 6.0 (0.8) (2.9)
Surplus on investment property 113.3 34.4 147.7 79.6
Reported profit before tax 106.5 40.4 146.9 76.7
Adjusted PBT
(Loss) / profit before surplus on investment property (6.8) 6.0 (0.8) (2.9)
Remove: fair value movement on derivatives 17.2 (1.6) 15.6 11.8
Remove: convertible bond issue costs 3.3 - 3.3 -
13.7 4.4 18.1 8.9
Tenant Delinquencies Six month periods
0
2
4
6
8
10
H2 2010/11 H1 2011/12 H2 2011/12 H1 2012/13 H2 2012/13 H1 2013/14
Retail Media Professional Services
54
0.34%1
0.09%1
0.85%1
0.06%1
1. Value of delinquencies as % of Rent Roll (including 100% of JV properties)
Number of delinquencies
0.02%1
0.14%1

0
50
100
150
200
250
300
350
400
102
350
26
150 372
111
48
143
402 382
Group Revolving Bank Facilities
- Drawn
- Undrawn
JV Bank Debt
JV Non-Bank Debt
Debenture Bonds
Private Placement Notes
Convertible Bond
2013 2014 2015 2016 2017 2018 2019 2020 2021 2022 2029
Attractive debt maturity profile1
55
£m
2. JV facilities amount shown at GPE share 1. Based on drawn positions at 30 September 2013
Weighted avg maturity of drawn debt 6.3 years
(March 2013: 6.9 years)
150
94.0
141.8
0.1
0.5
5.1
3.1
2.3
3.2
8.3
3.5
15.9
2.2
3.6
90
100
110
120
130
140
150
Sep-13 Pre-Let To Let Near Term Pro Forma
27.83
St Lawrence House
Rathbone Place2
20 St James’s
8.5
11.5
240 Blackfriars Rd
City Tower
240 Blackfriars Rd
95 Wigmore St
12/14 New Fetter Lane
73/89 Oxford St
City Tower
Walmar House
Potential additional rent roll1 from Committed / Near-Term Developments
56
£m, CBRE rental estimates September 2013
Committed
1. Includes share of JVs
+50.9%
2. Commercial Space only 3. Excludes 48/50 Broadwick St, W1, as potentially residential

Convertible Bonds 2018
Key Terms
• £150m unsecured convertible bonds due 2018
• 1.0% coupon
• 35% conversion premium
• Flexible settlement – Cash, shares or a combination
of both at GPE’s discretion
57
Net Assets Earnings
£m Per share (p) £m Per share (p)
EPRA (diluted) 1,677.7 487 14.3 4.2
Remove: Fair value of convertible bond 0.5 - 0.5 0.1
Remove: Issue costs of convertible bond - - 3.3 1.0
Adjusted diluted 1,678.2 487 18.1 5.3
Accounting under IFRS
• Balance sheet
- Held as debt at fair value through profit
and loss (no bifurcation)
• Income statement
- 1.0% coupon expensed
- Fair value movement included in finance
costs
- Issue costs written off at inception
EPRA Performance Measures
Measure Sept 13 Mar 2013
EPRA net assets £1,677.7m £1,533.9m
EPRA net assets per share 487p 446p
EPRA triple net assets £1,642.5m £1,491.4m
EPRA triple net assets per share 476p 434p
Sept 13 Sept 12
EPRA earnings £14.3m £8.9m
EPRA earnings per share 4.2p 2.9p
58

0.0
0.5
1.0
1.5
2.0
2.5
Q3
20
03
Q1
20
04
Q3
20
04
Q1
20
05
Q3
20
05
Q1
20
06
Q3
20
06
Q1
20
07
Q3
20
07
Q1
20
08
Q3
20
08
Q1
20
09
Q3
20
09
Q1
20
10
Q3
20
10
Q1
20
11
Q3
20
11
Q1
20
12
Q3
20
12
Q1
20
13
Q3
20
13
Pre-let New Completed Secondhand 10-Year Average
3.4 4.9 4.9 6.3 5.0 3.8 4.2 6.3 3.8 4.1
City Take-Up
10-year average:
1.2m sq ft
Million sq ft
Source: CBRE
Annual Take-Up (m sq ft)
59
West End Take-Up
0.0
0.5
1.0
1.5
2.0
Q3
20
03
Q1
20
04
Q3
20
04
Q1
20
05
Q3
20
05
Q1
20
06
Q3
20
06
Q1
20
07
Q3
20
07
Q1
20
08
Q3
20
08
Q1
20
09
Q3
20
09
Q1
20
10
Q3
20
10
Q1
20
11
Q3
20
11
Q1
20
12
Q3
20
12
Q1
20
13
Q3
20
13
Pre-let New Completed Secondhand 10-Year Average
Source: CBRE
Million sq ft
10-year average:
1.0m sq ft
3.7 4.4 4.5 4.6 4.9 3.6 3.1 4.7 4.3 3.5
Annual Take-Up (m sq ft)
60

City Office Under Offer
0.0
0.5
1.0
1.5
2.0
Q3
20
03
Q1
20
04
Q3
20
04
Q1
20
05
Q3
20
05
Q1
20
06
Q3
20
06
Q1
20
07
Q3
20
07
Q1
20
08
Q3
20
08
Q1
20
09
Q3
20
09
Q1
20
10
Q3
20
10
Q1
20
11
Q3
20
11
Q1
20
12
Q3
20
12
Q1
20
13
Q3
20
13
Source: CBRE
10-year average:
1.1m sq ft
Million sq ft
61
West End Office Under Offer
0.0
0.2
0.4
0.6
0.8
1.0
1.2
1.4
Q1
20
02
Q3
20
02
Q1
20
03
Q3
20
03
Q1
20
04
Q3
20
04
Q1
20
05
Q3
20
05
Q1
20
06
Q3
20
06
Q1
20
07
Q3
20
07
Q1
20
08
Q3
20
08
Q1
20
09
Q3
20
09
Q1
20
10
Q3
20
10
Q1
20
11
Q3
20
11
Q1
20
12
Q3
20
12
Q1
20
13
Q3
20
13
10-year average:
0.8m sq ft
Source: CBRE
Million sq ft
62

City Active Requirements >10,000 sq ft
Change
000 sq ft
Nov
2010
May
2011
Nov
2011
May
2012
Nov
2012
May
2013
Nov
2013
12
months
1st 6
months
2nd 6
months
Professional Services 455 1,549 1,620 1,073 1,073 838 838 -22% -22% 0%
Financial Services 1,038 1,447 955 1,139 1,197 894 1,232 3% -25% 38%
Manufacturing & Corporates 42 192 181 137 67 55 175 161% -18% 218%
Miscellaneous 217 266 440 350 441 423 666 51% -4% 57%
Marketing & Media 424 42 89 133 61 71 124 103% 16% 75%
IT & Technology 210 261 206 257 234 554 422 80% 137% -24%
Government 94 94 205 259 92 25 70 -24% -73% 180%
Insurance 570 1,095 922 926 831 568 417 -50% -32% -27%
Total 3,050 4,946 4,618 4,274 3,996 3,428 3,944 -1% -14% 15%
Source: Knight Frank 63
West End Active Requirements >10,000 sq ft
Change
000 sq ft
Nov
2010
May
2011
Nov
2011
May
2012
Nov
2012
May
2013
Nov
2013
12
months
1st 6
months
2nd 6
months
Professional Services 100 100 165 100 110 156 206 87% 42% 32%
Financial Services 283 198 331 358 368 616 261 -29% 67% -58%
Manufacturing & Corporates 262 256 100 155 485 445 154 -68% -8% -65%
Miscellaneous 485 469 315 432 373 210 330 -12% -44% 57%
Marketing & Media 225 206 82 782 810 145 163 -80% -82% 12%
IT & Technology 130 218 175 95 172 276 207 20% 60% -25%
Government 422 270 84 109 64 83 130 103% 30% 57%
Total 1,907 1,717 1,252 2,031 2,382 1,930 1,451 -39% -19% -25%
Source: Knight Frank 64

Void Rate: Ready to Occupy Space
0.0
3.0
6.0
9.0
12.0
15.0
18.0
19
87
19
89
19
91
19
93
19
95
19
97
19
99
20
01
20
03
20
05
20
07
20
09
20
11
Q3
20
13
City West End
Source: CBRE
%
65
Central London Prime Yields
3.0
4.0
5.0
6.0
7.0
19
85
19
87
19
89
19
91
19
93
19
95
19
97
19
99
20
01
20
03
20
05
20
07
20
09
20
11
20
13
West End City
Central London Prime Yields (%)
66 Source: CBRE

£bn
May
2010
Nov
2010
May
2011
Nov
2011
May
2012
Nov
2012
May
2013
Nov
2013
Private 5.0 5.0 3.5 5.0 5.0 5.0 6.0 6.5
UK REITs 3.0 3.0 3.0 2.0 2.0 2.0 2.5 2.5
Sovereign 2.0 7.0 7.0 5.5 6.0 6.5 7.5 8.5
UK Funds 2.0 2.0 1.0 0.8 0.75 1.0 1.0 1.5
US Opp
Funds 2.0 3.0 4.0 3.0 4.0 4.5 4.5 4.5
German
Funds 1.5 1.5 0.5 0.5 0.75 1.5 1.0 1.5
15.5 21.5 19.0 16.8 18.5 20.5 22.5 25.0
Equity Demand
Source: CBRE 67
54%
28%
8%
4% 6%
North of Oxford Street Rest of West End Southwark
Our locations
Business mix
Portfolio overview Including share of joint ventures at 30 September 2013
68
52% 79%
21%
Portfolio characteristics
Retail Office
Tenant mix
Retailers & Leisure
28%
TMT 24%
Professional 17%
Banking & Finance
14%
Corporates 14%
Gov’t, 2 Other 1%

The Valuation Including share of Joint Ventures
Movement
%
To 30 September 2013 £m 6 months
North of Oxford St 1,041.3 5.7%
Rest of West End 691.5 5.7%
Total West End 1,732.8 5.7%
Total City, Midtown &
Southwark 307.5 2.8%
Investment Portfolio 2,040.3 5.2%
Development properties 366.8 15.8%
Properties held throughout
period 2,407.1 6.7%
Acquisitions 92.4 (1.7%)
Total Portfolio 2,499.5 6.4%
69
1.4
2.6
3.3 3.3
Q3 FY13 Q4 FY13 Q1 FY14 Q2 FY14
Quarterly Valuation Movement for Total Portfolio1
1. On a like-for-like basis
6 months to
Value
£m
30 Sept 13
£m
Change
%
3 months
%
12 months
%
North of Oxford St 1,041.3 56.0 5.7% 3.9% 11.6%
Rest of West End 691.5 37.4 5.7% 3.9% 9.9%
Total West End 1,732.8 93.4 5.7% 3.9% 10.9%
West End Office 1,284.8 58.4 4.7% 3.1% 8.4%
West End Retail 448.0 35.0 8.5% 6.2% 18.9%
City, Midtown and Southwark 307.5 8.3 2.8% 1.2% 3.8%
Investment portfolio 2,040.3 101.7 5.2% 3.5% 9.8%
Development properties 366.8 50.1 15.8% 2.2% 17.6%
Properties held throughout the period 2,407.1 151.8 6.7% 3.3% 10.9%
Acquisitions 92.4 (1.6) (1.7%) (1.7%) -
Total portfolio 2,499.5 150.2 6.4% 3.1% 10.4%
The Valuation Including share of Joint Ventures
70

The Valuation Wholly Owned
71
6 months to
Value
£m
Sept 2013
£m
Change
%
3 months
%
12 months
%
North of Oxford St 847.4 39.5 4.9% 3.8% 8.9%
Rest of West End 652.1 34.5 5.6% 3.9% 9.7%
Total West End 1,499.5 74.0 5.2% 3.9% 9.2%
City, Midtown and Southwark 168.4 7.7 4.8% 1.6% 5.1%
Investment portfolio 1,667.9 81.7 5.2% 3.6% 8.8%
Development properties 262.3 37.5 16.7% 2.3% 17.3%
Properties held throughout the period 1,930.2 119.2 6.6% 3.4% 9.9%
Acquisitions 92.4 (1.6) (1.7%) (1.7%) (1.7%)
Total portfolio 2,022.6 117.6 6.2% 3.2% 9.3%
The Valuation Joint Ventures
72
6 months to
Value
£m
Sept 2013
£m
Change
%
3 months
%
12 months
%
North of Oxford St 387.6 32.9 9.3% 4.2% 25.1%
Rest of West End 78.9 5.7 7.7% 4.4% 14.1%
Total West End 466.5 38.6 9.0% 4.2% 23.1%
City, Midtown and Southwark 278.2 1.2 0.4% 0.8% 2.3%
Investment portfolio 744.7 39.8 5.6% 2.9% 14.4%
Development properties 209.1 25.3 13.8% 2.2% 18.2%
Properties held throughout the period 953.8 65.1 7.3% 2.7% 15.2%
Acquisitions - - - - -
Total portfolio 953.8 65.1 7.3% 2.7% 15.2%

The Valuation1 ERV and Reversionary Potential
1. Including share of Joint Ventures 73
Movement in ERV Avg office
rent passing
Avg office
ERV
Total
Reversionary
Potential 6mths 3mths 12 mths
To Sept 2013 % £m % % £ per sq. ft £ per sq. ft %
North of Oxford St
Office 3.7% 1.7 1.5% 6.6% 50.80 48.10 14.9%
Retail 6.8% 0.9 4.5% 12.0% 20.1%
Rest of West End
Office 0.8% 0.2 0.6% 2.1% 37.20 50.00 29.9%
Retail 4.7% 0.5 1.4% 10.9% 20.8%
Total West End 3.6% 3.3 1.7% 6.7% 46.10 48.60 19.2%
City, Midtown and Southwark
Office 3.9% 1.1 0.5% 6.6% 32.90 42.60 13.6%
Retail -6.3% - 0.0% -3.4%
Total City, Midtown and
Southwark 3.8% 1.1 0.5% 6.5% 13.4%
Total let portfolio 3.6% 4.4 1.4% 6.7% 41.80 46.40 18.1%
-2.0% 0.0% 2.0% 4.0% 6.0% 8.0% 10.0% 12.0% 14.0%
12 months
6 months
3 months
The Valuation1 Drivers of Valuation Movement2
74 1. Including share of Joint Ventures 2. Excludes development properties
% movement
Residual Yield shift Rental value movement

The Valuation Including share of Joint Ventures
75
Initial yield Equivalent Yield
Basis point +/-
% % 3 month 6 month 12 month
North of Oxford Street
Offices 2.3% 4.8% -8 -14 -15
Retail 4.3% 5.0% 4 -2 -6
Rest of West End
Offices 2.8% 4.8% -9 -14 -18
Retail 3.2% 4.6% -11 -16 -25
Total West End 2.9% 4.8% -7 -13 -16
City, Midtown and Southwark 5.5% 5.8% -6 -40 -44
Total let Portfolio 3.2% 5.0% -7 -17 -21
1. Includes rent frees on contracted leases
/ 4.0%1
Asset Management Void rate, % by rental value1
2.9
7.9 6.3
3.7 3.7 2.7 3.2 3.3 2.4 2.3 4.4 4.0
11.0 3.1
1.7 8.8 10.0
24.4 22.4 25.4
23.4
15.5
16.3 16.4
0.0
5.0
10.0
15.0
20.0
25.0
30.0
35.0
Sep-08 Mar-09 Sep-09 Mar-10 Sep-10 Mar-11 Sep-11 Mar-12 Sep-12 Mar-13 Sep-13 ProForma
Investment Portfolio Development / refurbishment
76
% by rental value
1. Includes share of Joint Ventures

6 months to
30 Sept 2013 31 March 2013
At beginning of period £11.7m £9.0m
Asset management (£0.1m) (£0.1m)
Disposals / acquisitions £2.1m £1.3m
ERV movement £3.3m £1.5m
At end of period £17.0m £11.7m
Asset Management Movement in Reversions1
77 1. Includes share of Joint Ventures
0
50
100
150
200
250
Expiries & breaks Refurbishment / Development Retained Relet / Under offer Remaining
Asset Management Tenant retention, 12 months to September 20131
78
9%
Area (000 sq ft)
13%
75%
3%
211
1. Joint Ventures at 100%

Asset Management Expiry profile1
10% 8% 9% 10% 7%
47%
1% 6% 0% 0%
0%
1%
0%
10%
20%
30%
40%
50%
60%
2014 2015 2016 2017 2018 2019+
Investment Income Income to be developed
79
% by total rental income subject to lease expiry or break
1. Includes share of Joint Ventures
Year to March
Asset Management GPE Lettings since 20091
80
Banking and Finance, 11%
TMT, 18%
Professional, 22% Corporates, 17%
Government, 1%
Retailers, 24%
Other, 7%
1. Includes share of joint ventures

Forecast
80
90
100
110
120
2006 2007 2008 2009 2010 2011 2012 2013 2014 2015 2016 2017 2018
Development Construction Inflation
81
Average Construction Inflation1 (%, rebased to 2006)
1. Based on EC Harris, Davis Langdon and G&T London indices
Wells & More
33 Margaret Street
24 Britton St
95 Wigmore St
Walmar House
240 Blackfriars Rd
City Tower New Fetter Lane
Rathbone Place
48 Broadwick St
St Lawrence House 20 St James’ St
73/89 Oxford St
Committed Project 12/14 New Fetter Lane, EC4
˗ Pre-let to Bird & Bird
˗ 142,500 sq ft
˗ 20.25 year term, no break
˗ £8.3m pa
˗ 7 months rent free, £20.6m cash payment
(Total incentive 37 months rent equivalent)
˗ Construction contract in place
˗ Demolition started
˗ Practical completion Q3 2015 82
GPE profit on cost1 35.7%
Ungeared IRR1 20.4%
Yield on cost1 8.1%
1. Assume hand back not exercised