Embed Size (px)
Citation preview
1
Great Expectations: The Pygmalion Effect Sambit Panda
A Real World View of Applied Math and Statistics
Dr. John Taylor and Mrs. Desiré
Summer Ventures in Science and Mathematics
University of North Carolina Charlotte
GREAT EXPECTATIONS 2
Abstract
In the distant past to the present, teachers have always been providing positive
reinforcement to their students. However, do these effects actually work? How effectively does
positive reinforcement actually affect student’s performance on a test?
These questions are answered by the Pygmalion effect, a social theory that hypothesizes
that if positive reinforcement is given to someone, they will most likely perform better on tests or
other assignments. This study takes a sample size of 50 students and creates a social experiment
where the students are given two tests. After the first test, half of the students are chosen
randomly to be in the “top 25” while the other half was not told anything. All the students were
given another test again and the results were compiled to assess improvement. Those who were
“top 25” performed better on the test then those who didn’t by a very wide margin. This supports
the idea behind the Pygmalion effect and has wide educational and social applications.
GREAT EXPECTATIONS 3
Background & Research Question
For much of human history, the concept of furthering education has been a centerpiece of
civilization. To raise students understanding of topics, teachers have utilized a fairly new
phenomenon known as the Pygmalion Effect.
The Pygmalion Effect in short is the idea that if someone is told that they can do better,
they will. Consider, for example, a common classroom in which intellectually bright students as
well as those not as bright study together. The teacher, seeing greater potential in the students
who perform higher, give those students more challenging problems, work with them closer, and
give them more positive feedback. Meanwhile, those students who are not “brilliant” are
subjected to less scrutiny and are not given as much feedback by the teacher.
Research into this idea was brought into mainstream scientific literature by Robert
Rosenthal, a professor at Harvard University. In 1963, he published a paper in the American
Scientist, summarizing his results. Since then, nearly 345 studies have been conducted to support
his hypothesis (Rosenthal & Jacobson, 1980). In his project, Rosenthal, with the aid of social
scientist Lenore Jacobson, decided to investigate his theory in a public elementary that was given
the pseudonym Oak School. The school was divided into three classes for grades one through
six: fast, medium, and slow. A sample size of 370 students was taken from the school and given
IQ tests. The teachers were given a list of the top scoring students. When the test was given again
at the end of the year, the students who were deemed top scoring showed significant
improvement in scores.
However, the “top scoring students” were actually chosen at random. So, the fact that
they did better is significant to note. Rosenthal and Jacobson took the study further to not only
analyze the students, but the teachers as well. They noticed that the teachers taught the “top”
GREAT EXPECTATIONS 4
students differently, giving them more challenging problems, more thorough feedback, and more
scrutiny if they were unsure about something. This caused those students to perform significantly
higher than the other students and boosted their own overall confidence.
This study supports the bigger idea that people do what they are expected to do, a self-
fulfilling prophecy. So, the “top” students were expected to do better and therefore performed
better. It is “how one person’s expectation for another person’s behavior can quite unwittingly
become a more accurate prediction simply for its having been made” (Rosenthal & Jacobson, p.
vii, 1968).
Since 1968, numerous studies have tried to support the same conclusion. Quite recently
(2010), Kimberly K. Buryanek completed a dissertation in Iowa State University for her
doctorate in philosophy. She performed her experiment in New Horizons High School after they
decided to make a commitment to work on reform initiatives. Prior to the reform initiatives,
nearly “253 D’s and F’s were earned by high school students during the first semester and 122
D’s and F’s were earned by middle-school students during the same period” (Buryanek, p. 2,
2010). After applying the Pygmalion effect, there was a 89% decrease in grades below a C-
during the first semester.
Further studies have been done outside the country. In the Beijing Institute of
Petrochemical Technology, Jie Chang did a study on teacher expectations and student
achievement. She performed a survey mid-semester to find if students who were held in better
regard in English, which is considered a foreign language in China. She found that “teacher
motivation and teacher enthusiasm influences student motivation and student performance”
(Chang, p. 3, 2011).
GREAT EXPECTATIONS 5
From 1968 to the present, studies have been conducted, most supporting, but some unable
to find complete evidence of the effect. The effect is in wide use and used by teachers
inadvertently to teach children. TIME Magazine recently released an article that identified that
there were four specific ways teachers treated those students they had higher expectations of:
1. “They create a warmer ‘socioemotional climate’ for their learners they regard as high
potential, often conveying this warmth through non-verbal signals: a nod, an encouraging
smile, a touch on the shoulder
2. They teach more material, and more difficult material, to the learners they see as
especially promising.
3. They give up-and-coming learners more opportunities to contribute, including additional
time to respond to questions
4. They offer their ‘special’ learners feedback on performance that is more detailed and
more personalized and no just a generic ‘Good job’” (Paul, 2013)
Finally, the Pygmalion Effect is can also be extended beyond the classroom, as recent
research suggests. It has been shown that juries are more likely to say a defendant is guilty if the
judge themselves think they are guilty. Similarly, organization effectives can be increased by
raising leaders’ expectations. Therefore, this psychological phenomenon can transform not only
education, but nearly all walks of life and all professions.
This study intends to provide yet another replicate of Rosenthal’s 1968 experiment. It
will utilize Summer Ventures’ students to take an aptitude test and see if encouragement will
lead to more improvement in test scores. It will then evaluate those test scores and assess by a
hypothesis test whether encouragement in fact leads to better test scores.
GREAT EXPECTATIONS 6
Method / Results
To begin collecting data, it was necessary to choose a sample size. Due to time restraints,
while maintain a good size, a sample size of 50 was chosen. The test was 10 questions long and
had the following proportion of questions:
1. 2 Mathematics Questions (algebra, geometry, general addition and subtraction; AMC
Questions)
2. 2 English Questions (SAT sentence completion)
3. 3 Science Questions (1 from physics, chemistry, and biology; SAT subject multiple
choice)
4. 2 Social Science Questions (1 from us history and world history; SAT subject multiple
choice)
5. 1 Art Question (1 from AP Art History Exam)
Knowing that many of the students who were in different counties had a disproportionate
amount of education, it was expected to no one was to get all of the questions right. Such a wide
range of topics made it easier to separate out the truly intelligent. A time limit was also added on
the test to not only intentionally coerce students to stick with their first answer, but also to rank
students from best to worst as they performed on the test.
During the first test, attached in the appendix, the students were given no encouragement.
This test was intended to make the students think that the “top 25” among them was going to be
chosen and were to perform something special.
Students were chosen actually ordered from top rank to bottom rank in a spreadsheet.
Every other score was chosen– most of the time – leading to a higher randomized set of students.
Students who were made to think they were top 25 spread the word, bragging that they were at
GREAT EXPECTATIONS 7
the top. The “top 25” also received a review session in which the answers to the previous test
were given as well as prepping for the upcoming test. This set of students was also given positive
encouragement to do better on the next test. Meanwhile, the other set was neither prepped nor
encouraged.
After about a day of prepping, the new test was given to see if the students would
improve. The same style of test was given, with the same proportions of questions Appendix 3
shows the results of the experiment, by calculating improvement as the first score subtracted
from the second score. The first two appendices give the tests and the answers. A summary of
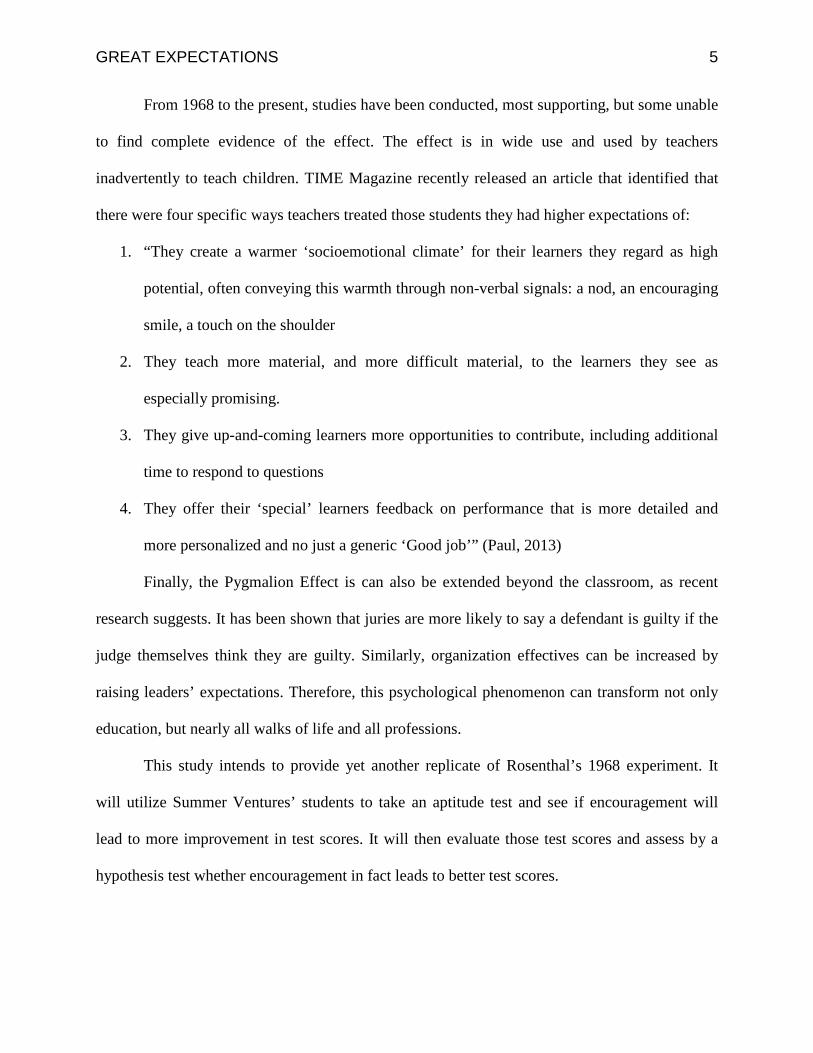
the results are shown below:
From the histogram, it is obvious that the majority of the scores (nearly 62%) of the
scores lie between 3 and 5 out of 10. Therefore, the distribution for the first test can be assumed
to be skew right. To calculate the mean of this sample distribution, the formula is
4 3
11
9
11
6 5
1 0 0
0
2
4
6
8
10
12
1 2 3 4 5 6 7 8 9 10
Freq
uenc
y
Score out of 10
Scores for Test 1
GREAT EXPECTATIONS 8
�̅� =∑𝑥𝑓∑𝑓
where 𝑥 is the sample and 𝑓 is the frequency of each. Performing the calculations,
�̅� =4 ∗ 1 + 3 ∗ 2 + 11 ∗ 3 + 9 ∗ 4 + 11 ∗ 5 + 6 ∗ 6 + 5 ∗ 7 + 1 ∗ 8 + 0 ∗ 9 + 0 ∗ 10
4 + 3 + 11 + 9 + 11 + 6 + 5 + 1 + 0 + 0= 4.26
The standard deviation of the set can be found by using the formula
𝑠 = �∑𝑥2 − (∑𝑥)2
𝑛𝑛 − 1
where 𝑠 is the standard deviation and 𝑛 is the number in the sample. Again performing the
calculations,
𝑠 = �(1 + 4 + 9 + ⋯+ 100) − (1 + 2 + 3 + ⋯+ 10)210
10 − 1= �1059 − 2132
109
= 1.75905819
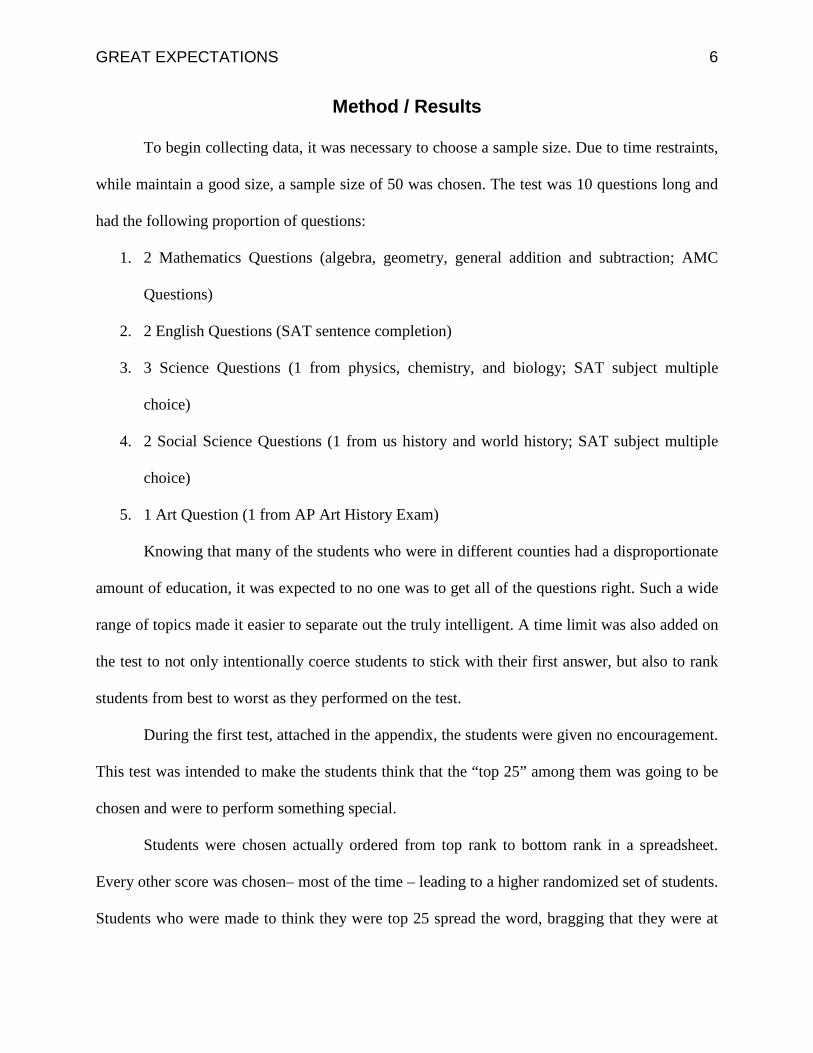
Using these two pieces of data, it is possible to create a normal distribution curve for this data, as
shown below.
.74 2.51 4.26 6.02 7.78
GREAT EXPECTATIONS 9
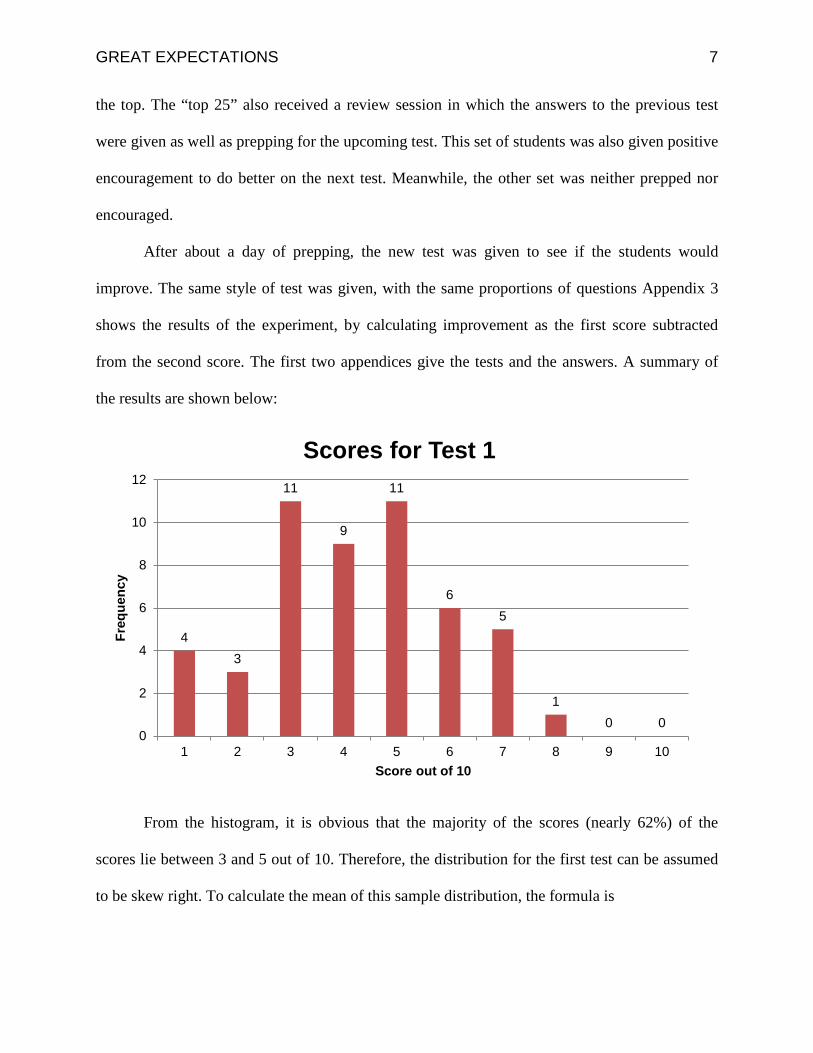
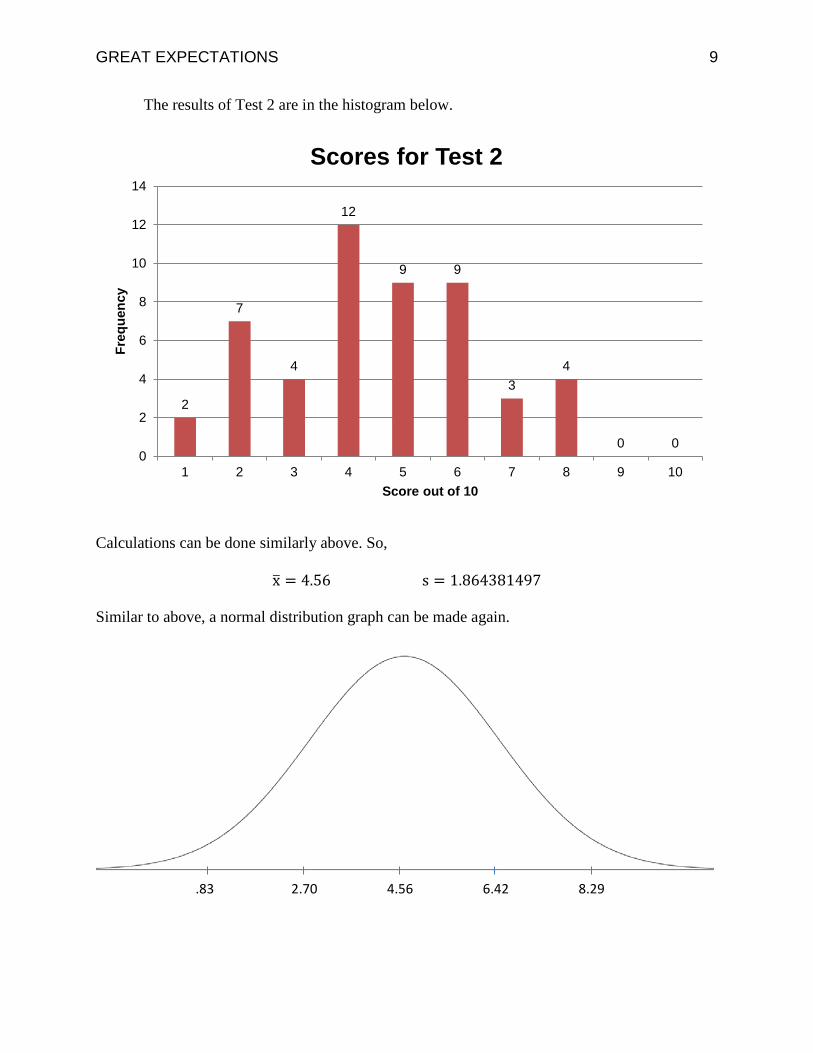
The results of Test 2 are in the histogram below.
Calculations can be done similarly above. So,
x� = 4.56 s = 1.864381497
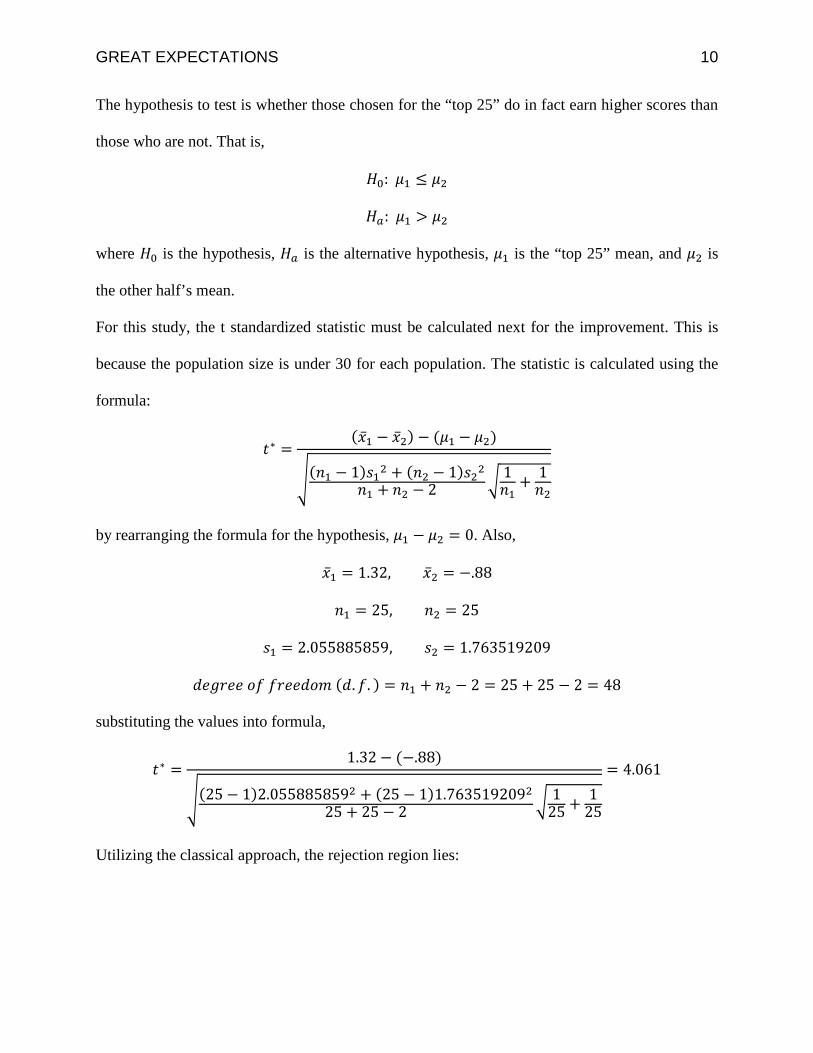
Similar to above, a normal distribution graph can be made again.
2
7
4
12
9 9
3 4
0 0 0
2
4
6
8
10
12
14
1 2 3 4 5 6 7 8 9 10
Freq
uenc
y
Score out of 10
Scores for Test 2
.83 2.70 4.56 6.42 8.29
GREAT EXPECTATIONS 10
The hypothesis to test is whether those chosen for the “top 25” do in fact earn higher scores than
those who are not. That is,
𝐻0: 𝜇1 ≤ 𝜇2
𝐻𝑎: 𝜇1 > 𝜇2
where 𝐻0 is the hypothesis, 𝐻𝑎 is the alternative hypothesis, 𝜇1 is the “top 25” mean, and 𝜇2 is
the other half’s mean.
For this study, the t standardized statistic must be calculated next for the improvement. This is
because the population size is under 30 for each population. The statistic is calculated using the
formula:
𝑡∗ =(�̅�1 − �̅�2) − (𝜇1 − 𝜇2)
�(𝑛1 − 1)𝑠12 + (𝑛2 − 1)𝑠22𝑛1 + 𝑛2 − 2 � 1
𝑛1+ 1𝑛2
by rearranging the formula for the hypothesis, 𝜇1 − 𝜇2 = 0. Also,
�̅�1 = 1.32, �̅�2 = −.88
𝑛1 = 25, 𝑛2 = 25
𝑠1 = 2.055885859, 𝑠2 = 1.763519209
𝑑𝑒𝑔𝑟𝑒𝑒 𝑜𝑓 𝑓𝑟𝑒𝑒𝑑𝑜𝑚 (𝑑.𝑓. ) = 𝑛1 + 𝑛2 − 2 = 25 + 25 − 2 = 48
substituting the values into formula,
𝑡∗ =1.32 − (−.88)
�(25 − 1)2.0558858592 + (25 − 1)1.763519209225 + 25 − 2 � 1
25 + 125
= 4.061
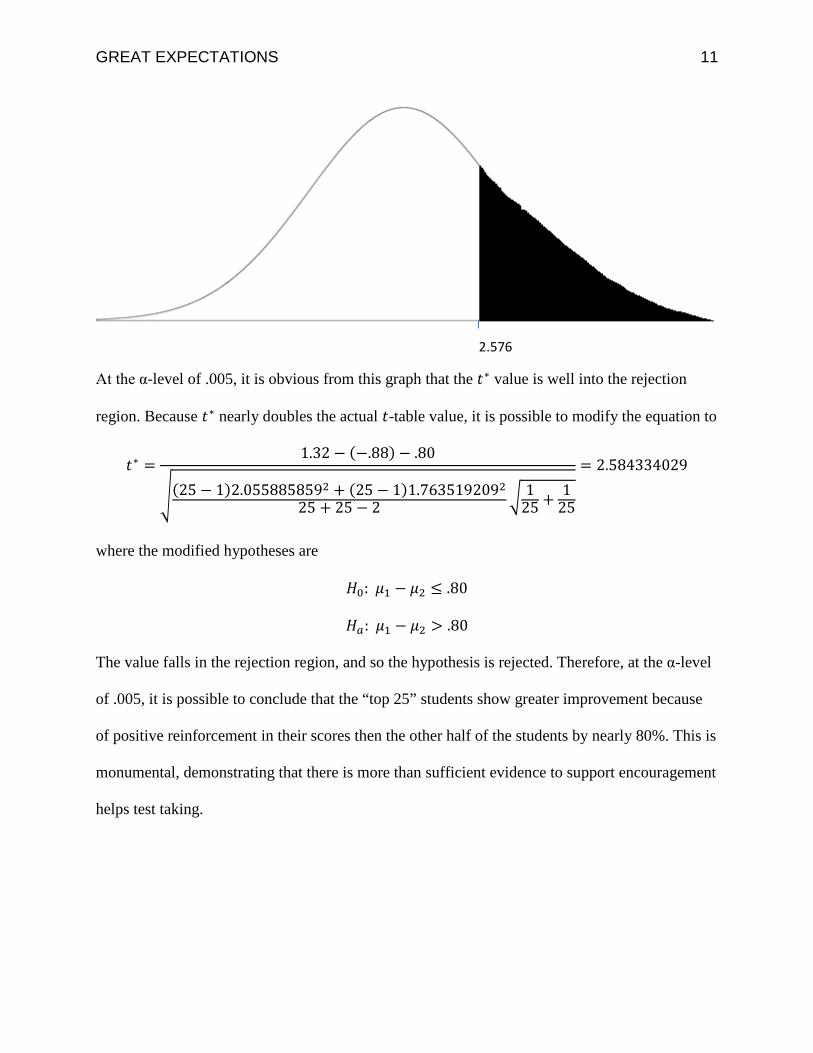
Utilizing the classical approach, the rejection region lies:
GREAT EXPECTATIONS 11
At the α-level of .005, it is obvious from this graph that the 𝑡∗ value is well into the rejection
region. Because 𝑡∗ nearly doubles the actual 𝑡-table value, it is possible to modify the equation to
𝑡∗ =1.32 − (−.88) − .80
�(25 − 1)2.0558858592 + (25 − 1)1.763519209225 + 25 − 2 � 1
25 + 125
= 2.584334029
where the modified hypotheses are
𝐻0: 𝜇1 − 𝜇2 ≤ .80
𝐻𝑎: 𝜇1 − 𝜇2 > .80
The value falls in the rejection region, and so the hypothesis is rejected. Therefore, at the α-level
of .005, it is possible to conclude that the “top 25” students show greater improvement because
of positive reinforcement in their scores then the other half of the students by nearly 80%. This is
monumental, demonstrating that there is more than sufficient evidence to support encouragement
helps test taking.
2.576
GREAT EXPECTATIONS 12
Discussion
As discussed in moderate detail in the previous section, an 80% greater improvement for
those who are “top 25” than those who are not is significant. It lends to validation of the
Pygmalion Effect and builds upon the results from 1968. It also supports the continuing teaching
of teachers to always build positively upon students. Some solutions to the problem is
dramatically smaller class sizes and more interactive student involvement. Teachers can also
give scores to students individually instead of a ranking of each student’s scores. This can cause
less negative reinforcement in the classroom.
There are not only educational applications to this study, but social ones as well. The
Pygmalion effect can be extended to the workspace and other institutions as well. For example,
offices can utilize the Pygmalion Effect to further worker productivity. Judges should be taught
to not determine a defendant’s guilt prior to a trial. Surgeons could use this to even raise nurse
productivity in the emergency room. Further studies in this field could revolutionize all walks of
life.
Of course, the study had some flaws. It tried to recreate similar testing conditions for
each student, but some complained that certain places were louder. It was necessary to have each
student to do the test separately to limit cheating, but, because it was not practical to force
students to isolate themselves, it was limited as much as possible. Also, some students were
rushed because certain events were occurring, so there might have been some guessing. Not
knowing the material was limited by providing a complete set of subjects. This is further
supported by an almost normal distribution of the data.
GREAT EXPECTATIONS 13
References
Buryanek, K. K. (2010). Impact of high-school reform initiatives using the pygmalion effect.
(Doctoral Dissertation).
Chang, J. (2011). A case study of the "pygmalion effect": Teacher expectations and student
achievement. Manuscript submitted for publication, English Department, Beijing Institute
of Petrochemical Technology, Beijing, China. , Available from ISSN. (1913-9039).
Paul, A. M. (2013, April 1). How to use the “pygmalion” effect. TIME Ideas, Retrieved from
http://ideas.time.com/2013/04/01/how-to-use-the-pygmalion-effect/
Rosenthal, R. (2010). Pygmalion effect. In I. Weiner & W. Craighead (Eds.), The Corsini
Encyclopedia of Psychology (4th ed., Vol. 3, pp. 1398-1399). Hoboken, New Jersey:
John Wiley & Sons, Inc.
Rosenthal, R., & Jacobson, L. (1968). Pygmalion in the classroom. Atlanta: Holt, Rinehart and
Winston, Inc.
Rosenthal, R., & Jacobson, L. (1980, February 18). This week's citation classic. Retrieved from
http://garfield.library.upenn.edu/classics1980/A1980JD87300001.pdf
Zimbardo, Phil. (2011). HeroicImaginationTV. [Youtube]. Retrieved 7/29/2013 from
https://www.youtube.com/watch?feature=player_embed ded&v=hTghEXKNj7g
GREAT EXPECTATIONS 14
Appendix 1: Aptitude Test 1 and Answers 1. Let 𝑋 and 𝑌 be the following sums of the arithmetic sequences:
𝑋 = 10 + 12 + 14 + ⋯+ 100
𝑌 = 12 + 14 + 16 + ⋯+ 102
What is the value of 𝑌 − 𝑋?
a. 92 b. 98 c. 100 d. 102 e. 112
2. Apparently the groom was very nervous: one moment he would be ___, rambling on to his best man about silly, meaningless things, and then abruptly he would turn ___ and could not be prompted to say anything
a. garrulous … reticent
b. grandiose … taciturn
c. vociferous … effusive
d. melodious … timorous
e. munificent … utilitarian
3. Which of the following statements best represents a nativist attitude toward the influx of immigrants around 1900?
a. Slavs and Italians will be assimilated as easily into the American way of life as were earlier immigrant groups.
b. Ellis Island should be enlarged to accommodate the huge influx of immigrants.
c. Immigrants will work for low wages and break strikes, thereby hurting all American workers.
d. Native-born Americans should organize to help find jobs and homes for new immigrants so that they can become citizens as quickly as possible.
e. Political machines in the large cities should be responsible for providing immigrants with food, shelter, and jobs in return for their votes.
4. Cosmologist Martin Rees has cautioned that our present satisfaction with the big bang explanation for the creation of the universe may reflect the ___ of the data rather than the ___ of the theory.
a. paucity … validity
b. genius … accuracy
c. relevance … scope
GREAT EXPECTATIONS 15
d. destruction … core
e. persuasiveness … reality
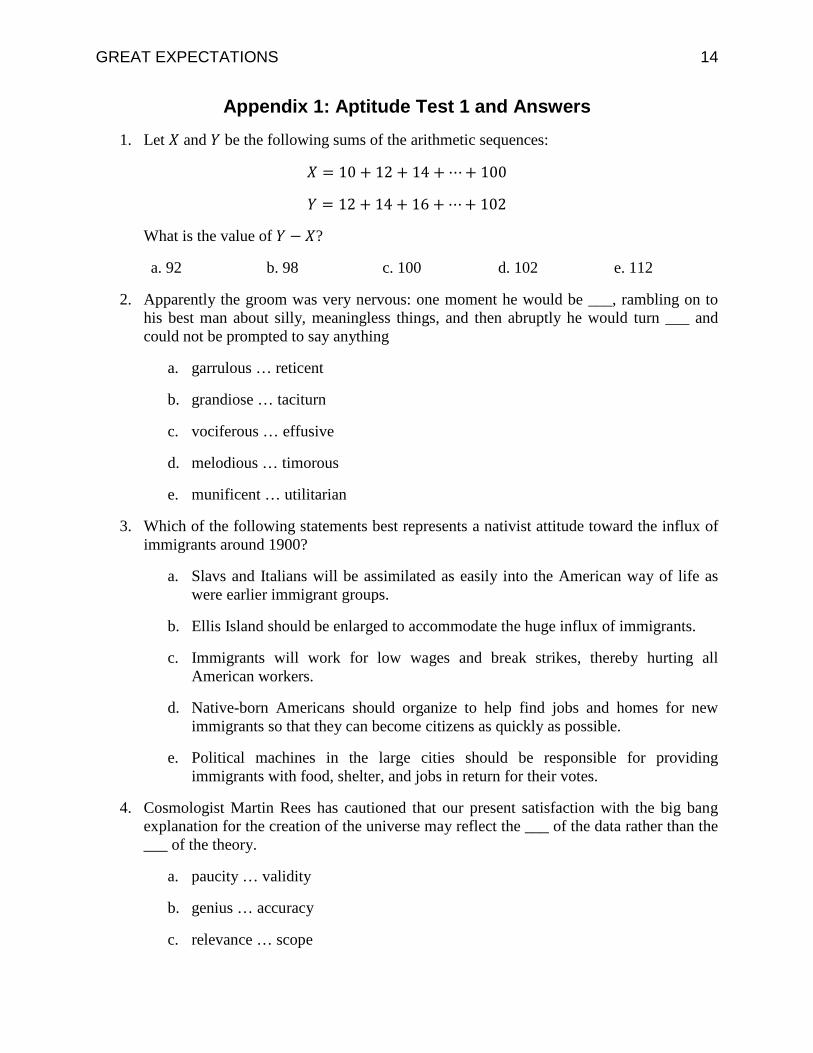
5. The 1907 painting by Picasso shown here reveals the influence of which of the following?
a. Chinese Art b. African Art c. Indian Art d. Medieval Art e. Romantic Art
6. Which of the following is true of the magnetic field produced by a current in a long, straight wire?
a. The field is uniform
b. The field increases in strength as the distance from the wire increases
c. The field lines are directed parallel to the wire, but opposite to the direction of the current
d. The field lines are directed radially outward from the wire
e. The field lines form circles about the wire
7. Which of the following was characteristic of the physical environments of early river-valley civilizations in the Near East?
a. Cool summer temperatures encouraged the production of grain crops
b. Tropical forests along the riverbanks provided the population with most of its food
c. The rivers maintained a steady flow year-round, fed by melting mountain glaciers
d. The rivers flowed through deep mountain valleys, which sheltered early civilizations
e. Rainfall was low, requiring irrigation of crops with river water
8. Which of the following most accurately reveals common ancestry among many different species of organisms?
a. The amino acid sequence of their cytochrome C
b. Their ability to synthesize hemoglobin
c. The percentage of their body weight that is fat
GREAT EXPECTATIONS 16
d. The percentage of their body surface that is used in gas exchange
e. The mechanism of their mode of locomotion
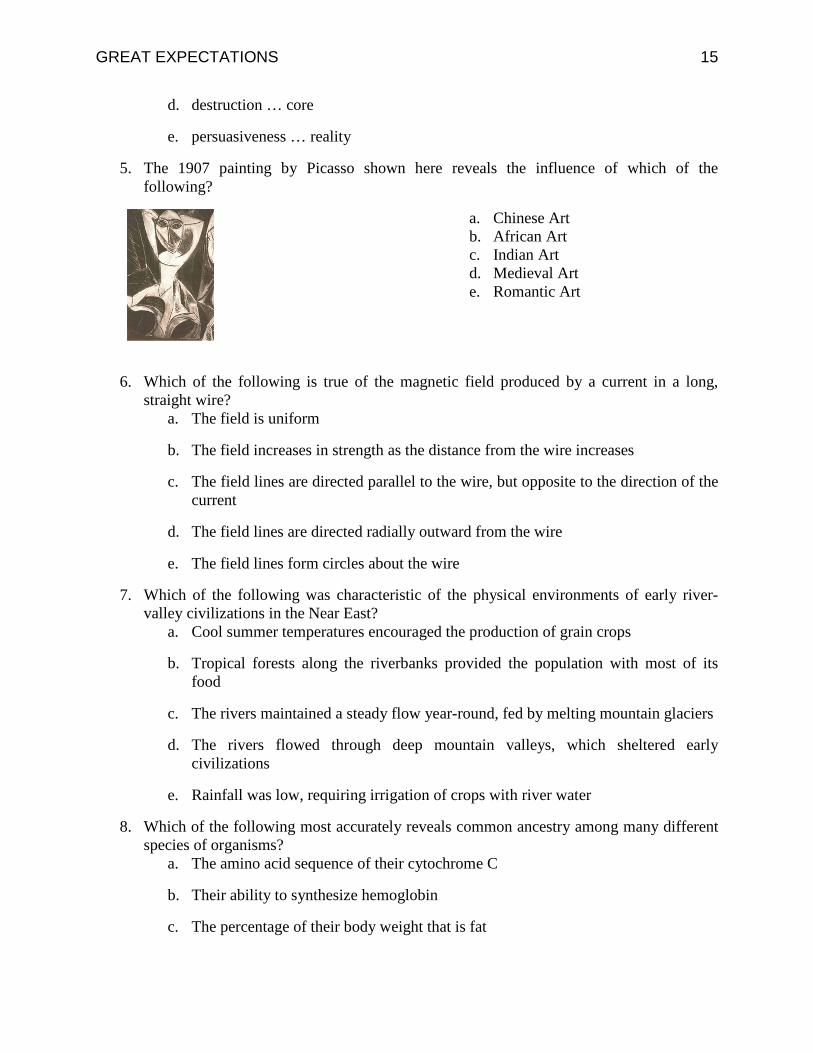
9. Square 𝐴𝐵𝐶𝐷 has side length 10. Point 𝐸 is on 𝐵𝐶����, and the area of ∆𝐴𝐵𝐸 is 40. What is 𝐵𝐸?
a. 4 b. 5 c. 6 d. 7 e. 8
10. Reaction of silver ion with chloride ion in water solution
a. Precipitation b. Oxidation-reduction
c. Distillation d. Hydration e. Condensation
Answers
1. a 2. a 3. c 4. a 5. b 6. e 7. e 8. b 9. e 10. a
GREAT EXPECTATIONS 17
Appendix 2: Aptitude Test 2 and Answers
1. What is the value of
22014 + 22012
22014 − 22012
a. −1 b. 1 c. 53 d. 2013 e. 24024
2. She found that fame was both ________ and ________; not only was it difficult to get her book published, but when she did, members of the media quickly lost interest in it.
a. destructive...counterproductive b. evanescent...gratifying c. tedious...deleterious d. elusive...ephemeral e. fulfilling...subtle
3. Which of the following was true of Black soldiers in the United States Army during the First World War?
a. Black soldiers and White soldiers served in fully integrated units b. Black soldiers served in segregated units often commanded by White officers c. Black Americans were drafted into the armed forces but were not allowed to
enlist d. Black Americans were not allowed in the armed forces, but were encouraged to
take factory jobs in war industries e. Because some Black leaders opposed the war, the government placed Black
soldiers only in noncombat positions 4. The ______ espionage plot was so sophisticated it was impossible to believe it was the
work of teenage computer hackers. a. simple b. vaporized c. byzantine d. mystical e. fusty
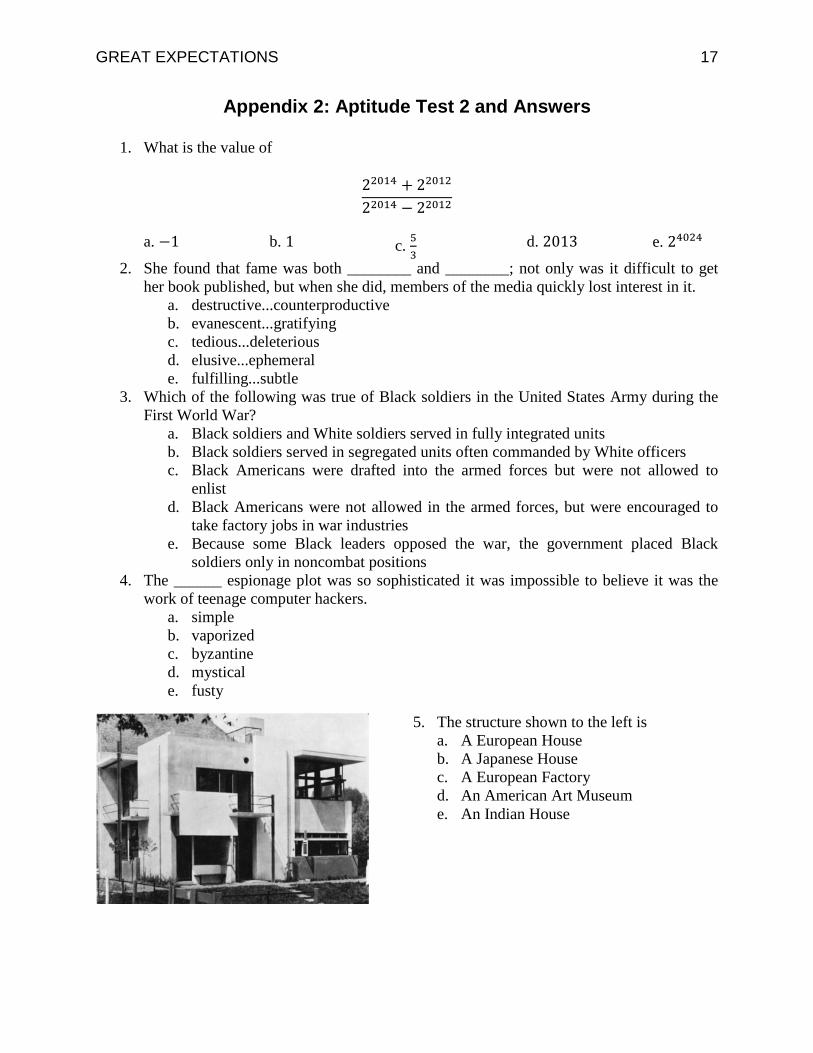
5. The structure shown to the left is a. A European House b. A Japanese House c. A European Factory d. An American Art Museum e. An Indian House
GREAT EXPECTATIONS 18
6. An object with mass 𝑚 and speed 𝑣0 directed to the right strikes a wall and rebounds with speed 𝑣0directed to the left. The change in the object's momentum is
a. 2𝑚𝑣0 directed to the left b. 𝑚𝑣0 directed to the left c. 0 d. 𝑚𝑣0 directed to the right e. 2𝑚𝑣0 directed to the right
7. The Silk Routes were important in ancient times because they a. Facilitated the exchange of goods and ideas between China and the Roman
Empire b. Allowed gold and silver mined in China to be traded for European furs and wool
cloth c. Provided trade links between the people of Siberia and the people living on
islands in the Bering Sea d. Provided a conduit for trade in silk, porcelain, and costly gems between China
and Japan e. Allowed carts and carriages to travel on paved roads across northern Asia as far
west as the Caspian Sea 8. Nitrogenous base that occurs in RNA but not in DNA
a. Deoxyribose b. Ribose c. Uracil d. Cytosine e. Thymine
9. Define 𝑥ᴥ𝑦 to be |𝑥 − 𝑦| for all real numbers 𝑥 and 𝑦. Which of the following statements is not true?
a. 𝑥ᴥ𝑦 = 𝑦ᴥ𝑥 for all 𝑥 and 𝑦 b. 2(𝑥ᴥ𝑦) = (2𝑥)ᴥ(2𝑦) for all 𝑥 and 𝑦 c. 𝑥ᴥ0 = 𝑥 for all 𝑥 d. 𝑥ᴥ𝑥 = 0 for all 𝑥 e. 𝑥ᴥ𝑦 > 0 if 𝑥 ≠ 𝑦
10. From their electron configurations, one can predict that the geometric configuration for which of the following molecules is NOT correct?
a. PF3, trigonal planar b. CF4, tetrahedral c. CHCl3, irregular tetrahedron d. OF2, bent (v-shaped) e. HF, linear
Answers
1. c 2. d 3. b 4. c 5. a 6. a
GREAT EXPECTATIONS 19
7. a 8. c 9. c 10. a
GREAT EXPECTATIONS 20
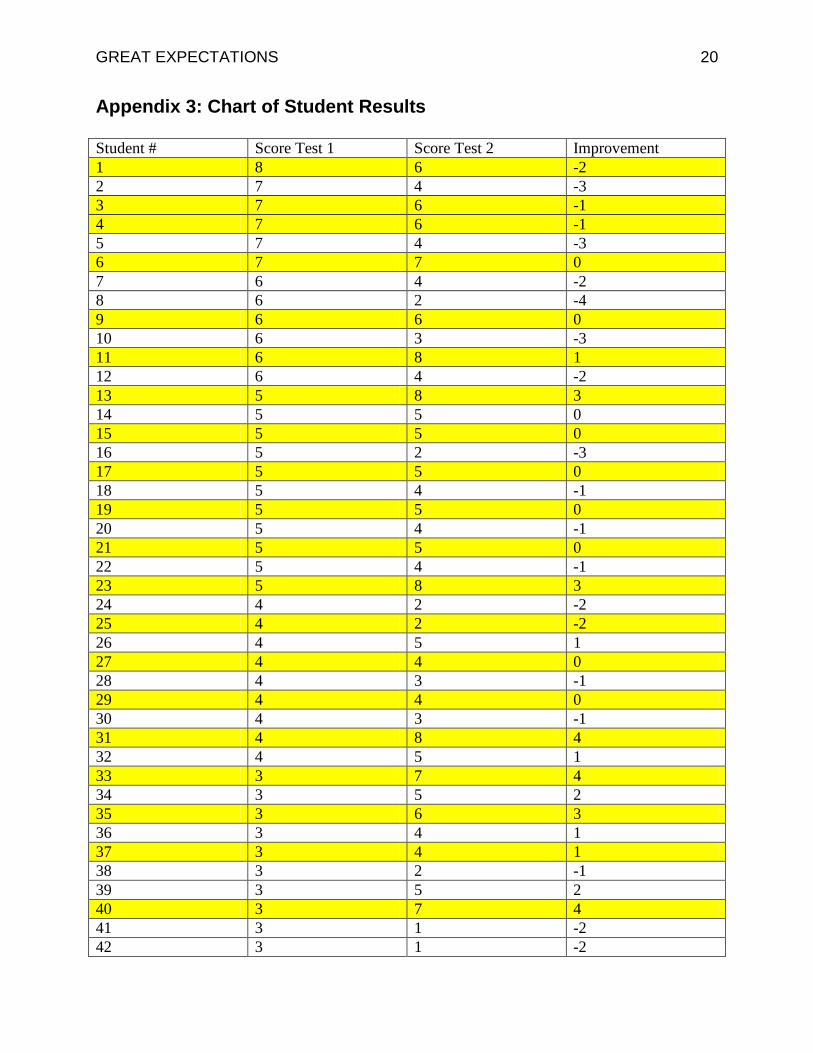
Appendix 3: Chart of Student Results
Student # Score Test 1 Score Test 2 Improvement 1 8 6 -2 2 7 4 -3 3 7 6 -1 4 7 6 -1 5 7 4 -3 6 7 7 0 7 6 4 -2 8 6 2 -4 9 6 6 0 10 6 3 -3 11 6 8 1 12 6 4 -2 13 5 8 3 14 5 5 0 15 5 5 0 16 5 2 -3 17 5 5 0 18 5 4 -1 19 5 5 0 20 5 4 -1 21 5 5 0 22 5 4 -1 23 5 8 3 24 4 2 -2 25 4 2 -2 26 4 5 1 27 4 4 0 28 4 3 -1 29 4 4 0 30 4 3 -1 31 4 8 4 32 4 5 1 33 3 7 4 34 3 5 2 35 3 6 3 36 3 4 1 37 3 4 1 38 3 2 -1 39 3 5 2 40 3 7 4 41 3 1 -2 42 3 1 -2
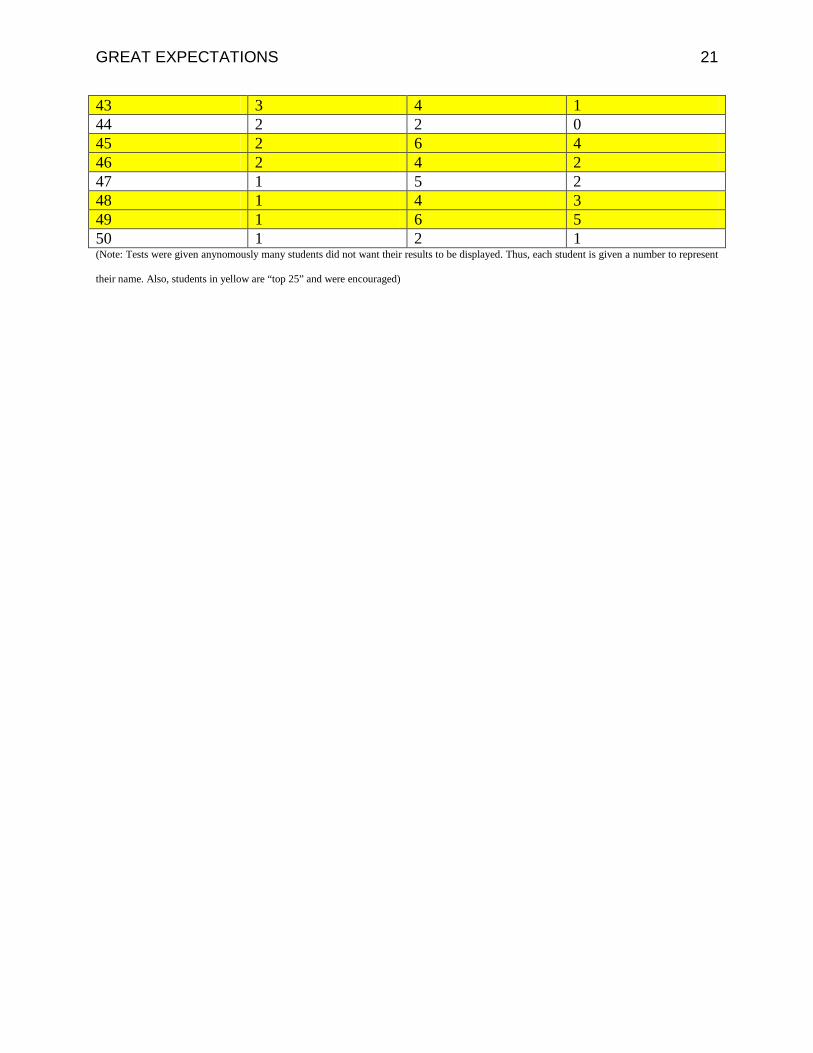
GREAT EXPECTATIONS 21
43 3 4 1 44 2 2 0 45 2 6 4 46 2 4 2 47 1 5 2 48 1 4 3 49 1 6 5 50 1 2 1 (Note: Tests were given anynomously many students did not want their results to be displayed. Thus, each student is given a number to represent
their name. Also, students in yellow are “top 25” and were encouraged)

![[George Bernard Shaw] Pygmalion (Webster's …mylanguages.at.ua/Pygmalion-George_Bernard_Shaw.pdfGeorge Bernard Shaw 3 PREFACE TO PYGMALION A PROFESSOR OF PHONETICS.% As will be seen](https://img.pdfslide.us/doc/110x75/5bc82d6909d3f22b288d027e/george-bernard-shaw-pygmalion-websters-bernard-shaw-3-preface-to-pygmalion-a.jpg)