Embed Size (px)
Citation preview

“Risk analysis based on facts, not only on perceptions” Data analytics in the Philip Morris Corporate Audit Department Page 4
May 2014
GRC Today

GRC Today: Insights in Governance, Risk and Compliance.
The GRC Today is an international publication, issued twice a year, from KPMG’s Advisory Risk Consulting practice and seeks to update you on developments in the field of Governance, Risk and Compliance (GRC). Topics include amongst others: new laws and regulations, soft controls, GRC tooling, leading practices and case studies. The GRC Today is distributed to a wide audience to provide them insights and food for thought on their GRC journey. For more information:KPMG [email protected]
© 2014 KPMG Advisory
© 2014 KPMG International Cooperative (“KPMG International”). KPMG International provides no client services and is a Swiss entity with which the independent member firms of the KPMG network are affiliated.
© 2014 KPMG Advisory
Contentsdata analytics in the Philip Morris Corporate audit department 4
Risk appetite 8
Risk dashboarding: ”Vital Risk Insights” 12
Governance analytics: What kind of company do we want to be? 16
Lessons from a non-professional half marathon runner 22
© 2014 KPMG Advisory
© 2014 KPMG International Cooperative (“KPMG International”). KPMG International provides no client services and is a Swiss entity with which the independent member firms of the KPMG network are affiliated.
data analytics in the Philip Morris Corporate audit department
Risk analysis based on facts, not only on perceptions
1 http://gu-word-count.appspot.com/
British Newspaper The Guardian offers a word count1 on the web where one can track the volume of their daily published information. This volume often amounts to up to 350,000 words or more, being the equivalent of Tolstoj’s excellent – but bulky – novel Anna Karenina. The average person would find it impossible to consume that much information in 24 hours.
This is an important sign of the times. Today’s paradigm is not about getting
Modern corporates sit on top of huge amounts of data about operations, markets, controls, processes and so on. What if they could easily tap into this data to get ultimate insights into the risks of their business and thereby maintain better control? The Corporate Audit Department of Philip Morris International (PMI) is on an ambitious and unique journey to do so by embracing data analytics. We had a conversation with David Abbott, an enthusiastic Audit Director who is responsible for the implementation. “Analytics will never replace judgment by auditors. But it can dramatically strengthen their judgments.”
© 2014 KPMG Advisory © 2014 KPMG Advisory
4 / GRC Today / May 2014
© 2014 KPMG International Cooperative (“KPMG International”). KPMG International provides no client services and is a Swiss entity with which the independent member firms of the KPMG network are affiliated.
the data. It’s about what you do with the data. Unsurprisingly, many leading organisations embrace data analytics as a concept to gain real value from the vast seas of data in their own systems, in the systems of partners and in the public domain. We are only at the beginning of a tremendous shift in finding new ways to use the data. It may lead the way to better strategic decisions, enhanced risk monitoring, and new ways of organising processes.
PMI’s Corporate Audit Department understands the power of this shift and leads the way within PMI. This is not only with respect to data analytics, but also in other areas. Abbott points to the nature of the Corporate Audit Department: “Our team is diverse in terms of experience in other working environments and capabilities. About 75 percent of our people have experience with other companies. Doug (PMI’s head of Corporate Audit) has put a lot of emphasis on recruiting the best people. We believe that top talent gets excellent value from their experience in Corporate Audit and many find their way to general management positions later on in their career.”
Another relevant aspect: Abbott himself – taking the lead in the data analytics implementation – has been a finance director, which also taught him the importance of state-of-the-art insights in Purchase to Order Reports. He now sees opportunities for significant improvements with data analytics in this respect not only for the audit process, but also for the affiliates (local operating companies) themselves.
Let’s first get back to where it started. Data analytics has been an important tool for PMI for many years and Corporate Audit started developing analytics based on ACL about ten years ago. Following many changes in SAP, the business processes and the organisation, there was a need to develop new analytics. One of the motives, according to Abbott, was the
need for a more consistent and sustainable approach across PMI’s regions. However along the way, PMI raised the bar: “While we were working on it, we asked ourselves: Why don’t we aim to lead the way and get better insights into continuous auditing and risk assessment, fully in line with the high professional standards and competencies of our team? We now aim to be a leader in this field.”
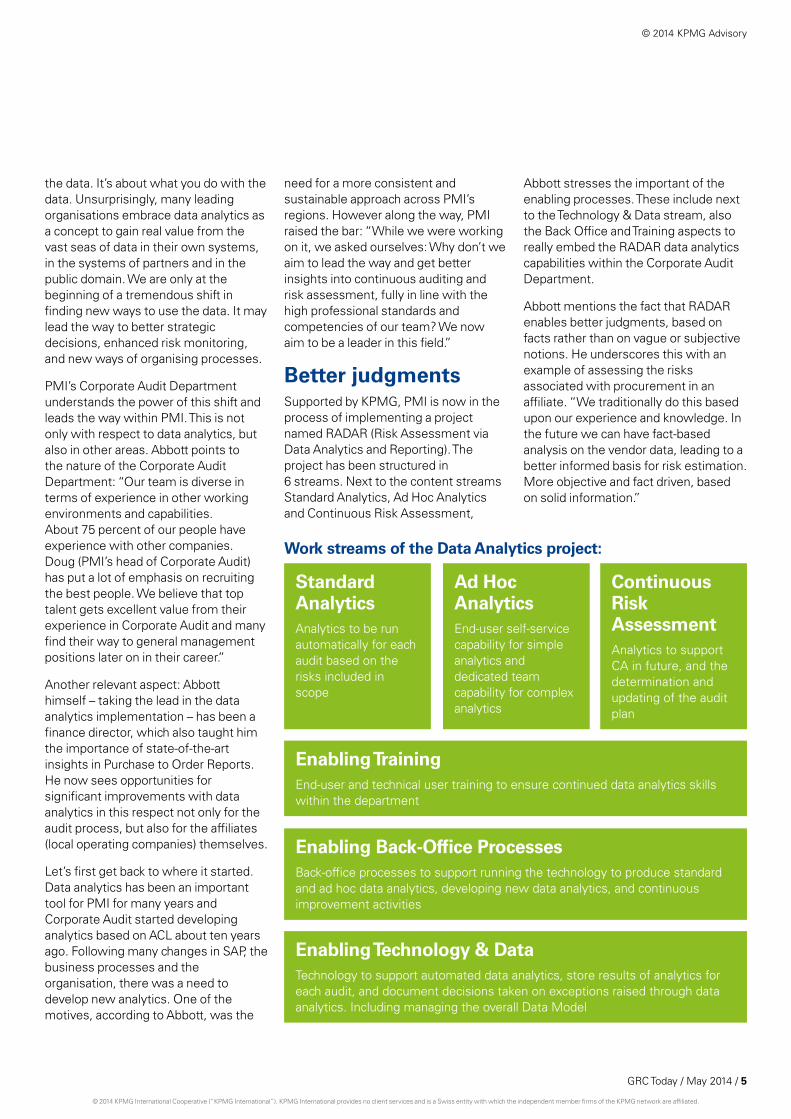
Better judgmentsSupported by KPMG, PMI is now in the process of implementing a project named RADAR (Risk Assessment via Data Analytics and Reporting). The project has been structured in 6 streams. Next to the content streams Standard Analytics, Ad Hoc Analytics and Continuous Risk Assessment,
Abbott stresses the important of the enabling processes. These include next to the Technology & Data stream, also the Back Office and Training aspects to really embed the RADAR data analytics capabilities within the Corporate Audit Department.
Abbott mentions the fact that RADAR enables better judgments, based on facts rather than on vague or subjective notions. He underscores this with an example of assessing the risks associated with procurement in an affiliate. “We traditionally do this based upon our experience and knowledge. In the future we can have fact-based analysis on the vendor data, leading to a better informed basis for risk estimation. More objective and fact driven, based on solid information.”
Standard analyticsAnalytics to be run automatically for each audit based on the risks included in scope
Enabling TrainingEnd-user and technical user training to ensure continued data analytics skills within the department
Enabling Back-office ProcessesBack-office processes to support running the technology to produce standard and ad hoc data analytics, developing new data analytics, and continuous improvement activities
Enabling Technology & dataTechnology to support automated data analytics, store results of analytics for each audit, and document decisions taken on exceptions raised through data analytics. Including managing the overall Data Model
ad Hoc analyticsEnd-user self-service capability for simple analytics and dedicated team capability for complex analytics
Continuous Risk assessmentAnalytics to support CA in future, and the determination and updating of the audit plan
Work streams of the data analytics project:
© 2014 KPMG Advisory
GRC Today / May 2014 / 5
© 2014 KPMG International Cooperative (“KPMG International”). KPMG International provides no client services and is a Swiss entity with which the independent member firms of the KPMG network are affiliated.

PMI now has 20 Standard Analytics in place and is evolving towards Continuous Risk Assessment based on data analytics. Does Abbott expect further growth in applications in the future? “We now have a very solid platform with robust material for discussion. The future lies not in going deeper and deeper to gain insights into very obscure parts of SAP, but in going broader to capture data from multiple systems. I can’t precisely predict where we will end. What’s important: it has to make sense. Once you get the ball rolling you get very excited and keen to develop lots and lots of analytics. We are keen on only developing the ones that make the most sense. That’s also a valuable lesson that KPMG brought in from other clients. It’s about quality, not about quantity. In the end data analytics is and remains a ‘means’ and should never be the ‘goal’ in itself.”
Shift controls to businessIn the view of Abbott, RADAR is a means to highlight potential anomalies, investigate them, identify that something is wrong and fix it. This attractive potential will surely generate some word of mouth about RADAR and Abbott expects that in the years to come most of the finance directors in the business will want to see the reports coming out of RADAR themselves to see how they are doing in relation to other affiliates. “Hopefully, sooner rather than later, it will move out of Corporate Audit and be integrated in the control mechanism by the affiliates themselves. This means that some of the work we are doing now will shift to the business.”
This is a future scenario. “As of now, RADAR is mainly used internally in Corporate Audit. It is welcomed with great enthusiasm and there is a massive time saving as to how we do our audits. Let me give you an example of getting information on the top 10 vendors. Before, you would have to run a query on your laptop and wait until the next morning to get the results. Now it only takes 2-3 minutes, and it is done on a server, so you can still work on your laptop. One of the beauties of what we have now, is that the need for training is significantly less than it was before. It is extremely easy to use. Before, you needed to be a technical expert to use it. It was an expert tool. Now it is an end user tool. It is simply a matter of asking the right questions.”
Revolutionise auditHow about the future of the work for Corporate Audit? Will there be a dramatic change? Abbott thinks RADAR will not revolutionise Corporate Audit. “We’re very positive in our efforts. However, one should not expect that data analytics is going to make us sit at home, pressing the button in the morning thereby generating new audit findings. That’s not even our intention. Our goal is to be better prepared and to have better insights for the business. Traditionally, Corporate Audit comes along and starts firing questions in interview style. Local management complain because they usually have talked to someone else about similar things two years ago. No wonder that they ask themselves: why are we having the same conversation again? In the new situation, this same conversation
is much more vivid and lively based on the available process insights using RADAR. The team can pinpoint important deviations in data and processes. That may be a very good interaction in the beginning of the audit as we are telling local management things they also don’t know.”
In other words: data analytics offers auditors an avenue to be more relevant. “You can learn from each other and discuss and pinpoint issues you would like to address, instead of only listening in a discussion, and being on the receiving end of information shared by affiliates.”
PMI’s Corporate audit• Structuredaroundsixfunctions:
four regions (reflecting the geographical spread of PMI) and two global functions, IS and Global functions (those based in the Lausanne Operations Center).
• Breakstheyearintosixperiodsof 2 months within which the audits are performed. Audits take about 5 to 6 weeks to complete with varying number of people involved to get the work done, depending on the scope and type of work.
© 2014 KPMG Advisory © 2014 KPMG Advisory
6 / GRC Today / May 2014
© 2014 KPMG International Cooperative (“KPMG International”). KPMG International provides no client services and is a Swiss entity with which the independent member firms of the KPMG network are affiliated.

advice roleWill the trend toward data analytics in Corporate Audit result in more emphasis on advice to management? “We do have to be careful in this respect. The Board expects us to make sure we have good controls in place. That will always remain our primary task, evaluating the internal control environment. Having said that we can provide much more practical recommendations with this type of information and we can engage more easily with affiliates. And of course we are better equipped for giving solid advice. We are definitely doing it more than we used to. But we should not lose sight of the fact that we are here to make sure that good controls are in place. RADAR gives us the required insights to have the cream on top of that.”
To conclude, Abbott points out a longer term concern. “People may think this is a replacement for judgment and
experience. It is not. It is a supplement. It can give you information that you don’t have today and enable you to make better decisions. But it does not mean that we can fire 50 people in Corporate Audit and that I am only sitting behind my desk pressing the ‘enter’ key to tell the CFO that all controls are in place and working perfectly. CRA is a means to improve judgment. Definitely not a goal in itself.”
For more information
david Remick Partner IT Advisory,KPMG in [email protected]
Maurice op het Veld
Partner IT Advisory,KPMG in the [email protected]
•Workedinanumberofauditpositionsatinternationalfirms
• JoinedPMI10yearsagoandworkedinvariousmarketssuch as Hong Kong, Korea and Pakistan. Prior to joining Corporate Audit about two years ago, David worked as finance director in Pakistan.
• IsresponsiblefortwoofthefourregionsofCorporateInternal Audit: EEMA and Latin America.
david abbott
© 2014 KPMG Advisory
GRC Today / May 2014 / 7
© 2014 KPMG International Cooperative (“KPMG International”). KPMG International provides no client services and is a Swiss entity with which the independent member firms of the KPMG network are affiliated.

Risk appetiteRisk Appetite sets the risk agenda for the entire organisation, and is the primary benchmark against which risk inherent in all activities is evaluated. It is impossible to establish and evidence an effective ERM (Enterprise Risk Management) system without a clearly articulated risk appetite.
ERM programmes that do not include a risk appetite process typically end up focusing predominantly on the control environment. The growing trend in business, however, is to unlock additional value from their risk management programmes. Companies are increasingly using risk management to drive a focus on opportunity-seeking, risk-taking and strategy development, and risk appetite sits at the heart of these endeavours.
Risk appetite is the amount of risk that an organisation is willing to accept in pursuit of value. Experience shows that the introduction of risk appetite processes can convert risk management from a governance-driven process into a strategic tool. Risk appetite sharpens the focus on the relationships between risk and operating profit. Almost all enterprise
risk management processes, therefore, should include an approach to risk appetite.
In a corporate setting, Risk Appetite should be regarded as a business process, not just a number or a model. A company’s risk appetite framework should reflect the company’s risk management philosophy, and in turn, influence the company’s culture and operating style. The company’s risk appetite should be based around its strategic objectives and various stakeholder expectations.
When risk appetite is properly understood and clearly defined, it becomes a powerful tool, not only for managing risk, but also for enhancing strategy and overall business performance. Many leading organisations are demonstrating that a pragmatic process to manage risk appetite helps to unlock value by better aligning decision-making and risk.
The principles of risk appetite are not new. Vendors of retirement annuity products, stocks and shares, or
© 2014 KPMG Advisory © 2014 KPMG Advisory
8 / GRC Today / May 2014
© 2014 KPMG International Cooperative (“KPMG International”). KPMG International provides no client services and is a Swiss entity with which the independent member firms of the KPMG network are affiliated.

investment portfolios will invariably test the prospect’s willingness and capacity to assume risk. Principles of risk appetite have been a feature of financial risk management for some time via associated concepts such as background risk, risk capacity, stop losses, and capital at risk. In the realm of GRC and enterprise risk management, however, a holistic approach assumes that there are six areas of risk appetite that should be addressed by all enterprise risk management frameworks, namely:
1. define the conceptsThe company will develop a risk appetite policy framework document. This framework will agree upon the risk appetite concepts to be adopted by the company, and outline the risk appetite framework or set of guidelines for use by management. It will describe an approach or conceptual model to be adopted by the company, appropriate for its business profile. The policy framework will formalise the company’s risk appetite and risk tolerance thresholds and parameters.
1. define the concepts
2. Board’s duties
3. Measuring risk
4. Setting thresholds
operationalising risk appetite; and
6. Risk-taking opportunities.
5.
2. Board’s dutiesThe Board is accountable to stakeholders for financial performance. It must ensure, therefore, that risk-taking and risk assumption by the company is contained within stakeholders’ earnings expectations. Risk Appetite forms a part of the Board’s wider risk governance obligations to stakeholders. It must, therefore, be integrated with existing risk governance and corporate governance processes, including oversight of ethics and reputation, safeguarding stakeholders’ interests and meet earnings’ expectations. The principles of good governance, therefore, must be applied to the risk appetite strategy, i.e. accountability, responsibility, fairness, integrity and transparency.
Specific risk appetite responsibilities of the Board include the following:
1. Approve a risk appetite policy.
2. Approve a risk appetite framework, which includes risk tolerance thresholds on delegations of authority.
3. Receive reports from management that compare risk exposure to risk appetite.
4. Evaluate the appropriateness of risk management effectiveness in the context of risk exposure and risk appetite.
5. Evaluate the company’s current risk-taking strategies against risk capacity parameters.
6. Receive reports and respond when a breach of risk thresholds has occurred or may occur.
7. Ensure continually that there is alignment of risk appetite between the Board and management.
8. Ensure that the risk appetite and risk strategy reflects the Board’s vision for the company.
Other forms of reporting to the Board, such as risk registers, audit reports and performance results, should be evaluated by the Board in the content of the company’s risk appetite parameters.
3. Measuring riskManagement has a responsibility to measure all key risks in monetary terms. A useful approach to this is to plot the risks against a distribution of earnings curve. Management will calculate the potential impact of risk upon earnings distributions, and risk exposures compared to a range of financial thresholds, such as profit warnings, breaching bank covenants and downgrading in credit rating.
If necessary, a company’s key performance indicators can be used as a proxy for measuring risk and its impact on expected earnings. Using assumptions if required, the impact on operating profit caused by variance in the key performance indicator can be measured.
This approach holds a number of advantages. Firstly, rather than a one-off estimate of the monetary impact of a single risk event, the use of an indicator enables a risk owner to monitor changes in operating profit caused by risk movements on a regular basis. Secondly, thresholds can be applied to indicators already in use by the business, in addition to financial tolerances. Thirdly, one-off estimates of values at risk tend to be determined subjectively, whereas ongoing monitoring of the link between an indicator and operating profit has more data points and lends itself to statistical analysis.
© 2014 KPMG Advisory
GRC Today / May 2014 / 9
© 2014 KPMG International Cooperative (“KPMG International”). KPMG International provides no client services and is a Swiss entity with which the independent member firms of the KPMG network are affiliated.
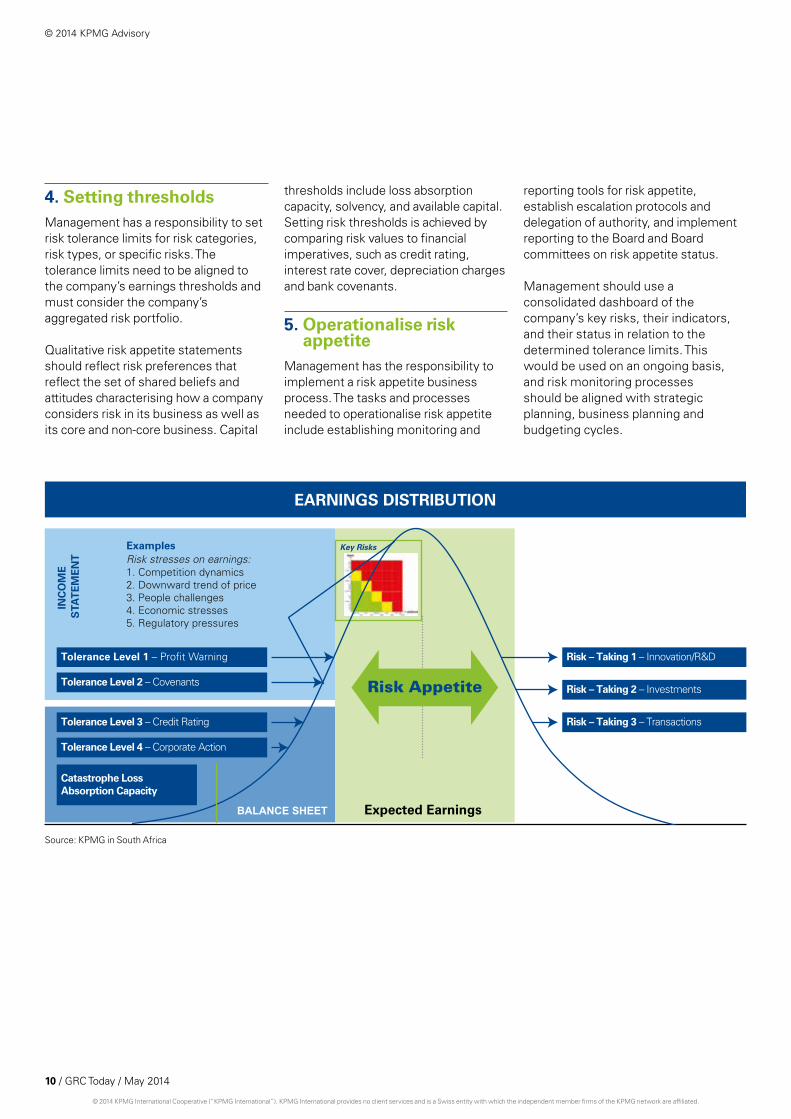
4. Setting thresholdsManagement has a responsibility to set risk tolerance limits for risk categories, risk types, or specific risks. The tolerance limits need to be aligned to the company’s earnings thresholds and must consider the company’s aggregated risk portfolio.
Qualitative risk appetite statements should reflect risk preferences that reflect the set of shared beliefs and attitudes characterising how a company considers risk in its business as well as its core and non-core business. Capital
thresholds include loss absorption capacity, solvency, and available capital. Setting risk thresholds is achieved by comparing risk values to financial imperatives, such as credit rating, interest rate cover, depreciation charges and bank covenants.
5. operationalise risk appetite
Management has the responsibility to implement a risk appetite business process. The tasks and processes needed to operationalise risk appetite include establishing monitoring and
reporting tools for risk appetite, establish escalation protocols and delegation of authority, and implement reporting to the Board and Board committees on risk appetite status.
Management should use a consolidated dashboard of the company’s key risks, their indicators, and their status in relation to the determined tolerance limits. This would be used on an ongoing basis, and risk monitoring processes should be aligned with strategic planning, business planning and budgeting cycles.
INC
OM
E
STA
TE
ME
NT
BALANCE SHEET Expected Earnings
Risk Appetite
Key Risks ExamplesRisk stresses on earnings: 1. Competition dynamics 2. Downward trend of price 3. People challenges 4. Economic stresses 5. Regulatory pressures
Tolerance Level 1 – Profit Warning
Tolerance Level 2 – Covenants
Tolerance Level 3 – Credit Rating
Risk – Taking 1 – Innovation/R&D
Risk – Taking 2 – Investments
Risk – Taking 3 – Transactions
Tolerance Level 4 – Corporate Action
Catastrophe Loss Absorption Capacity
EARNINGS DISTRIBUTION
Source: KPMG in South Africa
© 2014 KPMG Advisory © 2014 KPMG Advisory
10 / GRC Today / May 2014
© 2014 KPMG International Cooperative (“KPMG International”). KPMG International provides no client services and is a Swiss entity with which the independent member firms of the KPMG network are affiliated.

6. Risk-taking opportunities
Risk Appetite allows management to take a fresh look at upside risk and risk-taking opportunities beyond those contained in the existing business plan. Risk Appetite generates insights into the risk capacity of the company. This enables management to examine each risk afresh for possible risk-taking opportunities.
Risk management does not lead the company’s strategy and business development processes. Rather, it uses identified risks as levers for potential opportunities. The opportunities should be viewed in the context of considerations such the following:
• Areweinvestingenoughintonewbusiness development initiatives?
• Areweinvestingsufficientlyintogrowth sectors?
• Canweinvestmorecapitalintoinnovation?
• Whichareasofthebusinessrequiremore investment into competitiveness?
• Areweinvestingenoughintechnology to generate competitive advantage?
• Arewetakingenoughriskinproduct design?
It is the responsibility of the Board and management to examine its risk-taking propensity during strategy formulation and business planning. It will examine how best to optimise the corporate culture between risk-taking and risk mitigation.
ConclusionRisk Appetite is at the heart of GRC and ERM. It produces significant value because it aligns risk management to a company’s financial framework; it contributes to strategy and decision making, and it generates a focus on opportunities and risk-taking.
For more information:
Steven BriersPartner Internal Audit,Risk and Compliance ServicesKPMG in South [email protected]
”Risk management does not lead the
company’s strategy and business
development processes.”
© 2014 KPMG Advisory
GRC Today / May 2014 / 11
© 2014 KPMG International Cooperative (“KPMG International”). KPMG International provides no client services and is a Swiss entity with which the independent member firms of the KPMG network are affiliated.

Risk dashboarding: ”Vital Risk Insights”
GRC – where should we be?Because it is a highly visible member of society in both the local and global sphere, the modern company is expected to conduct itself in a way that upholds community values. Its leadership and Board of directors are responsible for enacting and enforcing policies that help ensure the welfare and interests of both
its stakeholders and society. Such policies are commonly managed through a structured and formalised GRC system characterised by such aspects as Board committees, scheduled reports to leadership and the Board and a programme of risk management that includes an infrastructure for monitoring the internal controls. Given the importance of the Board’s mandate to protect stakeholder interests, it is vital
that the Board is kept abreast of key facts relating to risks, internal controls, losses and trends. The Board has a right to be kept fully advised of significant initiatives by management and that such information will be provided in a timely manner. GRC systems support this reporting and monitoring process based on four principles of good governance: accountability, responsibility, fairness and transparency.
Success in today’s global marketplace demands that leading companies keep up with the remarkable pace of technological change and innovation, particularly with regards to business intelligence software.
This is no different in the area of risk management; Boards need vital insights into risks to create value-adding information which can be transformed into market share, revenue growth or increase of customer loyalty. By integrating and presenting vital risk insights into a single fact-based dashboard view with drill-down capabilities, the Board can significantly improve tracking and acting on the effectiveness of governance, risk management, and compliance (GRC) activities.
© 2014 KPMG Advisory © 2014 KPMG Advisory
12 / GRC Today / May 2014
© 2014 KPMG International Cooperative (“KPMG International”). KPMG International provides no client services and is a Swiss entity with which the independent member firms of the KPMG network are affiliated.
Management must keep the Board informed of the facts of the company’s operating performance, which includes information such as the status of key risks, assurance on critical controls, details of material losses, and developments in the area of compliance. In order for the value of GRC to be fully realised, its information must be reported objectively, and presented in a way that demonstrates any potential impact on the company’s strategic objectives, performance targets and financial framework. This implies that information about risks, controls and losses are expressed in numeric terms and in terms of fact-based key risk indicators.
GRC – what are we doing well?Structured programmes to manage risk have become widely accepted in large corporate enterprises, characterised by processes such as formal risk assessments, programmes of control
Case Study – Financial sectorThe regulatory pressure and risks in the financial services sector has increased exponentially over the last couple of years.
In order to maintain control, the Board of a worldwide financing and leasing company felt the need for more structured and frequent information.
KPMG supports the company and has recently finalised the first phase to define an integrated risk and compliance view for the Board. In the second phase we support the client in setting up a continuous monitoring solution which will be implemented worldwide. One of the major contributors adding value to the client’s business is the ability to translate Board-level concerns into actionable insights.
testing, and internal risk reporting. Specialised functions address inherent risk exposures ranging from market risk to sustainability risk. Board oversight is provided through governance structures and supported by periodic reporting by management. Compliance management is embedded within the fabric of leading companies and rigorous audit programmes help ensure that operations meet regulatory requirements. Generally, accepted standards and processes of GRC have helped to improve these kinds of practices around the world.
GRC – What are our challenges?Management bias and viewing risk subjectively pose a challenge to many companies. Since management is rewarded for good news and not bad through a programme of incentives, the temptation exists to focus on its achievements and downplay mistakes. Overly optimistic reporting can result in incomplete or biased assessments that can harm or have an even fatal impact on a company. Internal reporting processes that depend entirely upon personal interpretation, traffic light ratings and free-form style may expose a company to this problem.
This kind of vulnerability is compounded when submissions are presented with
no empirical evidence to support them. An increasing number of companies have addressed the challenge of subjectivity and management bias by implementing real-time reports based on actual data. Continuous monitoring also addresses this challenge and provides the ability to respond to identified issues more rapidly. Thus, instead of depending upon an annual declaration by management on the status of internal controls, companies rely on real-time reports based on actual data pulled from operating systems.
Quantifying non-financial risks is considered difficult if not impossible by many management teams, so essential techniques such as setting risk tolerance thresholds, matching risk values to financial imperatives, and measuring risk concentrations, are often not used at all. Choosing the right indicators of risk is often seen as problematic and too much of a challenge, causing management to adopt simplistic ranking scales in compensation.
Reports and submissions to GRC oversight functions and committees are typically produced on an infrequent or periodic basis rather than in real time. Although substantial time and expense may be incurred in producing such information, a lack of current data may inhibit deep insights into the connection
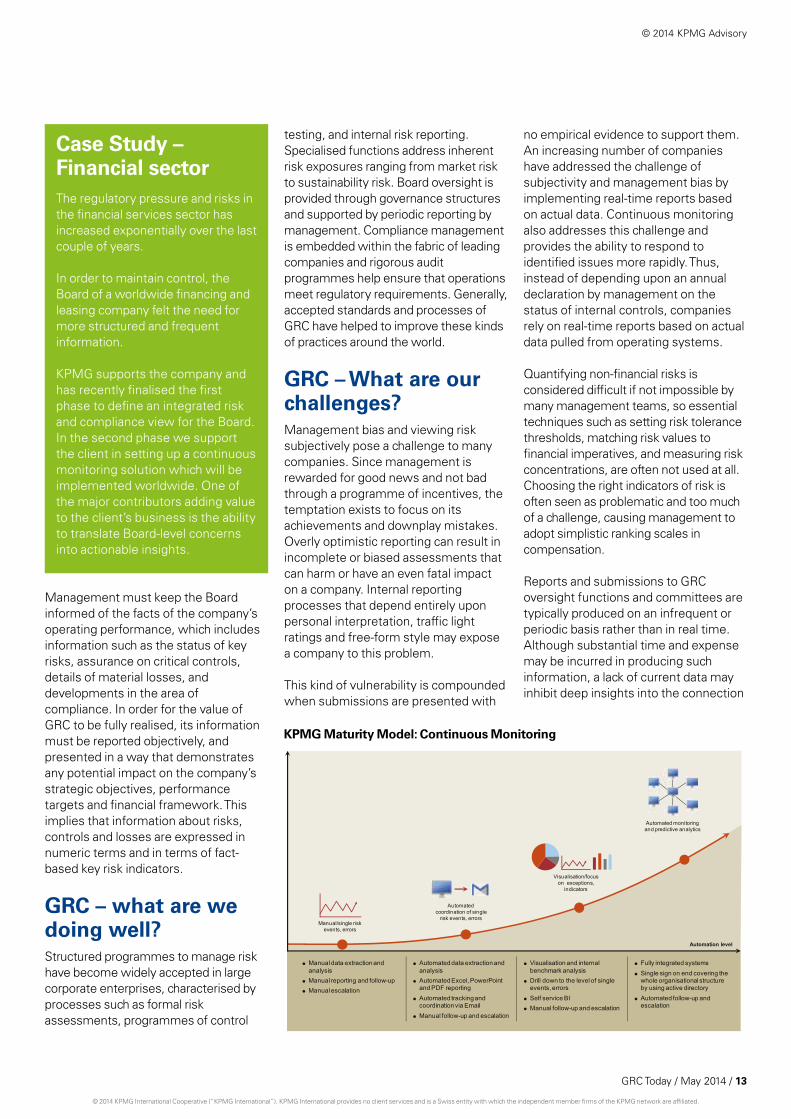
KPMG Maturity Model: Continuous Monitoring
� Automated data extraction and
analysis
� Automated Excel, PowerPoint and PDF reporting
� Automated tracking and coordination via Email
� Manual follow-up and escalation
� Manual data extraction and
analysis
� Manual reporting and follow-up
� Manual escalation
� Visualisation and internal
benchmark analysis
� Drill down to the level of single events, errors
� Self service BI
� Manual follow-up and escalation
� Fully integrated systems
� Single sign on end covering the whole organisational structure by using active directory
� Automated follow-up and escalation
Automation level
Automated monitoring
and predictive analytics
Manual/single risk
events, errors
Automated
coordination of single
risk events, errors
Visualisation/focus
on exceptions,
indicators
© 2014 KPMG Advisory
GRC Today / May 2014 / 13
© 2014 KPMG International Cooperative (“KPMG International”). KPMG International provides no client services and is a Swiss entity with which the independent member firms of the KPMG network are affiliated.
between risk and performance. A single view of GRC and assurance is often not provided to Board committees. With no standardised framework, content or methodologies, these disparate functions can often appear fragmented and disconnected from one another.
A culture of good risk management is notoriously difficult to achieve when these functions are positioned outside of the core business, and weaknesses in management buy-in will be evident in the quality and substance of reporting. Ratings of risks, controls and losses may remain static or not evaluated accurately for fear of being exposed by peers.
GRC requires sound processes and structures in order to function optimally, and the maturity model illustrates that a company’s GRC maturity normally
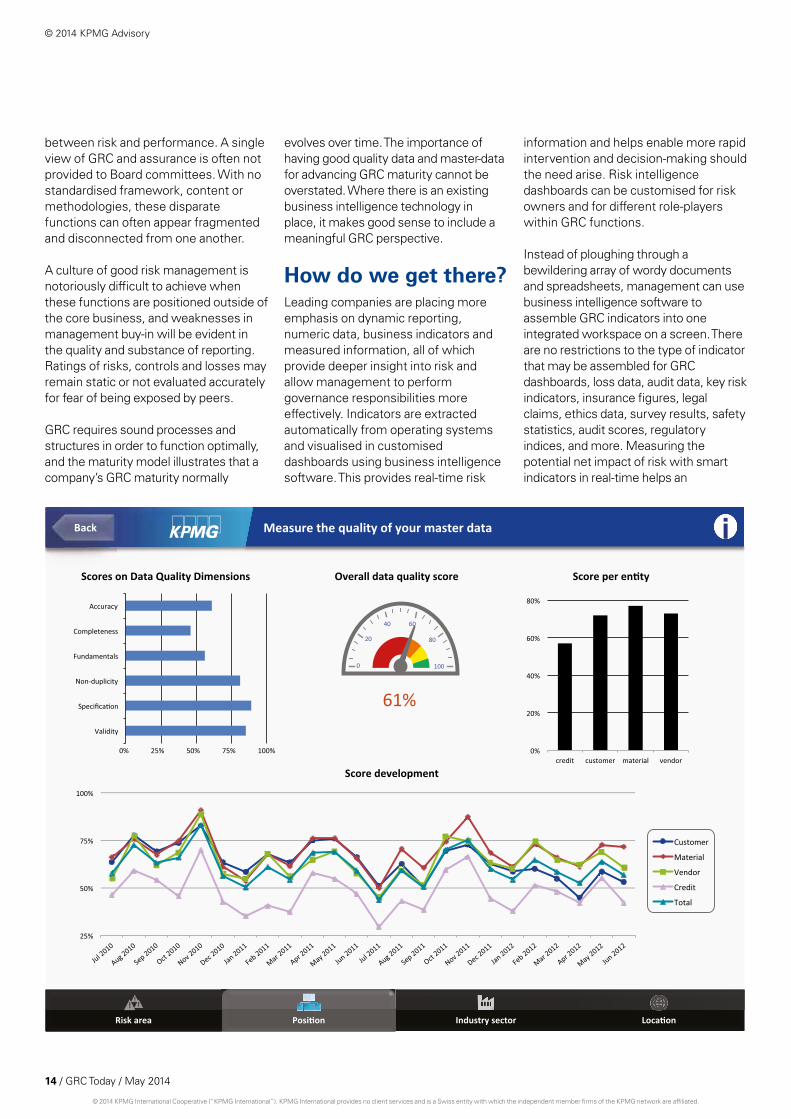
evolves over time. The importance of having good quality data and master-data for advancing GRC maturity cannot be overstated. Where there is an existing business intelligence technology in place, it makes good sense to include a meaningful GRC perspective.
How do we get there?Leading companies are placing more emphasis on dynamic reporting, numeric data, business indicators and measured information, all of which provide deeper insight into risk and allow management to perform governance responsibilities more effectively. Indicators are extracted automatically from operating systems and visualised in customised dashboards using business intelligence software. This provides real-time risk
information and helps enable more rapid intervention and decision-making should the need arise. Risk intelligence dashboards can be customised for risk owners and for different role-players within GRC functions.
Instead of ploughing through a bewildering array of wordy documents and spreadsheets, management can use business intelligence software to assemble GRC indicators into one integrated workspace on a screen. There are no restrictions to the type of indicator that may be assembled for GRC dashboards, loss data, audit data, key risk indicators, insurance figures, legal claims, ethics data, survey results, safety statistics, audit scores, regulatory indices, and more. Measuring the potential net impact of risk with smart indicators in real-time helps an
© 2014 KPMG Advisory © 2014 KPMG Advisory
14 / GRC Today / May 2014
© 2014 KPMG International Cooperative (“KPMG International”). KPMG International provides no client services and is a Swiss entity with which the independent member firms of the KPMG network are affiliated.
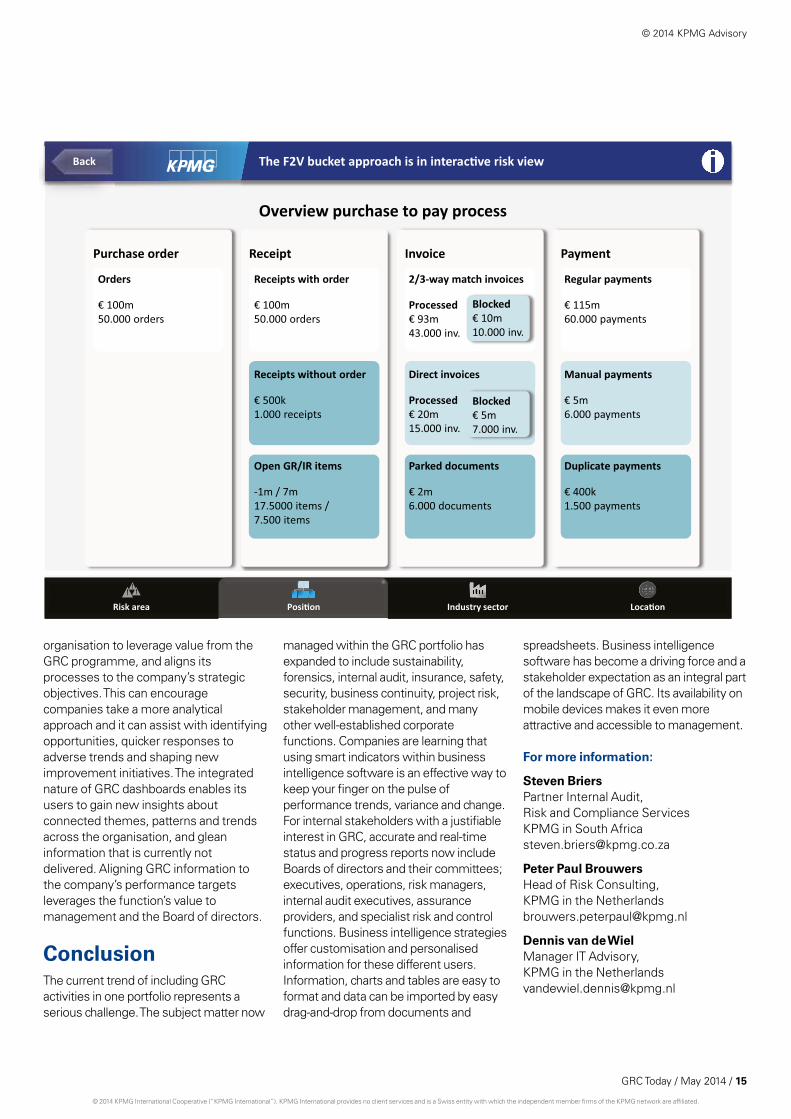
Overview purchase to pay process
Purchase order Receipt Invoice Payment
Orders
€ 100m 50.000 orders
Receipts with order
€ 100m 50.000 orders
2/3-way match invoices
Processed € 93m 43.000 inv.
Regular payments
€ 115m 60.000 payments
Receipts without order
€ 500k 1.000 receipts
Manual payments
€ 5m 6.000 payments
Blocked € 10m 10.000 inv.
Direct invoices
Processed € 20m 15.000 inv.
Blocked € 5m 7.000 inv.
Open GR/IR items
-1m / 7m 17.5000 items / 7.500 items
Duplicate payments
€ 400k 1.500 payments
Parked documents
€ 2m 6.000 documents
Back i
Industry sector Loca�on Risk area
! ! !
Posi�on
The F2V bucket approach is in interac�ve risk view Overview purchase to pay process
Purchase order Receipt Invoice Payment
Orders
€ 100m 50.000 orders
Receipts with order
€ 100m 50.000 orders
2/3-way match invoices
Processed € 93m 43.000 inv.
Regular payments
€ 115m 60.000 payments
Receipts without order
€ 500k 1.000 receipts
Manual payments
€ 5m 6.000 payments
Blocked € 10m 10.000 inv.
Direct invoices
Processed € 20m 15.000 inv.
Blocked € 5m 7.000 inv.
Open GR/IR items
-1m / 7m 17.5000 items / 7.500 items
Duplicate payments
€ 400k 1.500 payments
Parked documents
€ 2m 6.000 documents
Back i
Industry sector Loca�on Risk area
! ! !
Posi�on
The F2V bucket approach is in interac�ve risk view
organisation to leverage value from the GRC programme, and aligns its processes to the company’s strategic objectives. This can encourage companies take a more analytical approach and it can assist with identifying opportunities, quicker responses to adverse trends and shaping new improvement initiatives. The integrated nature of GRC dashboards enables its users to gain new insights about connected themes, patterns and trends across the organisation, and glean information that is currently not delivered. Aligning GRC information to the company’s performance targets leverages the function’s value to management and the Board of directors.
ConclusionThe current trend of including GRC activities in one portfolio represents a serious challenge. The subject matter now
managed within the GRC portfolio has expanded to include sustainability, forensics, internal audit, insurance, safety, security, business continuity, project risk, stakeholder management, and many other well-established corporate functions. Companies are learning that using smart indicators within business intelligence software is an effective way to keep your finger on the pulse of performance trends, variance and change. For internal stakeholders with a justifiable interest in GRC, accurate and real-time status and progress reports now include Boards of directors and their committees; executives, operations, risk managers, internal audit executives, assurance providers, and specialist risk and control functions. Business intelligence strategies offer customisation and personalised information for these different users. Information, charts and tables are easy to format and data can be imported by easy drag-and-drop from documents and
spreadsheets. Business intelligence software has become a driving force and a stakeholder expectation as an integral part of the landscape of GRC. Its availability on mobile devices makes it even more attractive and accessible to management.
For more information:
Steven BriersPartner Internal Audit, Risk and Compliance ServicesKPMG in South Africa [email protected]
Peter Paul BrouwersHead of Risk Consulting,KPMG in the [email protected]
dennis van de WielManager IT Advisory,KPMG in the [email protected]
© 2014 KPMG Advisory
GRC Today / May 2014 / 15
© 2014 KPMG International Cooperative (“KPMG International”). KPMG International provides no client services and is a Swiss entity with which the independent member firms of the KPMG network are affiliated.
Governance analytics
What kind of company do we want to be?Governance may be the most buzzed about word these days, but what do we mean by it, and how does it add value? And how can you verify that the governance of your organisation is fit-for-future? Designing or adapting the corporate governance model of an organisation starts with some contemplation: what is our mission, what are our objectives and how do we want to reach them? The journey towards better corporate governance should begin by answering these questions. And Governance Analytics could be your guide on that journey.
© 2014 KPMG Advisory © 2014 KPMG Advisory
16 / GRC Today / May 2014
© 2014 KPMG International Cooperative (“KPMG International”). KPMG International provides no client services and is a Swiss entity with which the independent member firms of the KPMG network are affiliated.

Perhaps the best starting point for thinking about the corporate governance of your company is asking yourself a simple question: what kind of company do we want to be? Of course, the question is not as simple as it seems, because it breaks down into a number of sub-questions concerning mission, core values and strategy, such as: how do we want to work together, what is our definition of success, what is our risk appetite, who are our stakeholders and how do we want to be seen by the world around us? All that
must be reflected by the choice of your corporate governance model.
Triggers for a governance review can be a new majority shareholder, external (regulatory) pressure, a new target operating model, strategy change, new markets or technologies, a new Board of directors, or strengthening the span of control.
Live up to your idealWhile thinking and talking about the kind of company you want to be, you have to beware of wishful thinking and always ask yourself if – and how – your organisation can live up to the ‘ideal’. A company which, for instance, decides to be innovative must create the conditions and the culture within the organisation that stimulates new ideas to be developed and brought to fruition. This may imply that the R&D department should enjoy a certain autonomy, coupled with a Board composition that has the technological expertise needed to judge and monitor new projects. These conditions are, in large measure, determined by the chosen governance model. It is the linking pin between the definition and realisation of your corporate and business ideals.
Structure to set objectivesCorporate governance provides the structure through which your organisation sets and pursues its objectives, while reflecting the context of the social, regulatory and market environment. At the same time, corporate governance is a mechanism for monitoring the actions, policies and decisions of the company and it involves the alignment of interests among the stakeholders.
There is a general need for clear oversight structures, deployment of roles, responsibilities, effective management information (as part of the corporate information supply chain) and
transparent decision making. But there’s more. The way an organisation must be governed and managed in order to achieve its goals is not static, but dynamic in time and circumstances.
People make structures workA good corporate governance structure is the first – and necessary – step towards better governance. However, the culture in the organisation, including the tone at the top and the prevailing business ethics, makes all the difference. The soft controls or people aspects of governance are perhaps harder to assess from corporate structures written and illustrated on paper. So whilst it is correct to say that it starts from the Board, consequence management is equally important. A good structure is only effective if the right action and behaviour follows. Consequence management is what actions are being taken and how, when for instance the top sales person violates the code of ethics.
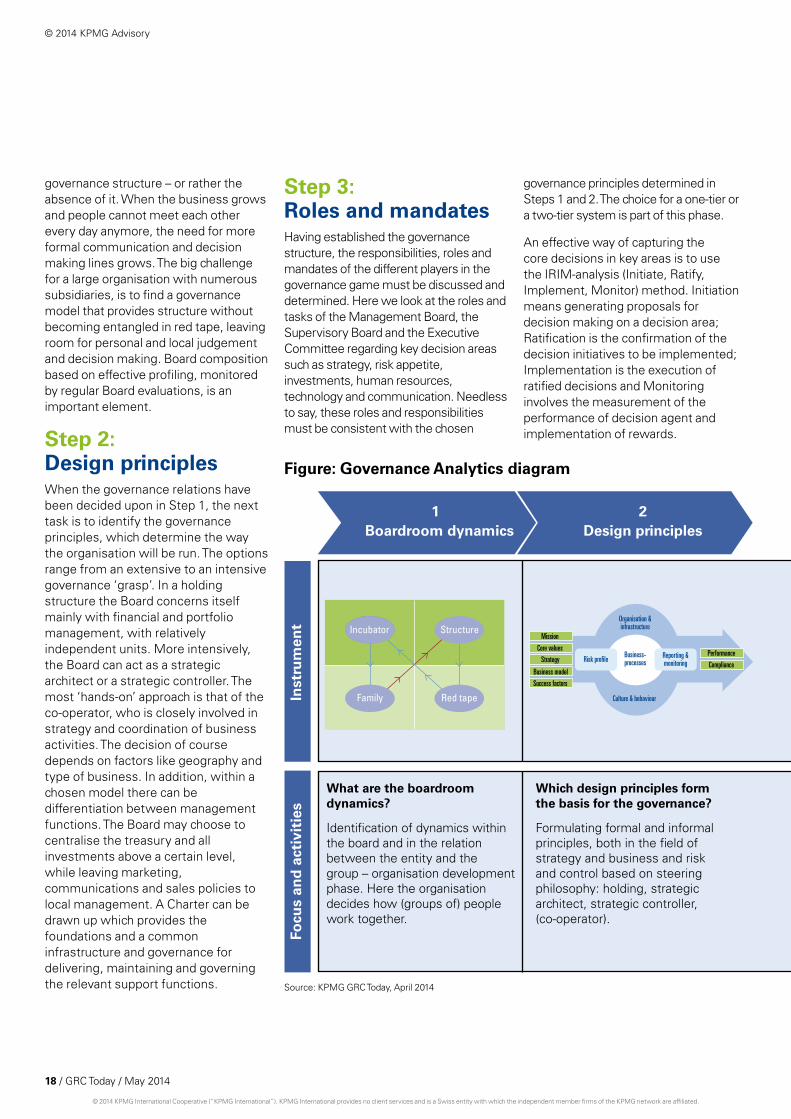
Governance analyticsGovernance Analytics is an approach to governance that, while taking into account the behavioural aspects and the organisational dynamics of it, structurally verifies governance. The model cuts through the complexity of the corporate governance process by identifying five easy to grasp, comprehend and analyse steps (see figure on next page).
Step 1: Boardroom dynamicsThe first phase in the Governance Analytics approach is the identification of the dynamics within the Board and in the relation between the entity and the group. There is an important cultural aspect to this, because here the organisation decides how (groups of) people work together. Often, start-ups begin in a very informal and family-like
© 2014 KPMG Advisory
GRC Today / May 2014 / 17
© 2014 KPMG International Cooperative (“KPMG International”). KPMG International provides no client services and is a Swiss entity with which the independent member firms of the KPMG network are affiliated.
governance structure – or rather the absence of it. When the business grows and people cannot meet each other every day anymore, the need for more formal communication and decision making lines grows. The big challenge for a large organisation with numerous subsidiaries, is to find a governance model that provides structure without becoming entangled in red tape, leaving room for personal and local judgement and decision making. Board composition based on effective profiling, monitored by regular Board evaluations, is an important element.
Step 2: design principlesWhen the governance relations have been decided upon in Step 1, the next task is to identify the governance principles, which determine the way the organisation will be run. The options range from an extensive to an intensive governance ‘grasp’. In a holding structure the Board concerns itself mainly with financial and portfolio management, with relatively independent units. More intensively, the Board can act as a strategic architect or a strategic controller. The most ‘hands-on’ approach is that of the co-operator, who is closely involved in strategy and coordination of business activities. The decision of course depends on factors like geography and type of business. In addition, within a chosen model there can be differentiation between management functions. The Board may choose to centralise the treasury and all investments above a certain level, while leaving marketing, communications and sales policies to local management. A Charter can be drawn up which provides the foundations and a common infrastructure and governance for delivering, maintaining and governing the relevant support functions.
Reporting &monitoringRisk profile
Organisation &infrastructure
Culture & behaviour
Business-processes
Mission
Core values
Strategy
Business model
Success factors
Performance
Compliance
Incubator Structure
Family Red tape
CEODecisionareas
Initiation (Int) − generationof proposals for resourceutilization and structuringof contracts
Ratification (Rat) − choiceof the decision initiativesto be implemented
Implementation (Imp) −execution of ratifieddecisions and
Monitoring (Mon) −measurement of theperformance ofdecision agent andimplementation of rewards
Strategy
Markets
HR
Innovation
.............
COO CFRO All
BoD
Divisions
FRC
Staff
Staf
f
SvB 6. Reporting &monitoring
1. Objectivesetting & risk
appetite
2. Governance,organisation &infrastructure
3. Riskassessment &
response
4. Controlactivities in
businessprocesses
5. People
Boardroom dynamics Design principles Roles and mandates Organisation4321 5
Business and control cycle
Inst
rum
ent
Focu
s an
d a
ctiv
itie
s
What are the boardroom dynamics?
Identification of dynamics within the board and in the relation between the entity and the group – organisation development phase. Here the organisation decides how (groups of) people work together.
Which design principles form the basis for the governance?
Formulating formal and informal principles, both in the field of strategy and business and risk and control based on steering philosophy: holding, strategic architect, strategic controller, (co-operator).
What are the responsibilities, roles and mandates?
Capturing (core) decisions by means of IRIM-analysis (Initiate, Ratify, Implement, Monitor) to establish the Governance cycle.
Which boards, committees and meetings are involved in the decision making process?
Identifying and describing: composition, invitees, topics, information basis, frequency and interaction
What does the business and control cycle look like?
Describing the business and control cycle from the perspective of the board in relation to the various functions (risk, compliance, IT etc.)
Step 3: Roles and mandatesHaving established the governance structure, the responsibilities, roles and mandates of the different players in the governance game must be discussed and determined. Here we look at the roles and tasks of the Management Board, the Supervisory Board and the Executive Committee regarding key decision areas such as strategy, risk appetite, investments, human resources, technology and communication. Needless to say, these roles and responsibilities must be consistent with the chosen
governance principles determined in Steps 1 and 2. The choice for a one-tier or a two-tier system is part of this phase.
An effective way of capturing the core decisions in key areas is to use the IRIM-analysis (Initiate, Ratify, Implement, Monitor) method. Initiation means generating proposals for decision making on a decision area; Ratification is the confirmation of the decision initiatives to be implemented; Implementation is the execution of ratified decisions and Monitoring involves the measurement of the performance of decision agent and implementation of rewards.
Figure: Governance analytics diagram
Source: KPMG GRC Today, April 2014
© 2014 KPMG Advisory © 2014 KPMG Advisory
18 / GRC Today / May 2014
© 2014 KPMG International Cooperative (“KPMG International”). KPMG International provides no client services and is a Swiss entity with which the independent member firms of the KPMG network are affiliated.

Reporting &monitoringRisk profile
Organisation &infrastructure
Culture & behaviour
Business-processes
Mission
Core values
Strategy
Business model
Success factors
Performance
Compliance
Incubator Structure
Family Red tape
CEODecisionareas
Initiation (Int) − generationof proposals for resourceutilization and structuringof contracts
Ratification (Rat) − choiceof the decision initiativesto be implemented
Implementation (Imp) −execution of ratifieddecisions and
Monitoring (Mon) −measurement of theperformance ofdecision agent andimplementation of rewards
Strategy
Markets
HR
Innovation
.............
COO CFRO All
BoD
Divisions
FRC
Staff
Staf
f
SvB 6. Reporting &monitoring
1. Objectivesetting & risk
appetite
2. Governance,organisation &infrastructure
3. Riskassessment &
response
4. Controlactivities in
businessprocesses
5. People
Boardroom dynamics Design principles Roles and mandates Organisation4321 5
Business and control cycle
Inst
rum
ent
Focu
s an
d a
ctiv
itie
s
What are the boardroom dynamics?
Identification of dynamics within the board and in the relation between the entity and the group – organisation development phase. Here the organisation decides how (groups of) people work together.
Which design principles form the basis for the governance?
Formulating formal and informal principles, both in the field of strategy and business and risk and control based on steering philosophy: holding, strategic architect, strategic controller, (co-operator).
What are the responsibilities, roles and mandates?
Capturing (core) decisions by means of IRIM-analysis (Initiate, Ratify, Implement, Monitor) to establish the Governance cycle.
Which boards, committees and meetings are involved in the decision making process?
Identifying and describing: composition, invitees, topics, information basis, frequency and interaction
What does the business and control cycle look like?
Describing the business and control cycle from the perspective of the board in relation to the various functions (risk, compliance, IT etc.)
Step 4: organisationDiving a bit deeper into the roles and tasks of management and supervision, the next step is to describe the actions and information and reporting streams that can be assigned to the various management functions throughout the organisation. This includes the management of business units, divisions, and staff positions, right up to the Executive Committee and the Management Board. The same applies to the tasks of the Supervisory Board and of the Board Committees, such as
the Audit & Risk Committee, the Remuneration Committee and the Nomination Committee. Elements to be discussed are the topics, composition and meeting frequency of Board Committees, invitees to meetings and ways of reporting to the full Board. The same goes for the agenda and the meeting frequency of the Management Board and the Executive Committee, plus the interaction with one another and with the Supervisory Board. Also, the interaction between the Chairman of the Management and the Supervisory Board should be discussed here.
Step 5: Business and control cycleWith the governance principles and structure in place, it is time to look at the business and control cycle. This step describes the business and control cycle from the perspective of the Management and the Supervisory Boards in relation to the various functions (risk, compliance, IT etc.). A clear framework is needed for the information and reporting streams, in order to keep a firm grip on risk and
© 2014 KPMG Advisory
GRC Today / May 2014 / 19
© 2014 KPMG International Cooperative (“KPMG International”). KPMG International provides no client services and is a Swiss entity with which the independent member firms of the KPMG network are affiliated.
compliance, risk assessment & response, control activities in business processes, human resources, reporting and monitoring. This framework also comprises the ‘soft controls’, the behavioural aspects of governance, and the ‘Policy House’. This is the centrally available and organised set of policy documents including procedures, standards, charters and supporting material that govern the organisation and people in it.
added valueCreating or adapting the corporate governance model to match the needs of the organisation creates value. First of all, having a management oversight and control framework that fits the company’s strategy, operations and culture is effective and efficient because it avoids inconsistencies, overlaps, and gaps among governance mechanisms. Such a framework also improves clarity, because a well-conceived governance operating model provides the Board with a vehicle to clearly define the roles, responsibilities, accountabilities, information flows, and guidelines that people need in order to achieve strategic goals. Also, it gives the Board clear line of sight into management’s decision-
making and risk management processes. Finally, creating a robust control framework, supported by consistent governance principles, will help improve risk management and compliance performance.
The governance model is the linking pin between the definition and the realisation of your corporate ideals.
Governance Analytics cuts through the complexity of the corporate governance process by identifying five easy to grasp, comprehend and analyse steps
For more information:
Robert van altenaPartner Risk Consulting, KPMG in the Netherlands [email protected]
Irving Low Head of Risk ConsultingKPMG in [email protected]
Mira RengersenManager Risk ConsultingKPMG in the [email protected]
The governance model is the linking pin between the definition and the realisation of your corporate ideals.
Governance Analytics cuts through the complexity of the corporate governance process by identifying five easy to grasp, comprehend and analyse steps.
People make structures work: The organisational climate, including the tone at the top, the prevailing business ethics and effective consequence management, makes all the difference.
© 2014 KPMG Advisory © 2014 KPMG Advisory
20 / GRC Today / May 2014
© 2014 KPMG International Cooperative (“KPMG International”). KPMG International provides no client services and is a Swiss entity with which the independent member firms of the KPMG network are affiliated.

© 2014 KPMG Advisory
GRC Today / May 2014 / 21
© 2014 KPMG International Cooperative (“KPMG International”). KPMG International provides no client services and is a Swiss entity with which the independent member firms of the KPMG network are affiliated.
One of these is tracking their physical state by measuring heart rate during the event. The philosophy is simple: tracking this data results in better decisions on when to accelerate or lower speed and provide insights to realise the goal settings as optimally as possible. Experts forecast much more advanced information in the near future, with
sensors for real time measurements of the level of glucose in their blood. These insights give a much more precise indication on the physical possibilities and thereby increase the chance of success. Glucose is basically the fuel for performance – it can be compared to the gas tank in an automobile – and gives an excellent indication of the
physical reserves. The breakthrough of these concepts will make sporting events much more tactical.
Now let’s take a giant leap into the world of management information in business and see how the analogy with non-professional runners works out. Most companies have insights about their
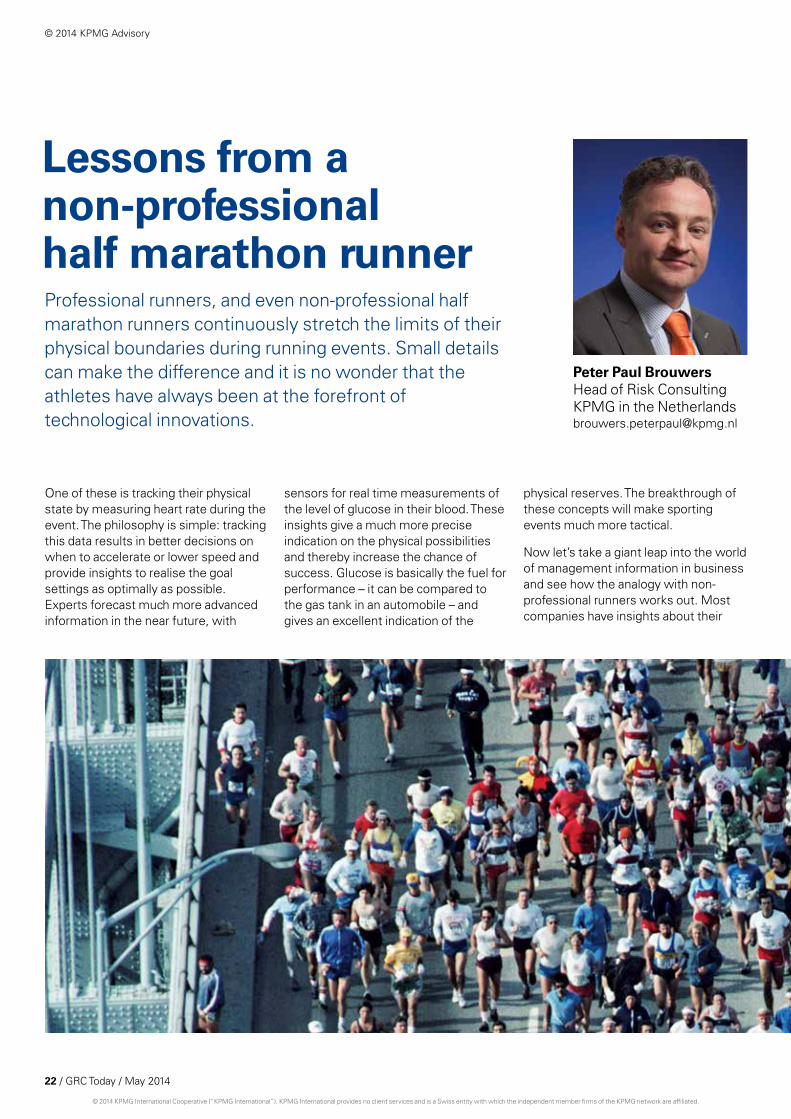
Lessons from a non-professional half marathon runner
Peter Paul Brouwers Head of Risk Consulting KPMG in the Netherlands [email protected]
Professional runners, and even non-professional half marathon runners continuously stretch the limits of their physical boundaries during running events. Small details can make the difference and it is no wonder that the athletes have always been at the forefront of technological innovations.
© 2014 KPMG Advisory © 2014 KPMG Advisory
22 / GRC Today / May 2014
© 2014 KPMG International Cooperative (“KPMG International”). KPMG International provides no client services and is a Swiss entity with which the independent member firms of the KPMG network are affiliated.

In each edition of GRC Today, a member of the editorial Board shares their thoughts and insights on a particular topic.
heart rate – their financial performance and some indicators on operations. However, few have integrated insights into a full range of equally important indicators, in the field of finance, operations, compliance, regulations and last but not least strategic progress. Many don’t realise they should be worried about these lack of insights.
On the one hand, this is surprising given the fact that new technology offers tremendous possibilities to build real-time dashboards using a variety of data sources – both internal and external. Having a dashboard like this in place gives management optimal information to maintain controlled growth. In other words: knowing when and how to place an acceleration or holding back speed. Knowing if you’re in control.
On the other hand, it’s quite understandable why many organisations are a far distance from this scenario. Financials – who are the main actors in drafting management information out of models – have traditionally been educated with the idea of the general ledger and risk models being the centre of the information ecosystem in a company. This may have been true in the past. However, nowadays everything is connected and information from many sensors and sources can easily be gathered and interpreted in real-time. We have definitely entered a new reality. But we’ve never properly adapted our information models to this new reality.
Can we change this? Yes, we can. It’s time that for example (business) Controllers, Chief Risk Officers, Chief Financial
Officers, Chief Operations Officers and Chief Tax Officers adopt a new way of thinking about management information. The needs of management – knowing when and how to accelerate or to hold speed – should be central, instead of the output of the financial systems and models. Rest assured: changing this is not about implementing large and time consuming IT-projects. It’s about engaging in other information models, tailored toward the new reality. It’s very rewarding to do so. Not only does it lead to better informed decisions in today’s fast paced world. It’s also more fun and motivating.
I have just one question. What are you waiting for?
Kind regards, Peter Paul Brouwers
© 2014 KPMG Advisory
GRC Today / May 2014 / 23
© 2014 KPMG International Cooperative (“KPMG International”). KPMG International provides no client services and is a Swiss entity with which the independent member firms of the KPMG network are affiliated.
Peter Paul BrouwersHead of Risk ConsultingKPMG in the NetherlandsE: [email protected]
deon MinnaarPartner, Risk ConsultingKPMG in the USE: [email protected]
Irving LowHead of Risk ConsultingKPMG in SingaporeE: [email protected]
Contacts Europe, Middle, East africa:
Contact us
Contacts americas:
Contacts asia Pacific:
The information contained herein is of a general nature and is not intended to address the circumstances of any particular individual or entity. Although we endeavor to provide accurate and timely information, there can be no guarantee that such information is accurate as of the date it is received or that it will continue to be accurate in the future. No one should act on such information without appropriate professional advice after a thorough examination of the particular situation.
© 2014 KPMG Advisory N.V., registered with the trade register in the Netherlands under number 33263682, is a subsidiary of KPMG Europe LLP and a member firm of the KPMG network of independent member firms affiliated with KPMG International Cooperative (‘KPMG International’), a Swiss entity. All rights reserved. The name KPMG, logo and ‘cutting through complexity’ are registered trademarks of KPMG International. The KPMG name, logo and “cutting through complexity” are registered trademarks or trademarks of KPMG International.
Designed by Evalueserve. Publication name: GRC Today Publication number: 131183 Publication date: May 2014
kpmg.com/socialmedia
www.kpmg.nl
kpmg.com/app
Bart van LoonPartner, Risk ConsultingKPMG in the NetherlandsE: [email protected]
antonio TorchiaPartner, Risk ConsultingKPMG in the USE: [email protected]
Bradley StylesPartner, Risk ConsultingKPMG in SingaporeE: [email protected]
Maria Bautista KPMG in the Netherlands
Jeroen Bolt KPMG in the Netherlands
Steven Briers KPMG in South Africa
Mira Rengersen KPMG in the Netherlands
Editorial Team: