Embed Size (px)
Citation preview
GRAVITY INDICATOR
Page 1 of 4 | stofs.com
GRAVITY INDICATOR
1. Overview ............................................................................................................................ 2
2. Using the Gravity indicator ................................................................................................ 3
2.1 Adding the indicator to a chart .................................................................................... 3
2.2 Choosing the colours ................................................................................................... 3
2.3 Time period ................................................................................................................. 3
2.4 Start date ...................................................................................................................... 3
Page 2 of 4 | stofs.com
GRAVITY INDICATOR
1. Overview
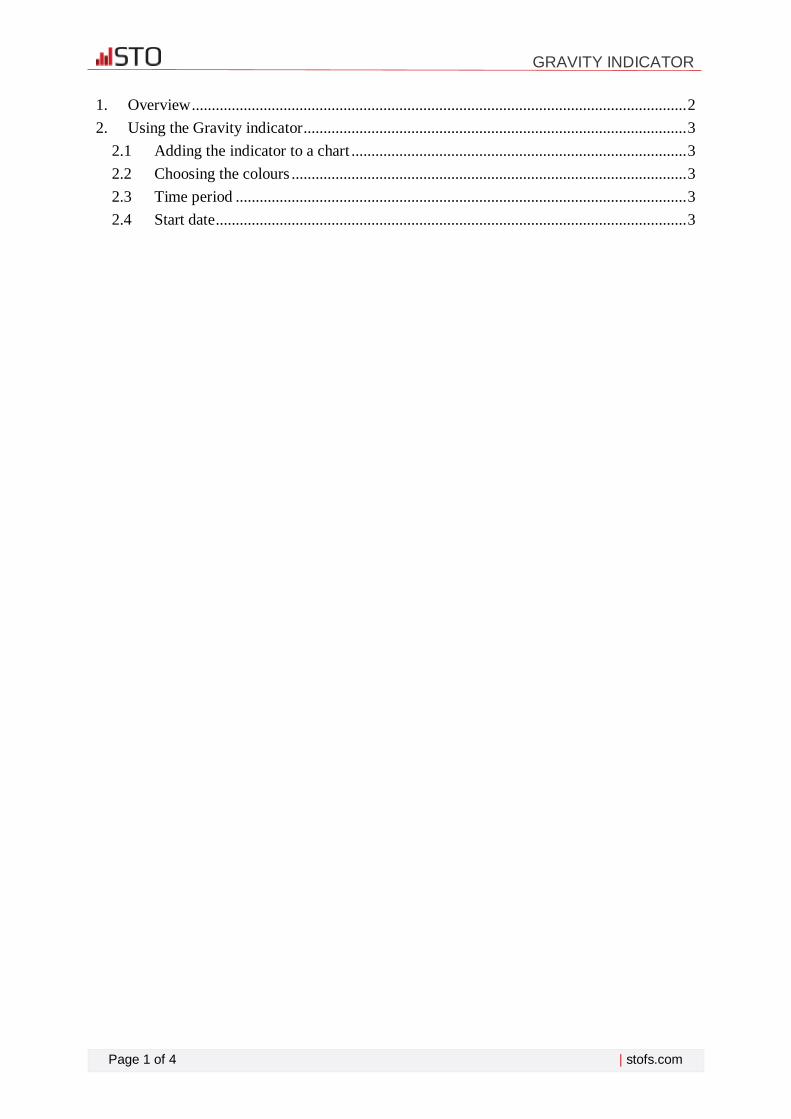
The Gravity indicator shows areas of possible support and resistance based on previous price
action, colour-coded to show areas of stronger and weaker market activity.
It can either just draw from the current time onwards, using all the price activity to date, or
you can set a specific start time in order to test the indicator or to ignore recent price
movements.
Page 3 of 4 | stofs.com
GRAVITY INDICATOR
2. Using the Gravity indicator
2.1 Adding the indicator to a chart
You add the Gravity indicator to a chart in the usual MT4 way, either by dragging it from the
Navigator onto a chart, or by double-clicking on it in the Navigator. You can also use
standard MT4 features such as adding the indicator to your list of Favorites, or assigning a
Hotkey to it.
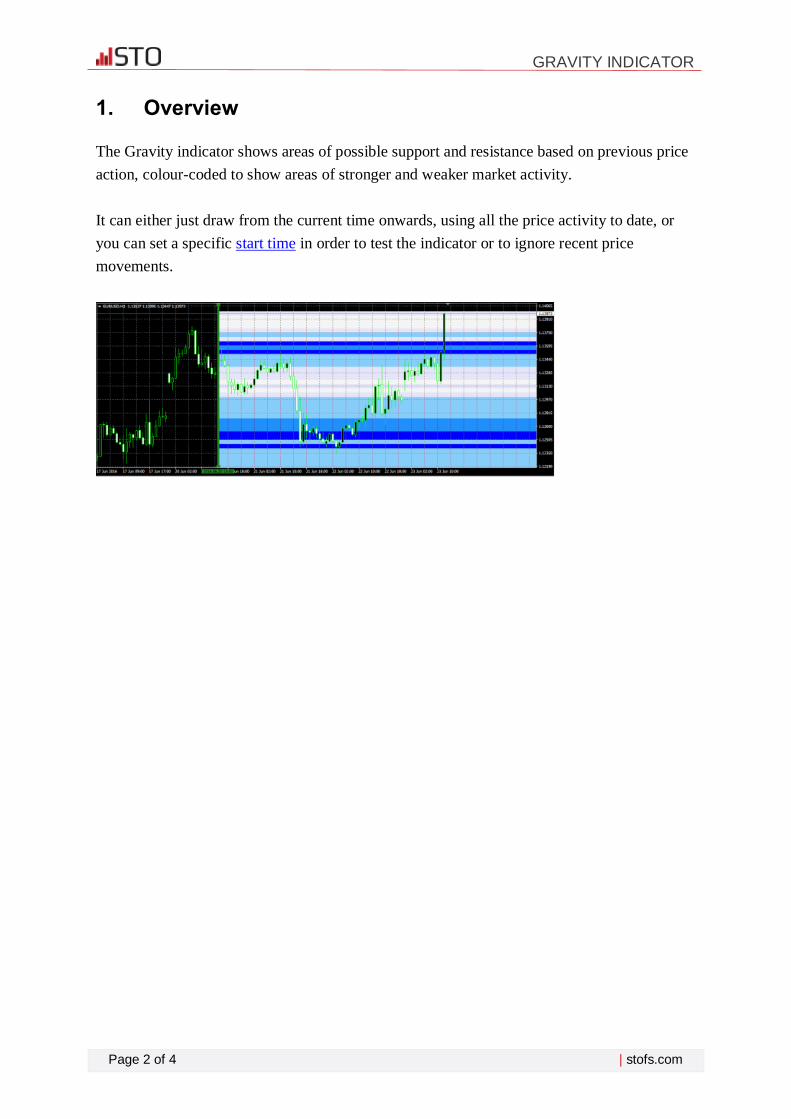
You need to turn on the “Allow DLL imports” setting in the “Common” tab of the indicator’s
options:
2.2 Choosing the colours
The Gravity indicator is colour-coded, showing areas of stronger support/resistance in darker
colours. You can adjust the colours using the settings on the Inputs tab.
2.3 Time period
The Gravity indicator has two modes. By default it will show a relatively long-term
assessment of support and resistance. For short-term trading, e.g. intra-day trading using an
M5 or M15 chart, you can also use the Inputs tab to tell the Gravity indicator to use a shorter-
term calculation.
2.4 Start date
By default the Gravity indicator will show a future indication of support and resistance using
price activity right up until the current time.
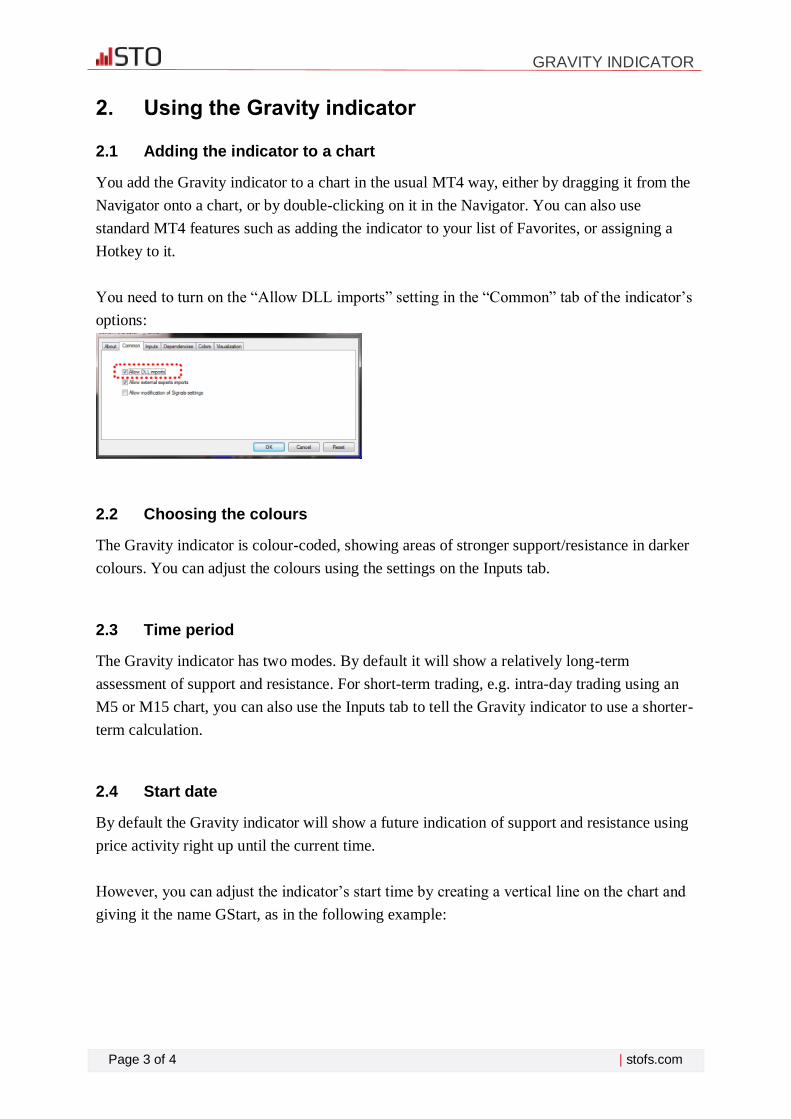
However, you can adjust the indicator’s start time by creating a vertical line on the chart and
giving it the name GStart, as in the following example:
Page 4 of 4 | stofs.com
GRAVITY INDICATOR
The indicator will then only use the price action up until the start time, without looking into
the future at what subsequently happened, and will draw its support and resistance calculation
starting from the line.
You can use this either to test the indicator, seeing how reliable it would have been in the
past, or as a way of telling the indicator to ignore recent price activity which you may regard
as abnormal and irrelevant. (The spike in the most recent bar in the screenshot at the start of
this document shows the market’s anticipation of the UK Brexit referendum in June 2016.)

Trading CFDs & FX involves significant risk of loss
www.stofs.com