Embed Size (px)
Citation preview

Gravity Data from the San Pedro River Basin, Cochise County, Arizona
By Jeffrey R. Kennedy and Daniel Winester
Open-File Report 2011–1287
U.S. Department of the Interior U.S. Geological Survey

U.S. Department of the Interior KEN SALAZAR, Secretary
U.S. Geological Survey Marcia K. McNutt, Director
U.S. Geological Survey, Reston, Virginia 2011
For product and ordering information:
World Wide Web: http://www.usgs.gov/pubprod
Telephone: 1-888-ASK-USGS
For more information on the USGS—the Federal source for science about the Earth,
its natural and living resources, natural hazards, and the environment:
World Wide Web: http://www.usgs.gov
Telephone: 1-888-ASK-USGS
Suggested citation:
Kennedy, J.R., Winester, D., 2011, Gravity data from the San Pedro River Basin, Cochise County,
Arizona: U.S. Geological Survey Open-File Report 2011–1287, 11 p. and data files, available at
http://pubs.usgs.gov/of/2011/1287/.
Any use of trade, product, or firm names is for descriptive purposes only and does not imply
endorsement by the U.S. Government.
Although this report is in the public domain, permission must be secured from the individual
copyright owners to reproduce any copyrighted material contained within this report.

iii
Contents
Abstract ............................................................................................................................................ 1 Introduction ....................................................................................................................................... 1 Acknowledgments ............................................................................................................................ 1 Gravity and Anomaly Values ............................................................................................................ 2 Gravity Differences over Time .......................................................................................................... 4
GPS Heights ................................................................................................................................. 5 Absolute-Gravity Measurements ................................................................................................... 8 Uncertainty .................................................................................................................................... 9
References Cited ............................................................................................................................ 11
Appendixes
1. Gravity, free-air anomaly, simple Bouguer anomaly, and complete Bouguer anomaly values (http://pubs.usgs.gov/of/2011/1287/of2011-1287_appendixes)
2. Gravity differences over time in the Upper San Pedro Basin (http://pubs.usgs.gov/of/2011/1287/of2011-1287_appendixes)
3. Absolute gravity measurements (http://pubs.usgs.gov/of/2011/1287/of2011-1287_appendixes)
4. Site descriptions for absolute gravity stations and their excenters located near Benson, Palominas, and Tombstone (http://pubs.usgs.gov/of/2011/1287/of2011-1287_appendixes/of2011-1287_appendix4.pdf).
Figures
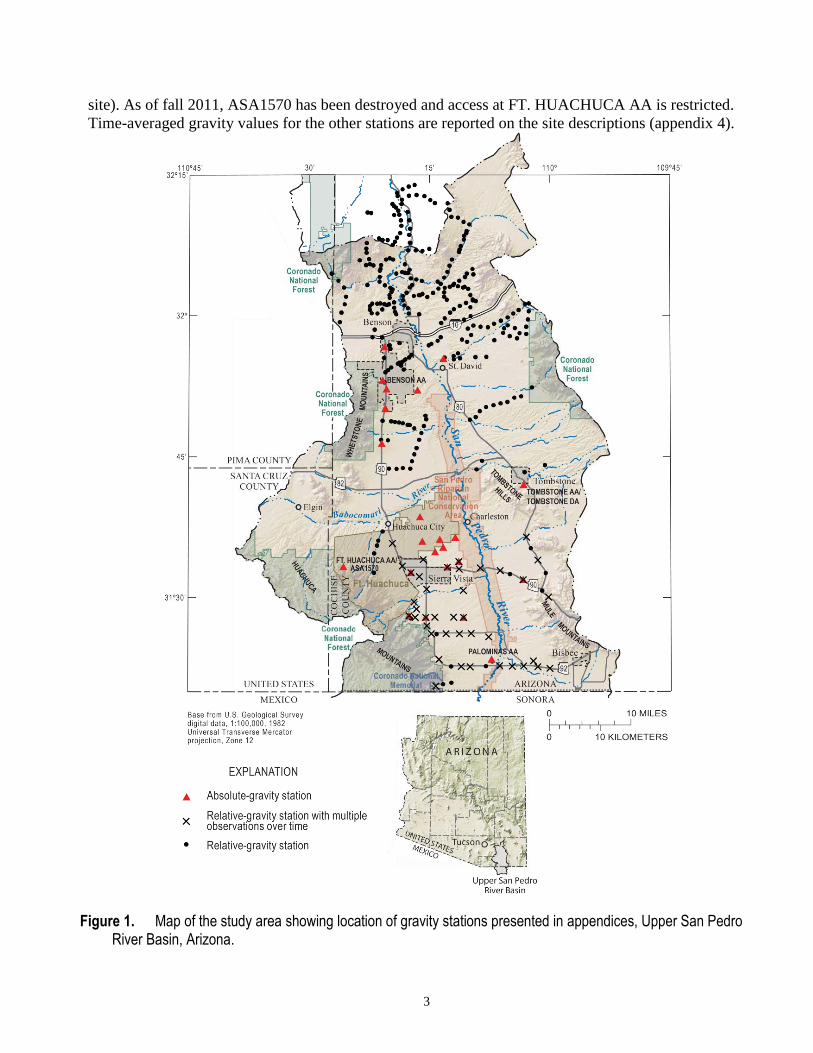
1. Map of the study area showing location of gravity stations presented in appendices, Upper San Pedro River Basin, Arizona. ................................................................................................ 3
2. Method used to calculate gravity differences and standard deviation from repeat observations. (M., measurement; Diff., gravity difference) ......................................................... 5
3. Map of the southern part of the study area showing GPS stations occupied in 2002 and 2009. .......................................................................................................................................... 7
Table 1. Global Positioning System (GPS) derived ellipsoid heights for selected gravity stations,
San Pedro River Basin, Arizona. [Accuracy reported at 95 percent confidence level; height is relative to GRS80 ellipsoid; NA, GPS data not available for this station; --, station height fixed during network adjustment] ................................................................................................ 8

iv
Conversion Factors
Multiply By To obtain
Length
centimeter (cm) 0.3937 inch (in.)
meter (m) 3.281 foot (ft)
kilometer (km) 0.6214 mile (mi)
meter (m) 1.094 yard (yd)
Acceleration
microGal (μGal) 10 nanometer/second2 (nm/s
2)
microGal (μGal) 0.328 x 10⁻⁹
feet/second2 (ft/s
2)

Gravity Data from the San Pedro River Basin, Cochise County, Arizona
By Jeffrey Kennedy, U.S. Geological Survey, and Daniel Winester, National Geodetic Survey
Abstract
The U.S. Geological Survey, Arizona Water Science Center in cooperation with the National
Oceanic and Atmospheric Administration, National Geodetic Survey has collected relative and absolute
gravity data at 321 stations in the San Pedro River Basin of southeastern Arizona since 2000. Data are
of three types: observed gravity values and associated free-air, simple Bouguer, and complete Bouguer
anomaly values, useful for subsurface-density modeling; high-precision relative-gravity surveys
repeated over time, useful for aquifer-storage-change monitoring; and absolute-gravity values, useful as
base stations for relative-gravity surveys and for monitoring gravity change over time. The data are
compiled, without interpretation, in three spreadsheet files. Gravity values, GPS locations, and driving
directions for absolute-gravity base stations are presented as National Geodetic Survey site descriptions.
Introduction
Gravity data have been collected using relative and absolute gravimeters at 321 stations in the
San Pedro Basin in southeast Arizona for use in subsurface density modeling and monitoring of aquifer
storage change over time. In the Benson Subwatershed part of the basin, data were collected at 272
stations for use in a subsurface density model. Six individual absolute-gravimeter stations, measured
biannually, also have been established in this area for the purpose of monitoring aquifer-storage change,
with the earliest starting in 2000. A 45-station network in the Sierra Vista Subwatershed part of the
basin has been surveyed biannually, starting in 2005, for the purpose of monitoring aquifer-storage
change. Redundant relative-gravimeter measurements tied to absolute-gravimeter measurements in this
area provide well-constrained gravity-change data. GPS observations at or near most stations provide
precise positioning and elevation control.
Acknowledgments
Many individuals have contributed to the data presented. Bruce Gungle, Donald Pool, David
Schmerge, John Fleming, Carl Anderson, Emmet McGuire, and Nate Blomgren have all contributed to
relative-gravity surveys. Paul Gettings, Felipe Caldeira, and Kyle Withers collected GPS data. Robert
Carruth has provided valuable assistance in collecting A10 data, as has Roy Anderson with FG5
surveys. Fort Huachuca (U.S. Army), Agricultural Research Service, Palominas Fire District, Kartchner
Caverns State Park, and many private landowners have generously provided access to gravity stations.

2
Gravity and Anomaly Values
Gravity data (appendix 1) are derived from three sources. First, relative-gravity observations at
272 sites (fig. 1) were collected by the U.S. Geological Survey (USGS) in the Benson Subwatershed in
2005 and 2006 using LaCoste and Romberg D-209 and D-127 meters equipped with analog feedback
and Aliod nulling systems, respectively. These systems allow for increased accuracy by nulling the
beam by means of an electronic feedback mechanism, displaying the gravity value on an LCD display
rather than requiring reading through the eye piece. Gravity measurements were made relative to an
absolute-gravity excenter (BENSON CA) established by the National Geodetic Survey (NGS) at
Kartchner Caverns State Park and a secondary base station established by USGS with an A10 absolute
gravimeter near the intersection of Interstate 10 and State Highway 90. The purpose of this data
collection was to develop a hydrogeologic framework for the Benson Subwatershed (Dickinson and
others, 2010). Observations were first corrected for earth-tide variation using the Berger tide model
(Micro-g LaCoste, Inc., 2001), followed by correction for meter drift by repeatedly occupying a
common base station and assuming a linear drift rate. One hundred forty of these stations were located
using post-processed differential GPS, with an average ellipsoid height accuracy of 0.67 m. The
remaining stations were positioned using autonomous GPS, with a nominal ellipsoid height accuracy of
about 10 m. However, when autonomous GPS elevations are compared to elevations obtained from a 10
m digital elevation model (DEM) of the region, the mean absolute error is 2.54 m.
Relative-gravity observations collected for aquifer storage-change monitoring at 45 sites in the
Upper San Pedro Basin, primarily using a LaCoste and Romberg relative gravimeter (D-209), are the
second source of gravity data (appendix 2). These observations are made relative to three of the absolute
gravimeter stations (or their excenters) established by NGS (FT. HUACHUCA AA, TOMBSTONE AA,
PALOMINAS AA) (fig. 1). A single gravity value for each station is determined from a least-squares
network adjustment of the December 2009 survey. Vertical positions for most stations are determined
with about ±2 cm accuracy from differential GPS surveys. Further details about gravity observations
over time are presented in the next section.
Observations at 26 sites (appendix 3) made using Micro-g LaCoste, Inc., portable free-fall
absolute gravimeters (numbers FG5-102 and A10-008; FG5-102 was originally manufactured by Axis
Instruments, Inc.) are the third source of gravity data. These meters directly measure the acceleration of
a test mass falling in a vacuum as tracked by laser interferometry. Corrections are applied for earth
tides, ocean loading, polar motion, and barometric pressure. For the FG5, the gravity value at the
instrument height (131 cm) is transferred to the land surface using a vertical gradient measured with
LaCoste and Romberg D-17 and D-43 relative gravimeters equipped with analog feedback nulling
systems. At A10 sites, the gravity value at the land surface is estimated by subtracting the instrument
height (71.7 cm) multiplied by the free-air gradient (-3.086 µGal/cm), or -221 µGal, from the measured
gravity value. Further details about absolute gravity observations are presented in the “Absolute Gravity
Measurements” section.
Each FG5 site has an associated absolute excenter, an outdoor station which provides an
accessible monument for GPS and relative-gravity surveys. Gravity values at excenters are determined
by using the same LaCoste and Romberg relative gravimeters used in gradient measurements. The
excenters were located using GPS (with NGS OPUS solutions) while the FG5 operated simultaneously
indoors. These absolute gravimeter sites and excenters are FT. HUACHUCA AA (absolute), FT.
HUACHUCA 1570 (also known as ASA1570, excenter and later A10 site), BENSON AA (absolute),
BENSON CA (excenter), PALOMINAS AA (absolute), PALOMINAS DA (excenter), TOMBSTONE
AA (absolute), TOMBSTONE CA (excenter), and TOMBSTONE DA (second excenter and later A10
3
site). As of fall 2011, ASA1570 has been destroyed and access at FT. HUACHUCA AA is restricted.
Time-averaged gravity values for the other stations are reported on the site descriptions (appendix 4).
Figure 1. Map of the study area showing location of gravity stations presented in appendices, Upper San Pedro River Basin, Arizona.

4
Formulae used to derive gravity anomalies are consistent with established standards (Hinze and
others, 2005, equations 2, 5, 6, and 7). Theoretical gravity on the ellipsoid was determined by using the
1980 International Gravity Formula (IGF) in the Somigliana closed form, and the free-air correction was
determined by using the Heiskanen and Moritz formula. The Bouguer correction, including the Bullard
spherical cap correction, was performed assuming an earth radius of 6,371 km, a crustal density of 2,670
kg∙m
-3, and the Newtonian gravitational constant 6.673 x 10
-11 m
3kg
-1s
-2. Ellipsoid height is used
throughout. Outer terrain corrections were calculated to a distance of 167 km, and inner terrain
corrections were calculated to 895 m, using 250 m and 10 m digital elevation models, respectively
(Geosoft, 2010). Corpscon software (U.S. Army Corps of Engineers, 2010) and GEOID03 were used to
convert from ellipsoid height to NAVD88 elevation and from geographic coordinates to projected UTM
NAD83 coordinates (appendix 1).
Gravity Differences over Time
Gravity change over time provides a direct measurement of aquifer storage change (Pool and
Eychaner, 1995). High-precision, relative-gravimeter measurements have been collected for this
purpose in the Sierra Vista Subwatershed of the Upper San Pedro Basin. Raw measurements and tide-
and drift-corrected gravity differences from 2000 through 2010 are presented in appendix 2. To ensure a
high level of precision, surveys done for aquifer storage-change monitoring are performed in two
“loops” using the station order A-B-C-D-E-A-B-C-D-E-A. If instrument drift is not sufficiently linear,
the loop may be repeated a third time. The maximum number of stations in a loop is 6, and the
maximum distance between stations is about 3 km. Nearly all surveys have been done using the same
station order within a loop and with the same gravimeter (D-209). Corrections for instrument drift and
tidal effects are performed in the field during a survey using a portable computer running Microsoft
Windows Mobile and Excel Mobile. The Mobile Excel file is converted to a standard excel file upon
transfer to a PC and is archived in the Arizona Water Science Center gravity-data database.
In the field, average gravity values from the gravimeter analog feedback system are read at one-
minute intervals and entered into the appropriate cell in the Excel Mobile worksheet. The analog
feedback calibration generally is checked against the gravimeter screw calibration at least once per
survey and adjusted as needed. Earth tide values for the appropriate day are preloaded in the Excel
workbook, so that a tide-corrected gravity value is obtained instantly. After a station is occupied two or
more times, a linear drift value is calculated, and gravity differences between each station pair are
calculated by interpolating the drift rate between occupations (fig. 2). Standard deviation is calculated
from multiple observations of the gravity difference between two stations. The criterion for accepting a
survey is a standard deviation of ±5 µGal or less between all station pairs.

5
Figure 2. Method used to calculate gravity differences and standard deviation from repeat observations. (M., measurement; Diff., gravity difference)
Gravity stations for aquifer-storage monitoring are located at geodetic survey marks established
by the Arizona Department of Transportation, the U.S. Army Electronic Proving Ground, Cochise
County, and the USGS. These latter stations typically are constructed by encasing rebar or sectional
rods, driven to refusal, within 0.4-m-diameter concrete forms dug to 0.6 m depth.
GPS Heights
As indicated by repeat GPS surveys, land-surface-elevation change does not appear to be
significant within the basin and no gravity correction for this effect is made. Static GPS surveys were
carried out in fall 2002 and spring 2009 to evaluate ground movement as a result of subsidence or uplift
at aquifer storage-change monitoring gravity stations. Continuously Operating Reference Stations
(CORS) were used to determine point positions in the NAD83(CORS96) reference frame. During the
2002 survey, only a single CORS station operated by the City of Tucson, COT1, was available within
150 km of the project area. By 2009, the additional CORS stations COT2 (City of Tucson) and AZCO
(Cochise County, located in Bisbee) had been established and are included in the network adjustment.
The 2002 survey was done using Trimble 4800 receivers in September and October 2002. GPS
receivers were stationed for the duration of the survey on adjustable-height tripods at two benchmarks in
the subwatershed, TW7 (Test Well 7 on Fort Huachuca) and Cochise Base (a brass cap at the Cochise
County Surveyor’s Office) (fig. 3). A third receiver on a 2 m fixed-height tripod was used to occupy
each of the gravity stations at approximately one hour intervals. During the survey, high winds caused
the receiver setup at TW7 to be unstable, so it was relocated to TW7A. Cochise Base was destroyed
when the mark AMARILLAS was constructed at nearly the same location in 2003.
The 2009 survey was done from March 18–20, 2009. A combination of Trimble 4700, 4800,
5700, 5800, and R6 receivers were used. Receivers were stationed on adjustable-height tripods and

6
tribrachs for the duration of the survey at TW7A, AMARILLAS (about 200 m southeast of AZCO), and
ASA1570 (fig. 3). Three to four additional receivers, using 2 m fixed-height tripods, were rotated
between 14 gravity stations during the survey. The survey was designed to provide maximum precision
at a smaller number of stations rather than lesser precision at a greater number of stations. Trimble
Business Center software was used for baseline processing and network adjustment. Precise
ephemerides and a 13 degree elevation mask were used.
Final GPS positions were determined through baseline processing and network adjustment.
Because of longer occupations, more receivers, and more CORS stations, point accuracies are higher for
the 2009 survey than for the 2002 survey (table 1). For the 2009 survey, CORS stations COT1, COT2,
and AZCO were held fixed. The positions of these stations were determined by using the published
positions and Horizontal Time-Dependent Positioning (HTDP) software from the National Geodetic
Survey (2009). In translating from the 2002.00 epoch published position for these positions to a 2009.22
epoch (March 20, 2009), point positions for the three CORS stations were shifted approximately 0.009
m north, 0.008 m east, and -0.007 m up. Station position accuracies for the 2009 survey are between
0.010 m and 0.025 m.
Only one CORS station was available for control during the 2002 survey. As noted earlier, one
of the two stations where receivers were located for the duration of the survey was destroyed in 2003.
To compensate for the lack of local control, the adjusted position for station TW7A from the 2009
survey was used as control for the 2002 survey. The position of TW7A was adjusted from the 2009.22
epoch to the 2002.00 epoch by using HTDP. Because of the lack of control, the network-adjusted
accuracy of station positions in the 2002 survey is worse than in the 2009 survey, ranging from 0.074 to
0.454 m. In addition, three stations (ASH, DAPALO, and H4) were positioned using only a single
baseline, with an attendant decrease in accuracy.
For nearly all of the stations occupied in both the 2002 and 2009 surveys, the difference in
ellipsoid height from 2002 to 2009 is within the accuracy of the GPS measurement (table 1). Height
differences range from 0.193 to -0.207 m. Only stations FLYING and DAPALO show a height
difference greater than the GPS accuracy. Furthermore, interferogram analysis of InSAR satellite
images between November 2007 and April 2010 show no significant elevation change in the
Subwatershed (Brian Conway, Arizona Department of Water Resources, written commun., 2010).
Therefore, the height of gravity stations is assumed to be constant during the data-collection period, and
no adjustments to the observed gravity values owing to height change have been made.

7
Figure 3. Map of the southern part of the study area showing GPS stations occupied in 2002 and 2009.

8
Table 1. Global Positioning System (GPS) derived ellipsoid heights for selected gravity stations, San Pedro River Basin, Arizona. [Accuracy reported at 95 percent confidence level; height is relative to GRS80 ellipsoid; NA, GPS data not available for this station; --, station height fixed during network adjustment]
Station 2002 Height,
in meters
Accuracy,
in meters
2009 Height,
in meters
Accuracy,
in meters
Difference,
2009 height minus
2002 height,
in meters
ASA1570 1589.191 0.101 1589.067 0.023 -0.124
ASA988 1338.197 0.159 1338.244 0.020 0.047
ASH 1512.225 0.4541 1512.418 0.023 0.193
AZCO NA NA 1474.166 -- NA
BUSBY 1383.176 0.081 1383.233 0.015 0.057
BYPASS 1335.022 0.074 1335.037 0.018 0.015
COT1 734.116 -- 734.109 -- -0.0072
COT2 NA NA 759.726 -- NA
FLYING 1330.057 0.155 1329.850 0.018 -0.207
H4 1345.589 0.0231 1345.585 0.017 -0.004
PALOMINAS DA 1266.637 0.0311 1266.693 0.020 0.056
R2 1419.617 0.085 1419.568 0.020 -0.049
R6 1310.685 0.094 1310.678 0.016 -0.007
RAMSEY 1523.614 0.127 1523.630 0.025 0.016
TIGER 1322.465 0.102 1322.442 0.024 -0.023
TW7A 1301.769 -- 1301.762 0.010 -0.0072
1Station had only a single observed baseline and was not included in network adjustment. Error represents vertical
precision at 95 percent confidence level for a single baseline.
Difference in height is a result of station velocity in the NAD83(CORS) datum as determined by HTDP software.
Absolute-Gravity Measurements
Absolute gravity data (appendix 3) have been collected at 26 stations (fig. 1) by using Micro-g
LaCoste, Inc., free-fall absolute gravimeters. These meters use a length scale determined by a laser
interferometer and a time scale determined by a rubidium oscillator. A spring mechanism isolates the
interferometer from long-period seismic noise. With the FG5, about 2,400 drops are made during a 24-
hour period so that any residual tidal effects are effectively canceled. With the A10, about 1,000 drops
are made during a 30 minute period. With both instruments, measurement sets may be removed from
final processing by visual inspection if they are not consistent with other sets. Nominal accuracy is ±2
µGal for the FG5 and ±10 µGal for the A10. Earth tide corrections for absolute-gravity measurements
are determined using the ETGTAB model with the default wave groups in the Micro-g Lacoste
software. Ocean-loading corrections are determined using the FES2004 model, produced by Legos and
CLS Space Oceanography Division and distributed by Aviso, with support from Cnes
(http://www.aviso.oceanobs.com). Polar motion corrections were determined using coordinates provided
by the U.S. Naval Observatory. The barometric pressure correction is calculated using measured
barometric pressure and an admittance factor of 0.3 µGal/mBar.
Three absolute gravity stations were established in 2000–2001 by NGS using an FG5 absolute
gravimeter and were measured twice annually between 2000 and 2007. The USGS has continued to

9
make measurements at two of these sites by using an A10 portable absolute gravimeter; measurements
at the third site (ASA1570) have been made at the outdoor excenter because of access issues with the
original site (Note: ASA1570 was destroyed between winter 2010 and fall 2011). The remaining 23
sites were established by the USGS between 2005 and 2009, using both existing and newly built
monuments. In some instances geodetic monuments established for survey control were modified to
facilitate the A10 gravimeter by building a 0.5 m by 0.5 m by 0.1 m deep concrete pad surrounding the
monument. Stations on the East Range of Fort Huachuca (HUBBARD, MW3-MW6, TW9) are located
at concrete well pads. Concurrent water-level measurements made at these sites allow estimation of
specific yield. At most sites, the meter is set up directly on a concrete surface; at some sites this is not
possible and a short tripod is used.
Absolute gravimeters use the local vertical-gravity gradient to calculate a gravity value from
observed interferometry data, and to transfer gravity values from the instrument height to the survey
mark. Local gradients may differ from the free-air gradient owing to local topographic and density
effects. For FG5 measurement sites and some A10 sites, gradients are measured with LaCoste and
Romberg gravimeters. Surveys are between 131 cm height and the survey mark and between 91 cm and
the mark. The gradient is calculated as the gravity interval divided by the height interval. Repeatable
surveys are averaged at each station. Measured gradients are used at A10 measurement sites ASA1570,
AAPALO, and DATOMB. At all other A10 sites, a standard -3.0 μGal/cm has been used. If the vertical
gradient does not change over time, the use of a standard gradient does not cause a decrease in precision
when repeat A10 measurements are compared. Gravity values in appendix 4 are reported at the
respective instrument heights, corrected for setup height. All FG5 gravity values (including
uncertainties) are reported at 131 cm over survey mark, and all A10 values are reported at 71.7 cm, the
most recent instrument height (this height varies within 1 cm during routine maintenance). In
appendices 1 and 4, the gravity values are reported at survey mark height.
Uncertainty
The lack of an unchanging observable standard presents a fundamental challenge to assessing
the accuracy of gravity instruments. Unlike instruments used to make other field measurements—such
as tapes for depth-to-water measurements—gravimeters can’t be calibrated against an exact
metrological standard because Earth’s gravitational field is changing continually in unknown ways.
Nonetheless, some metrics can be used to evaluate the uncertainty in gravity measurements.
The calibration procedure for the LaCoste and Romberg relative gravimeters involves placing a
series of small test masts on the beam to produce a plot of the calibration curve at different points along
the screw (Valliant, 1991). Once defined, the calibration curve is scaled to gravity units by repeat
observations over a 242 mGal gravity range at Cloudcroft, New Mexico. This range is known to be too
small by a few parts in 10,000 (Valliant, 1991), but this affects primarily the instrument’s absolute
accuracy rather than the repeatability. When using gravity data to assess aquifer-storage change,
repeatability is of primary concern. Because the observed-gravity changes over time are small—less
than 100 µGal (100 parts per billion)—any small error in accuracy will have an almost negligible effect
on interpretation of the data. Furthermore, because the same relative gravimeter (D209) has been used
for all of the repeat surveys presented here, any bias in gravimeter accuracy is constant over time. The
analog feedback nulling systems on D17 and D43 used for FG5 gradients and excenter ties were
calibrated by observing between nearby absolute-gravimeter sites at Table Mountain Geophysical
Observatory, Longmont, Colorado.
An additional source of error in spring-based relative gravimeters is circular, or screw, error that
arises from small imperfections in machining the micrometer screw that adjusts the spring (Valliant,

10
1991). To minimize circular error, all repeat relative gravimeter readings are taken using an identical
dial position (with the position indicator pointing to zero), at the dial setting that allows the analog
feedback system to be nearest zero.
Uncertainty in relative-gravity measurements (appendix 2), as indicated by the standard
deviation, is calculated from two or more measurements of the difference in gravity between stations
occupied on successive survey loops. It is calculated as the measurement standard deviation, rather than
the standard deviation of the mean. Therefore, it is a statistical measure of uncertainty, rather than a
propagation-of-error measure based on the measurement accuracy of each individual measurement at
each gravity station. The propagation-of-error method is not easily done with the analog feedback
system because the output on the LCD display is fairly heavily damped, masking the high-frequency
signal that is available on some other gravimeter feedback systems and is used as an indication of the
uncertainty of an individual measurement. The standard deviation for a particular gravity difference
presented is based on only two or three difference measurements, which cannot be considered
independent because they are close together in time and use overlapping station occupations to
determine a linear drift rate; it should therefore be considered an inexact estimator of uncertainty.
Nonetheless, this standard deviation is useful for evaluating the relative uncertainty between different
surveys.
Uncertainty in absolute-gravimeter measurements (appendix 3) arises from both instrumental
and environmental sources. For the FG5, uncertainty has been determined by using both an error budget
approach (Niebauer and others, 1995) and by comparing absolute-gravity measurements to the signal
from a superconducting gravimeter (Van Camp and others, 2005), and generally is 1 to 2 µGal. Summed
in quadrature, instrumental sources of uncertainty for the FG5 in total are about 1.1 µGal (Niebauer and
others, 1995). Instrument uncertainty for the A10 is less well known. The published accuracy from the
manufacturer is 10 µGal; five years of repeat observations at the USGS building in Tucson, Arizona,
however, including a comparison of A10 measurements with superconducting gravimeter data over a
period of 1 year, suggests that the instrument uncertainty at a quiet site is better than 5 µGal.
Repeatability from observations at the 2003 International Comparison of Absolute Gravimeters for A10-
008 was 2.9±1.5 µGal (Schmerge and Francis, 2006). Therefore, the uncertainty reported here assumes
a 5 µGal instrumental uncertainty for the A10. Even at this smaller level, A10 instrument uncertainty is
by far the largest source of uncertainty and is the dominant factor in overall measurement uncertainty.
For both the FG5 and A10, an additional 0.05 µGal uncertainty is associated with the laser
wavelength (which determines the falling mass position), and a 0.5 µGal uncertainty is associated with
the rubidium oscillator frequency (which determines the time of free-fall). Environmental uncertainties
associated with modeling Earth tides and ocean loading are about 0.1 percent and 10 percent,
respectively, and uncertainties associated with barometric pressure (both measurement error and
admittance-factor error) and polar motion are about 1 µGal and 0.05 µGal, respectively. System setup
uncertainty is estimated at 1.0 µGal for the FG5 and 3.0 µGal for the A10.
The final uncertainty source considered in absolute-gravity measurements is set scatter, which is
determined from the drop-to-drop scatter of the several hundred individual drops that compose a single
measurement. It is the only uncertainty component that varies between measurements, and as such,
offers the best metric from which to evaluate the uncertainty of any particular measurement relative to
other measurements. Drop-to-drop scatter is 40 to 200 µGal for the A10 and 20 to 80 µGal for the FG5,
and primarily is affected by seismic noise. Measurement precision is determined from set scatter as (set
scatter)*(number of sets)-1/2
. The reported uncertainty is the quadrature sum of instrumental uncertainty,
environmental uncertainty, setup uncertainty, and measurement precision.
11
References Cited
Dickinson, J.E., Kennedy, J.R., Pool, D.R., Cordova, J.T., Parker, J.T., Macy, J.P., and Thomas, B.,
2010, Hydrogeologic framework of the middle San Pedro watershed, southeastern Arizona: U.S.
Geological Survey Scientific Investigations Report 2010–5126, 36 p.
Geosoft, Inc., 2010. Oasis montaj, GM-SYS, GM-SYS 3D, and gravity and terrain correction software.
Hinze, W.J., Aiken, C., Brozena, J., Coakley, B., Dater, D., Flanagan, G., Forsberg, R., Hildenbrand, T.,
Keller, G.R., Kellogg, J., Kucks, R., Lee, X., Mainville, A., Morin, R., Pilkington, M., Plouff,
D., Ravat, D., Roman, D., Urrutia-Fucugauchi, J., Véronneau, M., Webring, M., and Winester,
D., 2005, New standards for reducing gravity data—The North American gravity database:
Geophysics, v. 70, no. 4, p. J25–J32.
Micro-g LaCoste, Inc., 2001, QuickTide software, http://microglacoste.com/quicktide.htm (last accessed
May 2, 2011).
National Geodetic Survey, 2009. HTDP–Horizontal time dependent positioning software,
http://www.ngs.noaa.gov/TOOLS/Htdp/Htdp.shtml (last accessed May 2, 2011).
Niebauer, T.M., Sasagawa, G.S., Faller, J.E., Hilt, R., and Klopping, F, 1995, A new generation of
absolute gravimeters: Metrologia, v. 32, p. 159–180.
Pool, D.R., and Eychaner, J.H, 1995, Measurements of aquifer-storage change and specific yield using
gravity surveys: Ground Water, v. 33, p. 425–432.
Schmerge, D., and Francis, O., 2006. Set standard deviation, repeatability, and offset of absolute
gravimeter A10-008: Metrologia, v. 43, p. 414–418.
U.S. Army Corps of Engineers, 2010. Corpscon Version 6.0,
http://crunch.tec.army.mil/software/corpscon/corpscon.html (last accessed May 2, 2011).
Valliant, H.D., 1991, Gravity meter calibration at LaCoste and Romberg: Geophysics, v. 56, no. 5, p.
705–711.
Van Camp, M., Williams, S.D.P., and Francis, O., 2005, Uncertainty of absolute gravity measurements:
Journal of Geophysical Research, v. 110, B05406.