Embed Size (px)
Citation preview
Robin White Siobhan Murray Mark Rohweder
Grassland Ecosystems
PILOT ANALYSIS OF GLOBAL ECOSYSTEMS
P I L O T A N A L Y S I S O F G L O B A L E C O S Y S T E M S
GrasslandEcosystems
RRRRROBINOBINOBINOBINOBIN P P P P P. W. W. W. W. WHITEHITEHITEHITEHITE
SSSSSIOBHANIOBHANIOBHANIOBHANIOBHAN M M M M MURRAURRAURRAURRAURRAYYYYY
MMMMMARKARKARKARKARK R R R R ROHWEDEROHWEDEROHWEDEROHWEDEROHWEDER

CAROL ROSENCAROL ROSENCAROL ROSENCAROL ROSENCAROL ROSEN
PUBLICATIONS DIRECTOR
HYHYHYHYHYACINTH BILLINGSACINTH BILLINGSACINTH BILLINGSACINTH BILLINGSACINTH BILLINGS
PRODUCTION MANAGER
MAGGIE POWELL AND KAMAGGIE POWELL AND KAMAGGIE POWELL AND KAMAGGIE POWELL AND KAMAGGIE POWELL AND KATHY DOUCETTETHY DOUCETTETHY DOUCETTETHY DOUCETTETHY DOUCETTE
COVER DESIGN AND LAYOUT
MELISSA EDEBURNMELISSA EDEBURNMELISSA EDEBURNMELISSA EDEBURNMELISSA EDEBURN
EDITING
Copyright © 2000 World Resources Institute. All rights reserved.
ISBN: 1-56973-461-5
Library of Congress Card No. 00-111019
Printed in the United States of America on chlorine-free paper with
recycled content of 50%, 20% of which is post-consumer.
Photo Credits:Cover: Digital Imagery © Copyright 2000 PhotoDisc, Inc.; African savannaSmaller Ecosystem Photos: Forests: Digital Vision, Ltd.; Agriculture: Philippe Berry, IFPRI;
Grasslands: PhotoDisc; Freshwater: Dennis A. Wentz; Coastal: Digital Vision, Ltd.Prologue: Bruce G. Stumpf © Copyright 1999-2000; Grasslands of the Masai Mara, KenyaGrassland Extent and Change, Digital Stock Corporation © Copyright 1996; WildebeestFood, Forage, and Livestock: Digital Vision Ltd.; Cattle herding.Biodiversity: R. P. White; Upland SandpiperCarbon Storage: © 1999 FEC; Burning mesquite-tobosagrass rangelandTourism and Recreation: IUCN-The World Conservation Union, 1999; Tourist bus inSerengeti.
Each World Resources Institute report represents a timely, scholarly treat-ment of a subject of public concern. WRI takes responsibility for choosingthe study topic and guaranteeing its authors and researchers freedom of
inquiry. It also solicits and responds to guidance of advisory panels andexpert reviewers. Unless otherwise stated, however, all the interpretationand findings set forth in WRI publications are those of the authors.
P i l o t A n a l y s i s o f G l o b a l E c o s y s t e m s
GrasslandEcosystems
RRRRROBINOBINOBINOBINOBIN P P P P P. W. W. W. W. WHITEHITEHITEHITEHITE
SSSSSIOBHANIOBHANIOBHANIOBHANIOBHAN M M M M MURRAURRAURRAURRAURRAYYYYY
MMMMMARKARKARKARKARK R R R R ROHWEDEROHWEDEROHWEDEROHWEDEROHWEDER
Published by World Resources InstituteWashington, DC
This report is also available at http://www.wri.org/wr2000
WWWWWith analytical contributions frith analytical contributions frith analytical contributions frith analytical contributions frith analytical contributions from:om:om:om:om:Stephen D. Prince, University of Maryland, Geography Department
Kirsten M.J. Thompson, World Resources Institute

i v P i l o t A n a l y s i s o f G l o b a l E c o s y s t e m s
Pilot Analysis ofGlobal Ecosystems (PAGE)
A series of five technical reports, available in print and on-line athttp://www.wri.org/wr2000.
A G R O E C O S Y S T E M SStanley Wood, Kate Sebastian, and Sara J. Scherr, Pilot Analysis of Global Ecosystems:
Agroecosystems, A joint study by International Food Policy Research Institute and World
Resources Institute, International Food Policy Research Institute and World Resources
Institute, Washington D.C.
November 2000 / paperback / ISBN 1-56973-457-7 / US$20.00
COASTAL ECOSYSTEMSLauretta Burke, Yumiko Kura, Ken Kassem, Mark Spalding, Carmen Revenga, and
Don McAllister, Pilot Analysis of Global Ecosystems: Coastal Ecosystems, World Resources
Institute, Washington D.C.
November 2000 / paperback / ISBN 1-56973-458-5 / US$20.00
FOREST ECOSYSTEMSEmily Matthews, Richard Payne, Mark Rohweder, and Siobhan Murray, Pilot Analysis
of Global Ecosystems: Forest Ecosystems, World Resources Institute, Washington D.C.
October 2000 / paperback / ISBN 1-56973-459-3 / US$20.00
FRESHWATER SYSTEMSCarmen Revenga, Jake Brunner, Norbert Henninger, Ken Kassem, and Richard Payne
Pilot Analysis of Global Ecosystems: Freshwater Systems, World Resources Institute,
Washington D.C.
October 2000 / paperback / ISBN 1-56973-460-7 / US$20.00
GRASSLAND ECOSYSTEMSRobin White, Siobhan Murray, and Mark Rohweder, Pilot Analysis of Global Ecosystems:
Grassland Ecosystems, World Resources Institute, Washington D.C.
November 2000 / paperback / ISBN 1-56973-461-5 / US$20.00
The full text of each report will be available on-line at the time of publication. Printedcopies may be ordered by mail from WRI Publications, P.O. Box 4852, HampdenStation, Baltimore, MD 21211, USA. To order by phone, call 1-800-822-0504 (withinthe United States) or 410-516-6963 or by fax 410-516-6998. Orders may also beplaced on-line at http://www.wristore.com.
The agroecosystem report is also available at http://www.ifpri.org. Printed copies maybe ordered by mail from the International Food Policy Research Institute, Communica-tions Service, 2033 K Street, NW, Washington, D.C. 20006-5670, USA.
Project ManagementNorbert Henninger, WRI
Walt Reid, WRI
Dan Tunstall, WRI
Valerie Thompson, WRI
Arwen Gloege, WRI
Elsie Velez-Whited, WRI
AgroecosystemsStanley Wood, International Food
Policy Research Institute
Kate Sebastian, International Food
Policy Research Institute
Sara J. Scherr, University of
Maryland
Coastal EcosystemsLauretta Burke, WRI
Yumiko Kura, WRI
Ken Kassem, WRI
Mark Spalding, UNEP-WCMC
Carmen Revenga, WRI
Don McAllister, Ocean Voice
International
Forest EcosystemsEmily Matthews, WRI
Richard Payne, WRI
Mark Rohweder, WRI
Siobhan Murray, WRI
Freshwater SystemsCarmen Revenga, WRI
Jake Brunner, WRI
Norbert Henninger, WRI
Ken Kassem, WRI
Richard Payne, WRI
Grassland EcosystemsRobin White, WRI
Siobhan Murray, WRI
Mark Rohweder, WRI
G r a s s l a n d E c o s y s t e m s v
FOREWORD ............................................................................................................................................................................ viii
ACKNOWLEDGMENTS ............................................................................................................................................................. x
INTRODUCTION TO THE PILOT ANALYSIS OF GLOBAL ECOSYSTEMS ............................................................................. 1
GRASSLAND ECOSYSTEMS: EXECUTIVE SUMMARY ........................................................................................................ ..1
Scope of AnalysisKey Findings and Information IssuesConclusionsRecommendations for Future Grassland Assessments
PROLOGUE: GRASSLAND ECOSYSTEMS—WHY THEY MATTER, HOW THEY’RE DOING ........................................... ..7
GRASSLAND EXTENT AND CHANGE ................................................................................................................................... 11
A Working Definition of GrasslandsExtent of Global Grassland CoverGlobal Grassland Cover: Information Status and Needs
FOOD, FORAGE, AND LIVESTOCK ....................................................................................................................................... 29
Global Grassland Production of Food, Forage, and LivestockTrends in Grassland Production of Food, Forage, and LivestockGrassland Modification to Produce Food, Forage, and LivestockCapacity of Grasslands to Sustain Production of Food, Forage, and LivestockGrassland Production of Food, Forage, and Livestock: Information Status and Needs
BIODIVERSITY ........................................................................................................................................................................ 39
The Diversity of GrasslandsTrends in Grassland BiodiversityHuman Modification of Grassland BiodiversityCapacity of Grasslands to Sustain BiodiversityGrassland Biodiversity: Information Status and Needs
CARBON STORAGE ................................................................................................................................................................ 49
Grassland Storage of CarbonCarbon Stores in Grasslands and Other Terrestrial EcosystemsHuman Modification of Grassland Carbon StoresCapacity of Grasslands to Maintain or Increase Terrestrial Carbon StoresGrassland Carbon Storage: Information Status and Needs
TOURISM AND RECREATION ................................................................................................................................................ 55
Grasslands as Tourist and Recreational AttractionsTrends in Grassland Tourism and RecreationGrassland Modification to Support Tourism and RecreationCapacity of Grasslands to Sustain Tourism and RecreationGrassland Tourism and Recreation: Information Status and Needs
Contents
v i P I L O T A N A LY S I S O F G L O B A L E C O S Y S T E M S
ABBREVIATIONS AND UNITS ................................................................................................................................................ 63
REFERENCES .......................................................................................................................................................................... 65
TABLES
Table 1. Ideal Indicators of Grassland Condition ............................................................................................................. .8Table 2. Grassland Extent, Goods and Services, and Indicators ....................................................................................... .9Table 3. Extent of the World’s Grasslands ........................................................................................................................ 12Table 4. Ecosystem Area and Population ......................................................................................................................... 13Table 5. Grassland Types of the World ............................................................................................................................. 14Table 6. World Regions, PAGE Grassland Area, and Population ..................................................................................... 15Table 7. Top Countries for Grassland Area ....................................................................................................................... 16Table 8. Top Countries for Percent of Grassland Area ...................................................................................................... 17Table 9. Grasslands within Aridity Zones ........................................................................................................................ 18Table 10. Conversion of Historical Grassland Areas ........................................................................................................ 20Table 11. Conversion of Grassland Ecoregions ................................................................................................................ 21Table 12. Decline in Prairies of Central North America ................................................................................................... 22Table 13. PAGE Grasslands and Soil Degradation Using Extent and Degree Classes from GLASOD .............................. 31Table 14. Livestock in Developing Countries with Extensive Grassland .......................................................................... 34Table 15. Two Views of Grassland Degradation in Mongolia ............................................................................................ 36Table 16. Ecosystems and Protected Area ....................................................................................................................... 44Table 17. Estimated Range of Total Carbon Storage by Ecosystem .................................................................................. 51Table 18. Global Estimates of Annual Amounts of Biomass Burning ............................................................................... 52Table 19. International Inbound Tourists in Countries with Extensive Grassland ............................................................ 57Table 20. International Tourism Receipts in Countries with Extensive Grassland ........................................................... 58
FIGURES
Figure 1. Goods and Services Provided by Grasslands .................................................................................................... .8Figure 2. Grassland Watersheds of the World .................................................................................................................. 18Figure 3. Percent Woody Vegetation in Grasslands .......................................................................................................... 19Figure 4. Untilled Landscapes in the Great Plains ........................................................................................................... 23Figure 5. General Representation of the Rain-Use Efficiency Index .............................................................................. 32Figure 6. Trends in Rain-Use Efficiency in Southern Africa ........................................................................................... 33Figure 7. Inner Asia ......................................................................................................................................................... 35Figure 8. Two Perceptions of Grassland Degradation in Mongolia ................................................................................... 37Figure 9. Biologically Distinct Grassland Ecoregions ...................................................................................................... 41Figure 10. Key Threatened Bird Areas in the Neotropics ................................................................................................ 46Figure 11. Habitats of Key Threatened Bird Areas .......................................................................................................... 47Figure 12. Principal Pools in a Savanna Carbon Cycle .................................................................................................... 50Figure 13. An International Perspective on Trophy Hunting ............................................................................................ 59
BOXES
Box 1. Caribou Migrations and Calving Grounds: Globally Outstanding Ecological Phenomena ..................................... 42Box 2. Threatened Tall-Grassland Birds of Continental North America ........................................................................... 45Box 3. Valuing a Fynbos Ecosystem ................................................................................................................................. 48Box 4. Miombo Woodlands and Carbon Sequestration ..................................................................................................... 53Box 5. Ecotourism and Conservation: Are They Compatible? .......................................................................................... 60

G r a s s l a n d E c o s y s t e m s vii
MAPS .......................................................................................................................................................................................... 70
Map 1. Global Extent of GrasslandMap 2. Grasslands and Aridity ZonesMap 3. Percent Woody Vegetation in GrasslandsMap 4. Major Grassland Habitat TypesMap 5. Agricultural Mosaics and GrasslandsMap 6. Fires and GrasslandsMap 7. Central and North America: Fragmentation and Wildlife ExploitationMap 8. Global Net Primary Productivity of Grasslands (1982-1993)Map 9. Global Variation in Grassland Net Primary Productivity (1982-1993)Map 10. Southern Africa: Rain-Use Efficiency (1981-1993)Map 11. Global Livestock DensityMap 12. Africa: Cattle DensityMap 13. Endemic Bird Areas and Centers of Plant Diversity in GrasslandsMap 14. Global 200: Grassland EcoregionsMap 15. Protected Areas and GrasslandsMap 16. North America: Non-Native Plant Species in GrasslandsMap 17. Grassland Bird Populations: Density and TrendsMap 18. Botswana: Grassland FragmentationMap 19. The Great Plains: Grassland FragmentationMap 20. Global Carbon Storage in Above- and Below-Ground Live VegetationMap 21. Global Carbon Storage in SoilsMap 22. Global Carbon Storage in Above- and Below-Ground Live Vegetation and Soils

viii P I L O T A N A LY S I S O F G L O B A L E C O S Y S T E M S
Foreword
Earth’s ecosystems and its peoples are bound together in agrand and complex symbiosis. We depend on ecosystems tosustain us, but the continued health of ecosystems depends,in turn, on our use and care. Ecosystems are the productiveengines of the planet, providing us with everything from thewater we drink to the food we eat and the fiber we use forclothing, paper, or lumber. Yet, nearly every measure we useto assess the health of ecosystems tells us we are drawing onthem more than ever and degrading them, in some cases atan accelerating pace.
Our knowledge of ecosystems has increased dramaticallyin recent decades, but it has not kept pace with our ability toalter them. Economic development and human well-being willdepend in large part on our ability to manage ecosystemsmore sustainably. We must learn to evaluate our decisions onland and resource use in terms of how they affect the capac-ity of ecosystems to sustain life — not only human life, butalso the health and productive potential of plants, animals,and natural systems.
A critical step in improving the way we manage the earth’secosystems is to take stock of their extent, their condition,and their capacity to provide the goods and services we willneed in years to come. To date, no such comprehensive as-sessment of the state of the world’s ecosystems has been un-dertaken.
The Pilot Analysis of Global Ecosystems (PAGE) beginsto address this gap. This study is the result of a remarkablecollaborative effort between the World Resources Institute(WRI), the International Food Policy Research Institute(IFPRI), intergovernmental organizations, agencies, researchinstitutes, and individual experts in more than 25 countriesworldwide. The PAGE compares information already avail-able on a global scale about the condition of five major classesof ecosystems: agroecosystems, coastal areas, forests, fresh-water systems, and grasslands. IFPRI led the agroecosystemanalysis, while the others were led by WRI. The pilot analy-sis examines not only the quantity and quality of outputs butalso the biological basis for production, including soil andwater condition, biodiversity, and changes in land use overtime. Rather than looking just at marketed products, such asfood and timber, the study also analyzes the condition of a
broad array of ecosystem goods and services that people need,or enjoy, but do not buy in the marketplace.
The five PAGE reports show that human action has pro-foundly changed the extent, condition, and capacity of allmajor ecosystem types. Agriculture has expanded at the ex-pense of grasslands and forests, engineering projects havealtered the hydrological regime of most of the world’s majorrivers, settlement and other forms of development have con-verted habitats around the world’s coastlines. Human activi-ties have adversely altered the earth’s most important bio-geochemical cycles — the water, carbon, and nitrogen cycles— on which all life forms depend. Intensive managementregimes and infrastructure development have contributedpositively to providing some goods and services, such as foodand fiber from forest plantations. They have also led to habi-tat fragmentation, pollution, and increased ecosystem vul-nerability to pest attack, fires, and invasion by non-nativespecies. Information is often incomplete and the picture con-fused, but there are many signs that the overall capacity ofecosystems to continue to produce many of the goods andservices on which we depend is declining.
The results of the PAGE are summarized in World Resources2000–2001, a biennial report on the global environment pub-lished by the World Resources Institute in partnership withthe United Nations Development Programme, the United Na-tions Environment Programme, and the World Bank. Theseinstitutions have affirmed their commitment to making theviability of the world’s ecosystems a critical development pri-ority for the 21st century. WRI and its partners began workwith a conviction that the challenge of managing earth’s eco-systems — and the consequences of failure — will increasesignificantly in coming decades. We end with a keen aware-ness that the scientific knowledge and political will requiredto meet this challenge are often lacking today. To make soundecosystem management decisions in the future, significantchanges are needed in the way we use the knowledge andexperience at hand, as well as the range of information broughtto bear on resource management decisions.
A truly comprehensive and integrated assessment of glo-bal ecosystems that goes well beyond our pilot analysis isnecessary to meet information needs and to catalyze regional

G r a s s l a n d E c o s y s t e m s i x
and local assessments. Planning for such a Millennium Eco-system Assessment is already under way. In 1998, represen-tatives from international scientific and political bodies be-gan to explore the merits of, and recommend the structurefor, such an assessment. After consulting for a year and con-sidering the preliminary findings of the PAGE report, theyconcluded that an international scientific assessment of thepresent and likely future condition of the world’s ecosystemswas both feasible and urgently needed. They urged local,national, and international institutions to support the effortas stakeholders, users, and sources of expertise. If concludedsuccessfully, the Millennium Ecosystem Assessment will gen-erate new information, integrate current knowledge, developmethodological tools, and increase public understanding.
Human dominance of the earth’s productive systems givesus enormous responsibilities, but great opportunities as well.The challenge for the 21st century is to understand the vul-nerabilities and resilience of ecosystems, so that we can findways to reconcile the demands of human development withthe tolerances of nature.
We deeply appreciate support for this project from theAustralian Centre for International Agricultural Research,The David and Lucile Packard Foundation, The NetherlandsMinistry of Foreign Affairs, the Swedish International Devel-opment Cooperation Agency, the United Nations Develop-ment Programme, the United Nations EnvironmentProgramme, the Global Bureau of the United States Agencyfor International Development, and The World Bank.
A special thank you goes to the AVINA Foundation, theGlobal Environment Facility, and the United Nations Fundfor International Partnerships for their early support of PAGEand the Millennium Ecosystem Assessment, which was in-strumental in launching our efforts.
JONATHAN LASH
PresidentWorld Resources Institute
x P I L O T A N A LY S I S O F G L O B A L E C O S Y S T E M S
The World Resources Institute and the International Foodand Research Institute would like to acknowledge the mem-bers of the Millennium Assessment Steering Committee, whogenerously gave their time, insights, and expert review com-ments in support of the Pilot Analysis of Global Ecosystems.
Edward Ayensu, Ghana; Mark Collins, United NationsEnvironment Programme-World Conservation MonitoringCentre (UNEP-WCMC), United Kingdom; Angela Cropper,Trinidad and Tobago; Andrew Dearing, World Business Coun-cil for Sustainable Development (WBCSD); Janos Pasztor,UNFCCC; Louise Fresco, FAO; Madhav Gadgil, Indian In-stitute of Science, Bangalore, India; Habiba Gitay, Austra-lian National University, Australia; Gisbert Glaser, UNESCO;Zuzana Guziova, Ministry of the Environment, Slovak Re-public; He Changchui, FAO; Calestous Juma, Harvard Uni-versity; John Krebs, National Environment Research Coun-cil, United Kingdom; Jonathan Lash, World Resources Insti-tute; Roberto Lenton, UNDP; Jane Lubchenco, Oregon StateUniversity; Jeffrey McNeely, World Conservation Union(IUCN), Switzerland; Harold Mooney, International Councilfor Science (ICSU); Ndegwa Ndiangui, Convention to Com-bat Desertification; Prabhu L. Pingali, CIMMYT; Per Pinstrup-Andersen, Consultative Group on International AgriculturalResearch; Mario Ramos, Global Environment Facility; PeterRaven, Missouri Botanical Garden; Walter Reid, Secretariat;Cristian Samper, Instituto Alexander Von Humboldt, Colom-bia; José Sarukhán, CONABIO, Mexico; Peter Schei, Direc-torate for Nature Management, Norway; Klaus Töpfer, UNEP;José Galízia Tundisi, International Institute of Ecology, Bra-zil; Robert Watson, World Bank; Xu Guanhua, Ministry ofScience and Technology, People’s Republic of China; A.H.Zakri, Universiti Kebangsaan Malaysia, Malaysia.
The Pilot Analysis of Global Ecosystems would not havebeen possible without the data provided by numerous insti-tutions and agencies. The authors of the grassland ecosystemanalysis wish to express their gratitude for the generous co-operation and invaluable information we received from thefollowing organizations.
BirdLife International; Carbon Dioxide Information Analy-sis Center (CDIAC), Oak Ridge National Laboratory(ORNL);Center for International Earth Science Information Network
(CIESIN); Environmental Systems Research Institute (ESRI);European Space Agency (ESA); Food and Agriculture Orga-nization of the United Nations (FAO); International LivestockResearch Institute (ILRI); International Soil Reference andInformation Centre (ISRIC); IUCN- The World ConservationUnion; National Oceanic and Atmospheric Administration -National Geophysical Data Center (NOAA-NGDC); The Na-ture Conservancy (TNC); Patuxent Wildlife Research Labo-ratory; Safari Club International; United Nations EnvironmentProgramme (UNEP); United States Geological Survey (USGS),Earth Resources Observation Systems (EROS) Data Center;University of Maryland, Geography Department; The WorldBank; World Conservation Monitoring Centre (WCMC); WorldWildlife Fund – U.S. (WWF-U.S.).
The authors also would like to express their gratitude tothe many individuals who contributed information and ad-vice, attended expert workshops, and reviewed successivedrafts of this report.Niels Batjes, International Soil Reference and InformationCentre;Roy H. Behnke, Overseas Development Institute;Daniel Binkley, Colorado State University;Jesslyn Brown, USGS, EROS Data Center;Virginia Dale, Oak Ridge National Laboratory;Ruth DeFries, University of Maryland, Geography Department;Andre DeGeorges, Safari Club International;Eric Dinerstein, WWF-US;James E. Ellis, Natural Resource Ecology Laboratory;Colorado State University;Chris Elvidge, NOAA-NGDC;Hari Eswaran, USDA, Natural Resources Conservation Service;Robert Friedman, The Heinz Center;Peter Gilruth, UNSO, United Nations Environment Program;Scott Goetz, University of Maryland, Geography Department;Patrick Gonzalez, USGS, Desertification and Climate Change;Paul Goriup, Nature Conservation Bureau, UK;Jon Haferman, The Nature Conservancy;David Hall, Kings College, London;Jeremy Harrison, World Conservation Monitoring Centre;Richard Houghton, Woods Hole Research Center;JoAnn House, Kings College, London;
Acknowledgments

G r a s s l a n d E c o s y s t e m s x i
John Kartesz, University of North Carolina, Chapel Hill;Anthony King, Oak Ridge National Laboratory;James Martin-Jones, World Wildlife Fund-US;Robin O’Malley, The Heinz Center;Wayne Ostlie, Weather Creek Conservation Consultants;Eric Rodenburg, USGS, Minerals and Materials Analysis;Osvaldo Sala, Ecology Department, University Buenos Aires;Fred Samson, US Forest Service;David Sneath, University of Cambridge;Alison Stattersfield, Birdlife International;Bruce Stein, The Nature Conservancy;Larry Tieszen, USGS, EROS Data Center;Emma Underwood, World Wildlife Fund-US;Thomas R. Vale, University of Wisconsin-Madison,Geography Department;David Wege, Birdlife International;Keith L. White, University of Wisconsin-Green Bay,Environmental Sciences;
Manuel Winograd, International Center for TropicalAgriculture.
We also wish to thank the many individuals at WRI andIFPRI who were generous with their help as this report pro-gressed: Elizabeth Berendt, Jake Brunner, Lauretta Burke,Allen Hammond, Lori Han, Tony Janetos, Ken Kassem, EmilyMatthews, Kenton Miller, Becky Milton, Gregory Mock, Chris-tian Ottke, Janet Overton, Carmen Revenga, Carol Rosen,Kate Sebastian,Valerie Thompson, Amy Wagener, and StanWood; as well as Armin Jess, Johnathon Kool, Yumiko Kura,and Wendy Vanasselt for their contibutions to maps, text boxes,and figures. We are particularly grateful to Arwen Gloege,Norbert Henninger, Walter Reid, and Dan Tunstall for theirdedication and guidance throughout the project. Specialthanks goes to Oretta Tarkhani for coordinating meetings andworkshops, Melissa Edeburn for her editorial guidance, andto Hyacinth Billings, Kathy Doucette, and Maggie Powell fortheir production expertise.
G r a s s l a n d E c o s y s t e m s I n t r o d u c t i o n / 1
I n t r o d u c t i o n t o t h e P A G E
Introduction to the Pilot Analysis of
Global Ecosystems
may not know of each other’s relevantfindings.
O B J E C T I V E SThe Pilot Analysis of Global Ecosystems(PAGE) is the first attempt to synthesizeinformation from national, regional, andglobal assessments. Information sourcesinclude state of the environment re-ports; sectoral assessments of agricul-ture, forestry, biodiversity, water, andfisheries, as well as national and glo-bal assessments of ecosystem extentand change; scientific research articles;and various national and internationaldatasets. The study reports on five ma-jor categories of ecosystems:♦ Agroecosystems;♦ Coastal ecosystems;♦ Forest ecosystems;♦ Freshwater systems;♦ Grassland ecosystems.
These ecosystems account for about90 percent of the earth’s land surface,excluding Greenland and Antarctica.PAGE results are being published as aseries of five technical reports, each cov-ering one ecosystem. Electronic versionsof the reports are posted on the Websiteof the World Resources Institute [http://www.wri.org/wr2000] and theagroecosystems report also is availableon the Website of the International FoodPolicy Research Institute [http://www/ifpri.org].
The primary objective of the pilotanalysis is to provide an overview of eco-system condition at the global and con-tinental levels. The analysis documents
the extent and distribution of the fivemajor ecosystem types and identifiesecosystem change over time. It analyzesthe quantity and quality of ecosystemgoods and services and, where dataexist, reviews trends relevant to the pro-duction of these goods and services overthe past 30 to 40 years. Finally, PAGEattempts to assess the capacity of eco-systems to continue to provide goodsand services, using measures of biologi-cal productivity, including soil andwater conditions, biodiversity, and landuse. Wherever possible, information ispresented in the form of indicators andmaps.
A second objective of PAGE is toidentify the most serious informationgaps that limit our current understand-ing of ecosystem condition. The infor-mation base necessary to assess ecosys-tem condition and productive capacityhas not improved in recent years, andmay even be shrinking as funding forenvironmental monitoring and record-keeping diminishes in some regions.
Most importantly, PAGE supports thelaunch of a Millennium Ecosystem As-sessment, a more ambitious, detailed,and integrated assessment of global eco-systems that will provide a firmer basisfor policy- and decision-making at thenational and subnational scale.
A N I N T E G R AT E D A P P R O A C H T OA S S E S S I N G E C O S Y S T E M G O O D SA N D S E R V I C E SEcosystems provide humans with awealth of goods and services, including
P E O P L E A N D E C O S Y S T E M SThe world’s economies are based on thegoods and services derived from ecosys-tems. Human life itself depends on thecontinuing capacity of biological pro-cesses to provide their multitude of ben-efits. Yet, for too long in both rich andpoor countries, development prioritieshave focused on how much humanitycan take from ecosystems, and too littleattention has been paid to the impact ofour actions. We are now experiencingthe effects of ecosystem decline in nu-merous ways: water shortages in thePunjab, India; soil erosion in Tuva, Rus-sia; fish kills off the coast of North Caro-lina in the United States; landslides onthe deforested slopes of Honduras; firesin the forests of Borneo and Sumatra inIndonesia. The poor, who often dependdirectly on ecosystems for their liveli-hoods, suffer most when ecosystems aredegraded.
A critical step in managing our eco-systems is to take stock of their extent,their condition, and their capacity tocontinue to provide what we need. Al-though the information available todayis more comprehensive than at any timepreviously, it does not provide a com-plete picture of the state of the world’secosystems and falls far short of man-agement and policy needs. Informationis being collected in abundance butefforts are often poorly coordinated.Scales are noncomparable, baselinedata are lacking, time series are incom-plete, differing measures defy integra-tion, and different information sources
I n t r o d u c t i o n / 2 P I L O T A N A LY S I S O F G L O B A L E C O S Y S T E M S
I n t r o d u c t i o n t o t h e P A G E
food, building and clothing materials,medicines, climate regulation, water pu-rification, nutrient cycling, recreationopportunities, and amenity value. Atpresent, we tend to manage ecosystemsfor one dominant good or service, suchas grain, fish, timber, or hydropower,without fully realizing the trade-offs weare making. In so doing, we may be sac-rificing goods or services more valuablethan those we receive — often thosegoods and services that are not yet val-ued in the market, such as biodiversityand flood control. An integrated ecosys-tem approach considers the entire rangeof possible goods and services a givenecosystem provides and attempts to op-timize the benefits that society can de-rive from that ecosystem and across eco-systems. Its purpose is to help maketrade-offs efficient, transparent, and sus-tainable.
Such an approach, however, presentssignificant methodological challenges.Unlike a living organism, which mightbe either healthy or unhealthy but can-not be both simultaneously, ecosystemscan be in good condition for producingcertain goods and services but in poorcondition for others. PAGE attempts toevaluate the condition of ecosystems byassessing separately their capacity toprovide a variety of goods and servicesand examining the trade-offs humanshave made among those goods and ser-vices. As one example, analysis of aparticular region might reveal that foodproduction is high but, because of irri-gation and heavy fertilizer application,the ability of the system to provide cleanwater has been diminished.
Given data inadequacies, this sys-tematic approach was not always fea-sible. For each of the five ecosystems,PAGE researchers, therefore, focus ondocumenting the extent and distributionof ecosystems and changes over time.We develop indicators of ecosystem con-dition — indicators that inform us about
the current provision of goods and ser-vices and the likely capacity of the eco-system to continue providing thosegoods and services. Goods and servicesare selected on the basis of their per-ceived importance to human develop-ment. Most of the ecosystem studies ex-amine food production, water qualityand quantity, biodiversity, and carbonsequestration. The analysis of forestsalso studies timber and woodfuel pro-duction; coastal and grassland studiesexamine recreational and tourism ser-vices; and the agroecosystem study re-views the soil resource as an indicatorof both agricultural potential and its cur-rent condition.
P A R T N E R S A N D T H E R E S E A R C HP R O C E S SThe Pilot Analysis of Global Ecosys-tems was a truly international collabo-rative effort. The World Resources In-stitute and the International FoodPolicy Research Institute carried outtheir research in partnership with nu-merous institutions worldwide (see Ac-knowledgments). In addition to thesepartnerships, PAGE researchers reliedon a network of international expertsfor ideas, comments, and formal re-views. The research process includedmeetings in Washington, D.C., attendedby more than 50 experts from devel-oped and developing countries. Themeetings proved invaluable in devel-oping the conceptual approach andguiding the research program towardthe most promising indicators giventime, budget, and data constraints.Drafts of PAGE reports were sent to over70 experts worldwide, presented andcritiqued at a technical meeting of theConvention on Biological Diversity inMontreal (June, 1999) and discussedat a Millennium Assessment planningmeeting in Kuala Lumpur, Malaysia(September, 1999). Draft PAGE mate-rials and indicators were also presented
and discussed at a Millennium Assess-ment planning meeting in Winnipeg,Canada, (September, 1999) and at themeeting of the Parties to the Conven-tion to Combat Desertification, held inRecife, Brazil (November, 1999).
K E Y F I N D I N G SKey findings of PAGE relate both to eco-system condition and the informationbase that supported our conclusions.
The Current State ofEcosys temsThe PAGE reports show that human ac-tion has profoundly changed the extent,distribution, and condition of all majorecosystem types. Agriculture has ex-panded at the expense of grasslands andforests, engineering projects have al-tered the hydrological regime of most ofthe world’s major rivers, settlement andother forms of development have con-verted habitats around the world’s coast-lines.
The picture we get from PAGE re-sults is complex. Ecosystems are in goodcondition for producing some goods andservices but in poor condition for pro-ducing others. Overall, however, thereare many signs that the capacity of eco-systems to continue to produce many ofthe goods and services on which we de-pend is declining. Human activitieshave significantly disturbed the globalwater, carbon, and nitrogen cycles onwhich all life depends. Agriculture, in-dustry, and the spread of human settle-ments have permanently converted ex-tensive areas of natural habitat and con-tributed to ecosystem degradationthrough fragmentation, pollution, andincreased incidence of pest attacks,fires, and invasion by non-native spe-cies.
The following paragraphs lookacross ecosystems to summarize trendsin production of the most important

G r a s s l a n d E c o s y s t e m s I n t r o d u c t i o n / 3
I n t r o d u c t i o n t o t h e P A G E
goods and services and the outlook forecosystem productivity in the future.
Food ProductionFood production has more than keptpace with global population growth. Onaverage, food supplies are 24 percenthigher per person than in 1961 and realprices are 40 percent lower. Productionis likely to continue to rise as demandincreases in the short to medium term.Long-term productivity, however, isthreatened by increasing water scarcityand soil degradation, which is now se-vere enough to reduce yields on about16 percent of agricultural land, espe-cially cropland in Africa and CentralAmerica and pastures in Africa. Irri-gated agriculture, an important compo-nent in the productivity gains of theGreen Revolution, has contributed towaterlogging and salinization, as well asto the depletion and chemical contami-nation of surface and groundwater sup-plies. Widespread use of pesticides oncrops has lead to the emergence of manypesticide-resistant pests and pathogens,and intensive livestock production hascreated problems of manure disposaland water pollution. Food productionfrom marine fisheries has risen sixfoldsince 1950 but the rate of increase hasslowed dramatically as fisheries havebeen overexploited. More than 70 per-cent of the world’s fishery resources forwhich there is information are now fullyfished or overfished (yields are static ordeclining). Coastal fisheries are underthreat from pollution, development, anddegradation of coral reef and mangrovehabitats. Future increases in productionare expected to come largely fromaquaculture.
Water QuantityDams, diversions, and other engineer-ing works have transformed the quan-tity and location of freshwater availablefor human use and sustaining aquatic
ecosystems. Water engineering has pro-foundly improved living standards, byproviding fresh drinking water, water forirrigation, energy, transport, and floodcontrol. In the twentieth century, waterwithdrawals have risen at more thandouble the rate of population increaseand surface and groundwater sources inmany parts of Asia, North Africa, andNorth America are being depleted.About 70 percent of water is used in ir-rigation systems where efficiency is of-ten so low that, on average, less than halfthe water withdrawn reaches crops. Onalmost every continent, river modifica-tion has affected the flow of rivers to thepoint where some no longer reach theocean during the dry season. Freshwa-ter wetlands, which store water, reduceflooding, and provide specializedbiodiversity habitat, have been reducedby as much as 50 percent worldwide.Currently almost 40 percent of theworld’s population experience seriouswater shortages. Water scarcity is ex-pected to grow dramatically in some re-gions as competition for water grows be-tween agricultural, urban, and commer-cial sectors.
Water QualitySurface water quality has improved withrespect to some pollutants in developedcountries but water quality in develop-ing countries, especially near urban andindustrial areas, has worsened. Water isdegraded directly by chemical or nutri-ent pollution, and indirectly when landuse change increases soil erosion or re-duces the capacity of ecosystems to fil-ter water. Nutrient runoff from agricul-ture is a serious problem around theworld, resulting in eutrophication andhuman health hazards in coastal regions,especially in the Mediterranean, BlackSea, and northwestern Gulf of Mexico.Water-borne diseases caused by fecalcontamination of water by untreatedsewage are a major source of morbidity
and mortality in the developing world.Pollution and the introduction of non-native species to freshwater ecosystemshave contributed to serious declines infreshwater biodiversity.
Carbon StorageThe world’s plants and soil organismsabsorb carbon dioxide (CO2) during pho-tosynthesis and store it in their tissues,which helps to slow the accumulationof CO2 in the atmosphere and mitigateclimate change. Land use change thathas increased production of food andother commodities has reduced the netcapacity of ecosystems to sequester andstore carbon. Carbon-rich grasslandsand forests in the temperate zone havebeen extensively converted to croplandand pasture, which store less carbon perunit area of land. Deforestation is itselfa significant source of carbon emissions,because carbon stored in plant tissue isreleased by burning and accelerateddecomposition. Forests currently storeabout 40 percent of all the carbon heldin terrestrial ecosystems. Forests in thenorthern hemisphere are slowly increas-ing their storage capacity as they regrowafter historic clearance. This gain, how-ever, is more than offset by deforesta-tion in the tropics. Land use changeaccounts for about 20 percent of anthro-pogenic carbon emissions to the atmo-sphere. Globally, forests today are a netsource of carbon.
BiodiversityBiodiversity provides many direct ben-efits to humans: genetic material for cropand livestock breeding, chemicals formedicines, and raw materials for indus-try. Diversity of living organisms and theabundance of populations of many spe-cies are also critical to maintaining bio-logical services, such as pollination andnutrient cycling. Less tangibly, but noless importantly, diversity in nature isregarded by most people as valuable in

I n t r o d u c t i o n / 4 P I L O T A N A LY S I S O F G L O B A L E C O S Y S T E M S
I n t r o d u c t i o n t o t h e P A G E
its own right, a source of aesthetic plea-sure, spiritual solace, beauty, and won-der. Alarming losses in globalbiodiversity have occurred over the pastcentury. Most are the result of habitatdestruction. Forests, grasslands, wet-lands, and mangroves have been exten-sively converted to other uses; only tun-dra, the Poles, and deep-sea ecosystemshave experienced relatively littlechange. Biodiversity has suffered asagricultural land, which supports far lessbiodiversity than natural forest, has ex-panded primarily at the expense of for-est areas. Biodiversity is also diminishedby intensification, which reduces thearea allotted to hedgerows, copses, orwildlife corridors and displaces tradi-tional varieties of seeds with modernhigh-yield, but genetically uniform,crops. Pollution, overexploitation, andcompetition from invasive species rep-resent further threats to biodiversity.Freshwater ecosystems appear to be themost severely degraded overall, with anestimated 20 percent of freshwater fishspecies becoming extinct, threatened, orendangered in recent decades.
In format ion Statusand Needs
Ecosystem Extent and Land UseCharacterizationAvailable data proved adequate to mapapproximate ecosystem extent for mostregions and to estimate historic changein grassland and forest area by compar-ing current with potential vegetationcover. PAGE was able to report only onrecent changes in ecosystem extent atthe global level for forests and agricul-tural land.
PAGE provides an overview of hu-man modifications to ecosystemsthrough conversion, cultivation,firesetting, fragmentation by roads anddams, and trawling of continentalshelves. The study develops a number
of indicators that quantify the degree ofhuman modification but more informa-tion is needed to document adequatelythe nature and rate of human modifica-tions to ecosystems. Relevant data at theglobal level are incomplete and someexisting datasets are out of date.
Perhaps the most urgent need is forbetter information on the spatial distri-bution of ecosystems and land uses. Re-mote sensing has greatly enhanced ourknowledge of the global extent of veg-etation types. Satellite data can provideinvaluable information on the spatialpattern and extent of ecosystems, ontheir physical structure and attributes,and on rates of change in the landscape.However, while gross spatial changes invegetation extent can be monitored us-ing coarse-resolution satellite data,quantifying land cover change at thenational or subnational level requireshigh-resolution data with a resolution oftens of meters rather than kilometers.
Much of the information that wouldallow these needs to be met, at both thenational and global levels, already ex-ists, but is not yet in the public domain.New remote sensing techniques and im-proved capabilities to manage complexglobal datasets mean that a completesatellite-based global picture of theearth could now be made available, al-though at significant cost. This informa-tion would need to be supplemented byextensive ground-truthing, involving ad-ditional costs. If sufficient resourceswere committed, fundamentally impor-tant information on ecosystem extent,land cover, and land use patterns aroundthe world could be provided at the levelof detail needed for national planning.Such information would also prove in-valuable to international environmentalconventions, such as those dealing withwetlands, biological diversity, desertifi-cation, and climate change, as well asthe international agriculture, forest, andfishery research community.
Ecosystem Condition and Capacityto Provide Goods and Services
In contrast to information on spatialextent, data that can be used to analyzeecosystem condition are often unavail-able or incomplete. Indicator develop-ment is also beset by methodologicaldifficulties. Traditional indicators, forexample, those relating to pressures onenvironments, environmental status, orsocietal responses (pressure-state-response model indicators) provide onlya partial view and reveal little about theunderlying capacity of the ecosystem todeliver desired goods and services.Equally, indicators of human modifica-tion tell us about changes in land use orbiological parameters, but do not nec-essarily inform us about potentially posi-tive or negative outcomes.
Ecosystem conditions tend to behighly site-specific. Information on ratesof soil erosion or species diversity in onearea may have little relevance to an ap-parently similar system a few miles away.It is expensive and challenging to moni-tor and synthesize site-specific data andpresent it in a form suitable for nationalpolicy and resource management deci-sions. Finally, even where data are avail-able, scientific understanding of howchanges in biological systems will affectgoods and services is limited. For ex-ample, experimental evidence showsthat loss of biological diversity tends toreduce the resilience of a system to per-turbations, such as storms, pest out-breaks, or climate change. But scien-tists are not yet able to quantify howmuch resilience is lost as a result of theloss of biodiversity in a particular siteor how that loss of resilience might af-fect the long-term production of goodsand services.
Overall, the availability and qualityof information tend to match the recog-nition accorded to various goods and ser-vices by markets. Generally good dataare available for traded goods, such as
G r a s s l a n d E c o s y s t e m s I n t r o d u c t i o n / 5
I n t r o d u c t i o n t o t h e P A G E
grains, fish, meat, and timber productsand some of the more basic relevant pro-ductivity factors, such as fertilizer ap-plication rates, water inputs, and yields.Data on products that are exchanged ininformal markets, or consumed directly,are patchy and often modeled. Examplesinclude fish landings from artisanal fish-eries, woodfuels, subsistence food cropsand livestock, and nonwood forest prod-ucts. Information on the biological fac-tors that support production of thesegoods — including size of fish spawn-ing stocks, biomass densities, subsis-tence food yields, and forest food har-vests — are generally absent.
The future capacity (long-term pro-ductivity) of ecosystems is influenced bybiological processes, such as soil forma-tion, nutrient cycling, pollination, andwater purification and cycling. Few ofthese environmental services have, asyet, been accorded economic value thatis recognized in any functioning market.There is a corresponding lack of sup-port for data collection and monitoring.This is changing in the case of carbonstorage and cycling. Interest in the pos-sibilities of carbon trading mechanismshas stimulated research and generatedmuch improved data on carbon storesin terrestrial ecosystems and the dimen-sions of the global carbon cycle. Fewcomparable datasets exist for elementssuch as nitrogen or sulfur, despite their
fundamental importance in maintainingliving systems.
Although the economic value of ge-netic diversity is growing, informationon biodiversity is uniformly poor.Baseline and trend data are largely lack-ing; only an estimated 15 to 20 percentof the world’s species have been identi-fied. The OECD Megascience Forumhas launched a new international pro-gram to accelerate the identification andcataloging of species around the world.This information will need to be supple-mented with improved data on speciespopulation trends and the numbers andabundance of invasive species. Devel-oping databases on population trends(and threat status) is likely to be a ma-jor challenge, because most countriesstill need to establish basic monitoringprograms.
The PAGE divides the world’s eco-systems to examine them at a globalscale and think in broad terms about thechallenges of managing themsustainably. In reality, ecosystems arelinked by countless flows of material andhuman actions. The PAGE analysis doesnot make a distinction between naturaland managed ecosystems; human inter-vention affects all ecosystems to somedegree. Our aim is to take a first steptoward understanding the collective im-pacts of those interventions on the fullrange of goods and services that ecosys-
tems provide. We conclude that we lackmuch of the baseline information nec-essary to determine ecosystem condi-tions at a global, regional or, in manyinstances, even a local scale. We alsolack systematic approaches necessary tointegrate analyses undertaken at differ-ent locations and spatial scales.
Finally, it should be noted that PAGElooks at past trends and current status,but does not try to project future situa-tions where, for example, technologicaldevelopment might increase dramati-cally the capacity of ecosystems to de-liver the goods and services we need.Such considerations were beyond thescope of the study. However, technolo-gies tend to be developed and appliedin response to market-related opportu-nities. A significant challenge is to findthose technologies, such as integratedpest management and zero tillage culti-vation practices in the case of agricul-ture, that can simultaneously offer mar-ket-related as well as environmentalbenefits. It has to be recognized, none-theless, that this type of “win-win” so-lution may not always be possible. Insuch cases, we need to understand thenature of the trade-offs we must makewhen choosing among different combi-nations of goods and services. At presentour knowledge is often insufficient to tellus where and when those trade-offs areoccurring and how we might minimizetheir effects.
G r a s s l a n d E c o s y s t e m s 1
E x e c u t i v e S u m m a r y
GGGGG R A S S L A N D SR A S S L A N D SR A S S L A N D SR A S S L A N D SR A S S L A N D S :::::EEEEE X E C U T I V EX E C U T I V EX E C U T I V EX E C U T I V EX E C U T I V E S S S S SU M M A RU M M A RU M M A RU M M A RU M M A RYYYYY
Scope of Analys isThis study, or Pilot Analysis of Global Ecosystems (PAGE), ex-amines grassland ecosystems of the world using a large collec-tion of spatial and temporal data. We analyze datasets primarilyat the global level, presenting quantitative indicators and quali-tative information on the condition of the world’s grasslands.Grassland condition is defined in terms of the current and fu-ture capacity of these ecosystems to provide goods and servicesimportant to humans.
GRASSLAND EXTENT, CHANGE , AND HUMANM O D I F I C AT I O NPAGE analysts define grasslands as terrestrial ecosystems domi-nated by herbaceous and shrub vegetation and maintained byfire, grazing, drought and/or freezing temperatures. This defini-tion includes vegetation covers with an abundance of non-woodyplants and thus lumps together some savannas, woodlands,shrublands, and tundra, as well as more conventional grass-lands. Our comprehensive view of grasslands allows us to makeuse of a variety of global datasets and to avoid somewhat arbi-trary distinctions among different land cover types. We exam-ine the spatial extent of grasslands and modifications that havealtered their extent, structure, and composition over time. Modi-fications include human-induced changes such as cultivation,urbanization, desertification, fire, livestock grazing, fragmen-tation, and introduction of invasive species.
GRASSLAND GOODS AND SERVICESThis analysis focuses on a selected set of grassland goods andservices. Our choice was determined partly in consultation withgrassland experts worldwide and partly by availability of data.Our goal was to use global datasets, preferably in electronicform, available spatially and with time-series. Where globaldata were not available, we used regional, national, and some-times sub-national studies. The data and indicators presented
in this report address the condition of the following goods andservices provided by grasslands:
♦ Food, forage, and livestock;♦ Biodiversity;♦ Carbon storage; and♦ Tourism and recreation.
Each good or service is discussed in terms of its current sta-tus, trends over time, and modifications that have changed itscondition. The good or service also is discussed in terms of thetype of data required to expand our knowledge about theecosystem’s ability to provide the service. When quantitativeindicators are available, we explore the potential to use them toevaluate the condition of grasslands. In other cases we presentqualitative measures of condition, sometimes based entirely onexpert opinion.
This study attempts to locate and draw together global, spa-tially represented databases on grassland ecosystems. It is notan exhaustive review of literature available on grassland types.Nor is it complete in its search for spatial datasets related tograssland ecosystems. Some important goods and services pro-vided by grasslands also have not been covered. For example,woodfuel, often collected from shrublands or savannas, is not dis-cussed in this report (but see the PAGE analysis on forest ecosys-tems), nor are the important services that grasslands provide interms of water and nutrient cycling. Rather, we present an exami-nation of many of the global datasets most readily accessible, andof quantitative and qualitative indicators that can be used as start-ing points for a more comprehensive, international effort to evalu-ate the condition of grassland ecosystems worldwide.
Key F indings and Informat ion I ssuesThe following tables (pp. 2-5) summarize key findings of thestudy regarding grassland condition and trends and the qualityand availability of data.
2 P I L O T A N A LY S I S O F G L O B A L E C O S Y S T E M S
E x e c u t i v e S u m m a r y
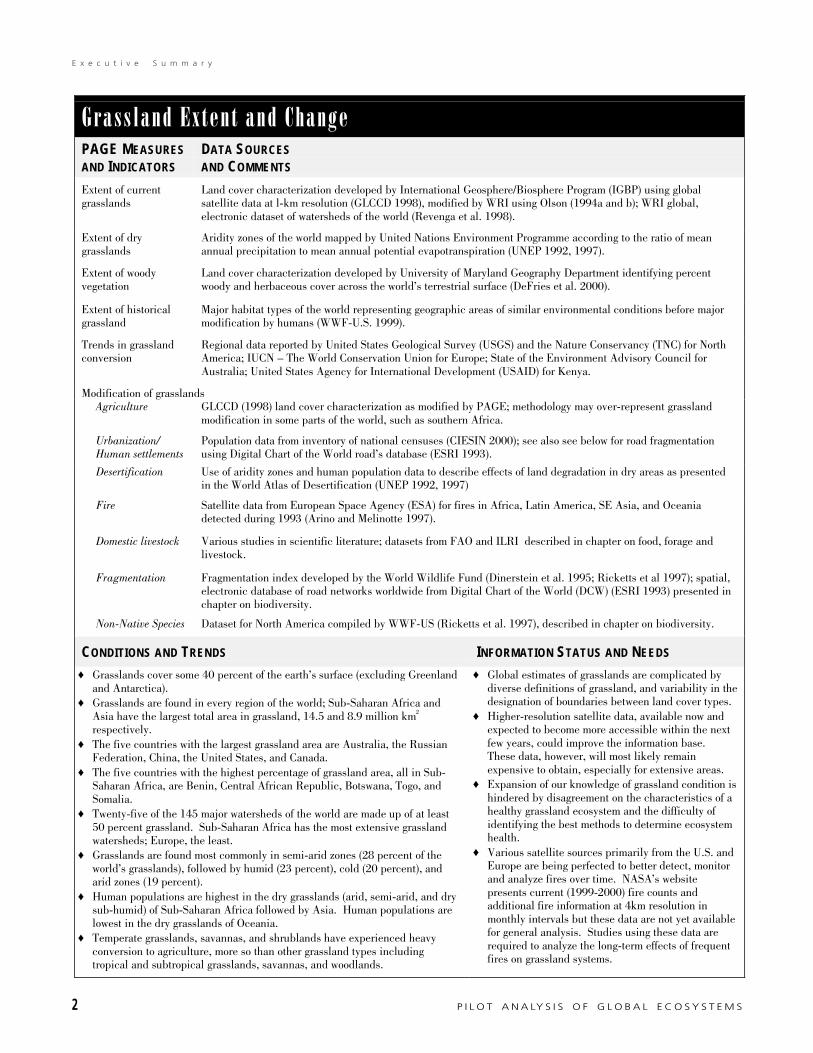
Grassland Extent and ChangePAGE MEASURESAND INDICATORS
DATA SOURCESAND COMMENTS
Extent of currentgrasslands
Land cover characterization developed by International Geosphere/Biosphere Program (IGBP) using globalsatellite data at l-km resolution (GLCCD 1998), modified by WRI using Olson (1994a and b); WRI global,electronic dataset of watersheds of the world (Revenga et al. 1998).
Extent of drygrasslands
Aridity zones of the world mapped by United Nations Environment Programme according to the ratio of meanannual precipitation to mean annual potential evapotranspiration (UNEP 1992, 1997).
Extent of woodyvegetation
Land cover characterization developed by University of Maryland Geography Department identifying percentwoody and herbaceous cover across the world’s terrestrial surface (DeFries et al. 2000).
Extent of historicalgrassland
Major habitat types of the world representing geographic areas of similar environmental conditions before majormodification by humans (WWF-U.S. 1999).
Trends in grasslandconversion
Regional data reported by United States Geological Survey (USGS) and the Nature Conservancy (TNC) for NorthAmerica; IUCN – The World Conservation Union for Europe; State of the Environment Advisory Council forAustralia; United States Agency for International Development (USAID) for Kenya.
Modification of grasslandsAgriculture GLCCD (1998) land cover characterization as modified by PAGE; methodology may over-represent grassland
modification in some parts of the world, such as southern Africa.
Urbanization/Human settlements
Population data from inventory of national censuses (CIESIN 2000); see also see below for road fragmentationusing Digital Chart of the World road’s database (ESRI 1993).
Desertification Use of aridity zones and human population data to describe effects of land degradation in dry areas as presentedin the World Atlas of Desertification (UNEP 1992, 1997)
Fire Satellite data from European Space Agency (ESA) for fires in Africa, Latin America, SE Asia, and Oceaniadetected during 1993 (Arino and Melinotte 1997).
Domestic livestock Various studies in scientific literature; datasets from FAO and ILRI described in chapter on food, forage andlivestock.
Fragmentation Fragmentation index developed by the World Wildlife Fund (Dinerstein et al. 1995; Ricketts et al 1997); spatial,electronic database of road networks worldwide from Digital Chart of the World (DCW) (ESRI 1993) presented inchapter on biodiversity.
Non-Native Species Dataset for North America compiled by WWF-US (Ricketts et al. 1997), described in chapter on biodiversity.
CONDITIONS AND TRENDS INFORMATION STATUS AND NEEDS
♦ Grasslands cover some 40 percent of the earth’s surface (excluding Greenlandand Antarctica).
♦ Grasslands are found in every region of the world; Sub-Saharan Africa andAsia have the largest total area in grassland, 14.5 and 8.9 million km2
respectively.♦ The five countries with the largest grassland area are Australia, the Russian
Federation, China, the United States, and Canada.♦ The five countries with the highest percentage of grassland area, all in Sub-
Saharan Africa, are Benin, Central African Republic, Botswana, Togo, andSomalia.
♦ Twenty-five of the 145 major watersheds of the world are made up of at least50 percent grassland. Sub-Saharan Africa has the most extensive grasslandwatersheds; Europe, the least.
♦ Grasslands are found most commonly in semi-arid zones (28 percent of theworld’s grasslands), followed by humid (23 percent), cold (20 percent), andarid zones (19 percent).
♦ Human populations are highest in the dry grasslands (arid, semi-arid, and drysub-humid) of Sub-Saharan Africa followed by Asia. Human populations arelowest in the dry grasslands of Oceania.
♦ Temperate grasslands, savannas, and shrublands have experienced heavyconversion to agriculture, more so than other grassland types includingtropical and subtropical grasslands, savannas, and woodlands.
♦ Global estimates of grasslands are complicated bydiverse definitions of grassland, and variability in thedesignation of boundaries between land cover types.
♦ Higher-resolution satellite data, available now andexpected to become more accessible within the nextfew years, could improve the information base.These data, however, will most likely remainexpensive to obtain, especially for extensive areas.
♦ Expansion of our knowledge of grassland condition ishindered by disagreement on the characteristics of ahealthy grassland ecosystem and the difficulty ofidentifying the best methods to determine ecosystemhealth.
♦ Various satellite sources primarily from the U.S. andEurope are being perfected to better detect, monitorand analyze fires over time. NASA’s websitepresents current (1999-2000) fire counts andadditional fire information at 4km resolution inmonthly intervals but these data are not yet availablefor general analysis. Studies using these data arerequired to analyze the long-term effects of frequentfires on grassland systems.

G r a s s l a n d E c o s y s t e m s 3
E x e c u t i v e S u m m a r y
Food , Forage, and LivestockPAGE MEASURESAND INDICATORS
DATA SOURCESAND COMMENTS
Soil degradation Global Assessment of the Status of Human-Induced Soil Degradation (GLASOD), spatial, electronic data at 1:10million; Soil Degradation Assessment for South and Southeast Asia (ASSOD) at 1:5 million (UNEP 1992 and1997).
Vegetation change Global satellite imagery; surface reflectance data from NOAA/AVHRR that provides the Normalized DifferenceVegetation Index (NDVI); various models using climate and vegetation data to analyze Net Primary Productivity(NPP); University of Maryland Geography Department’s Global Production Efficiency Model (GLOPEM); Rain-Use Efficiency (RUE) Index using data from rainfall stations to indicate regional trends (UNEP 1997; Cramerand Field 1999; Prince et al 1998; Goetz et al 1999).
Livestock densities Spatial, electronic data on livestock populations of the world (Lerner and Matthews 1988); regional spatialcoverage of Africa by country and other administrative units from the International Livestock Research Institute(ILRI) (Kruska et al.1995).
CONDITIONS AND TRENDS INFORMATION STATUS AND NEEDS
♦ Although much of the PAGE grassland area does not coincidewith mapping units that are degraded according to GLASODextent and degree classes, nearly 49 percent are lightly tomoderately degraded and at least 5 percent are consideredstrongly to extremely degraded.
♦ Satellite imagery has greatly expanded our ability to measuregrassland vegetation. Promising measures for determininggrassland condition are long-term trends in NDVI, NPP, andRUE.
♦ Trends in RUE provide a potential method of separatingvegetation declines due to lack of rainfall from declinesassociated with degradation. Combining this index with othermeasures, such as livestock densities, may increase our ability tomore accurately evaluate grassland condition.
♦ While some grasslands support high livestock densities,association of grassland condition with specific livestockdensities must be based in part on information about geographiclocation and management practices as well as on characteristicsof the soil, vegetation, and wildlife.
♦ Soil condition is key to evaluating grassland condition; GLASODprovides the only global database on soil degradation. It isheavily criticized, however, for relying on qualitative datainterpreted in different ways and produced at too large a scale forassessing degradation at the national level. ASSOD is animprovement over GLASOD, but its 1:5 million scale is still toocoarse on which to base national policies. We need a worldwidedigital database of soil degradation at 1:1 million backed up byfield reconnaissance.
♦ To take advantage of improved satellite data for monitoringvegetation change, we need continued evaluation of NPP models,compilation of long-term trends, and further evaluation of the useof additional indicators (such as RUE) in the assessment ofgrassland ecosystem condition.
♦ Relationships among meat production, livestock densities, andrangeland condition must be assessed with caution. They requireworldwide spatial data that differentiate feedlot from range-fedlivestock, identify management practices, and report populationlevels of all livestock—domestic and wild.

4 P I L O T A N A LY S I S O F G L O B A L E C O S Y S T E M S
E x e c u t i v e S u m m a r y
Biodiversi tyPAGE MEASURESAND INDICATORS
DATA SOURCESAND COMMENTS
Areas of designated importance
Centers of Plant Diversity Compilation of information on centers of plant diversity worldwide through fieldwork and expert judgment fromIUCN-The World Conservation Union, spatial, electronic database by World Wildlife Fund (WWF-U.S) (Daviset al 1994 and 1995).
Endemic Bird Areas Worldwide documentation of breeding ranges of restricted-range bird species developed by BirdlifeInternational through fieldwork and expert judgment (Stattersfield et al 1998).
Global 200 Ecoregions Designation of 200–plus ecoregions in the world by WWF-U.S., selected as outstanding examples of diverseecosystems based on expert opinion (Olson and Dinerstein 1998).
Biological DistinctivenessIndex
Index of ecoregions based on species richness, species endemism, rarity of habitat type, rare phenomena, andbeta diversity developed by WWF-U.S. for North and Latin America (Dinerstein et al. 1995, Ricketts et al1999).
Protected Areas Global database of protected areas in management categories I-VI produced by IUCN-World ConservationUnion and WCMC (WCMC 1999).
Grassland bird populations Long-term trend data on breeding birds of North America found along more than 3,500 survey routes overapproximately 30 years beginning in 1966, now reported by the U.S. Geological Survey (USGS) (Sauer et al1997 and 1999).
Large grassland herbivores Long-term population trend data from the Serengeti (Campbell and Borner 1995).
Key areas for threatened birds inthe Neotropics
Dataset for Latin America with extensive documentation, identifying key areas of threatened species throughfieldwork and expert judgment, presented by Birdlife International (Wege and Long 1995).
Fragmentation and roaddensities
Spatial, electronic database of road networks worldwide from Digital Chart of the World (DCW) (ESRI 1993);fragmentation index developed by the World Wildlife Fund (Dinerstein et al. 1995; Ricketts et al 1997)presented in chapter on grassland extent and change.
Non-Native species Dataset for North America aggregating county-level statistics on non-native species to ecoregions, compiled byWWF-US (Ricketts et al. 1997). County lists do not distinguish invasive or harmful introductions from thosethat are benign or beneficial.
CONDITIONS AND TRENDS INFORMATION STATUS AND NEEDS
♦ Worldwide, almost half of 234 Centers of Plant Diversity (CPDs) include grassland habitat.These CPDs, found in most regions of the world, represent areas with high grassland diversityand where conservation practices could protect a large number of grassland species.
♦ Approximately 23 of 217 Endemic Bird Areas (EBAs) include grassland as the key habitattype; 3 of these 23 grassland EBAs rank highest for biological importance: the PeruvianAndes, Central Chile, and Southern Patagonia.
♦ Of 136 terrestrial ecoregions identified as outstanding examples of the world’s diverseecosystems, 35 are grasslands, supporting some of the most important grassland biodiversityin the world today.
♦ Less than 16 percent of approximately 4,500 relatively large protected areas are at least 50percent grassland; protected grasslands cover approximately 4 million km2 or 3 percent of thetotal land area, just 7.6 percent of the total grassland area.
♦ The highest densities of 28 breeding grassland bird species of North America are foundprimarily in three states (North Dakota, South Dakota, and Montana) and two provinces(Saskatchewan and Alberta). Population trend data for a nearly 30-year period show aconstant decrease in the numbers of these species.
♦ Regional data for African herbivores show generally steady long-term population trends withinthe Serengeti ecosystem. Areas outside the protected area boundaries and with fewer lawenforcement activities experienced decreases in densities of already-low wildlife populations.
♦ Of nearly 600 key areas for threatened bird species in the Neotropics, 42 are grasslands; 12percent of the threatened birds are specific to grasslands.
♦ Road networks have led to high grassland fragmentation in some areas: the Great Plains of theUnited States are highly fragmented with 70 percent of the grasslands less than 1,000 km2
while in Botswana, 58 percent of grasslands are 10,000 km2 or greater.♦ The introduction of non-native species can negatively affect grassland ecosystems through
species competition and can eventually lead to decreases in biodiversity. Some NorthAmerican grasslands support 10 percent to 20 percent non-native plant species.
♦ Comprehensive data on grasslandbiodiversity are not adequate to evaluateglobal grassland condition; we need toexpand efforts to systematically collect dataon biodiversity for all grassland types and forall flora and fauna, including both macro-and micro-soil fauna.
♦ The U.S. Geological Survey supports one ofthe best programs for collecting status andtrends data on grassland birds. Althoughsuch expansive programs are not currentlyfeasible in all parts of the world, similar localand regional data collection efforts can beinitiated and supported on a gradual basis.
♦ Data on road networks can provideinformation on the extent of fragmentationand the potential degradation of grasslandecosystems. The current datasets generallydo not reflect road building over the lastdecade. Systematic, consistent coverage withregular updates of electronic, spatial data onroad location, size, and use could help usbetter measure the effects of ecosystemfragmentation.
♦ Rapid expansion of invasive species ingrassland ecosystems calls forcomprehensive, long-term studies andcollection of spatial data on invasive plantand animal species.
G r a s s l a n d E c o s y s t e m s 5
E x e c u t i v e S u m m a r y
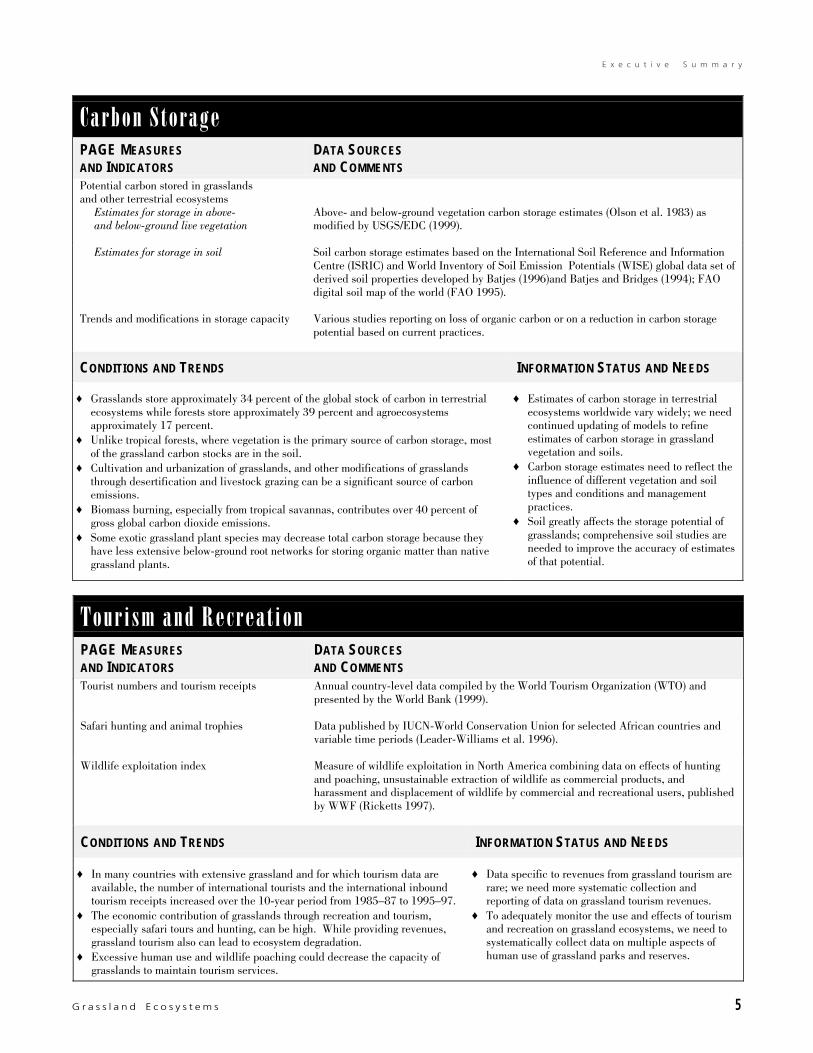
Carbon S toragePAGE MEASURESAND INDICATORS
DATA SOURCESAND COMMENTS
Potential carbon stored in grasslandsand other terrestrial ecosystems
Estimates for storage in above-and below-ground live vegetation
Above- and below-ground vegetation carbon storage estimates (Olson et al. 1983) asmodified by USGS/EDC (1999).
Estimates for storage in soil Soil carbon storage estimates based on the International Soil Reference and InformationCentre (ISRIC) and World Inventory of Soil Emission Potentials (WISE) global data set ofderived soil properties developed by Batjes (1996)and Batjes and Bridges (1994); FAOdigital soil map of the world (FAO 1995).
Trends and modifications in storage capacity Various studies reporting on loss of organic carbon or on a reduction in carbon storagepotential based on current practices.
CONDITIONS AND TRENDS INFORMATION STATUS AND NEEDS
♦ Grasslands store approximately 34 percent of the global stock of carbon in terrestrialecosystems while forests store approximately 39 percent and agroecosystemsapproximately 17 percent.
♦ Unlike tropical forests, where vegetation is the primary source of carbon storage, mostof the grassland carbon stocks are in the soil.
♦ Cultivation and urbanization of grasslands, and other modifications of grasslandsthrough desertification and livestock grazing can be a significant source of carbonemissions.
♦ Biomass burning, especially from tropical savannas, contributes over 40 percent ofgross global carbon dioxide emissions.
♦ Some exotic grassland plant species may decrease total carbon storage because theyhave less extensive below-ground root networks for storing organic matter than nativegrassland plants.
♦ Estimates of carbon storage in terrestrialecosystems worldwide vary widely; we needcontinued updating of models to refineestimates of carbon storage in grasslandvegetation and soils.
♦ Carbon storage estimates need to reflect theinfluence of different vegetation and soiltypes and conditions and managementpractices.
♦ Soil greatly affects the storage potential ofgrasslands; comprehensive soil studies areneeded to improve the accuracy of estimatesof that potential.
Tourism and RecreationPAGE MEASURESAND INDICATORS
DATA SOURCESAND COMMENTS
Tourist numbers and tourism receipts Annual country-level data compiled by the World Tourism Organization (WTO) andpresented by the World Bank (1999).
Safari hunting and animal trophies Data published by IUCN-World Conservation Union for selected African countries andvariable time periods (Leader-Williams et al. 1996).
Wildlife exploitation index Measure of wildlife exploitation in North America combining data on effects of huntingand poaching, unsustainable extraction of wildlife as commercial products, andharassment and displacement of wildlife by commercial and recreational users, publishedby WWF (Ricketts 1997).
CONDITIONS AND TRENDS INFORMATION STATUS AND NEEDS
♦ In many countries with extensive grassland and for which tourism data areavailable, the number of international tourists and the international inboundtourism receipts increased over the 10-year period from 1985–87 to 1995–97.
♦ The economic contribution of grasslands through recreation and tourism,especially safari tours and hunting, can be high. While providing revenues,grassland tourism also can lead to ecosystem degradation.
♦ Excessive human use and wildlife poaching could decrease the capacity ofgrasslands to maintain tourism services.
♦ Data specific to revenues from grassland tourism arerare; we need more systematic collection andreporting of data on grassland tourism revenues.
♦ To adequately monitor the use and effects of tourismand recreation on grassland ecosystems, we need tosystematically collect data on multiple aspects ofhuman use of grassland parks and reserves.

6 P I L O T A N A LY S I S O F G L O B A L E C O S Y S T E M S
E x e c u t i v e S u m m a r y
Conclus ionsPAGE researchers have found that global-scale analysis of grass-land condition is difficult not only because of lack of sufficientdata but also because of the variability in definitions of grass-lands, inconsistency in scales of reported data, out-of-date in-formation, and data based on expert opinion rather than scien-tific measurements.
Despite these difficulties, the indicators examined in thispilot analysis show unambiguous declines in the extent of grass-lands, especially in the temperate zone. Areas of grassland be-fore major modification by humans are now cultivated or ur-banized, especially in North America and Europe. The indica-tors also suggest that although the major goods and servicesprovided by grasslands are in good to fair condition, the capac-ity for grassland ecosystems to continue to provide these goodsand services is declining.
Indicators of soil condition show that more than half of thegrassland area analyzed under PAGE has some degree of soildegradation; over 5 percent of these grasslands are strongly toextremely degraded. Measures for detecting changes in netprimary productivity and rain-use efficiency show declines insome grassland areas. Indicators of grassland biodiversity showmarked declines in grassland birds of North America, with nega-tive effects from fragmentation and non-native species suggestedfor this region and others. Although the carbon storage poten-tial for grasslands is large, degraded areas store less carbonand there is heavy burning of some grassland areas, especiallythe African savannas. Tourism and recreational activities ingrasslands appear to make important economic contributionsto some countries, with revenues generally increasing. Overuseand declines in wildlife populations, however, suggest possibledeclines in the capacity to continue to provide these services.
Global scale analysis of grassland condition is further com-plicated by our limited ability to detect responses of grasslandecosystems to degradation. On the global scale, we rarely de-tect degradation involving changes in the age structure of plantpopulations or in the ability of species to reproduce. We mightdetect a decrease in plant productivity and cover with currentsatellite data and biomass measures. We can with certaintydetect a complete loss of vegetation and evidence of soil ero-sion through a combination of satellite data, data from meteoro-logical stations, and relationships modeled with NPP and RUEmeasures. At this stage, however, it may be too late to manage
for complete recovery of the degraded ecosystem. This pilotanalysis reinforces the importance of establishing indicators thatcan be used to detect declines in grassland condition with suf-ficient time to implement changes in management strategiesbefore degradation becomes irreversible.
Recommendat ions for FutureGrass land AssessmentsPAGE researchers make several recommendations for futuregrassland ecosystem assessments. The most important recom-mendation is to recognize that a global assessment based onsystematic measurement would be a large step forward in thefield of ecosystem evaluation and monitoring. GLASOD ispraised because it collates and generalizes available datasetson the condition of the world’s soils. GLASOD is unsatisfactoryfor global appraisal, however, because it is not built on system-atically collected data and thus cannot be used to monitorchanges in condition. Another important recommendation is toclosely monitor changes of primary concern in land use of grass-lands, including conversion of grassland to cropland, and deg-radation of grasslands in dry areas.Specific recommendations for future grassland ecosystemassessments include the following:♦ Use higher-resolution satellite data to delineate grassland
ecosystems.♦ Verify classifications of grasslands through field reconnais-
sance along selected transects of global land cover maps.♦ Expand efforts to present time-series data on vegetation
condition indicators such as net primary productivity andrain-use efficiency.
♦ Expand data collection efforts to produce maps of manage-ment systems showing extensive and intensive, or staticand mobile grazing patterns.
♦ Use case studies on resilience to identify links betweengoods and services and changes in ecosystems, and todifferentiate between permanent losses and potentialrecovery.
♦ Expand systematic data collection on biodiversity.♦ Further research the role of carbon in grassland ecosys-
tems, and the potential for both grassland vegetation andsoil under different management systems to store carbon.
♦ Systematically collect data on human use of and revenuescollected from grassland parks, reserves, and recreationareas.

G r a s s l a n d E c o s y s t e m s 7
F o r e s t s
Grasslands—as highly dynamic ecosystems—provide goods andservices to support flora, fauna, and human populations world-wide. Grasslands have been goldmines of plants used for food.Many of our food grains—wheat, corn, rice, rye, millet, andsorghum—have originated in grasslands. Many grasslands re-main the primary source of genetic resources for improving ourcrops and for increasing the number of pharmaceuticals. Grass-lands produce forage for domestic livestock, which in turn sup-port human livelihoods with meat, milk, wool, and leather prod-ucts. Grasslands provide habitat for breeding, migrating, andwintering birds; ideal conditions for many soil fauna; and range-lands for wild herbivores. These ecosystems cycle water andnutrients, and build and maintain stabilization mechanisms forsoil. Grassland vegetation, above and below ground, as well asthe soil itself, serve as large storehouses for carbon, helping to
PPPPPROLOGUEROLOGUEROLOGUEROLOGUEROLOGUE: G: G: G: G: GRASSLANDRASSLANDRASSLANDRASSLANDRASSLAND E E E E ECOSYSTEMSCOSYSTEMSCOSYSTEMSCOSYSTEMSCOSYSTEMS
WWWWWHYHYHYHYHY T T T T THEYHEYHEYHEYHEY M M M M MAAAAATTERTTERTTERTTERTTER,,,,,HHHHHOWOWOWOWOW T T T T THEYHEYHEYHEYHEY’’’’’RERERERERE D D D D DOINGOINGOINGOINGOING
limit global warming. Grasslands also supply energy fromfuelwood and wind generated from windfarms. These largelyopen-air landscapes support recreational activities such as hunt-ing, wildlife-watching, and tourism more generally, and offeraesthetic and spiritual gratification (Figure 1 (Figure 1 (Figure 1 (Figure 1 (Figure 1).
As we enter the 21st century, we still must ask fundamentalquestions: What is the condition of the world’s grasslands? Cangrassland ecosystems maintain their current supply of goodsand services? Answering these questions is not easy. The diffi-culty is due in part to the lack of agreement on a definition ofgrassland condition and on what constitutes a “healthy” grass-land ecosystem.
In 1994, the National Research Council (NRC) called for acomplete overhaul of the methods for assessing the condition ofrangelands in the United States. It stated that rangeland health
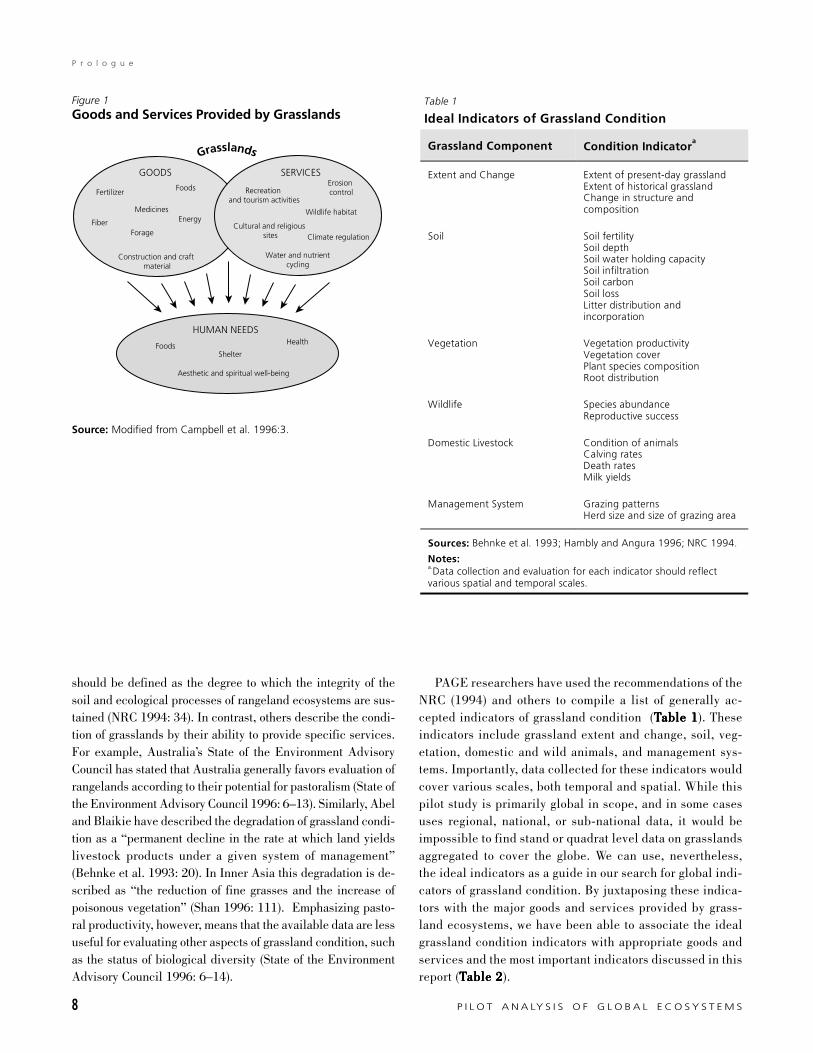
8 P I L O T A N A LY S I S O F G L O B A L E C O S Y S T E M S
P r o l o g u e
should be defined as the degree to which the integrity of thesoil and ecological processes of rangeland ecosystems are sus-tained (NRC 1994: 34). In contrast, others describe the condi-tion of grasslands by their ability to provide specific services.For example, Australia’s State of the Environment AdvisoryCouncil has stated that Australia generally favors evaluation ofrangelands according to their potential for pastoralism (State ofthe Environment Advisory Council 1996: 6–13). Similarly, Abeland Blaikie have described the degradation of grassland condi-tion as a “permanent decline in the rate at which land yieldslivestock products under a given system of management”(Behnke et al. 1993: 20). In Inner Asia this degradation is de-scribed as “the reduction of fine grasses and the increase ofpoisonous vegetation” (Shan 1996: 111). Emphasizing pasto-ral productivity, however, means that the available data are lessuseful for evaluating other aspects of grassland condition, suchas the status of biological diversity (State of the EnvironmentAdvisory Council 1996: 6–14).
Figure 1Goods and Services Provided by Grasslands
Source: Modified from Campbell et al. 1996:3.
Table 1
Ideal Indicators of Grassland Condition
Grassland Component Condition Indicatora
Extent and Change Extent of present-day grasslandExtent of historical grasslandChange in structure andcomposition
Soil Soil fertilitySoil depthSoil water holding capacitySoil infiltrationSoil carbonSoil lossLitter distribution andincorporation
Vegetation Vegetation productivityVegetation coverPlant species compositionRoot distribution
Wildlife Species abundanceReproductive success
Domestic Livestock Condition of animalsCalving ratesDeath ratesMilk yields
Management System Grazing patternsHerd size and size of grazing area
Sources: Behnke et al. 1993; Hambly and Angura 1996; NRC 1994.
Notes:a.Data collection and evaluation for each indicator should reflectvarious spatial and temporal scales.
PAGE researchers have used the recommendations of theNRC (1994) and others to compile a list of generally ac-cepted indicators of grassland condition (TTTTTable 1able 1able 1able 1able 1). Theseindicators include grassland extent and change, soil, veg-etation, domestic and wild animals, and management sys-tems. Importantly, data collected for these indicators wouldcover various scales, both temporal and spatial. While thispilot study is primarily global in scope, and in some casesuses regional, national, or sub-national data, it would beimpossible to find stand or quadrat level data on grasslandsaggregated to cover the globe. We can use, nevertheless,the ideal indicators as a guide in our search for global indi-cators of grassland condition. By juxtaposing these indica-tors with the major goods and services provided by grass-land ecosystems, we have been able to associate the idealgrassland condition indicators with appropriate goods andservices and the most important indicators discussed in thisreport (TTTTTable 2able 2able 2able 2able 2).
GOODS
Fertilizer
Medicines
Foods
EnergyFiberForage
Construction and craft material
SERVICES
HUMAN NEEDS
Cultural and religious sites
Recreation and tourism activities
Climate regulation
Erosion control
Water and nutrientcycling
Wildlife habitat
FoodsShelter
Health
Aesthetic and spiritual well-being
Grasslands

G r a s s l a n d E c o s y s t e m s 9
P r o l o g u e
Table 2
Grassland Extent, Goods and Services, and Indicators
Grassland Extent andGoods and Services Ideal Indicators
aCondition Indicators (or Proxies)
Land Area Extent and Change Extent of current grasslandsExtent of dry grasslandsExtent of woody vegetationExtent of grassland with agricultural mosaicExtent of historical grasslandRecent change in grassland area
Food, Forage, and Livestock SoilVegetationWildlifeDomestic LivestockManagement System
Soil degradationNet primary productivityRain-use efficiencyLivestock densities
Biodiversity SoilVegetationWildlifeManagement System
Centers of Plant DiversityEndemic Bird AreasGlobal 200 EcoregionsBiological Distinctiveness IndexGrassland protected areasBird populationsLarge herbivoresKey Areas for Threatened BirdsFragmentation and road densitiesNon-native species
Carbon Storage SoilVegetationWildlifeManagement System
Potential storage capacityTrends in storage capacityModification of storage capacity
Tourism/Recreation VegetationWildlife
Grassland tourismGrassland huntingWildlife Exploitation Index
Sources: Behnke et al. 1993; Hambly and Angura 1996; NRC 1994.Notes:a.See Table 1 for ideal indicators.

G r a s s l a n d E c o s y s t e m s 11
R e f e r e n c e s
A Working Definition of GrasslandsDefinitions for grasslands vary. Some studies classify grass-lands by vegetation while others characterize them by cli-mate, soils, and human use of the ecosystem. Bailey (1989)presents a map of ecosystem units or ecoregions of the con-tinents—including dry savanna or steppe, grassy savanna,prairie, and shrub savanna—using climate and vegetationas indicators of the extent of each unit. He qualifies thismethod by stating that:
The delineation of ecoregions should properly be basedupon the distinctiveness and distribution of variousecological associations. Unfortunately, available dataon the associations of the Earth that include both plantsand animals are inadequate for this purpose (Bailey1989: 307).
Savannas often have been described as forming a continuumbetween tropical forests and grasslands (House and Hall 2000:in press). House and Hall present arbitrary limits and descrip-tions that have been used to distinguish between forest, grass-
land, and different structural savanna types (as defined byScholes and Hall 1996):
♦ forests: complete tree canopy cover and three or more over-lapping vegetation strata;
♦ woodlands: 50-100 percent tree canopy cover, and agraminaceous layer;
♦ savannas: 10-15 percent cover by woody plants and well-developed grass;
♦ grasslands: less than 10 percent tree cover.House and Hall further describe classification systems that
vary as to whether savanna includes dense woodlands or tree-less tropical grasslands, and where tropical grasslands may in-clude mixed grass and tree communities as well as rangelands.House and Hall use the term savanna to include the entire rangeof communities from treeless grasslands to closed-canopy wood-lands (with a graminaceous layer).
Graetz suggests that grasslands are defined ecologically bythe structure and floristic composition of the vegetation but saysthat they are “far more commonly defined by the criterion ofland use as any open land that is used for livestock production”
GGGGG R A S S L A N DR A S S L A N DR A S S L A N DR A S S L A N DR A S S L A N D E E E E EX T E N TX T E N TX T E N TX T E N TX T E N T A N DA N DA N DA N DA N D
CCCCC H A N G EH A N G EH A N G EH A N G EH A N G E
photograph
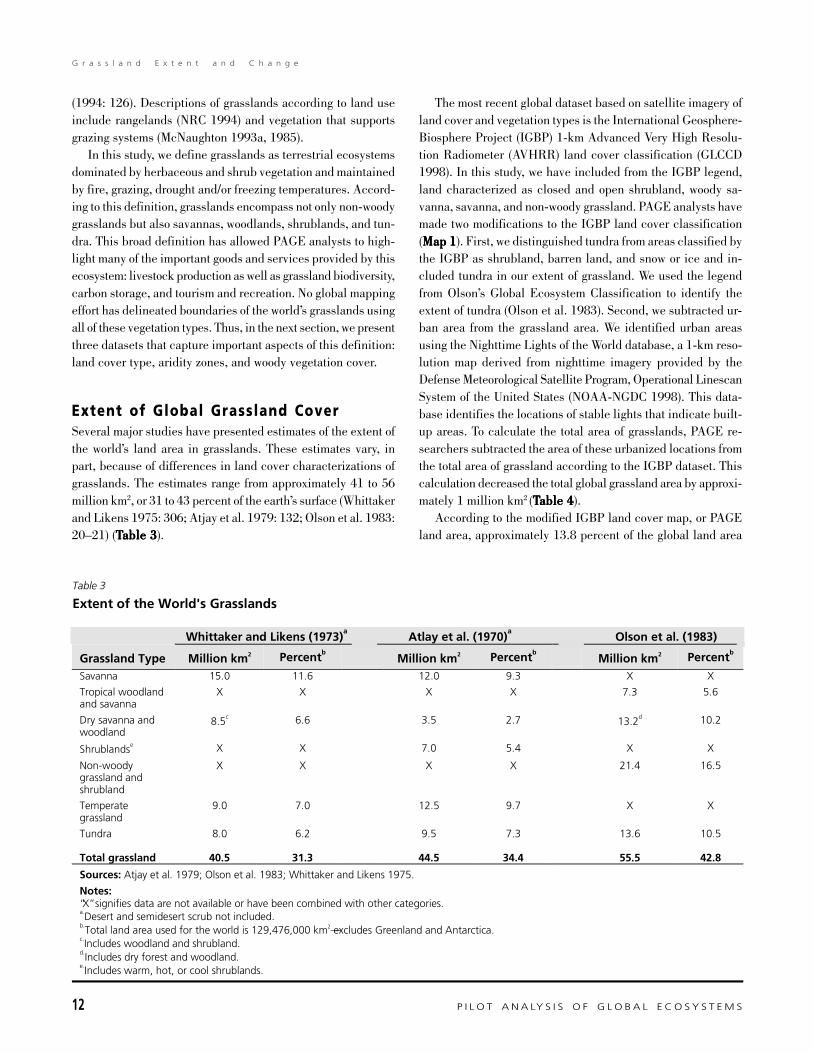
12 P I L O T A N A LY S I S O F G L O B A L E C O S Y S T E M S
G r a s s l a n d E x t e n t a n d C h a n g e
(1994: 126). Descriptions of grasslands according to land useinclude rangelands (NRC 1994) and vegetation that supportsgrazing systems (McNaughton 1993a, 1985).
In this study, we define grasslands as terrestrial ecosystemsdominated by herbaceous and shrub vegetation and maintainedby fire, grazing, drought and/or freezing temperatures. Accord-ing to this definition, grasslands encompass not only non-woodygrasslands but also savannas, woodlands, shrublands, and tun-dra. This broad definition has allowed PAGE analysts to high-light many of the important goods and services provided by thisecosystem: livestock production as well as grassland biodiversity,carbon storage, and tourism and recreation. No global mappingeffort has delineated boundaries of the world’s grasslands usingall of these vegetation types. Thus, in the next section, we presentthree datasets that capture important aspects of this definition:land cover type, aridity zones, and woody vegetation cover.
Extent of Global Grassland CoverSeveral major studies have presented estimates of the extent ofthe world’s land area in grasslands. These estimates vary, inpart, because of differences in land cover characterizations ofgrasslands. The estimates range from approximately 41 to 56million km2, or 31 to 43 percent of the earth’s surface (Whittakerand Likens 1975: 306; Atjay et al. 1979: 132; Olson et al. 1983:20–21) (TTTTTable 3able 3able 3able 3able 3).
Table 3
Extent of the World's Grasslands
Whittaker and Likens (1973)a Atlay et al. (1970)
a Olson et al. (1983)
Grassland Type Million km2 PercentbMillion km2 Percentb
Million km2 Percentb
Savanna 15.0 11.6 12.0 9.3 X X
Tropical woodlandand savanna
X X X X 7.3 5.6
Dry savanna andwoodland
8.5c 6.6 3.5 2.7 13.2d 10.2
Shrublandse X X 7.0 5.4 X X
Non-woodygrassland andshrubland
X X X X 21.4 16.5
Temperategrassland
9.0 7.0 12.5 9.7 X X
Tundra 8.0 6.2 9.5 7.3 13.6 10.5
Total grassland 40.5 31.3 44.5 34.4 55.5 42.8
Sources: Atjay et al. 1979; Olson et al. 1983; Whittaker and Likens 1975.
Notes:“X” signifies data are not available or have been combined with other categories.a.Desert and semidesert scrub not included.b.Total land area used for the world is 129,476,000 km2—excludes Greenland and Antarctica.c.Includes woodland and shrubland.d.Includes dry forest and woodland.e.Includes warm, hot, or cool shrublands.
The most recent global dataset based on satellite imagery ofland cover and vegetation types is the International Geosphere-Biosphere Project (IGBP) 1-km Advanced Very High Resolu-tion Radiometer (AVHRR) land cover classification (GLCCD1998). In this study, we have included from the IGBP legend,land characterized as closed and open shrubland, woody sa-vanna, savanna, and non-woody grassland. PAGE analysts havemade two modifications to the IGBP land cover classification(Map 1Map 1Map 1Map 1Map 1). First, we distinguished tundra from areas classified bythe IGBP as shrubland, barren land, and snow or ice and in-cluded tundra in our extent of grassland. We used the legendfrom Olson’s Global Ecosystem Classification to identify theextent of tundra (Olson et al. 1983). Second, we subtracted ur-ban area from the grassland area. We identified urban areasusing the Nighttime Lights of the World database, a 1-km reso-lution map derived from nighttime imagery provided by theDefense Meteorological Satellite Program, Operational LinescanSystem of the United States (NOAA-NGDC 1998). This data-base identifies the locations of stable lights that indicate built-up areas. To calculate the total area of grasslands, PAGE re-searchers subtracted the area of these urbanized locations fromthe total area of grassland according to the IGBP dataset. Thiscalculation decreased the total global grassland area by approxi-mately 1 million km2 (TTTTTable 4able 4able 4able 4able 4).
According to the modified IGBP land cover map, or PAGEland area, approximately 13.8 percent of the global land area

G r a s s l a n d E c o s y s t e m s 13
G r a s s l a n d E x t e n t a n d C h a n g e
Table 4Ecosystem Area and Population
IGBP AgriculturalLand Urban Mosaic PAGE
Area Areaa Areab Area Population
Ecosystem/Country (000 km2) (000 km2) (000 km2) (000 km2)c (000)d
GRASSLANDS 53,544 1,010 7,172 52,544 792,711
Asia (Excl. Middle East) 9,033 141 1,281 8,892 249,495
Europe 7,072 116 189 6,956 20,491
Middle East & N. Africa 3,031 161 159 2,871 111,882
Sub-Saharan Africa 14,546 83 3,531 14,464 312,935
North America 6,816 238 518 6,583 6,032
C. America & Caribbean 1,130 82 24 1,048 30,533
South America 5,017 150 1,416 4,867 57,529
Oceania 6,898 40 54 6,859 3,814
FORESTS 29,905 930 1,727 28,974 446,470
Asia (Excl. Middle East) 3,812 91 192 3,721 231,782
Europe 6,957 226 338 6,731 43,713
Middle East & N. Africa 100 10 44 90 6,724
Sub-Saharan Africa 2,672 13 162 2,659 53,823
North America 7,564 449 965 7,115 30,764
C. America & Caribbean 997 59 1 939 33,940
South America 6,928 67 26 6,861 39,860
Oceania 874 17 0 857 5,864
AGRICULTURE 27,890 2,407 X 36,234 2,790,582
Asia (Excl. Middle East) 8,874 683 X 10,370 1,991,214
Europe 6,840 763 X 7,448 311,923
Middle East & N. Africa 1,025 136 X 1,230 99,662
Sub-Saharan Africa 2,141 38 X 5,837 204,901
North America 2,867 511 X 4,406 47,927
C. America & Caribbean 517 48 X 611 26,973
South America 4,991 216 X 5,642 105,083
Oceania 635 13 X 690 2,899
OTHERe 18,136 395 180 22,343 1,812,688
ECOSYSTEM TOTALSf 129,476 4,745 9,079 X X
Sources: PAGE calculations based on CIESIN 2000; GLCCD 1998; NOAA NGDC 1998; Olson 1994a and b.
Notes:a.Urban area is defined by the NOAA/NGDC database within each IGBP ecosystem category (i.e., grassland, forest, other). The data set contains thelocation of stable lights and is used as an indicator of the spatial distribution of settlements and infrastructure.b.Agricultural mosaic area is area classified as 30-40 percent cropland within each IGBP ecosystem category (i.e., grasslands, forests, other).c.Boundaries for each PAGE ecosystem category are defined independently resulting in an overlap of agriculture ecosystem area with grassland andforest ecosystem area. Area estimates for grasslands and forests exclude the stable lights extent. The PAGE estimates for agriculture ecosystemextent are based on the seasonal land cover regions (SLCRs) which roughly equals the IGBP agriculture extent plus the agricultural mosaic area forgrasslands and forests but includes urban areas since an explicit urban class was not assigned in the SLCR map units.d.Population data are from an inventory of national censuses compiled by administrative units. These data were standardized to 1995 to deriveestimates for the PAGE ecosystem areas.e.The “ Other” category includes wetlands, barren land, and human settlements.f.Global totals cannot be calculated for PAGE categories because the agriculture ecosystem area overlaps with the grassland and forest ecosystemareas.
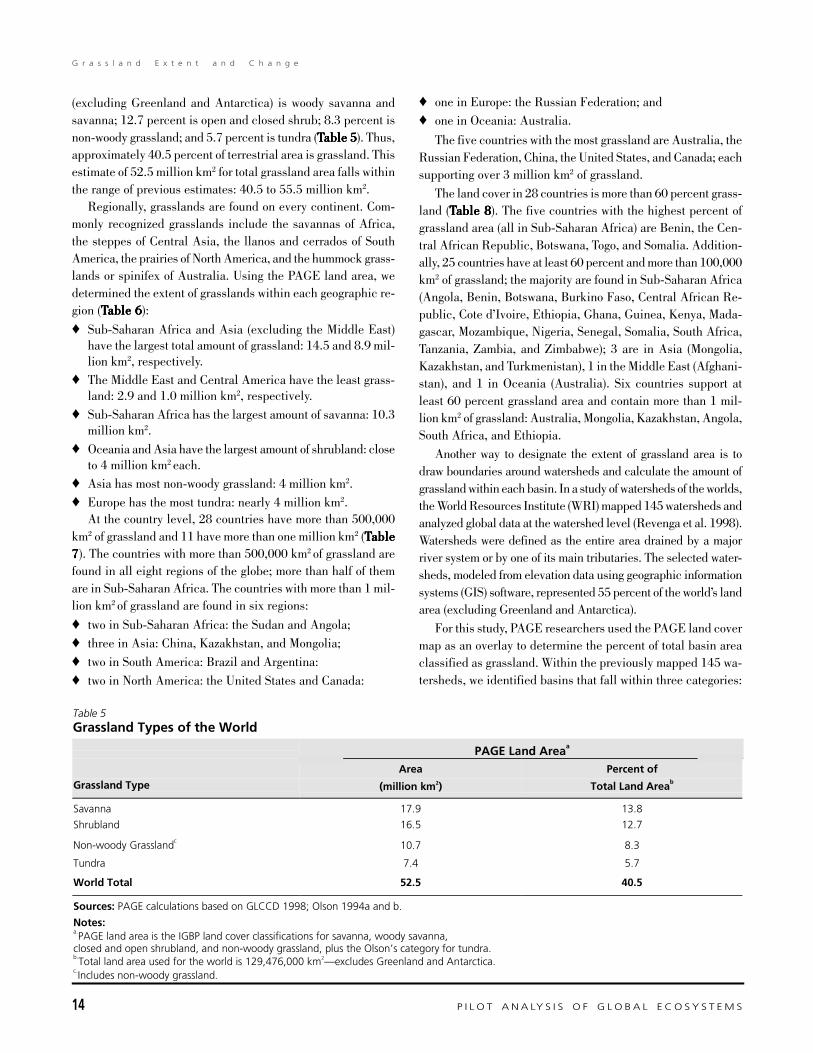
14 P I L O T A N A LY S I S O F G L O B A L E C O S Y S T E M S
G r a s s l a n d E x t e n t a n d C h a n g e
(excluding Greenland and Antarctica) is woody savanna andsavanna; 12.7 percent is open and closed shrub; 8.3 percent isnon-woody grassland; and 5.7 percent is tundra (TTTTTable 5able 5able 5able 5able 5). Thus,approximately 40.5 percent of terrestrial area is grassland. Thisestimate of 52.5 million km2 for total grassland area falls withinthe range of previous estimates: 40.5 to 55.5 million km2.
Regionally, grasslands are found on every continent. Com-monly recognized grasslands include the savannas of Africa,the steppes of Central Asia, the llanos and cerrados of SouthAmerica, the prairies of North America, and the hummock grass-lands or spinifex of Australia. Using the PAGE land area, wedetermined the extent of grasslands within each geographic re-gion (TTTTTable 6able 6able 6able 6able 6):
♦ Sub-Saharan Africa and Asia (excluding the Middle East)have the largest total amount of grassland: 14.5 and 8.9 mil-lion km2, respectively.
♦ The Middle East and Central America have the least grass-land: 2.9 and 1.0 million km2, respectively.
♦ Sub-Saharan Africa has the largest amount of savanna: 10.3million km2.
♦ Oceania and Asia have the largest amount of shrubland: closeto 4 million km2 each.
♦ Asia has most non-woody grassland: 4 million km2.
♦ Europe has the most tundra: nearly 4 million km2.At the country level, 28 countries have more than 500,000
km2 of grassland and 11 have more than one million km2 (TTTTTableableableableable77777). The countries with more than 500,000 km2 of grassland arefound in all eight regions of the globe; more than half of themare in Sub-Saharan Africa. The countries with more than 1 mil-lion km2 of grassland are found in six regions:
♦ two in Sub-Saharan Africa: the Sudan and Angola;
♦ three in Asia: China, Kazakhstan, and Mongolia;
♦ two in South America: Brazil and Argentina:
♦ two in North America: the United States and Canada:
♦ one in Europe: the Russian Federation; and
♦ one in Oceania: Australia.
The five countries with the most grassland are Australia, theRussian Federation, China, the United States, and Canada; eachsupporting over 3 million km2 of grassland.
The land cover in 28 countries is more than 60 percent grass-land (TTTTTable 8able 8able 8able 8able 8). The five countries with the highest percent ofgrassland area (all in Sub-Saharan Africa) are Benin, the Cen-tral African Republic, Botswana, Togo, and Somalia. Addition-ally, 25 countries have at least 60 percent and more than 100,000km2 of grassland; the majority are found in Sub-Saharan Africa(Angola, Benin, Botswana, Burkino Faso, Central African Re-public, Cote d’Ivoire, Ethiopia, Ghana, Guinea, Kenya, Mada-gascar, Mozambique, Nigeria, Senegal, Somalia, South Africa,Tanzania, Zambia, and Zimbabwe); 3 are in Asia (Mongolia,Kazakhstan, and Turkmenistan), 1 in the Middle East (Afghani-stan), and 1 in Oceania (Australia). Six countries support atleast 60 percent grassland area and contain more than 1 mil-lion km2 of grassland: Australia, Mongolia, Kazakhstan, Angola,South Africa, and Ethiopia.
Another way to designate the extent of grassland area is todraw boundaries around watersheds and calculate the amount ofgrassland within each basin. In a study of watersheds of the worlds,the World Resources Institute (WRI) mapped 145 watersheds andanalyzed global data at the watershed level (Revenga et al. 1998).Watersheds were defined as the entire area drained by a majorriver system or by one of its main tributaries. The selected water-sheds, modeled from elevation data using geographic informationsystems (GIS) software, represented 55 percent of the world’s landarea (excluding Greenland and Antarctica).
For this study, PAGE researchers used the PAGE land covermap as an overlay to determine the percent of total basin areaclassified as grassland. Within the previously mapped 145 wa-tersheds, we identified basins that fall within three categories:
Table 5Grassland Types of the World
PAGE Land Areaa
Area Percent of
Grassland Type (million km2) Total Land Areab
Savanna 17.9 13.8
Shrubland 16.5 12.7
Non-woody Grasslandc10.7 8.3
Tundra 7.4 5.7
World Total 52.5 40.5
Sources: PAGE calculations based on GLCCD 1998; Olson 1994a and b.
Notes:a.PAGE land area is the IGBP land cover classifications for savanna, woody savanna,closed and open shrubland, and non-woody grassland, plus the Olson’s category for tundra.b.Total land area used for the world is 129,476,000 km2— excludes Greenland and Antarctica.c.Includes non-woody grassland.
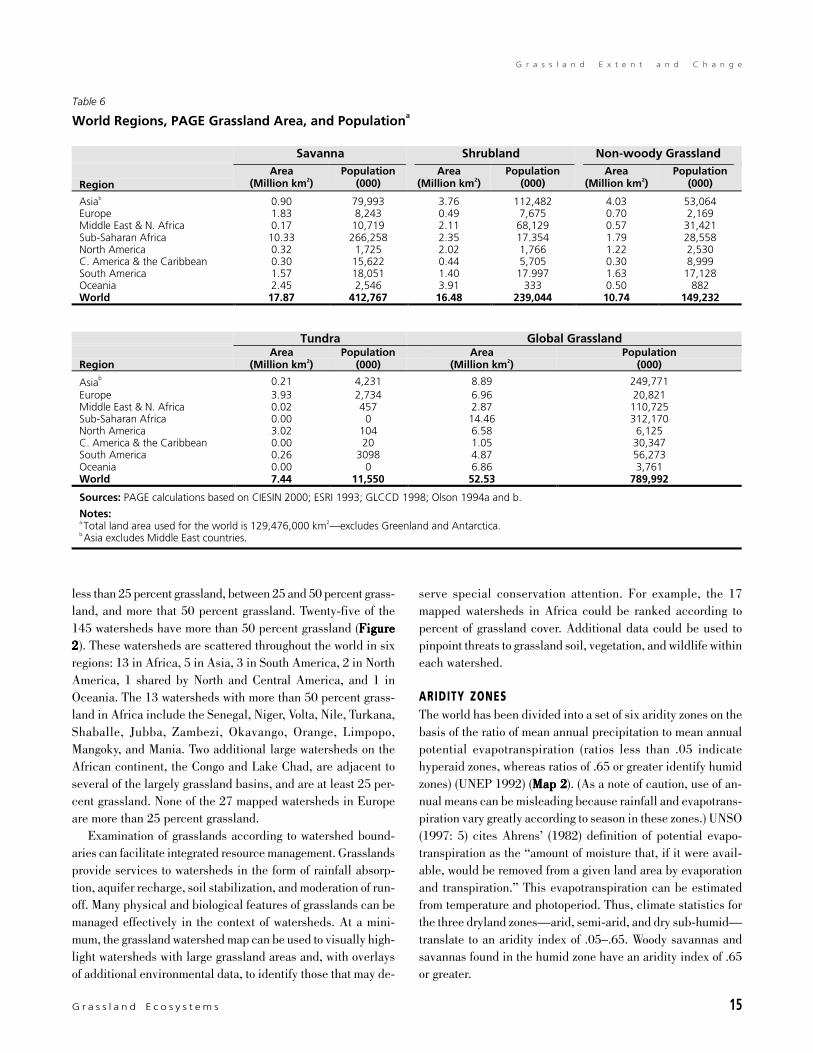
G r a s s l a n d E c o s y s t e m s 15
G r a s s l a n d E x t e n t a n d C h a n g e
Table 6
World Regions, PAGE Grassland Area, and Populationa
Savanna Shrubland Non-woody Grassland
Region
Area(Million km2)
Population(000)
Area(Million km2)
Population(000)
Area(Million km2)
Population(000)
Asiab 0.90 79,993 3.76 112,482 4.03 53,064Europe 1.83 8,243 0.49 7,675 0.70 2,169Middle East & N. Africa 0.17 10,719 2.11 68,129 0.57 31,421Sub-Saharan Africa 10.33 266,258 2.35 17.354 1.79 28,558North America 0.32 1,725 2.02 1,766 1.22 2,530C. America & the Caribbean 0.30 15,622 0.44 5,705 0.30 8,999South America 1.57 18,051 1.40 17.997 1.63 17,128Oceania 2.45 2,546 3.91 333 0.50 882World 17.87 412,767 16.48 239,044 10.74 149,232
Tundra Global Grassland Region
Area(Million km2)
Population(000)
Area(Million km2)
Population(000)
Asiab 0.21 4,231 8.89 249,771Europe 3.93 2,734 6.96 20,821Middle East & N. Africa 0.02 457 2.87 110,725Sub-Saharan Africa 0.00 0 14.46 312,170North America 3.02 104 6.58 6,125C. America & the Caribbean 0.00 20 1.05 30,347South America 0.26 3098 4.87 56,273Oceania 0.00 0 6.86 3,761World 7.44 11,550 52.53 789,992
Sources: PAGE calculations based on CIESIN 2000; ESRI 1993; GLCCD 1998; Olson 1994a and b.
Notes:a.Total land area used for the world is 129,476,000 km2— excludes Greenland and Antarctica.b.Asia excludes Middle East countries.
less than 25 percent grassland, between 25 and 50 percent grass-land, and more that 50 percent grassland. Twenty-five of the145 watersheds have more than 50 percent grassland (FigureFigureFigureFigureFigure22222). These watersheds are scattered throughout the world in sixregions: 13 in Africa, 5 in Asia, 3 in South America, 2 in NorthAmerica, 1 shared by North and Central America, and 1 inOceania. The 13 watersheds with more than 50 percent grass-land in Africa include the Senegal, Niger, Volta, Nile, Turkana,Shaballe, Jubba, Zambezi, Okavango, Orange, Limpopo,Mangoky, and Mania. Two additional large watersheds on theAfrican continent, the Congo and Lake Chad, are adjacent toseveral of the largely grassland basins, and are at least 25 per-cent grassland. None of the 27 mapped watersheds in Europeare more than 25 percent grassland.
Examination of grasslands according to watershed bound-aries can facilitate integrated resource management. Grasslandsprovide services to watersheds in the form of rainfall absorp-tion, aquifer recharge, soil stabilization, and moderation of run-off. Many physical and biological features of grasslands can bemanaged effectively in the context of watersheds. At a mini-mum, the grassland watershed map can be used to visually high-light watersheds with large grassland areas and, with overlaysof additional environmental data, to identify those that may de-
serve special conservation attention. For example, the 17mapped watersheds in Africa could be ranked according topercent of grassland cover. Additional data could be used topinpoint threats to grassland soil, vegetation, and wildlife withineach watershed.
ARIDITY ZONESThe world has been divided into a set of six aridity zones on thebasis of the ratio of mean annual precipitation to mean annualpotential evapotranspiration (ratios less than .05 indicatehyperaid zones, whereas ratios of .65 or greater identify humidzones) (UNEP 1992) (Map 2Map 2Map 2Map 2Map 2). (As a note of caution, use of an-nual means can be misleading because rainfall and evapotrans-piration vary greatly according to season in these zones.) UNSO(1997: 5) cites Ahrens’ (1982) definition of potential evapo-transpiration as the “amount of moisture that, if it were avail-able, would be removed from a given land area by evaporationand transpiration.” This evapotranspiration can be estimatedfrom temperature and photoperiod. Thus, climate statistics forthe three dryland zones—arid, semi-arid, and dry sub-humid—translate to an aridity index of .05–.65. Woody savannas andsavannas found in the humid zone have an aridity index of .65or greater.
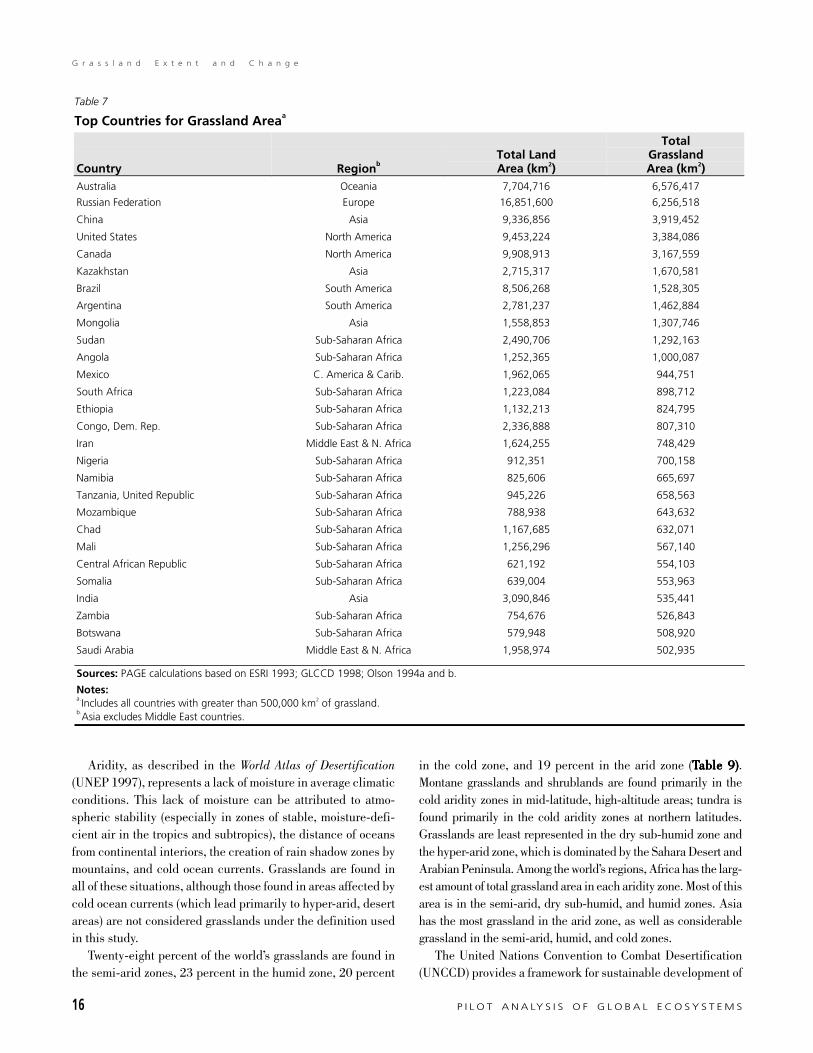
16 P I L O T A N A LY S I S O F G L O B A L E C O S Y S T E M S
G r a s s l a n d E x t e n t a n d C h a n g e
Aridity, as described in the World Atlas of Desertification(UNEP 1997), represents a lack of moisture in average climaticconditions. This lack of moisture can be attributed to atmo-spheric stability (especially in zones of stable, moisture-defi-cient air in the tropics and subtropics), the distance of oceansfrom continental interiors, the creation of rain shadow zones bymountains, and cold ocean currents. Grasslands are found inall of these situations, although those found in areas affected bycold ocean currents (which lead primarily to hyper-arid, desertareas) are not considered grasslands under the definition usedin this study.
Twenty-eight percent of the world’s grasslands are found inthe semi-arid zones, 23 percent in the humid zone, 20 percent
in the cold zone, and 19 percent in the arid zone (TTTTTable 9)able 9)able 9)able 9)able 9).Montane grasslands and shrublands are found primarily in thecold aridity zones in mid-latitude, high-altitude areas; tundra isfound primarily in the cold aridity zones at northern latitudes.Grasslands are least represented in the dry sub-humid zone andthe hyper-arid zone, which is dominated by the Sahara Desert andArabian Peninsula. Among the world’s regions, Africa has the larg-est amount of total grassland area in each aridity zone. Most of thisarea is in the semi-arid, dry sub-humid, and humid zones. Asiahas the most grassland in the arid zone, as well as considerablegrassland in the semi-arid, humid, and cold zones.
The United Nations Convention to Combat Desertification(UNCCD) provides a framework for sustainable development of
Table 7
Top Countries for Grassland Areaa
Country RegionbTotal LandArea (km2)
TotalGrasslandArea (km2)
Australia Oceania 7,704,716 6,576,417
Russian Federation Europe 16,851,600 6,256,518
China Asia 9,336,856 3,919,452
United States North America 9,453,224 3,384,086
Canada North America 9,908,913 3,167,559
Kazakhstan Asia 2,715,317 1,670,581
Brazil South America 8,506,268 1,528,305
Argentina South America 2,781,237 1,462,884
Mongolia Asia 1,558,853 1,307,746
Sudan Sub-Saharan Africa 2,490,706 1,292,163
Angola Sub-Saharan Africa 1,252,365 1,000,087
Mexico C. America & Carib. 1,962,065 944,751
South Africa Sub-Saharan Africa 1,223,084 898,712
Ethiopia Sub-Saharan Africa 1,132,213 824,795
Congo, Dem. Rep. Sub-Saharan Africa 2,336,888 807,310
Iran Middle East & N. Africa 1,624,255 748,429
Nigeria Sub-Saharan Africa 912,351 700,158
Namibia Sub-Saharan Africa 825,606 665,697
Tanzania, United Republic Sub-Saharan Africa 945,226 658,563
Mozambique Sub-Saharan Africa 788,938 643,632
Chad Sub-Saharan Africa 1,167,685 632,071
Mali Sub-Saharan Africa 1,256,296 567,140
Central African Republic Sub-Saharan Africa 621,192 554,103
Somalia Sub-Saharan Africa 639,004 553,963
India Asia 3,090,846 535,441
Zambia Sub-Saharan Africa 754,676 526,843
Botswana Sub-Saharan Africa 579,948 508,920
Saudi Arabia Middle East & N. Africa 1,958,974 502,935
Sources: PAGE calculations based on ESRI 1993; GLCCD 1998; Olson 1994a and b.
Notes:a.Includes all countries with greater than 500,000 km2 of grassland.b.Asia excludes Middle East countries.
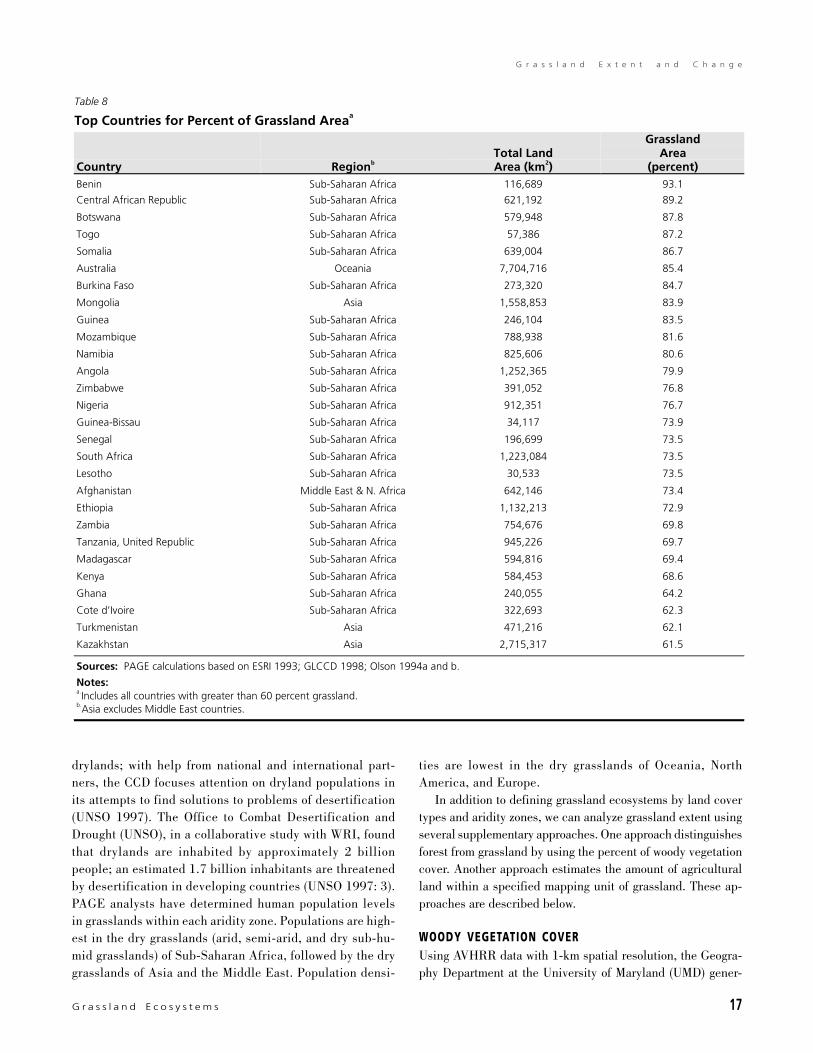
G r a s s l a n d E c o s y s t e m s 17
G r a s s l a n d E x t e n t a n d C h a n g e
drylands; with help from national and international part-ners, the CCD focuses attention on dryland populations inits attempts to find solutions to problems of desertification(UNSO 1997). The Office to Combat Desertification andDrought (UNSO), in a collaborative study with WRI, foundthat drylands are inhabited by approximately 2 billionpeople; an estimated 1.7 billion inhabitants are threatenedby desertification in developing countries (UNSO 1997: 3).PAGE analysts have determined human population levelsin grasslands within each aridity zone. Populations are high-est in the dry grasslands (arid, semi-arid, and dry sub-hu-mid grasslands) of Sub-Saharan Africa, followed by the drygrasslands of Asia and the Middle East. Population densi-
ties are lowest in the dry grasslands of Oceania, NorthAmerica, and Europe.
In addition to defining grassland ecosystems by land covertypes and aridity zones, we can analyze grassland extent usingseveral supplementary approaches. One approach distinguishesforest from grassland by using the percent of woody vegetationcover. Another approach estimates the amount of agriculturalland within a specified mapping unit of grassland. These ap-proaches are described below.
WOODY VEGETATION COVERUsing AVHRR data with 1-km spatial resolution, the Geogra-phy Department at the University of Maryland (UMD) gener-
Table 8
Top Countries for Percent of Grassland Areaa
Country RegionbTotal LandArea (km2)
GrasslandArea
(percent)Benin Sub-Saharan Africa 116,689 93.1
Central African Republic Sub-Saharan Africa 621,192 89.2
Botswana Sub-Saharan Africa 579,948 87.8
Togo Sub-Saharan Africa 57,386 87.2
Somalia Sub-Saharan Africa 639,004 86.7
Australia Oceania 7,704,716 85.4
Burkina Faso Sub-Saharan Africa 273,320 84.7
Mongolia Asia 1,558,853 83.9
Guinea Sub-Saharan Africa 246,104 83.5
Mozambique Sub-Saharan Africa 788,938 81.6
Namibia Sub-Saharan Africa 825,606 80.6
Angola Sub-Saharan Africa 1,252,365 79.9
Zimbabwe Sub-Saharan Africa 391,052 76.8
Nigeria Sub-Saharan Africa 912,351 76.7
Guinea-Bissau Sub-Saharan Africa 34,117 73.9
Senegal Sub-Saharan Africa 196,699 73.5
South Africa Sub-Saharan Africa 1,223,084 73.5
Lesotho Sub-Saharan Africa 30,533 73.5
Afghanistan Middle East & N. Africa 642,146 73.4
Ethiopia Sub-Saharan Africa 1,132,213 72.9
Zambia Sub-Saharan Africa 754,676 69.8
Tanzania, United Republic Sub-Saharan Africa 945,226 69.7
Madagascar Sub-Saharan Africa 594,816 69.4
Kenya Sub-Saharan Africa 584,453 68.6
Ghana Sub-Saharan Africa 240,055 64.2
Cote d’Ivoire Sub-Saharan Africa 322,693 62.3
Turkmenistan Asia 471,216 62.1
Kazakhstan Asia 2,715,317 61.5
Sources: PAGE calculations based on ESRI 1993; GLCCD 1998; Olson 1994a and b.
Notes:a.Includes all countries with greater than 60 percent grassland.b.Asia excludes Middle East countries.
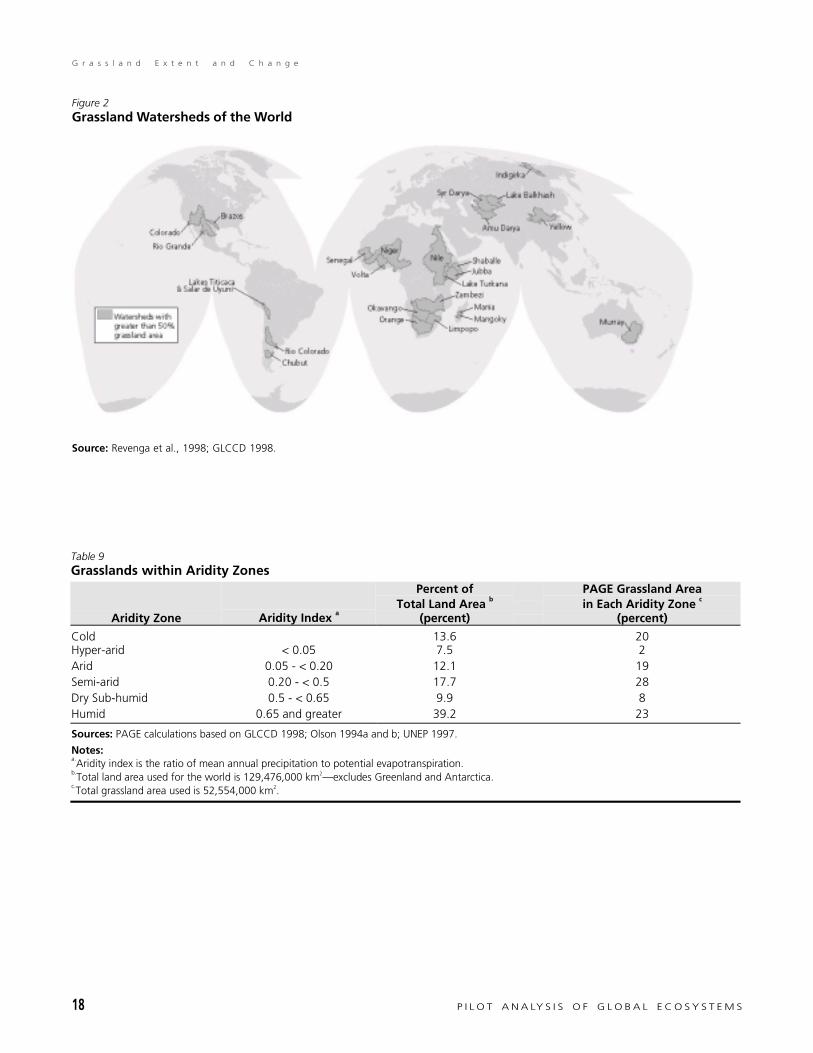
18 P I L O T A N A LY S I S O F G L O B A L E C O S Y S T E M S
G r a s s l a n d E x t e n t a n d C h a n g e
Table 9Grasslands within Aridity Zones
Aridity Zone Aridity Index a
Percent ofTotal Land Area b
(percent)
PAGE Grassland Areain Each Aridity Zone c
(percent)
Cold 13.6 20Hyper-arid < 0.05 7.5 2Arid 0.05 - < 0.20 12.1 19Semi-arid 0.20 - < 0.5 17.7 28Dry Sub-humid 0.5 - < 0.65 9.9 8Humid 0.65 and greater 39.2 23
Sources: PAGE calculations based on GLCCD 1998; Olson 1994a and b; UNEP 1997.
Notes:a.Aridity index is the ratio of mean annual precipitation to potential evapotranspiration.b.Total land area used for the world is 129,476,000 km2— excludes Greenland and Antarctica.c.Total grassland area used is 52,554,000 km2.
Figure 2Grassland Watersheds of the World
Source: Revenga et al., 1998; GLCCD 1998.

G r a s s l a n d E c o s y s t e m s 19
G r a s s l a n d E x t e n t a n d C h a n g e
ated a global map depicting percent of woody vegetation coveron a scale of 0 to 100 percent (DeFries et al. 2000). Woodyvegetation is defined as mature vegetation with an approximateheight of greater than five meters. PAGE analysts modified theUMD map by separating bare ground from the “less than 10percent woody vegetation” category on the basis of the IGBPbare ground classification. Using this technique, we were ableto map the percent of woody and herbaceous cover across theworld’s terrestrial surface (Map 3Map 3Map 3Map 3Map 3). This mapping method re-sults in a more continuous representation of grassland extentthan that used by IGBP, with boundaries between grassland typesless defined.
Worldwide, the percent of grassland within each woody veg-etation cover class ranges from approximately 66 percent in thenon-woody class (this class represents less than 10 percentwoody vegetation), 17 percent in the 10–30 percent woody veg-etation class, 14 percent in the 30–60 percent woody vegeta-tion class, and 3 percent in the greater than 60 percent woodyvegetation class. Histograms of the percent of area within eachclass in each region show that the grasslands in Asia, NorthAmerica, and Oceania are largely non-woody (primarily in theless than 10 percent woody vegetation class). In contrast, the grass-lands in Africa, South America, and Central America and theCaribbean contain larger amounts of woody vegetation (Figure 3Figure 3Figure 3Figure 3Figure 3).
Figure 3Percent Woody Vegetation in Grasslands
Source: DeFries et al. 2000; GLCCD 1998.
Woody Vegetation Cover Class
0
10
20
30
40
50
60
70
80
90
100
Per
cen
to
fG
rass
lan
dA
rea
< 10% 10%-30% 30%-60% >60%
Africa AsiaNorth
AmericaSouth
AmericaCentral America& the Caribbean Oceania
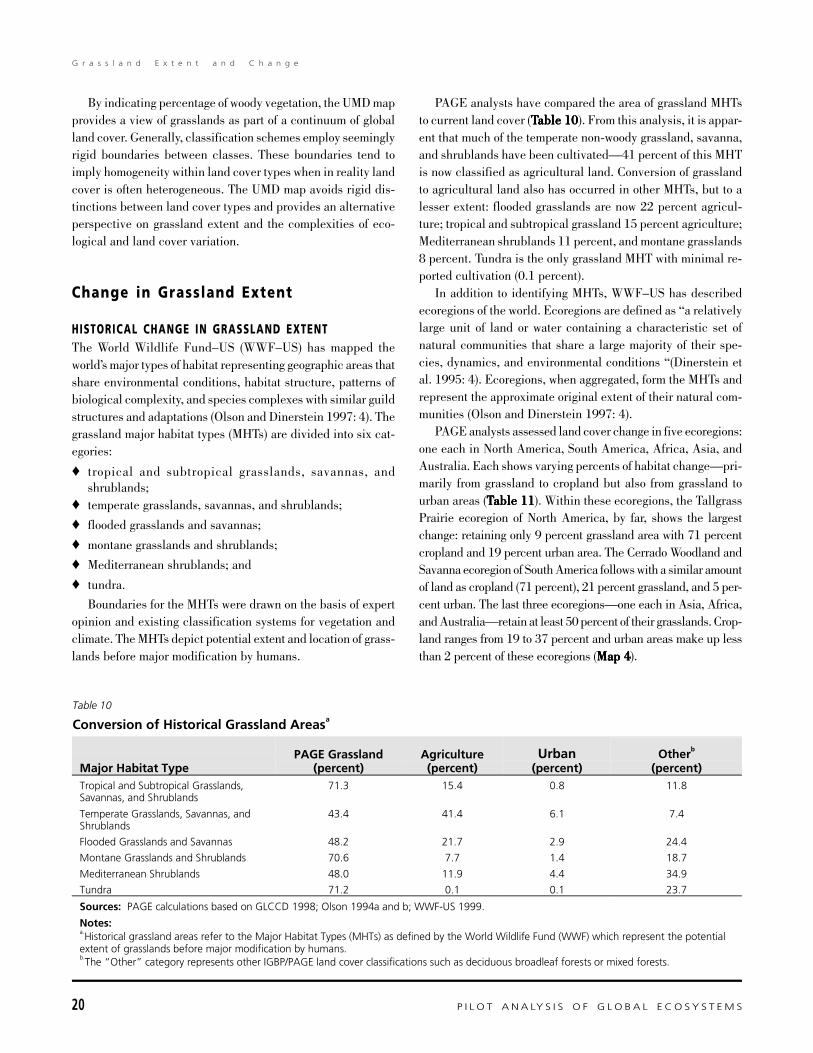
20 P I L O T A N A LY S I S O F G L O B A L E C O S Y S T E M S
G r a s s l a n d E x t e n t a n d C h a n g e
By indicating percentage of woody vegetation, the UMD mapprovides a view of grasslands as part of a continuum of globalland cover. Generally, classification schemes employ seeminglyrigid boundaries between classes. These boundaries tend toimply homogeneity within land cover types when in reality landcover is often heterogeneous. The UMD map avoids rigid dis-tinctions between land cover types and provides an alternativeperspective on grassland extent and the complexities of eco-logical and land cover variation.
Change in Grassland Extent
HISTORICAL CHANGE IN GRASSLAND EXTENTThe World Wildlife Fund–US (WWF–US) has mapped theworld’s major types of habitat representing geographic areas thatshare environmental conditions, habitat structure, patterns ofbiological complexity, and species complexes with similar guildstructures and adaptations (Olson and Dinerstein 1997: 4). Thegrassland major habitat types (MHTs) are divided into six cat-egories:
♦ tropical and subtropical grasslands, savannas, andshrublands;
♦ temperate grasslands, savannas, and shrublands;
♦ flooded grasslands and savannas;
♦ montane grasslands and shrublands;
♦ Mediterranean shrublands; and
♦ tundra.
Boundaries for the MHTs were drawn on the basis of expertopinion and existing classification systems for vegetation andclimate. The MHTs depict potential extent and location of grass-lands before major modification by humans.
Table 10
Conversion of Historical Grassland Areasa
Major Habitat TypePAGE Grassland
(percent)Agriculture(percent)
Urban(percent)
Otherb
(percent)Tropical and Subtropical Grasslands,Savannas, and Shrublands
71.3 15.4 0.8 11.8
Temperate Grasslands, Savannas, andShrublands
43.4 41.4 6.1 7.4
Flooded Grasslands and Savannas 48.2 21.7 2.9 24.4
Montane Grasslands and Shrublands 70.6 7.7 1.4 18.7
Mediterranean Shrublands 48.0 11.9 4.4 34.9
Tundra 71.2 0.1 0.1 23.7
Sources: PAGE calculations based on GLCCD 1998; Olson 1994a and b; WWF-US 1999.
Notes:a.Historical grassland areas refer to the Major Habitat Types (MHTs) as defined by the World Wildlife Fund (WWF) which represent the potentialextent of grasslands before major modification by humans.b.The “ Other” category represents other IGBP/PAGE land cover classifications such as deciduous broadleaf forests or mixed forests.
PAGE analysts have compared the area of grassland MHTsto current land cover (TTTTTable 10able 10able 10able 10able 10). From this analysis, it is appar-ent that much of the temperate non-woody grassland, savanna,and shrublands have been cultivated—41 percent of this MHTis now classified as agricultural land. Conversion of grasslandto agricultural land also has occurred in other MHTs, but to alesser extent: flooded grasslands are now 22 percent agricul-ture; tropical and subtropical grassland 15 percent agriculture;Mediterranean shrublands 11 percent, and montane grasslands8 percent. Tundra is the only grassland MHT with minimal re-ported cultivation (0.1 percent).
In addition to identifying MHTs, WWF–US has describedecoregions of the world. Ecoregions are defined as “a relativelylarge unit of land or water containing a characteristic set ofnatural communities that share a large majority of their spe-cies, dynamics, and environmental conditions “(Dinerstein etal. 1995: 4). Ecoregions, when aggregated, form the MHTs andrepresent the approximate original extent of their natural com-munities (Olson and Dinerstein 1997: 4).
PAGE analysts assessed land cover change in five ecoregions:one each in North America, South America, Africa, Asia, andAustralia. Each shows varying percents of habitat change—pri-marily from grassland to cropland but also from grassland tourban areas (TTTTTable 11able 11able 11able 11able 11). Within these ecoregions, the TallgrassPrairie ecoregion of North America, by far, shows the largestchange: retaining only 9 percent grassland area with 71 percentcropland and 19 percent urban area. The Cerrado Woodland andSavanna ecoregion of South America follows with a similar amountof land as cropland (71 percent), 21 percent grassland, and 5 per-cent urban. The last three ecoregions—one each in Asia, Africa,and Australia—retain at least 50 percent of their grasslands. Crop-land ranges from 19 to 37 percent and urban areas make up lessthan 2 percent of these ecoregions (Map 4Map 4Map 4Map 4Map 4).

G r a s s l a n d E c o s y s t e m s 21
G r a s s l a n d E x t e n t a n d C h a n g e
RECENT CHANGE IN GRASSLAND EXTENTExact figures for recent change in grassland extent are not readilyavailable. In general, however, native grasslands have decreased.In some areas, total area classified as grassland may have in-creased due to clearing of forests. In addition, data that arepublished for different countries or regions often are difficult tocompare because definitions of grassland are so variable.
The Food and Agriculture Organization of the United Na-tions (FAO) does not provide estimates of the extent of grass-land in each country. In the past, FAO has reported on perma-nent pasture (defined as land used for at least five years forherbaceous forage crops, either cultivated or growing wild) andincluded shrubs and savanna in either the permanent pasturecategory or the forests and woodlands category. Grassland notused for forage was included in the category “other land.” This“other land” category could not be used to determine ungrazedpasture, however, because it combined grassland not used forpasture with uncultivated land, built-up areas, wetlands, waste-land, and roads. Because of the inexact method for definingpermanent pasture, data in this category has not been reportedby FAO since 1994.
The U.S. Geological Survey has reported on the change inextent of North American grasslands over the last 170 years(Samson et al. 1998: 439). The data are based on estimatesfrom state and provincial conservation organizations, and showthat since 1830, the tall-grass prairie of North America hasdecreased by nearly 97 percent (TTTTTable 12able 12able 12able 12able 12). Mixed-grass prai-rie has decreased by 64 percent, from approximately 628,000km2 to 225,803 km2. Short-grass prairie has decreased by nearly
66 percent, from approximately 181,790 km2 to 62,115 km2.These prairies are described as the most threatened ecologicalcommunity in North America (Samson and Knopf 1994: 418).Considered in their entirety, the prairies of central North Americahave declined by an average of 79 percent since the early 1800s.
Change in the extent of grassland also can be analyzedthrough the use of Landsat TM (Thematic Mapper) imagery witha ground resolution of 30 meters. The Nature Conservancy (TNC)has identified 15 ecoregions in the Great Plains of North Americafor developing ecoregional conservation plans (Ostlie andHaferman 1999: 138). TNC delineated the Great Plains as a2.6 million km2 bioregion that encompasses 15 ecoregionsadapted from Bailey (1995) and the Ecological StratificationWorking Group (1995). Using TM imagery, TNC identified rela-tively large, untilled areas (exceeding 65–130 km2) in each ofthe Great Plains ecoregions that have initiated ecoregional con-servation (Figure 4Figure 4Figure 4Figure 4Figure 4). These areas generally have not been tilledand 80 percent of the land is expected to be in native vegeta-tion (Wayne Ostlie, TNC, Boulder, CO; personal communica-tion, May 1999). Other portions of these landscapes may in-clude tilled land, land set aside in the Conservation ReserveProgram, or lands tilled in the past (typically after the 1930s)but not revegetated. These largely untilled areas are more likelyto maintain large-scale ecological processes than smaller areasand to enhance the potential for long-term viability of speciesand natural communities (Ostlie and Haferman 1999: 143).
Although the eastern Great Plains and its tall-grass ecosys-tem has been nearly completely converted to agriculture or ur-ban areas, the western Great Plains ecoregions retain areas of
Table 11
Conversion of Grassland Ecoregions
Estimated Conversion:
Ecoregion
Current GrasslandExtent
(percent)Cropland Extent
(percent)Urban Extent
(percent)Othera
(percent)
North American Tallgrass Prairieb 9.4 71.2 18.7 0.7
South American Cerrado Woodlandand Savannac
21.0 71.0 5.0 3.0
Asian/Daurian Stepped 71.7 19.9 1.5 6.9
Central and Eastern Mopane andMiombo Woodlandse
73.3 19.1 0.4 7.2
Southwest Australian Shrublandsand Woodlandsf
56.7 37.2 1.8 4.4
Sources: PAGE calculations based on GLCCD 1998; Olson 1994a and b; WWF-US 1999.
Notes:a.The “ Other” category represents other PAGE land cover classification such as deciduous broadleaf forests or mixed forests.b.Ecoregion is in North America: United States.c.Ecoregion is in South America: Brazil, Paraguay, and Bolivia.d.Ecoregion is in Asia: Mongolia, Russia, and China.e.Ecoregion is in Sub-Saharan Africa: Tanzania, Rwanda, Burundi, Dem. Rep. Congo, Zambia, Botswana, Zimbabwe, and Mozambique.f.Ecoregion is in Oceania: Australia.
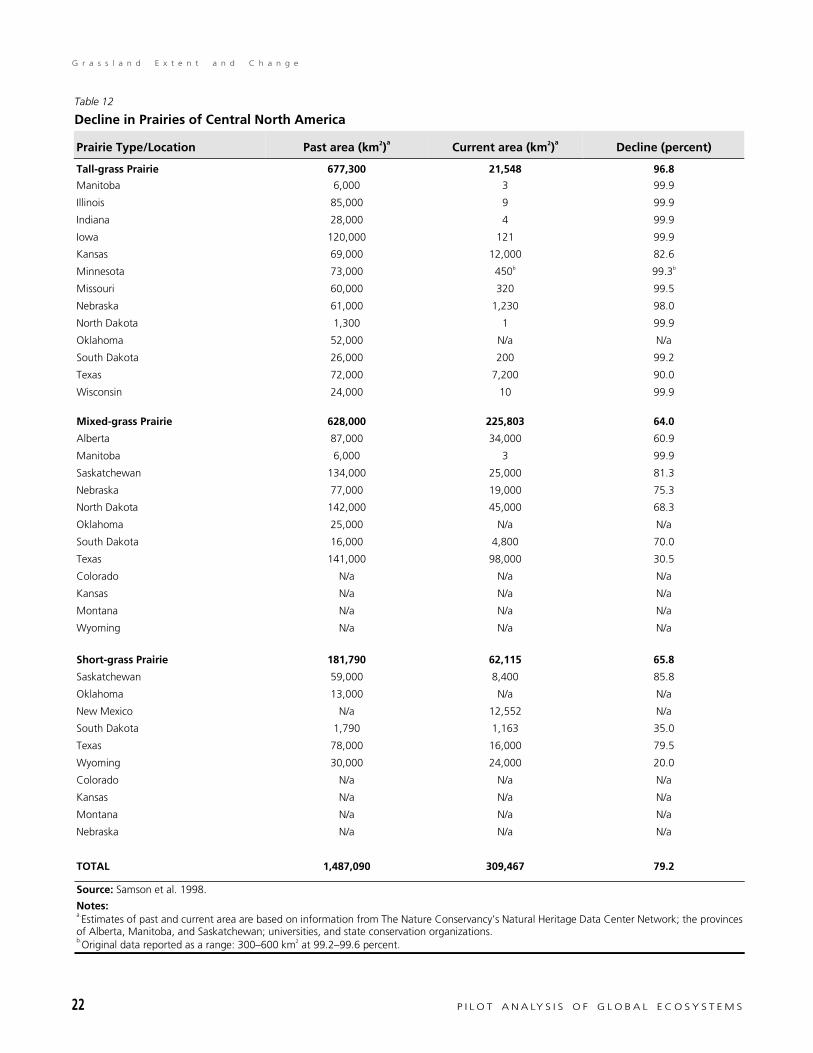
22 P I L O T A N A LY S I S O F G L O B A L E C O S Y S T E M S
G r a s s l a n d E x t e n t a n d C h a n g e
Table 12
Decline in Prairies of Central North America
Prairie Type/Location Past area (km2)a Current area (km2)a Decline (percent)
Tall-grass Prairie 677,300 21,548 96.8
Manitoba 6,000 3 99.9
Illinois 85,000 9 99.9
Indiana 28,000 4 99.9
Iowa 120,000 121 99.9
Kansas 69,000 12,000 82.6
Minnesota 73,000 450b 99.3b
Missouri 60,000 320 99.5
Nebraska 61,000 1,230 98.0
North Dakota 1,300 1 99.9
Oklahoma 52,000 N/a N/a
South Dakota 26,000 200 99.2
Texas 72,000 7,200 90.0
Wisconsin 24,000 10 99.9
Mixed-grass Prairie 628,000 225,803 64.0
Alberta 87,000 34,000 60.9
Manitoba 6,000 3 99.9
Saskatchewan 134,000 25,000 81.3
Nebraska 77,000 19,000 75.3
North Dakota 142,000 45,000 68.3
Oklahoma 25,000 N/a N/a
South Dakota 16,000 4,800 70.0
Texas 141,000 98,000 30.5
Colorado N/a N/a N/a
Kansas N/a N/a N/a
Montana N/a N/a N/a
Wyoming N/a N/a N/a
Short-grass Prairie 181,790 62,115 65.8
Saskatchewan 59,000 8,400 85.8
Oklahoma 13,000 N/a N/a
New Mexico N/a 12,552 N/a
South Dakota 1,790 1,163 35.0
Texas 78,000 16,000 79.5
Wyoming 30,000 24,000 20.0
Colorado N/a N/a N/a
Kansas N/a N/a N/a
Montana N/a N/a N/a
Nebraska N/a N/a N/a
TOTAL 1,487,090 309,467 79.2
Source: Samson et al. 1998.
Notes:a.Estimates of past and current area are based on information from The Nature Conservancy’s Natural Heritage Data Center Network; the provincesof Alberta, Manitoba, and Saskatchewan; universities, and state conservation organizations.b.Original data reported as a range: 300– 600 km2 at 99.2– 99.6 percent.

G r a s s l a n d E c o s y s t e m s 23
G r a s s l a n d E x t e n t a n d C h a n g e
untilled lands. These short-grass prairie areas have not been asexploited for agriculture because their soils are shallow, rocky,or sandy, and their precipitation unreliable. The Nature Con-servancy points out, however, that the resource inventory ofnatural communities has been sparse in these areas, and thedistribution of untilled tracts within the ecoregions is not uni-form (Ostlie and Haferman 1999: 146). For example, in theCentral Short-grass Prairie, a single community—sandsage—dominates the majority of the untilled landscapes, and much ofthe prairie is undergoing conversion to agriculture.
Outside of North America, the extent of grassland may beincreasing as forests are cleared, or decreasing as urban andagricultural areas expand. With a few exceptions, records onthe rate and extent of change are not well documented. Datapresented by the IUCN-World Conservation Union in 1991 sum-marize the extent of and change in the lowland grasslands ofcentral and eastern Europe (IUCN 1991). Grassland status, dis-tribution, and recent losses are presented for 14 countries: Al-bania; Bulgaria; Czechoslovakia (pre-breakup); Germany (por-tion); Hungary; Poland; Romania; the former western SovietRepublics of Ukraine, Belarus, Lithuania, Moldova, Latvia, and
Estonia; and Yugoslavia (pre-breakup). IUCN data on perma-nent pasture, an inexact category for defining grassland, re-veals that over the ten-year period from 1976 to 1986 extent ofchange in this pasture in eight of these countries (data for eachof the former Soviet Republics are not reported) ranged from a7.7 percent decrease for the Federal Republic of Germany to a13.5 percent increase for Bulgaria. This relatively large increasefor Bulgaria may be misleading, however, as it is primarily as-cribed to the conversion of meadow to pasture (IUCN 1991:13).
Data on change in land cover in Australia over the last 200years reveal an increase in grassland area. According to theState of the Environment Advisory Council (1996: 6–14), range-lands occupy about 75 percent of the continent (approximately6 million km2). Shrubland occupies 46 percent of the conti-nent; woodland, 42 percent; and tussock grasslands, 9 percent.From 1788 to 1988, forests were thinned to woodland andcleared for grazing, woodland was thinned to open woodlandand cleared for pasture and cropland, and shrubland was thinned(State of the Environment Advisory Council 1996: 6–11). Grass-land (without an overstory of woody vegetation) increased from7 percent to almost 16 percent of the continent’s surface. Majorchanges include an increase of 3 percent in tussock grasslandsand an increase of 6 percent in sown pasture grasses. Althoughthere has been a 9 percent increase in grassland area, 8 percent ofthe native grassland present in 1788 is now open woodland.
Data on land use change in Africa suggest conversion of drygrassland areas to agriculture. According to the United StatesAgency for International Development (USAID) Famine EarlyWarning System (FEWS), over the period 1976–1996, peoplein Kenya moved from lands with high agricultural potential tosemi-arid lands with lower agricultural potential (FEWS 1996).FEWS reports that Kenya increased maize production by 4.8percent per year during the 1970s. By the mid-1980s, land inthe zones with high agricultural potential was scarce, and plant-ing increased in marginal areas, which (along with decreases inyields from improved varieties of maize) led to stagnating trendsin production. The amount of marginal land turned to agricul-ture is not documented but these areas reflect recent conver-sion of dry grassland areas to cropland.
Human Modification of Grassland CoverA variety of modifications influence the functioning of grass-land ecosystems. The major modifications addressed in this re-port are conversion of land to agriculture, urbanization/humansettlement, desertification, fire, grazing of domestic livestock,fragmentation, and the introduction of non-native species.
AGRICULTUREChange in grasslands has been brought about primarily by con-version of these ecosystems to agriculture. The effects of this
Figure 4Untilled Landscapes in the Great Plains
Source: Ostlie and Haferman 1999.
24 P I L O T A N A LY S I S O F G L O B A L E C O S Y S T E M S
G r a s s l a n d E x t e n t a n d C h a n g e
conversion can be dramatic: native vegetation is removed andreplaced with seed for crops; soil is exposed and becomes vul-nerable to wind and water erosion; fertilizers and pesticides areadded, changing soil composition; and water-holding capacityis altered, changing the moisture regime for plants and ani-mals. Some native grassland species are able to survive thechanges and continue to reproduce in the agricultural environ-ment. Most species fail to reproduce successfully, or they mi-grate to more suitable habitat.
Graetz (1994: 132–145) presents an historical depiction ofgrassland use driven by human population growth, affluence,and technology. Grasslands may first be used by hunter-gather-ers and later by nomads (who herd domesticated livestock) andsedentary pastoralists. Later still, agriculturists might turn pro-ductive areas into croplands. Wealth and technology develop-ments, as well as climate and soil changes, influence the scaleand extent of the grassland transformation.
Variations of this conversion process can be traced in theGreat Plains of North America and the African Sahel. Managedagriculture began in the eastern Great Plains in the 1850s, re-ducing vegetative cover and destabilizing the soil (Samson etal. 1998: 443). In the 1930s, large dust storms brought on byclimatic drought devastated the area of exposed, cultivated prai-rie soil. Primarily through use of technology and fossil fuels,the prairies of North America were transformed into croplandsproducing food for the world. Today, agriculture dominates theregion but only with heavy use of fertilizers, chemicals, irriga-tion, and fossil fuel.
In the African Sahel, nomadic pastoralism persisted for amuch longer time without major changes (Graetz 1994: 138).Not until the 1950s, with post-World War II aid and other sourcesproviding access to permanent water, did agriculture expandand nomadism decline. With access to medical and veterinaryservices, human and livestock populations increased. Today,cropland is maintained with low external inputs, although over-all production is low and there is evidence of desertification.The grasslands of both regions have been largely altered fromtheir natural condition, primarily through agriculture, but atdifferent rates and with different outcomes.
Using the AVHRR 1-km satellite data, we altered the PAGEclassification for grasslands to highlight modification of grass-lands by agricultural production. The result is illustrated with acomparison of Map 1 and Map 5Map 5Map 5Map 5Map 5. On Map 1, mapping units repre-senting areas of greater than 60 percent agriculture are identifiedas cropland, units representing areas of 40–60 percent agricul-ture are identified as cropland mosaic, and units representing ar-eas of 30–40 percent agriculture are identified as grassland (orforest, depending on the dominant vegetation type).
On Map 5, mapping units representing 30–40 percent agri-culture are identified as “grassland and agriculture mosaic,”rather than grassland. When these units are excluded from the
total area in grassland, that area decreases by approximately7.1 million km2 (TTTTTable 4able 4able 4able 4able 4). The decrease in grassland in Sub-Saharan Africa is the largest: approximately 3.5 million km2
(TTTTTable 4 able 4 able 4 able 4 able 4 and Map 5 Map 5 Map 5 Map 5 Map 5). South America and Asia also have sub-stantial areas where grasslands may be considerably altered byagriculture; 1.4 million km2 in South America (especially innortheastern Brazil) and 1.2 million km2 in Asia (most apparenton the map in Kazakhstan and nearby countries).
Urbanization/Human SettlementsAlong with conversion of grassland to agricultural land, humansettlements and urbanization of grasslands have greatly modi-fied these ecosystems. The prairies of North America were hometo many early European settlers attracted to these large openexpanses. Land clearing of trees was not required and the thickprairie sod provided building material for homes. Fuel wasreadily available from woody vegetation and animal dung. To-day these ecosystems continue to support large numbers ofpeople in all regions of the world.
To present human population estimates for grasslands, PAGEanalysts used data from an inventory of national censuses com-piled by administrative units. The data were standardized to1995 and translated into a global grid of 4.6-kilometer by 4.6-kilometer cells, each cell reflecting population counts in therespective administrative units intersecting with this cell. Themap of PAGE ecosystem extent was scaled to match the resolu-tion of the population data, generalizing from 1-kilometer by 1-kilometer to the 4.6-kilometer by 4.6-kilometer cells. To calcu-late population according to ecosystem type, the population ofeach cell was assigned to the majority ecosystem type. For ex-ample, population in cells that had 51 percent grassland and49 percent forest were allocated to grassland ecosystems.
Our analysis shows that more people live in grasslands thanforests (nearly 800 million versus 446 million) (TTTTTable 4able 4able 4able 4able 4). (Thepopulation in the agriculture ecosystem is the highest of thethree terrestrial PAGE ecosystems, but, because the agricul-ture PAGE land area includes urban areas [see notes for table4] this population estimate is not directly comparable with thatof the forest and grassland estimates.) Among the four grass-land types (savanna, shrubland, non-woody grassland, tundra),most people live in savannas—in Sub-Saharan Africa (approxi-mately 266 million people) (TTTTTable 6able 6able 6able 6able 6). Shrublands support approxi-mately 239 million people, less than savannas but more than non-woody grassland and tundra. Shrublands in Asia are more heavilypopulated than the other regions. Non-woody grasslands are lesspopulated with 149.2 million people, those in Asia again supportmore people than the other regions. Tundra is the least populatedgrassland type supporting 11.5 million people.

G r a s s l a n d E c o s y s t e m s 25
G r a s s l a n d E x t e n t a n d C h a n g e
DESERTIFICATIONDesertification may be the most severe modification of grasslandecosystems (Graetz 1994: 132). The United Nations Conventionto Combat Desertification (UNCCD) defines desertification as “landdegradation in arid, semi-arid, and dry sub-humid areas resultingfrom various factors, including climatic variations and human ac-tivities” (UNCCD 1999: 7). Thus, desertification is “not purely aclimatological phenomenon. On the contrary, social, political, eco-nomic, and cultural factors that strain the drylands beyond eco-logically sustainable limits are often the main driving forces“(UNSO 1997: 4).
Two atlases of desertification have been published by theUnited Nations Environment Programme to assess desertifica-tion on a global scale (UNEP 1992,1997). These atlases ad-dress problems associated with desertification in the world’sdrylands which include grasslands in the arid, semi-arid, anddry sub-humid areas. Global aridity zones and human popula-tions living in them are described above. In a subsequent re-port, WRI will address the condition of soil and vegetation indrylands, including dry grasslands, and will examine modifica-tions that can lead to their degradation and desertification.
FIREFire is an important factor in maintaining grassland ecosystems.Fire prevents bush encroachment, removes dead herbaceousmaterial, and recycles nutrients. Without fire, organic matterand litter would accumulate and tree densities would increase,leading eventually to forested areas. The timing, frequency, andintensity of fires determine specific effects of these events onthe functioning of grassland ecosystems (Andreae 1991).
Natural fires are thought to occur once every 1 to 3 years inhumid areas (Frost 1985: 232) and once every 1 to 20 years indry areas (Walker 1985: 83). Today, the frequency of fires ingrasslands varies naturally with climate but also with choice ofmanagement objectives. In many African countries, burningclears away dead debris and is highly desirable to maintaingood grass conditions for grazing herds of livestock. Large partsof the African savannas are burned annually. The burned areasrange from 25 to 50 percent of the total land surface in the aridSudan Zone and from 60 to 80 percent in the humid GuineaZone (Menaut et al. 1991: 137). As much as 5 million km2 oftropical and subtropical savannas, woodlands, and open forestsnow burn each year (Levine et al. 1999: 4).
Despite providing important services for maintaining natu-ral and human-influenced grasslands, fire can be harmful. Es-pecially when very hot and frequent, fire can destroy vegetationand increase soil erosion. Fire also releases atmospheric pol-lutants. According to a recent UNEP report analyzing the sig-nificance of fire to the global environment, uncontrolled or mis-used fires can cause “tremendous adverse impacts on the envi-ronment and human society” (Levine et al. 1999: 1). Biomass
burning is recognized as a significant source of atmospheric emis-sions and described as the source of nearly 40 percent of grosscarbon dioxide and tropospheric ozone (Levine et al. 1999: 2.)
Major components of biomass burning are forests, savannas,agricultural lands after harvest, and wood for cooking, heating,and charcoal production. Burning of tropical savannas “is esti-mated to destroy three times as much dry matter per year as theburning of tropical forests.” The UNEP report notes that most ofthe biomass burned today is from savannas. Because two-thirds ofthe world’s savannas are in Africa, that continent is now recog-nized as the ‘burn center’ of the planet (Levine et al. 1999: 2).
The European Space Agency for Africa, Latin America, andIndo-Malaysia/Oceania has used AVHRR data to map the loca-tion of all fires detected during 1993 (Arino and Melinotte 1997)(Map 6Map 6Map 6Map 6Map 6). (NASA’s Earth Observatory website posts fire dataacquired by the TRMM VIRS sensor for 1999-2000. NASA iscurrently developing the capability to provide fire counts andadditional fire information at roughly 4 km2 grid cells at monthlyintervals. These data, however, are not yet available for generalanalysis [Jackie Kendall, Science Systems and Applications, Inc.,Lanham, Maryland, personal communication, May 2000]). Thefire map shows that fire on the African continent is confined bythe Sahara Desert to the north, by the Horn of Africa to the east,and by the Kalahari Desert to the south (Arino and Melinotte 1998:2022). A comparison of the fire map with the PAGE land cover forAfrica, indicates that tropical rainforest, especially in central Af-rica, is a fire boundary. Fires are greatest in the grasslands oneither side of the equator. A somewhat similar pattern is found inSouth America where the least number of fires occur in the Ama-zon Basin and southern Patagonia, and the greatest number occurin the grasslands of eastern Brazil and Venezuela.
Although some fires are recognized as critical to the mainte-nance of grassland ecosystems, and serve as an important man-agement tool, new fire datasets showing broad-scale fire distri-bution raise new questions. Are the frequency and extent offires shown in these maps typical or has there been a recentincrease? What are the short- and long-term effects of thesefires on ecosystem services? Continued monitoring using satel-lite data as well as field studies should provide answers.
DOMESTIC LIVESTOCKWild ungulates are an essential component of energy and nutri-ent flows in grassland ecosystems. By contrast, domestic live-stock generate effects that are disputed as either positive ornegative, particularly in relation to different stocking densitiesand different grassland environments; these topics are discussedin the literature and are mentioned further in the animal forageand products chapter of this report. The focus in this section, isto highlight potential changes that domestic livestock may haveon natural grasslands—at the same time recognizing that range-land livestock production using ecologically sound management
26 P I L O T A N A LY S I S O F G L O B A L E C O S Y S T E M S
G r a s s l a n d E x t e n t a n d C h a n g e
practices is essential to supporting human populations and life-styles (Dodd 1994: 33).
Large populations of herbivores, including bison of NorthAmerica, wildebeest and zebra of Africa, and Tibetan antelopeof Asia have been characteristic of the world’s major grasslands.As an integral part of the grassland ecosystem, these herbivorescan have a major influence on ecosystem functioning. Throughgrazing, these animals stimulate regrowth of grasses and re-move older, less productive plant tissue. The thinning of olderplant tissue in turn leads to increased light absorption and moreefficient use by younger plants, and improved soil moisture(Frank et al. 1998: 518).
Grasslands and populations of wild ungulates have coexistedfor millions of years, their simultaneous emergence and adap-tive radiation described as “among the most thoroughly docu-mented evolutionary patterns in the fossil record” (Frank et al.1998: 519):
This long coevolutionary history between grasslands andungulates is testimony to the high sustainability of the grazingecosystem. Key stabilizing elements of this habitat are the largespatial and temporal variation in mineral-rich forage; the mi-gratory behavior of ungulates, which track high-quality forageacross a large region; and the intercalary meristem of grasses,which allows defoliated plants to regrow.
A comparison of the grazing of grasslands by wild ungulatesand domestic livestock underline important transformations ingrassland ecosystems. Domestic livestock are raised to maxi-mize animal biomass through various techniques, includingveterinary care and predator control, as well as water, mineral,and feed supplements. The result is generally higher biomassof domestic animals on pasture and rangelands than biomass ofwild ungulates on grasslands (Frank et al. 1998: 519; Oesterheldet al. 1992). In high densities, grazing animals can change flo-ristic composition, structural characteristics of vegetation, re-duce biodiversity, and increase soil erosion; in extreme situa-tions, grazing may eliminate much vegetation cover (Evans 1998:263). The extent to which these changes occur may depend notonly on the number of livestock but also on the pattern of theirgrazing.
Human herding of domestic livestock does not replicate themovements of wild ungulates; use of water pumps and barbed-wire fences have led to more sedentary and concentrated use ofgrasslands by domestic animals (Frank et al. 1998: 519;McNaughton 1993b). Thus, densities of domestic livestock maybe higher than those of wild ungulates, and the grazing patternsof the former may limit the recovery of defoliated grasses.
Some studies have observed complementarities between wild-life and livestock (Steinfeld et al. 1996: 16). Evidence fromthese studies suggests that raising wildlife and livestock togethercan support greater biodiversity without lowering incomes forranchers. The studies indicate that livestock-wildlife combina-
tions may not require large reductions in livestock stocking rates.The studies also suggest that wildlife ranching solely for thepurpose of producing game is not financially viable since themarket for such meat is small (Steinfeld et al. 1996: 16). Choiceof management objectives in raising domestic livestock, in ad-dition to the physical and biological characteristics of the area,play a role in rangeland condition and are discussed later inthis report.
FRAGMENTATIONLike forests, grasslands may be fragmented as a result of hu-man or natural causes. Natural causes include geographic fea-tures such as rivers and shorelines. Agriculture and road build-ing are the most notable forms of grassland fragmentation causedby humans. Other forms include fencing and woody invasion.
In its assessments of grasslands in North America and LatinAmerica, WWF–US has developed an index for the size andfragmentation of habitat blocks (Ricketts et al. 1997; Dinersteinet al. 1995). The block size index for each ecoregion rangesfrom 2 (large and numerous habitat blocks) to 25 (small and fewblocks). The index varies with the size of the ecoregion, whichWWF–US has divided into two categories for North America(greater than 10,000 km2 and less than 10,000 km2), and threecategories for Latin America (greater than 3,000 km2, 1–3,000km2, and less than 1,000 km2) as well as with the size of blockswithin each ecoregion.
WWF–US relied on regional experts to classify the ecoregionsaccording to broad fragmentation categories, ranging from 0 (rela-tively contiguous regions where long-distance dispersal alongelevational and climatic gradients is still possible) to 20/25 (highlyfragmented regions where habitat blocks are small, noncircular,or both, and where edge effects have altered most core habitat).
According to Ricketts et al. (1997: 33), of the 27 ecoregionswithin the North American grasslands (excluding deserts), 6have either small and few blocks or high fragmentation. Twelveadditional ecoregions have both small and few habitat blocksand high fragmentation: the California Central Valley Grass-lands, the Canadian Aspen Forest and Parklands, the NorthernMixed Grasslands, the Northern Tall Grasslands, the CentralTall Grasslands, the Central and Southern Mixed Grasslands,the Central Forest/Grassland Transition Zone, the Edwards Pla-teau Savannas, the Western Gulf Coastal Grasslands, the Cali-fornia Coastal Sage and Chaparral, the Hawaiian LowShrublands, and the Tamaulipan Mexquital in Texas and Mexico(Map 7Map 7Map 7Map 7Map 7). Of the 63 ecoregions within Latin American grass-lands (excluding deserts), 11 have either small and few blocksor high fragmentation. Four additional ecoregions have bothsmall and few habitat blocks and high fragmentation: the Lee-ward Islands Xeric Scrub, the Central Mexican Mexquital, thePueblan Xeric Scrub in Mexico, and the Motagua ValleyThornscrub in Guatemala (Map 7Map 7Map 7Map 7Map 7).

G r a s s l a n d E c o s y s t e m s 27
G r a s s l a n d E x t e n t a n d C h a n g e
These categorizations, based on expert opinion (not actualmeasurements of block size or degree of fragmentation) suggestthat a large percentage of grasslands in the Western Hemispheremay be highly fragmented. In total, nearly 37 percent of the grass-land ecoregions identified in the WWF–US study are character-ized by small and few habitat blocks, high fragmentation, or both.
NON-NATIVE SPECIESSmall isolated grassland areas are subject to invasion by exoticspecies (Risser 1996: 267). Although some non-indigenous spe-cies such as food crops, pets, ornamentals, and biological con-trol agents are usually considered beneficial, others can causeenvironmental damage. The Congressional Office of Technol-ogy Assessment estimated that at least 4,500 species have beenintroduced into the United States and that approximately 15percent of those species have caused severe harm (Office ofTechnology Assessment 1993: 3–4).
Grasslands are major recipients of foreign species. Of ap-proximately 410 plant species on the Pawnee National Grass-lands in eastern Colorado, 70 are exotics; 16 of the 56 grassesin Badlands National Park in southwest South Dakota are non-indigenous (Licht 1997: 72). D’Antinio and Vitousek (1992: 63)describe the human-caused breakdown of dispersal barriers—and resulting spread of non-indigenous species—as responsiblefor the extinction of more grassland species than any other fac-tor except habitat loss.
The introduction of horses, sheep, and cattle, along with in-creased agricultural activities, has largely transformed the Argen-tine pampas from their 16th century state. Charles Darwin notedthe great changes effected by these species as early as 1833:
…few countries have undergone more remarkablechanges, since the year 1435, when the first colonistsof La Pampa landed with seventy-two horses. Thecountless herds of horses, cattle and sheep, not onlyhave altered the whole aspect of the vegetation, butthey have almost banished the guanaco, deer and os-trich (sic) (Soriano et al. 1992: 400).
Since European settlement of Australia, more then 1,900vascular plant species have been either intentionally or acci-dentally added to the country’s 15,000 indigenous species. Morethan 220 of these introduced species have been declared asnoxious. One of these plants is Parthenium, which invades pas-
ture as well as cropland and causes several allergic reactions inlivestock and humans (Ricciardi et al. 2000: 239). At least 46percent of the 220 noxious plants were introduced deliberately.
At several workshops in 1998, invasive species were dis-cussed as an international problem, and databases related tothe study"and documentation of such species were reviewed(Ridgway et al. 1999; Ricciardi et al. 2000). The National Bio-logical Information Infrastructure (NBII) website provides in-formation on these databases (http://www.nbii.gov/invasive/workshops/dbsurveys.html). Ricciardi et al. (2000: 239) call fora global information system for invasive species and provide alist of invasive species databases available on the Internet.
Global Grassland Cover: InformationStatus and NeedsThe extent of grasslands is difficult to determine in the absenceof (1) a more universally accepted definition or set of defini-tions of grasslands, and (2) agreement on methods to determineboundaries between forests and grasslands and between agri-cultural land/permanent pasture and grasslands. Higher reso-lution satellite data would permit more accurate interpretationsof land cover. Field verification with transect checks in selectedareas could further improve the accuracy of land cover inter-pretation. Use of satellite data at l kilometer generally is not ofsufficient resolution for country-level analysis. Data of greaterthan 1 kilometer resolution are collected, for example, LandsatThematic Mapper (TM) at 30 meters, and SPOT (Systeme Pourl’Observation de la Terre) satellite images at 10 to 20 meters.These remote-sensing platforms, however, are not yet widelyavailable and their use can be expensive.
Global data for evaluating historical change in grasslandsand the effects of major modifications, including conversion toagriculture, urbanization, fire, grazing of domestic livestock,fragmentation, and the introduction of non-native species, arelimited in quality but are generally improving. Regional stud-ies in some areas document extensive conversion of grasslandsto cropland and human settlements. Fire and the grazing of live-stock on open rangelands are becoming better quantified, butdocumentation of their effects requires further analysis. Frag-mentation and the invasion of non-native species are problemsthat require thorough regional and local study. We need betterdata to analyze global trends in these phenomena.
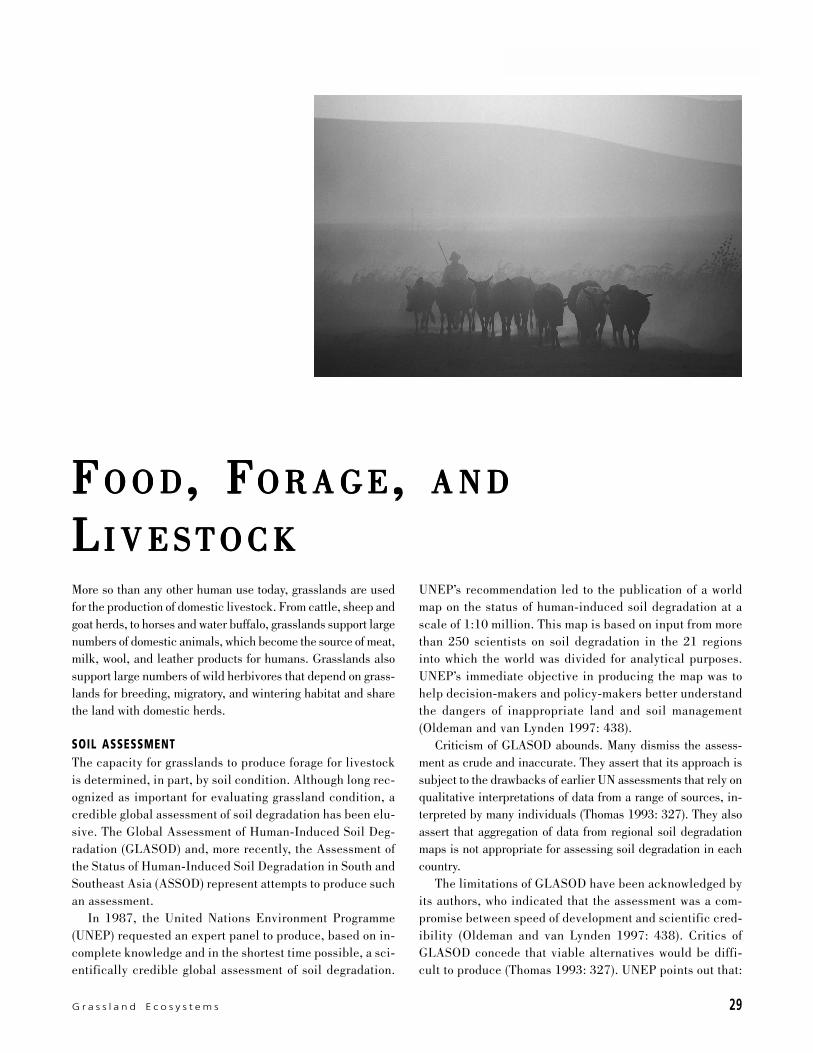
G r a s s l a n d E c o s y s t e m s 29
R e f e r e n c e s
More so than any other human use today, grasslands are usedfor the production of domestic livestock. From cattle, sheep andgoat herds, to horses and water buffalo, grasslands support largenumbers of domestic animals, which become the source of meat,milk, wool, and leather products for humans. Grasslands alsosupport large numbers of wild herbivores that depend on grass-lands for breeding, migratory, and wintering habitat and sharethe land with domestic herds.
SOIL ASSESSMENTThe capacity for grasslands to produce forage for livestockis determined, in part, by soil condition. Although long rec-ognized as important for evaluating grassland condition, acredible global assessment of soil degradation has been elu-sive. The Global Assessment of Human-Induced Soil Deg-radation (GLASOD) and, more recently, the Assessment ofthe Status of Human-Induced Soil Degradation in South andSoutheast Asia (ASSOD) represent attempts to produce suchan assessment.
In 1987, the United Nations Environment Programme(UNEP) requested an expert panel to produce, based on in-complete knowledge and in the shortest time possible, a sci-entifically credible global assessment of soil degradation.
UNEP’s recommendation led to the publication of a worldmap on the status of human-induced soil degradation at ascale of 1:10 million. This map is based on input from morethan 250 scientists on soil degradation in the 21 regionsinto which the world was divided for analytical purposes.UNEP’s immediate objective in producing the map was tohelp decision-makers and policy-makers better understandthe dangers of inappropriate land and soil management(Oldeman and van Lynden 1997: 438).
Criticism of GLASOD abounds. Many dismiss the assess-ment as crude and inaccurate. They assert that its approach issubject to the drawbacks of earlier UN assessments that rely onqualitative interpretations of data from a range of sources, in-terpreted by many individuals (Thomas 1993: 327). They alsoassert that aggregation of data from regional soil degradationmaps is not appropriate for assessing soil degradation in eachcountry.
The limitations of GLASOD have been acknowledged byits authors, who indicated that the assessment was a com-promise between speed of development and scientific cred-ibility (Oldeman and van Lynden 1997: 438). Critics ofGLASOD concede that viable alternatives would be diffi-cult to produce (Thomas 1993: 327). UNEP points out that:
FFFFF O O DO O DO O DO O DO O D, F, F, F, F, FO R A G EO R A G EO R A G EO R A G EO R A G E, , , , , A N DA N DA N DA N DA N D
LLLLL I V E S T O C KI V E S T O C KI V E S T O C KI V E S T O C KI V E S T O C K

F o o d , F o r a g e , a n d L i v e s t o c k
30 P I L O T A N A LY S I S O F G L O B A L E C O S Y S T E M S
Although GLASOD was by necessity a somewhat sub-jective assessment it was extremely carefully preparedby leading experts in the field. It remains the onlyglobal database on the status of human-induced soildegradation, and no other data set comes as close todefining the extent of desertification at the global scale(UNEP 1997: V).
In 1993, in response to requests for more detailed informa-tion on soil degradation, the Asia Network on Problem Soilsrecommended preparation of a soil degradation assessment forSouth and Southeast Asia (ASSOD) at a scale of 1:5 million.The methodology of this assessment reflects comments from thepeer review of GLASOD. As a result, ASSOD has a more objec-tive cartographic base and uses the internationally endorsedWorld Soils and Terrain Digital Database (SOTER) to delineatemapping units (Oldeman and van Lynden 1997: 438). LikeGLASOD, ASSOD focuses on displacement of soil material bywater or wind, and in-situ deterioration of soil by physical, chemi-cal, and biological processes. ASSOD, however, places moreemphasis on trends of degradation and the effects of degrada-tion on productivity. Unlike GLASOD, it includes some infor-mation on conservation and rehabilitation (Oldeman and vanLynden 1997: 432).
Although an improvement over GLASOD, ASSOD is not with-out problems. The assessment of the degree, extent, and recentpast rate of soil degradation is still based on expert opinion,and the scale (1:5 million) is still not adequate to guide nationalsoil improvement policies (Oldeman and van Lynden 1997: 438).Oldeman and van Lynden recommend, as a next step, the prepa-ration of national 1:1 million soil and terrain digital databasesthat would support a more objective assessment of the status ofsoils and the risk of human-induced soil degradation.
GRASSLAND SOIL CONDITIONHistorical records suggest evidence of large-scale soil degrada-tion in many areas of the world over the past 5,000 years (Scherr1999:17). GLASOD was designed to provide estimates of theextent and severity of soil degradation for a shorter, more recenttime period: from 1945 to 1990. GLASOD divides soil degrada-tion into four categories: water erosion, wind erosion, chemicaldeterioration, and physical deterioration. For each category,GLASOD advisors estimated the proportional area affected bydegradation (extent) and the scale of degradation (degree).GLASOD concluded that approximately 23 percent of the world’sused terrestrial area was degraded: 38 percent was lightly de-graded; 46 percent moderately degraded; and 16 percent stronglyto extremely degraded (Oldeman and van Lynden 1997: 430).
To determine the condition of grassland soils, PAGE ana-lysts superimposed the GLASOD map of soil degradation se-verity over the map of PAGE grassland extent. The overlay of
these two maps, however, tends to overestimate the severity ofsoil degradation in grasslands; GLASOD mapping units intersect-ing PAGE grassland extent are large and the assigned degrada-tion severity class may not represent the entire area. For example,an entire GLASOD mapping unit may be assigned a degradationseverity class of “very high” if as little as 11 percent of its extenthas an extreme degree of erosion. This could mean that whilesome land within the mapping unit is degraded, other land is not.Thus, we were unable to determine consistently and accuratelythe amount of overlap between soil degradation severity withinthe GLASOD mapping units and PAGE grasslands.
To avoid this misrepresentation, PAGE analysts used theextent and degree attributes of GLASOD degradation mappingunits rather than the severity class. We tabulated PAGE grass-land areas that coincided with different combinations of degra-dation extent and degree from the GLASOD map (TTTTTable 13able 13able 13able 13able 13). Interms of degradation extent, nearly 60 percent of PAGE grass-lands have 5 percent or less of their area degraded. Over 20percent of PAGE grassland correspond with GLASOD mappingunits that have 25 to 50 percent of their extent degraded; 4.1percent of PAGE grasslands correspond with degradation unitswhere more than half the area is degraded. In terms of the degreeof degradation, about 46 percent of PAGE grasslands are not de-graded; almost 49 percent are lightly to moderately degraded, andjust over 5 percent are strongly to extremely degraded.
ASSOD assesses soil degradation in 17 countries in Southand South-East Asia (UNEP 1997: 77). According to the PAGEclassification, the extent of grassland is limited in this area;areas of woody savannas are scattered throughout India,Myanmar, and Thailand, and savannas and non-woody grass-lands are found in China. Critics have pointed out that the scaleof ASSOD (1:5 million) is too broad to support national-levelplanning, but compared with GLASOD permits more preciseassessments of soil degradation in the 17 countries that it cov-ers (Oldeman and van Lynden 1997; UNEP 1992: 80). Com-bining the ASSOD data with higher-resolution land cover datamay allow better identification of the condition of grassland soils.
GRASSLAND VEGETATIONCharacteristics of vegetation can serve as indicators of the con-dition of grasslands. As noted in Table 1, ideal indicators wouldinclude measures of cover, productivity, plant species composi-tion, and root distribution. Aggregation of these measures at thelocal level to produce credible, global measures is difficult.Global estimates of more general but still useful measures havebeen made, sometimes through the use of modeled proxies.
Normalized Difference Vegetation IndexSurface reflectance data from NOAA’s Advanced Very HighResolution Radiometer (AVHRR) have been used to generate
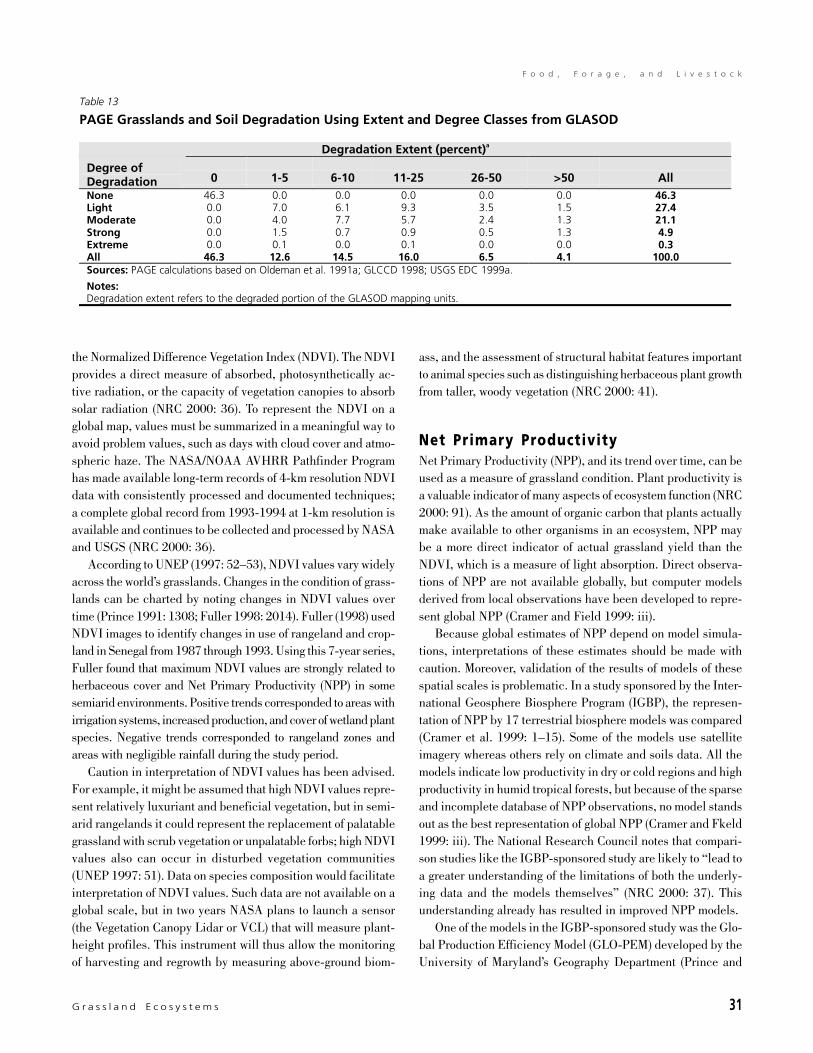
F o o d , F o r a g e , a n d L i v e s t o c k
G r a s s l a n d E c o s y s t e m s 31
the Normalized Difference Vegetation Index (NDVI). The NDVIprovides a direct measure of absorbed, photosynthetically ac-tive radiation, or the capacity of vegetation canopies to absorbsolar radiation (NRC 2000: 36). To represent the NDVI on aglobal map, values must be summarized in a meaningful way toavoid problem values, such as days with cloud cover and atmo-spheric haze. The NASA/NOAA AVHRR Pathfinder Programhas made available long-term records of 4-km resolution NDVIdata with consistently processed and documented techniques;a complete global record from 1993-1994 at 1-km resolution isavailable and continues to be collected and processed by NASAand USGS (NRC 2000: 36).
According to UNEP (1997: 52–53), NDVI values vary widelyacross the world’s grasslands. Changes in the condition of grass-lands can be charted by noting changes in NDVI values overtime (Prince 1991: 1308; Fuller 1998: 2014). Fuller (1998) usedNDVI images to identify changes in use of rangeland and crop-land in Senegal from 1987 through 1993. Using this 7-year series,Fuller found that maximum NDVI values are strongly related toherbaceous cover and Net Primary Productivity (NPP) in somesemiarid environments. Positive trends corresponded to areas withirrigation systems, increased production, and cover of wetland plantspecies. Negative trends corresponded to rangeland zones andareas with negligible rainfall during the study period.
Caution in interpretation of NDVI values has been advised.For example, it might be assumed that high NDVI values repre-sent relatively luxuriant and beneficial vegetation, but in semi-arid rangelands it could represent the replacement of palatablegrassland with scrub vegetation or unpalatable forbs; high NDVIvalues also can occur in disturbed vegetation communities(UNEP 1997: 51). Data on species composition would facilitateinterpretation of NDVI values. Such data are not available on aglobal scale, but in two years NASA plans to launch a sensor(the Vegetation Canopy Lidar or VCL) that will measure plant-height profiles. This instrument will thus allow the monitoringof harvesting and regrowth by measuring above-ground biom-
ass, and the assessment of structural habitat features importantto animal species such as distinguishing herbaceous plant growthfrom taller, woody vegetation (NRC 2000: 41).
Net Primary ProductivityNet Primary Productivity (NPP), and its trend over time, can beused as a measure of grassland condition. Plant productivity isa valuable indicator of many aspects of ecosystem function (NRC2000: 91). As the amount of organic carbon that plants actuallymake available to other organisms in an ecosystem, NPP maybe a more direct indicator of actual grassland yield than theNDVI, which is a measure of light absorption. Direct observa-tions of NPP are not available globally, but computer modelsderived from local observations have been developed to repre-sent global NPP (Cramer and Field 1999: iii).
Because global estimates of NPP depend on model simula-tions, interpretations of these estimates should be made withcaution. Moreover, validation of the results of models of thesespatial scales is problematic. In a study sponsored by the Inter-national Geosphere Biosphere Program (IGBP), the represen-tation of NPP by 17 terrestrial biosphere models was compared(Cramer et al. 1999: 1–15). Some of the models use satelliteimagery whereas others rely on climate and soils data. All themodels indicate low productivity in dry or cold regions and highproductivity in humid tropical forests, but because of the sparseand incomplete database of NPP observations, no model standsout as the best representation of global NPP (Cramer and Fkeld1999: iii). The National Research Council notes that compari-son studies like the IGBP-sponsored study are likely to “lead toa greater understanding of the limitations of both the underly-ing data and the models themselves” (NRC 2000: 37). Thisunderstanding already has resulted in improved NPP models.
One of the models in the IGBP-sponsored study was the Glo-bal Production Efficiency Model (GLO-PEM) developed by theUniversity of Maryland’s Geography Department (Prince and
Table 13
PAGE Grasslands and Soil Degradation Using Extent and Degree Classes from GLASOD
Degradation Extent (percent)a
Degree ofDegradation 0 1-5 6-10 11-25 26-50 >50 AllNone 46.3 0.0 0.0 0.0 0.0 0.0 46.3Light 0.0 7.0 6.1 9.3 3.5 1.5 27.4Moderate 0.0 4.0 7.7 5.7 2.4 1.3 21.1Strong 0.0 1.5 0.7 0.9 0.5 1.3 4.9Extreme 0.0 0.1 0.0 0.1 0.0 0.0 0.3All 46.3 12.6 14.5 16.0 6.5 4.1 100.0Sources: PAGE calculations based on Oldeman et al. 1991a; GLCCD 1998; USGS EDC 1999a.
Notes:Degradation extent refers to the degraded portion of the GLASOD mapping units.

F o o d , F o r a g e , a n d L i v e s t o c k
32 P I L O T A N A LY S I S O F G L O B A L E C O S Y S T E M S
Goward 1995; Goetz et al. 1999). Unlike the other models com-pared in the study, GLO-PEM derives all of its climate and veg-etation variables from satellite observations rather than depend-ing on calculations from data collected on the ground, such asprecipitation data from widely spaced meteorological stations(Cramer et al. 1999: 6). The NPP values derived from GLO-PEM are based on “global, repetitive, spatially contiguous, andtime-specific observations of the actual vegetation.” (Prince andGoward 1995: 815).
According to a global map representing GLO-PEM’s annualmean NPP estimates for grasslands, NPP values are generallybelow 7kgCm-2yr-1. This value decreases in areas near desertsand cooler extremes of grasslands (Map 8Map 8Map 8Map 8Map 8). Savannas and wood-lands have higher NPP values. Variations in NPP estimates mostlikely indicate the impacts of land use change, such as agricul-tural development and urbanization (see http://ww.inform.umd.edu/Geography/glopem/ for more information onthe GLO-PEM model).
Trends in Grassland Production of Food,Forage, and LivestockResearchers have used NPP data (1982-1993) from GLO-PEMto analyze interannual variation and to determine the coeffi-cient of variation (ratio of the standard deviation of annual to-tals to the long-term mean) (Goetz et al. 2000) (Map 9Map 9Map 9Map 9Map 9). Gener-ally, the regions of lower NPP have the largest percentage varia-tion in productivity from year to year. This variation may influ-ence human behavior and household decisions about whetherto migrate on a seasonal or permanent basis or whether to aban-don livestock herding for a more sedentary, agrarian existence(Prince et al. 1999: 240).
Researchers also have used GLO-PEM to analyze NPP datafor Africa (1982–1993). The resulting interannual mean NPPreveals the complexity of spatial variation in species composi-tion and biomass that is caused by climate, topography, soiltypes, and human-induced change. Some regions have stableNPP values from year to year, whereas other regions have de-creasing NPP values from one year to the next. A long-termdecline in NPP might suggest grassland degradation, but on-the-ground observations would be necessary to verify this deg-radation. Although use of a long time series of data increase thecertainty with which determinations of sustained increases ordecreases in NPP values are made, field data remain necessaryto account for changes in species composition. In addition, be-cause NPP is strongly affected by climate, declines in NPP maybe caused by a drop in precipitation or temperature changerather than by degradation of grassland. An increase in pre-cipitation could spur vegetation growth, halting what is thenrevealed to be a short-term decrease in NPP values rather thanlong-term grassland degradation.
RAIN-USE EFFICIENCYOne potential method for separating vegetation declines due tolack of rainfall from declines associated with degradation isthrough the ratio of NPP to precipitation (Prince et al. 1998:360). The rain-use efficiency index (RUE) is such a ratio. Thisindex is calculated from satellite observations of NPP (modeledwith annual integrals of NDVI from NOAA) and rain gauge data.
Prince et al. (1998) report that previous studies using localNPP observations have found strong correlations between de-clines in RUE, increases in livestock, and reductions in range-land condition. They note that further study is needed to deter-mine whether these local correlations hold on a regional scale(Prince et al. 1998: 370).
Accurate interpretations of the RUE index require informa-tion on topography, soil texture, soil fertility, vegetation type,human population, and management regimes (Prince et al. 1998:370). Decreases in RUE could be due to various factors, in-cluding degradation and run-off, soil evaporation, and infertilesoils (FigurFigurFigurFigurFigure 5e 5e 5e 5e 5). Conversely, increases in RUE may be due tofactors such as run-on, fertilizer use, and changes in speciescomposition (for example, replacement of woody C3 vegetationwith C4 grassland) (Prince et al.1998: 371).
Differences in the water balance of various climatic regimesmake grasslands influenced by the same climate more mean-ingful than cross-continental comparisons of RUE. For this rea-son, the PAGE researchers examined RUE, as calculated bythe University of Maryland, for southern Africa and Madagas-car (MapMapMapMapMap 1010101010). At this finer resolution, areas of high and lowRUE are more easily identified. Several graphs compare siteswith similar annual rainfall with trends in RUE (Figure 6Figure 6Figure 6Figure 6Figure 6).
Low RUE(Indicates lower productivity withhigher precepitation)
Possible causes:- Infertile Soil- High runoff- Soil erosion
High RUE(Indicates higher productivity withlower precepitation)
Possible causes:- Fertile Soil- External inputs: fertilizer, irrigation
Precepitation (mm)
Prim
ary
prod
uctio
n (k
g ha
-1yr
)-1
Figure 5General Representation of the Rain-Use EfficiencyIndex
Source: Modified from Prince et al. 1988; used with permission fromBlackwell Science Ltd.
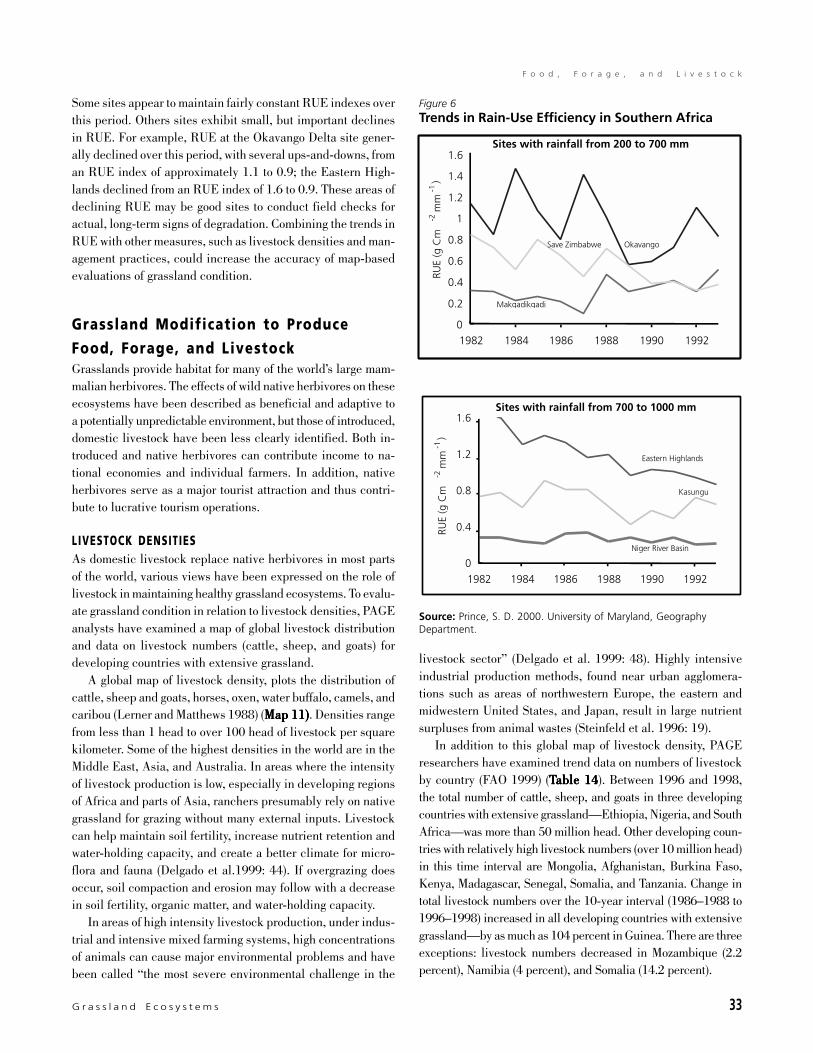
F o o d , F o r a g e , a n d L i v e s t o c k
G r a s s l a n d E c o s y s t e m s 33
Some sites appear to maintain fairly constant RUE indexes overthis period. Others sites exhibit small, but important declinesin RUE. For example, RUE at the Okavango Delta site gener-ally declined over this period, with several ups-and-downs, froman RUE index of approximately 1.1 to 0.9; the Eastern High-lands declined from an RUE index of 1.6 to 0.9. These areas ofdeclining RUE may be good sites to conduct field checks foractual, long-term signs of degradation. Combining the trends inRUE with other measures, such as livestock densities and man-agement practices, could increase the accuracy of map-basedevaluations of grassland condition.
Grassland Modification to ProduceFood, Forage, and LivestockGrasslands provide habitat for many of the world’s large mam-malian herbivores. The effects of wild native herbivores on theseecosystems have been described as beneficial and adaptive toa potentially unpredictable environment, but those of introduced,domestic livestock have been less clearly identified. Both in-troduced and native herbivores can contribute income to na-tional economies and individual farmers. In addition, nativeherbivores serve as a major tourist attraction and thus contri-bute to lucrative tourism operations.
LIVESTOCK DENSITIESAs domestic livestock replace native herbivores in most partsof the world, various views have been expressed on the role oflivestock in maintaining healthy grassland ecosystems. To evalu-ate grassland condition in relation to livestock densities, PAGEanalysts have examined a map of global livestock distributionand data on livestock numbers (cattle, sheep, and goats) fordeveloping countries with extensive grassland.
A global map of livestock density, plots the distribution ofcattle, sheep and goats, horses, oxen, water buffalo, camels, andcaribou (Lerner and Matthews 1988) (Map 11)Map 11)Map 11)Map 11)Map 11). Densities rangefrom less than 1 head to over 100 head of livestock per squarekilometer. Some of the highest densities in the world are in theMiddle East, Asia, and Australia. In areas where the intensityof livestock production is low, especially in developing regionsof Africa and parts of Asia, ranchers presumably rely on nativegrassland for grazing without many external inputs. Livestockcan help maintain soil fertility, increase nutrient retention andwater-holding capacity, and create a better climate for micro-flora and fauna (Delgado et al.1999: 44). If overgrazing doesoccur, soil compaction and erosion may follow with a decreasein soil fertility, organic matter, and water-holding capacity.
In areas of high intensity livestock production, under indus-trial and intensive mixed farming systems, high concentrationsof animals can cause major environmental problems and havebeen called “the most severe environmental challenge in the
livestock sector” (Delgado et al. 1999: 48). Highly intensiveindustrial production methods, found near urban agglomera-tions such as areas of northwestern Europe, the eastern andmidwestern United States, and Japan, result in large nutrientsurpluses from animal wastes (Steinfeld et al. 1996: 19).
In addition to this global map of livestock density, PAGEresearchers have examined trend data on numbers of livestockby country (FAO 1999) (TTTTTable 14able 14able 14able 14able 14). Between 1996 and 1998,the total number of cattle, sheep, and goats in three developingcountries with extensive grassland—Ethiopia, Nigeria, and SouthAfrica—was more than 50 million head. Other developing coun-tries with relatively high livestock numbers (over 10 million head)in this time interval are Mongolia, Afghanistan, Burkina Faso,Kenya, Madagascar, Senegal, Somalia, and Tanzania. Change intotal livestock numbers over the 10-year interval (1986–1988 to1996–1998) increased in all developing countries with extensivegrassland—by as much as 104 percent in Guinea. There are threeexceptions: livestock numbers decreased in Mozambique (2.2percent), Namibia (4 percent), and Somalia (14.2 percent).
Figure 6Trends in Rain-Use Efficiency in Southern Africa
Source: Prince, S. D. 2000. University of Maryland, GeographyDepartment.
0
0.4
0.8
1.2
1.6
1982 1984 1986 1988 1990 1992
Sites with rainfall from 700 to 1000 mm
Eastern Highlands
Kasungu
Niger River Basin
0
0.2
0.4
0.6
0.8
1
1.2
1.4
1.6
1982 1984 1986 1988 1990 1992
OkavangoSave Zimbabwe
Makgadikgadi
Sites with rainfall from 200 to 700 mm
RUE
(g C
m-2
mm
-1)
RUE
(g C
m-2
mm
-1)
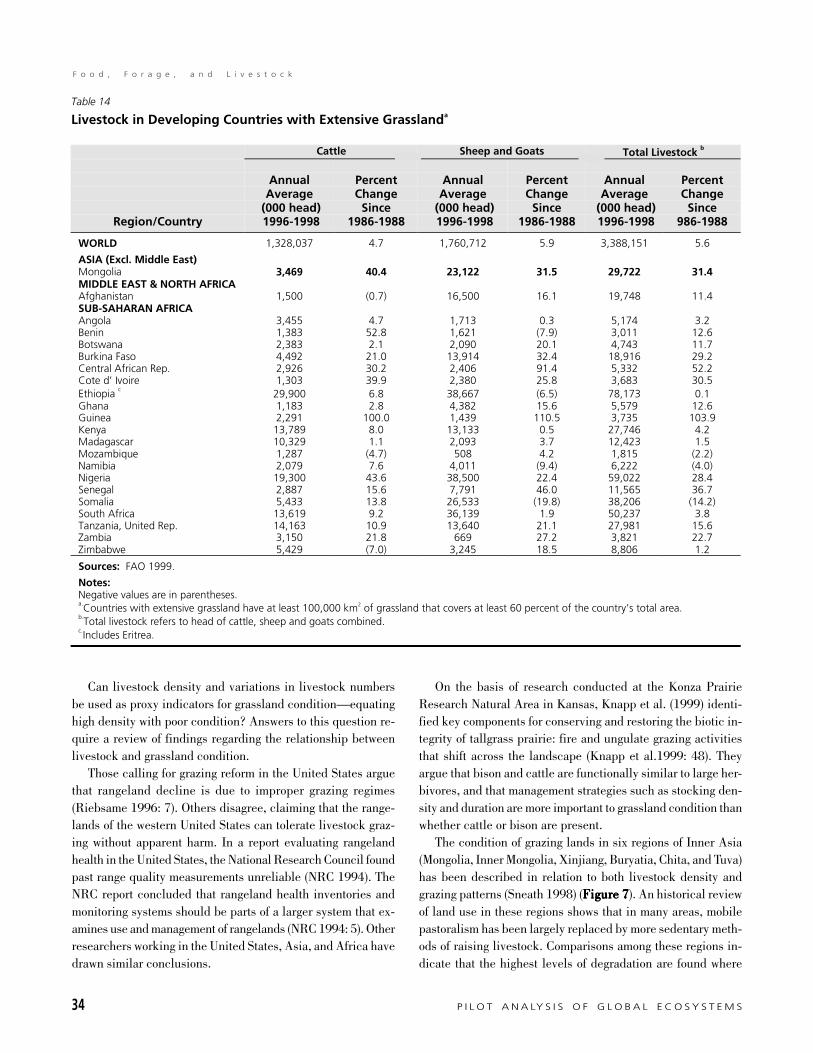
F o o d , F o r a g e , a n d L i v e s t o c k
34 P I L O T A N A LY S I S O F G L O B A L E C O S Y S T E M S
Can livestock density and variations in livestock numbersbe used as proxy indicators for grassland condition—equatinghigh density with poor condition? Answers to this question re-quire a review of findings regarding the relationship betweenlivestock and grassland condition.
Those calling for grazing reform in the United States arguethat rangeland decline is due to improper grazing regimes(Riebsame 1996: 7). Others disagree, claiming that the range-lands of the western United States can tolerate livestock graz-ing without apparent harm. In a report evaluating rangelandhealth in the United States, the National Research Council foundpast range quality measurements unreliable (NRC 1994). TheNRC report concluded that rangeland health inventories andmonitoring systems should be parts of a larger system that ex-amines use and management of rangelands (NRC 1994: 5). Otherresearchers working in the United States, Asia, and Africa havedrawn similar conclusions.
On the basis of research conducted at the Konza PrairieResearch Natural Area in Kansas, Knapp et al. (1999) identi-fied key components for conserving and restoring the biotic in-tegrity of tallgrass prairie: fire and ungulate grazing activitiesthat shift across the landscape (Knapp et al.1999: 48). Theyargue that bison and cattle are functionally similar to large her-bivores, and that management strategies such as stocking den-sity and duration are more important to grassland condition thanwhether cattle or bison are present.
The condition of grazing lands in six regions of Inner Asia(Mongolia, Inner Mongolia, Xinjiang, Buryatia, Chita, and Tuva)has been described in relation to both livestock density andgrazing patterns (Sneath 1998) (Figure 7Figure 7Figure 7Figure 7Figure 7). An historical reviewof land use in these regions shows that in many areas, mobilepastoralism has been largely replaced by more sedentary meth-ods of raising livestock. Comparisons among these regions in-dicate that the highest levels of degradation are found where
Table 14
Livestock in Developing Countries with Extensive Grasslanda
Cattle Sheep and Goats Total Livestock b
Region/Country
AnnualAverage
(000 head) 1996-1998
PercentChange
Since1986-1988
AnnualAverage
(000 head) 1996-1998
PercentChange
Since1986-1988
AnnualAverage
(000 head) 1996-1998
PercentChange
Since986-1988
WORLD 1,328,037 4.7 1,760,712 5.9 3,388,151 5.6
ASIA (Excl. Middle East)Mongolia 3,469 40.4 23,122 31.5 29,722 31.4MIDDLE EAST & NORTH AFRICAAfghanistan 1,500 (0.7) 16,500 16.1 19,748 11.4SUB-SAHARAN AFRICAAngola 3,455 4.7 1,713 0.3 5,174 3.2Benin 1,383 52.8 1,621 (7.9) 3,011 12.6Botswana 2,383 2.1 2,090 20.1 4,743 11.7Burkina Faso 4,492 21.0 13,914 32.4 18,916 29.2Central African Rep. 2,926 30.2 2,406 91.4 5,332 52.2Cote d’ Ivoire 1,303 39.9 2,380 25.8 3,683 30.5Ethiopia c
29,900 6.8 38,667 (6.5) 78,173 0.1Ghana 1,183 2.8 4,382 15.6 5,579 12.6Guinea 2,291 100.0 1,439 110.5 3,735 103.9Kenya 13,789 8.0 13,133 0.5 27,746 4.2Madagascar 10,329 1.1 2,093 3.7 12,423 1.5Mozambique 1,287 (4.7) 508 4.2 1,815 (2.2)Namibia 2,079 7.6 4,011 (9.4) 6,222 (4.0)Nigeria 19,300 43.6 38,500 22.4 59,022 28.4Senegal 2,887 15.6 7,791 46.0 11,565 36.7Somalia 5,433 13.8 26,533 (19.8) 38,206 (14.2)South Africa 13,619 9.2 36,139 1.9 50,237 3.8Tanzania, United Rep. 14,163 10.9 13,640 21.1 27,981 15.6Zambia 3,150 21.8 669 27.2 3,821 22.7Zimbabwe 5,429 (7.0) 3,245 18.5 8,806 1.2
Sources: FAO 1999.
Notes:Negative values are in parentheses.a.Countries with extensive grassland have at least 100,000 km2 of grassland that covers at least 60 percent of the country’s total area.b.Total livestock refers to head of cattle, sheep and goats combined.c.Includes Eritrea.
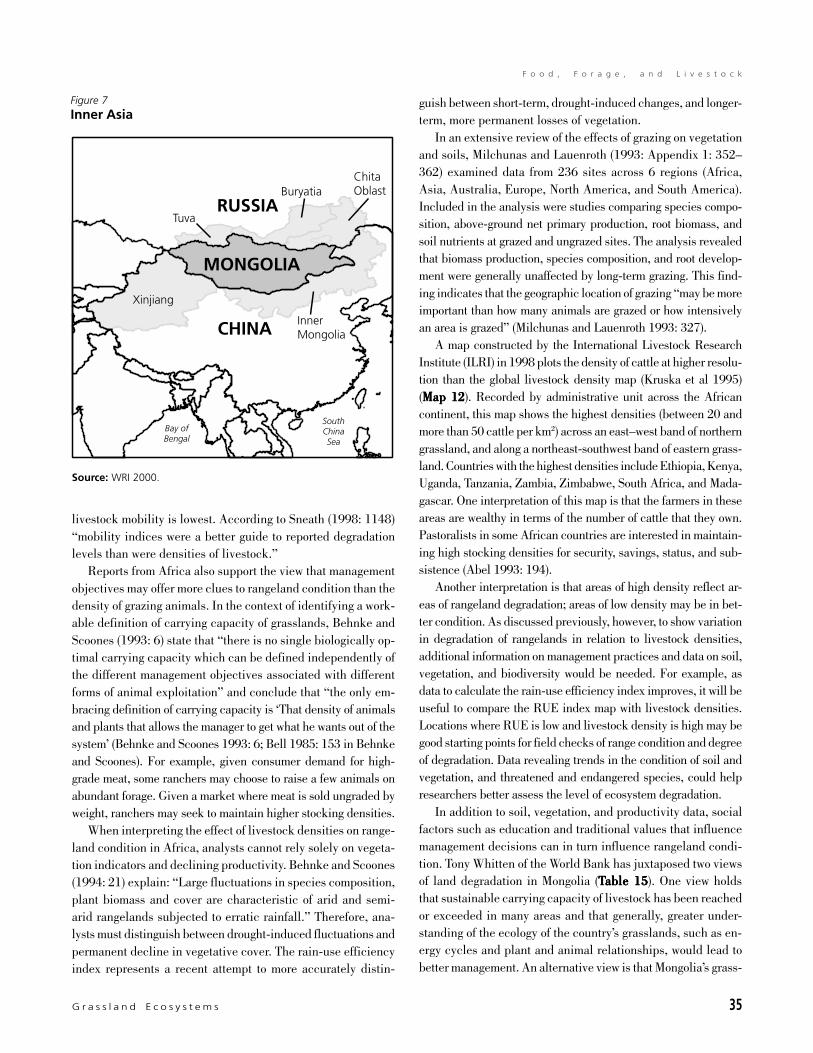
F o o d , F o r a g e , a n d L i v e s t o c k
G r a s s l a n d E c o s y s t e m s 35
livestock mobility is lowest. According to Sneath (1998: 1148)“mobility indices were a better guide to reported degradationlevels than were densities of livestock.”
Reports from Africa also support the view that managementobjectives may offer more clues to rangeland condition than thedensity of grazing animals. In the context of identifying a work-able definition of carrying capacity of grasslands, Behnke andScoones (1993: 6) state that “there is no single biologically op-timal carrying capacity which can be defined independently ofthe different management objectives associated with differentforms of animal exploitation” and conclude that “the only em-bracing definition of carrying capacity is ‘That density of animalsand plants that allows the manager to get what he wants out of thesystem’ (Behnke and Scoones 1993: 6; Bell 1985: 153 in Behnkeand Scoones). For example, given consumer demand for high-grade meat, some ranchers may choose to raise a few animals onabundant forage. Given a market where meat is sold ungraded byweight, ranchers may seek to maintain higher stocking densities.
When interpreting the effect of livestock densities on range-land condition in Africa, analysts cannot rely solely on vegeta-tion indicators and declining productivity. Behnke and Scoones(1994: 21) explain: “Large fluctuations in species composition,plant biomass and cover are characteristic of arid and semi-arid rangelands subjected to erratic rainfall.” Therefore, ana-lysts must distinguish between drought-induced fluctuations andpermanent decline in vegetative cover. The rain-use efficiencyindex represents a recent attempt to more accurately distin-
guish between short-term, drought-induced changes, and longer-term, more permanent losses of vegetation.
In an extensive review of the effects of grazing on vegetationand soils, Milchunas and Lauenroth (1993: Appendix 1: 352–362) examined data from 236 sites across 6 regions (Africa,Asia, Australia, Europe, North America, and South America).Included in the analysis were studies comparing species compo-sition, above-ground net primary production, root biomass, andsoil nutrients at grazed and ungrazed sites. The analysis revealedthat biomass production, species composition, and root develop-ment were generally unaffected by long-term grazing. This find-ing indicates that the geographic location of grazing “may be moreimportant than how many animals are grazed or how intensivelyan area is grazed” (Milchunas and Lauenroth 1993: 327).
A map constructed by the International Livestock ResearchInstitute (ILRI) in 1998 plots the density of cattle at higher resolu-tion than the global livestock density map (Kruska et al 1995)(Map 12Map 12Map 12Map 12Map 12). Recorded by administrative unit across the Africancontinent, this map shows the highest densities (between 20 andmore than 50 cattle per km2) across an east–west band of northerngrassland, and along a northeast-southwest band of eastern grass-land. Countries with the highest densities include Ethiopia, Kenya,Uganda, Tanzania, Zambia, Zimbabwe, South Africa, and Mada-gascar. One interpretation of this map is that the farmers in theseareas are wealthy in terms of the number of cattle that they own.Pastoralists in some African countries are interested in maintain-ing high stocking densities for security, savings, status, and sub-sistence (Abel 1993: 194).
Another interpretation is that areas of high density reflect ar-eas of rangeland degradation; areas of low density may be in bet-ter condition. As discussed previously, however, to show variationin degradation of rangelands in relation to livestock densities,additional information on management practices and data on soil,vegetation, and biodiversity would be needed. For example, asdata to calculate the rain-use efficiency index improves, it will beuseful to compare the RUE index map with livestock densities.Locations where RUE is low and livestock density is high may begood starting points for field checks of range condition and degreeof degradation. Data revealing trends in the condition of soil andvegetation, and threatened and endangered species, could helpresearchers better assess the level of ecosystem degradation.
In addition to soil, vegetation, and productivity data, socialfactors such as education and traditional values that influencemanagement decisions can in turn influence rangeland condi-tion. Tony Whitten of the World Bank has juxtaposed two viewsof land degradation in Mongolia (TTTTTable 15able 15able 15able 15able 15). One view holdsthat sustainable carrying capacity of livestock has been reachedor exceeded in many areas and that generally, greater under-standing of the ecology of the country’s grasslands, such as en-ergy cycles and plant and animal relationships, would lead tobetter management. An alternative view is that Mongolia’s grass-
Source: WRI 2000.
Bay ofBengal
SouthChinaSea
CHINA
MONGOLIA
RUSSIA
Xinjiang
InnerMongolia
ChitaOblast
Tuva
Buryatia
Figure 7Inner Asia
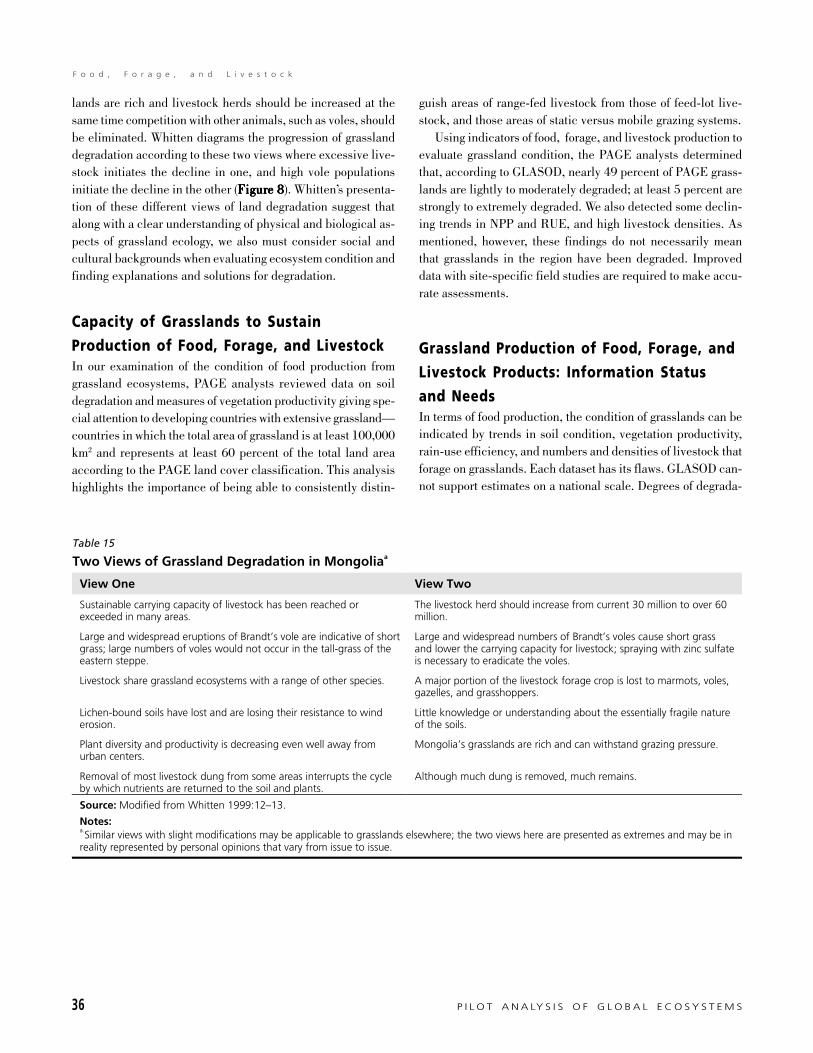
F o o d , F o r a g e , a n d L i v e s t o c k
36 P I L O T A N A LY S I S O F G L O B A L E C O S Y S T E M S
lands are rich and livestock herds should be increased at thesame time competition with other animals, such as voles, shouldbe eliminated. Whitten diagrams the progression of grasslanddegradation according to these two views where excessive live-stock initiates the decline in one, and high vole populationsinitiate the decline in the other (FigurFigurFigurFigurFigure 8e 8e 8e 8e 8). Whitten’s presenta-tion of these different views of land degradation suggest thatalong with a clear understanding of physical and biological as-pects of grassland ecology, we also must consider social andcultural backgrounds when evaluating ecosystem condition andfinding explanations and solutions for degradation.
Capacity of Grasslands to SustainProduction of Food, Forage, and LivestockIn our examination of the condition of food production fromgrassland ecosystems, PAGE analysts reviewed data on soildegradation and measures of vegetation productivity giving spe-cial attention to developing countries with extensive grassland—countries in which the total area of grassland is at least 100,000km2 and represents at least 60 percent of the total land areaaccording to the PAGE land cover classification. This analysishighlights the importance of being able to consistently distin-
guish areas of range-fed livestock from those of feed-lot live-stock, and those areas of static versus mobile grazing systems.
Using indicators of food, forage, and livestock production toevaluate grassland condition, the PAGE analysts determinedthat, according to GLASOD, nearly 49 percent of PAGE grass-lands are lightly to moderately degraded; at least 5 percent arestrongly to extremely degraded. We also detected some declin-ing trends in NPP and RUE, and high livestock densities. Asmentioned, however, these findings do not necessarily meanthat grasslands in the region have been degraded. Improveddata with site-specific field studies are required to make accu-rate assessments.
Grassland Production of Food, Forage, andLivestock Products: Information Statusand NeedsIn terms of food production, the condition of grasslands can beindicated by trends in soil condition, vegetation productivity,rain-use efficiency, and numbers and densities of livestock thatforage on grasslands. Each dataset has its flaws. GLASOD can-not support estimates on a national scale. Degrees of degrada-
Table 15
Two Views of Grassland Degradation in Mongoliaa
View One View Two
Sustainable carrying capacity of livestock has been reached orexceeded in many areas.
The livestock herd should increase from current 30 million to over 60million.
Large and widespread eruptions of Brandt’s vole are indicative of shortgrass; large numbers of voles would not occur in the tall-grass of theeastern steppe.
Large and widespread numbers of Brandt’s voles cause short grassand lower the carrying capacity for livestock; spraying with zinc sulfateis necessary to eradicate the voles.
Livestock share grassland ecosystems with a range of other species. A major portion of the livestock forage crop is lost to marmots, voles,gazelles, and grasshoppers.
Lichen-bound soils have lost and are losing their resistance to winderosion.
Little knowledge or understanding about the essentially fragile natureof the soils.
Plant diversity and productivity is decreasing even well away fromurban centers.
Mongolia’s grasslands are rich and can withstand grazing pressure.
Removal of most livestock dung from some areas interrupts the cycleby which nutrients are returned to the soil and plants.
Although much dung is removed, much remains.
Source: Modified from Whitten 1999:12– 13.
Notes:a.Similar views with slight modifications may be applicable to grasslands elsewhere; the two views here are presented as extremes and may be inreality represented by personal opinions that vary from issue to issue.

F o o d , F o r a g e , a n d L i v e s t o c k
G r a s s l a n d E c o s y s t e m s 37
tion are primarily determined on the basis of expert opinion,without verification through field checks. The Net Primary Pro-ductivity models still are being perfected and require adjust-ments to account for variations in data reported by differentsatellites. The Rain-Use Efficiency index needs better precipi-tation data from consistent readings at an adequate number ofmeteorological stations. Researchers must be able to distinguishdata on livestock densities as based on range-fed livestock orfeed-lot livestock, and identify the management strategies usedin the areas from which the data were collected. PAGE research-ers adopted the assumption that highly intensive industrial pro-duction of livestock is primarily practiced in developed coun-tries and that traditional, low-intensity livestock productionmethods predominate in developing countries. This assump-
tion may not be accurate, however, because highly intensiveindustrial production methods are growing rapidly in develop-ing countries (Delgado et al.1999: 48).
Recent improvements have been undertaken in some areas.The scale of ASSOD is 1:5 million, rather than 1:10 million—the scale of GLASOD. But, even with this improvement the scaleof ASSOD is considered too broad to support national level plan-ning. More recent NPP estimates are available over longer timeperiods, and models are continually being refined. The accuracyof estimates derived from the models, however, is difficult to verifyon a global scale. Extensive field reconnaissance and analysis atthe regional, national, and sub-national levels are required.
Figure 8Two Perceptions of Grassland Degradation in Mongolia
Source: Modified from Whitten 1999.
Tall-grassprairie
Excessivelivestock
Shortgrass
Increase in volenumbers
Shorter grass
Lowered carryingcapacity forlivestock
Tall-grassprairie
High volenumbers
Shortgrass
Lowered carryingcapacity forlivestock
Perception One
Perception Two
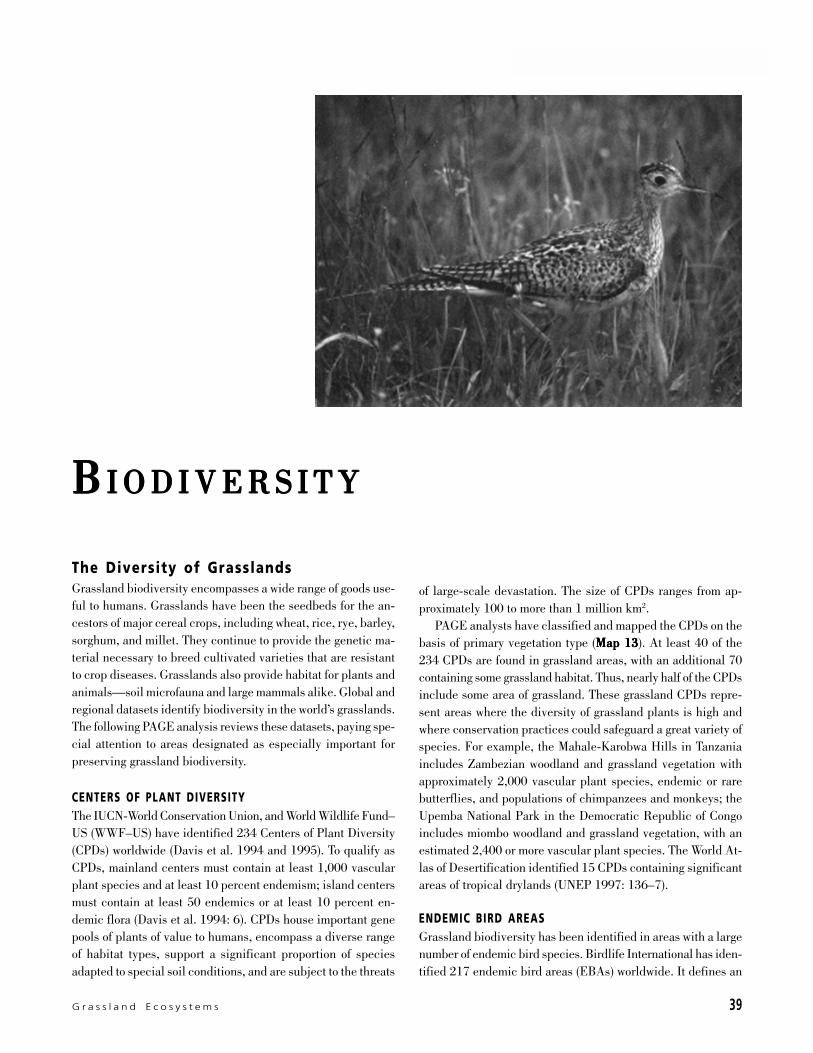
G r a s s l a n d E c o s y s t e m s 39
B i o d i v e r s i t y
The Diversity of GrasslandsGrassland biodiversity encompasses a wide range of goods use-ful to humans. Grasslands have been the seedbeds for the an-cestors of major cereal crops, including wheat, rice, rye, barley,sorghum, and millet. They continue to provide the genetic ma-terial necessary to breed cultivated varieties that are resistantto crop diseases. Grasslands also provide habitat for plants andanimals—soil microfauna and large mammals alike. Global andregional datasets identify biodiversity in the world’s grasslands.The following PAGE analysis reviews these datasets, paying spe-cial attention to areas designated as especially important forpreserving grassland biodiversity.
CENTERS OF PLANT DIVERSITYThe IUCN-World Conservation Union, and World Wildlife Fund–US (WWF–US) have identified 234 Centers of Plant Diversity(CPDs) worldwide (Davis et al. 1994 and 1995). To qualify asCPDs, mainland centers must contain at least 1,000 vascularplant species and at least 10 percent endemism; island centersmust contain at least 50 endemics or at least 10 percent en-demic flora (Davis et al. 1994: 6). CPDs house important genepools of plants of value to humans, encompass a diverse rangeof habitat types, support a significant proportion of speciesadapted to special soil conditions, and are subject to the threats
of large-scale devastation. The size of CPDs ranges from ap-proximately 100 to more than 1 million km2.
PAGE analysts have classified and mapped the CPDs on thebasis of primary vegetation type (Map 13Map 13Map 13Map 13Map 13). At least 40 of the234 CPDs are found in grassland areas, with an additional 70containing some grassland habitat. Thus, nearly half of the CPDsinclude some area of grassland. These grassland CPDs repre-sent areas where the diversity of grassland plants is high andwhere conservation practices could safeguard a great variety ofspecies. For example, the Mahale-Karobwa Hills in Tanzaniaincludes Zambezian woodland and grassland vegetation withapproximately 2,000 vascular plant species, endemic or rarebutterflies, and populations of chimpanzees and monkeys; theUpemba National Park in the Democratic Republic of Congoincludes miombo woodland and grassland vegetation, with anestimated 2,400 or more vascular plant species. The World At-las of Desertification identified 15 CPDs containing significantareas of tropical drylands (UNEP 1997: 136–7).
ENDEMIC BIRD AREASGrassland biodiversity has been identified in areas with a largenumber of endemic bird species. Birdlife International has iden-tified 217 endemic bird areas (EBAs) worldwide. It defines an
BBBBB I O D I V E R S I T YI O D I V E R S I T YI O D I V E R S I T YI O D I V E R S I T YI O D I V E R S I T Y

40 P I L O T A N A LY S I S O F G L O B A L E C O S Y S T E M S
B i o d i v e r s i t y
EBA as
An area which encompasses the overlapping breed-ing ranges of restricted-range bird species, such thatthe complete ranges of two or more restricted-rangespecies are entirely included within the boundary ofthe EBA. This does not necessarily mean that the com-plete ranges of all of an EBA’s restricted-range spe-cies are entirely included within the boundary of thatsingle EBA, as some species may be shared betweenEBAs (Stattersfield et al. 1998: 24).
Birdlife International defines restricted-range species as
All landbirds which have had a breeding range of lessthan 50,000 km2 throughout historical times (i.e. post-1800, in the period since ornithological recording be-gan). Some birds that have small ranges today werehistorically widespread, and are therefore not treatedas restricted-range species. Extinct birds that qualifyon range size are included (Stattersfield et al. 1998:20–21).
Although the majority of restricted-range birds are forestspecies, and the key habitat in most EBAs is forest, grassland isthe key habitat in 23 or approximately 11 percent of the 217EBAs (Map 13Map 13Map 13Map 13Map 13). Each EBA is assigned a biological importancerank from 1 to 3 (most biologically important) on the basis of itssize and the number and taxonomic uniqueness of its restricted-range species.
Of the 23 EBAs in which grassland/savanna/scrub is themajor habitat type, 3 have the highest rank for biological im-portance: the Peruvian High Andes, Central Chile, and South-ern Patagonia. The Peruvian High Andes EBA is 100,000 km2
of arid and semi-humid montane scrub, grassland, and wood-land with 29 restricted-range species, 11 of which are threat-ened. The Central Chile EBA is 160,000 km2 of scrub and semi-arid grassland with 8 restricted-range species (0 threatened).The Southern Patagonia EBA is 170,000 km2 of sparse steppevegetation and tussock grasslands with 10 restricted-range spe-cies, 1 of which is threatened. Although not assigned the high-est rank for biological importance, grassland biodiversity is greatin many other EBAs.
GLOBAL 200 ECOREGIONSThe World Wildlife Fund–US has identified 232 ecoregions world-wide as “outstanding examples of the world’s diverse ecosystemsand priority targets for conservation actions” (Olson and Dinerstein1997: 2). Of the 136 terrestrial ecoregions within this “Global200,” 35 are characterized as grassland ecoregions (Map 14Map 14Map 14Map 14Map 14).
The grassland ecoregions included in Global 200 were se-lected on the basis of species richness, species endemism,unique higher taxa, unusual ecological or evolutionary phenom-
ena, and global rarity of major habitat types. For example,Ecoregion Number 93, the Patagonian Steppe and Grasslandsin Argentina and Chile, was selected because it is the only areaof cold temperate/subpolar steppe and grassland in SouthAmerica and because it supports distinctive taxa at generic andfamily levels. Ecoregion Number 112, the Okavango FloodedSavannas in Botswana, Namibia, and Angola, is one of the world’slargest flooded savannas with extraordinary concentrations oflarge vertebrates, including elephants (Loxodonta africana) andthe African buffalo (Syncerus caffer) (Olson and Dinerstein 1997:116). The 35 grassland ecoregions contain some of the mostimportant grassland biodiversity in the world today.
BIOLOGICAL DISTINCTIVENESS INDEXThe World Wildlife Fund –US has developed an index of bio-logical distinctiveness for terrestrial ecoregions. This index issimilar to Global 200 but is published now only for NorthAmerica and Latin America. It includes measures for speciesrichness, species endemism, rarity of habitat type (habitats thatoffer few opportunities for conservation), rare phenomena (dis-tinctive ecological phenomena such as intact predator assem-blages), and beta diversity (high turnover of species over dis-tance or along gradients). The species data for North Americaare based on published and unpublished information on rangeand distribution. The remaining measures for North America,and all of the measures for Latin America are based on WWF–US analysis and expert workshops of regional working groups.
Ten of 32 North American ecoregions rated as globally out-standing for biological distinctiveness are grasslands (Rickettset al. 1997) (Figure 9Figure 9Figure 9Figure 9Figure 9). These 10 ecoregions include:
♦ the Central Tall Grasslands (once the largest tallgrass prai-rie on earth, and still home to great plant diversity);
♦ the Flint Hills Tall Grasslands (containing the world’s lastlarge parcels of tallgrass prairie);
♦ the Everglades (supporting high species richness, particu-larly with respect to wading birds, alligators, crocodiles, snailkites, and mangrove species);
♦ the California Interior Chaparral and Woodlands, the Cali-fornia Montane Chaparral and Woodlands, and the Califor-nia Coastal Sage and Chaparral (containing unique commu-nities, a unique geologic history, high species richness andendemism);
♦ the Aleutian Islands Tundra (supporting large seabird colo-nies and many endemics);
♦ the Arctic Foothills Tundra (characterized by high-levelpredators, caribou migration, and a corridor for avian andmoose populations);
♦ the Arctic Coastal Tundra (supporting caribou herds andarctic wildlife) (Box 1Box 1Box 1Box 1Box 1); and
♦ the Low Arctic Tundra (supporting large caribou herds, birdnesting colonies, and muskox).
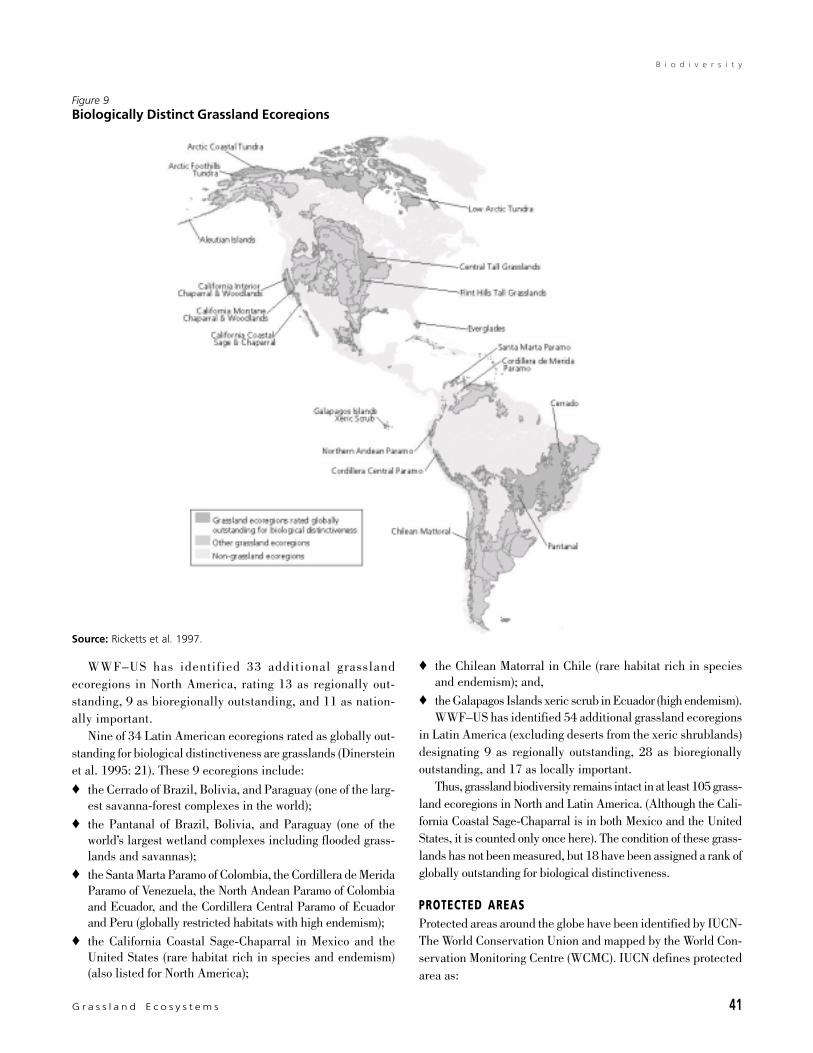
G r a s s l a n d E c o s y s t e m s 41
B i o d i v e r s i t y
WWF–US has identified 33 additional grasslandecoregions in North America, rating 13 as regionally out-standing, 9 as bioregionally outstanding, and 11 as nation-ally important.
Nine of 34 Latin American ecoregions rated as globally out-standing for biological distinctiveness are grasslands (Dinersteinet al. 1995: 21). These 9 ecoregions include:
♦ the Cerrado of Brazil, Bolivia, and Paraguay (one of the larg-est savanna-forest complexes in the world);
♦ the Pantanal of Brazil, Bolivia, and Paraguay (one of theworld’s largest wetland complexes including flooded grass-lands and savannas);
♦ the Santa Marta Paramo of Colombia, the Cordillera de MeridaParamo of Venezuela, the North Andean Paramo of Colombiaand Ecuador, and the Cordillera Central Paramo of Ecuadorand Peru (globally restricted habitats with high endemism);
♦ the California Coastal Sage-Chaparral in Mexico and theUnited States (rare habitat rich in species and endemism)(also listed for North America);
♦ the Chilean Matorral in Chile (rare habitat rich in speciesand endemism); and,
♦ the Galapagos Islands xeric scrub in Ecuador (high endemism).WWF–US has identified 54 additional grassland ecoregions
in Latin America (excluding deserts from the xeric shrublands)designating 9 as regionally outstanding, 28 as bioregionallyoutstanding, and 17 as locally important.
Thus, grassland biodiversity remains intact in at least 105 grass-land ecoregions in North and Latin America. (Although the Cali-fornia Coastal Sage-Chaparral is in both Mexico and the UnitedStates, it is counted only once here). The condition of these grass-lands has not been measured, but 18 have been assigned a rank ofglobally outstanding for biological distinctiveness.
PROTECTED AREASProtected areas around the globe have been identified by IUCN-The World Conservation Union and mapped by the World Con-servation Monitoring Centre (WCMC). IUCN defines protectedarea as:
Figure 9Biologically Distinct Grassland Ecoregions
Source: Ricketts et al. 1997.
42 P I L O T A N A LY S I S O F G L O B A L E C O S Y S T E M S
B i o d i v e r s i t y
An area of land and/or sea especially dedicated to theprotection and maintenance of biological diversity, andof natural and associated cultural resources, and man-aged through legal or other effective means (IUCN-The World Conservation Union 1998: xiv).
IUCN assigns each protected area to one of six managementcategories. These categories vary in management purpose fromscientific research to sustainable use, and include:
♦ strict nature reserves and wilderness areas (Category l);
♦ national parks (Category ll);
♦ national monuments (Category lll);
♦ habitat or species management areas (Category lV);
♦ protected landscapes (Category V); and
♦ areas managed mainly for the sustainable use of natural eco-systems (Category Vl).Using the PAGE land cover as a base map, we summarized
data on the size of protected areas and the amount of grasslandhabitat in each area. For protected areas represented by pointsonly, we generated circular buffers corresponding to the reportedsize of the protected area. We then identified large (at least 10km2) protected areas (in Categories l, ll, or lll) that are at least50 percent grassland (Map 15)Map 15)Map 15)Map 15)Map 15). Our results show that 697 ofthese protected grasslands are found worldwide. This translatesto less than 16 percent of 4,502 relatively large protected areasbeing composed of at least 50 percent grassland.
In a comparison of protected areas within other ecosystems,forests and agriculture ecosystems include 2.5 million km2 and
Box 1
Caribou Migrations and Calving Grounds: Globally Outstanding Ecological Phenomena
Large scale migrations of large terrestrial mammals are disap-pearing around the world. Grasslands and forested habitatsthat once supported extraordinary movements and seasonalconcentrations of large herbivores are becoming increasinglythreatened by development activities.
The annual return of barren-ground caribou (Rangiferarcticus) to their traditional calving grounds is an unforget-table spectacle that serves as one of the best examples of themigratory phenomena. Few places in the world can equalthis scale of migration unfettered by fences, roads, agricul-ture, or people.
Throughout northern Canada and Alaska, free-roamingcaribou are an important subsistence food for aboriginalpeoples. In Russia, another important site for caribou, or re-indeer, many populations are semi-domesticated and man-aged by local people.
There are 15 major caribou herds in Canada, each withdifferent spring migration routes. The Eastern Canadian ShieldTaiga ecoregion is home to the George River herd, the singlelargest caribou herd in the world. The Northwest Territoriescontain an additional 1.6 million caribou.
In Alaska, 25 caribou herds totaling approximately 1 mil-lion animals annually stream between wintering and calvinggrounds. Caribou range across virtually all of Alaska’secoregions;introduced herds even occupy islands in the BeringSea and Aleutian Islands.
Caribou cows, especially when they have newborn calves,are highly sensitive to human activities. Caribou, especially inlarge groups, may gallop away if startled by people or machin-ery. Calves may be knocked over and injured or may flounder inwet snow and become exhausted. When cows run, walk, oreven stand in response to human activity, they are expending
energy without feeding. Reduced food intake in turn reducesmilk production that could potentially limit calf growth.
Not only do cows and calves need protection while oncalving grounds, but the calving ground habitat itself needsprotection. Loss of sedge meadows through the alteration ofsurface drainage could lead to reduced forage availability.Mining and mine exploration pose serious threats to the eco-logical integrity of caribou calving grounds and migrationroutes. There are already two active mines on the spring mi-gration route and calving grounds of the Bathurst herd. Oilexploration and development activities also pose threats tothe integrity of migration routes. Impacts of oil developmentalong Alaska’s North Slope are also a significant concern. Al-though caribou in the Central Arctic herd have become some-what habituated over time to oilfield activities, increased de-velopment, including habitat loss, animal disturbance, anddisruption of migrations remains a concern, particularly incalving grounds.
Recognizing these threats, the Governments of Canadaand the Northwest Territories are working with the aborigi-nal people through wildlife co-management boards and otherstakeholders to develop a protective strategy for the cariboucalving grounds. Alaskan Native peoples are also increasinglyplaying a role in management decisions regarding caribou.The maintenance of the last great spectacles of nature de-pends on all stakeholders acting together.
Excerpted from Terrestrial Ecoregions of North America: A Conserva-
tion Assessment by Taylor H. Ricketts, Eric Dinerstein, David M. Olson,
Colby J. Loucks et al. Copyright 1999 World Wildlife Fund. Published
in 1999 by Island Press. Reprinted by permission of Island Press. Modi-
fied from Essay 5: Global Migrations and Calving Grounds: Globally
Outstanding Ecological Phenomena by Anne Gunn (pp. 39 – 40).

G r a s s l a n d E c o s y s t e m s 43
B i o d i v e r s i t y
1.6 million km2 of protected area, respectively (TTTTTable 16able 16able 16able 16able 16). Grass-land ecosystems include more protected area—nearly 4 mil-lion km2. Because grassland extent is so large, however, only7.6 percent of the PAGE grassland ecosystem area is protectedwhile approximately 8.5 percent of the PAGE forest ecosystemarea is protected. The protected grasslands that do exist coverthe largest area in Sub-Saharan Africa—1.3 million km2—andless than 1 million km2 in the remaining regions ranging from56,000 km2 in Central America and the Caribbean to 791,000km2 in North America. One biome within grasslands has beendescribed as the least protected biome in the world: only 0.69% ofthe world’s temperate grasslands are protected under the globalsystem of protected areas (Henwood 1998: 6; IUCN 1994: 257).
Trends in Grassland Biodiversity
GRASSLAND BIRD POPULATIONSEvery year since 1966, the Patuxent Wildlife Research Centerhas organized a roadside breeding bird survey for the continen-tal United States and southern Canada. More recently, the sur-vey has expanded to include Alaska and northern Mexico. Thesurvey is based on observations of breeding birds along morethan 3,500 survey routes, each approximately 40 kilometers inlength. (See the Breeding Bird Survey [BBS] Home Page at http://www.mbr-pwrc.usgs.gov/bbs/.) Each spring, skilled volunteerstravel the routes, stopping every 0.8 km to record all birds seenor heard within a 0.4 km radius during a three-minute period.By analyzing the number of individuals of each species detectedper survey route, trends can be monitored over time for particu-lar breeding ranges. BBS data also can be plotted spatially toshow species richness and population trends.
The Patuxent Wildlife Research Center has grouped breed-ing bird species into five breeding habitat groups: grassland,wetland-open water, successional-scrub, woodland, and urbanspecies (Sauer et al. 1999). The grassland habitat group dis-cussed here includes 28 species, such as the upland sandpiper,long-billed curlew, greater prairie chicken, northern harrier,short-eared owl, vesper sparrow, savannah sparrow, and dick-cissel. These species have similar behavioral and ecologicaltraits and when data on their populations are combined, theycan indicate changes in the condition of grassland habitat.
Maps of the density and population trends of these 28 spe-cies, across the United States and southern Canada, show someconsistent patterns (Map 17Map 17Map 17Map 17Map 17). The population distribution mapreflects data from 1982 through 1996; the population trend mapreflects data from 1966 through 1995. The largest number ofgrassland species is found in the Northern Great Plains, prima-rily in North Dakota, South Dakota, Montana, Saskatchewan,and Alberta. The fewest number of grassland species are foundalong the coasts, from southern British Colombia, south to south-
ern California, and from Louisiana to South Carolina.Populations of grassland species have experienced the most
consistent declines of any group of birds monitored by the BBS(Sauer et al. 1997). (Areas of increasing trends tend to be smalland localized.) Indeed, BBS records over nearly 30 years indi-cate a constant decline in grassland species. Habitat loss andincreased mowing of grasslands for hay production on the breed-ing grounds, as well as problems along migratory routes or onthe wintering grounds, may be responsible for many of the de-clines (Box 2Box 2Box 2Box 2Box 2).
LARGE GRASSLAND HERBIVORESIn some parts of the world, grasslands have developed largelybecause the browsing by wild herbivores has prevented the es-tablishment and growth of trees. Main areas where grasslandformation has been influenced by large herbivores are the sa-vannas of Africa, steppes of Eurasia, and prairies of NorthAmerica. The large wild herbivore community has been domi-nated by ungulates such as antelopes and zebras in Africa; ga-zelles, goats, camels, bison, and wild horses in Eurasia; and deerin North America (WCMC 1992: 280). Continent-wide data fromsystematic surveys of the distribution and abundance of grasslandspecies other than birds are not generally available. PAGE ana-lysts did not conduct an exhaustive search, but present some trenddata for grassland wildlife populations for a smaller area.
Large herbivores are important to the development and ecol-ogy of the African grasslands; the greatest concentration of largemammals in the world is found on the savannas of northernTanzania (WCMC 1992: 282). A long-term study of the Serengeti(Sinclair and Arcese 1995) resulted in data on the distributionand population trends of herbivores. Campbell and Borner(1995: 141) found little evidence of significant changes overthe last 20 years (1971–1991) in resident wildlife densitieswithin the Serengeti ecosystem. Three exceptions are noted:the rhino, which has been poached for its horn and is nearlyabsent; the roan antelope, now in a much restricted range; andthe buffalo, numbers of which have declined in the northwest ofthe park but remained steady or slightly increased in other ar-eas. The study detected a recent increase in the population den-sity of topi, but population estimates of this herbivore are sub-ject to high standard errors. Because the population of topi ismade up of some very large herds of as many as 2,000 individu-als, the failure to include one of the large herds in a censuscount could greatly affect the final estimate.
Areas with increased law enforcement activities experiencedan increase in densities of several resident wildlife species(Campbell and Borner 1995: 142). In contrast, areas close tothe protected area boundaries but less accessible to vehiclepatrols experienced declines in wildlife densities that alreadywere low. Expansion of human populations and concurrent in-creases in demand for wildlife meat, along with the inaccessi-

44 P I L O T A N A LY S I S O F G L O B A L E C O S Y S T E M S
B i o d i v e r s i t y
Table 16
Ecosystems and Protected Area
Ecosystem/CountryPAGE Areaa
(000 km2) Protected Areab
(000 km2)GRASSLANDS 52,544 3,989
Asia (Excl. Middle East) 8,892 586
Europe 6,956 248
Middle East & N. Africa 2,871 216
Sub-Saharan Africa 14,464 1,329
North America 6,583 791
C. America & Caribbean 1,048 56
South America 4,867 307
Oceania 6,859 457
FORESTS 28,974 2,453
Asia (Excl. Middle East) 3,721 302
Europe 6,731 155
Middle East & N. Africa 90 1
Sub-Saharan Africa 2,659 155
North America 7,115 711
C. America & Caribbean 939 88
South America 6,861 957
Oceania 857 84
AGRICULTURE 36,234 1,594
Asia (Excl. Middle East) 10,370 268
Europe 7,448 338
Middle East & N. Africa 1,230 11
Sub-Saharan Africa 5,837 476
North America 4,406 97
C. America & Caribbean 611 43
South America 5,642 317
Oceania 690 45
OTHERc 22,343 X
ECOSYSTEM TOTALS d X X
Sources: PAGE calculations based on GLCCD 1998; NOAA-NGDC 1998; Olson 1994a and b; WCMC 1999.
Notes:a.Boundaries for each PAGE ecosystem category are defined independently resulting in an overlap of agriculture ecosystem area with grassland andforest ecosystem area. Area estimates for grasslands and forests exclude the stable lights extent. The PAGE estimates for agriculture ecosystemextent are based on the seasonal land cover regions (SLCRs) which roughly equals the IGBP agriculture extent plus the agricultural mosaic area forgrasslands and forests but includes urban areas since an explicit urban class was not assigned in the SLCR map units.b.Protected area represents the total area of each PAGE ecosystem within an IUCN-designated protected area. A global map containing parkslarger than 1,000 hectares and falling under IUCN management categories I-IV was produced for the analysis. Circular buffers corresponding tothe size of the protected areas were generated for protected areas represented by points only. The global map of protected areas was intersectedwith the PAGE map and area estimates were summarized for each ecosystem category for all protected areas that had more than 50 percent ingrassland, forest, and agriculture.c.The other category includes wetlands, barren land, and human settlements.d.Global totals cannot be calculated for PAGE categories because the agriculture ecosystem area overlaps with the grassland and forest ecosystemareas.
G r a s s l a n d E c o s y s t e m s 45
B i o d i v e r s i t y
bility of some areas to enforcement patrols, are described asthreats to the sustainability of wildlife populations.
Human Modification of GrasslandBiodiversity
KEY AREAS FOR THREATENED BIRDS IN THENEOTROPICSBirdlife International has mapped the locations of threatenedbird species in the Neotropics and compiled a map of 596 keyareas for these species (Wege and Long 1995). The key areas
were selected on the basis of specific guidelines: the area shouldsupport an existing population of the species, should be thelocation at which the species was most recently recorded, orshould be the location at which experts have good reason tosuspect that the species continues to exist. Preference was givento areas that are larger or more intact than other areas underconsideration, that are already protected, that represent theentire range of a species, or that represent the species in morethan one country (Wege and Long 1995: 11).
The three main types of habitat for the threatened birds inthe PAGE study are wet forest, dry forest, and grassland areas.Of the 596 key areas, 42 are in grassland habitats, and nearly
Box 2
Threatened Tall-Grassland Birds of Continental North America
One of the most rapidly declining groups of birds in NorthAmerica and around the world are the birds that nest in tem-perate zone grasslands. Grassland habitats are ideal for con-version to row crops, hayfields, and pastures, and are there-fore one of the first habitats to be permanently altered fol-lowing human settlement.
Unlike many other species of wildlife, however, grasslandbirds adapted well to the human agricultural landscapes thatdominated the continent through the 1950s, at least in theMidwest and the East. Grassland birds tolerate the intro-duced cool-season grasses that replaced the native warm-season grasses, and many species tolerate and even requiredisturbance in the form of grazing and fires to create suitablevegetation structure. Thus, following European settlement,grassland species probably became much more abundant inthe Northeast.
Over the last three decades however, changing agricul-tural practices have led to some catastrophic declines in manyof the species that were formerly abundant in agriculturallandscapes. Some species, such as the Henslow’s sparrow(Ammodramus henslowii) and the mountain plover(Charadrius montanus), are now candidates for the federallist of threatened and endangered species. Formerly abun-dant species such as the bobolink (Polichonyx oryzivorus) andlark bunting (Calamospiza melanocorys) are becoming increas-ingly patchy in their distributions.
Some of the problems faced by grassland birds includethe following:♦ loss of winter habitat in both North and South America,
especially in the Western Gulf Coastal Grasslands and inthe pampas of Argentina;
♦ earlier cutting of hayfields, which destroys many nests;♦ a decrease in the area of hayfields and pastures available;♦ fragmentation of grasslands, especially the many small
patches in conservation reserves (CRP), which are often
too small to contain populations of area-sensitive species;♦ invasion of woody vegetation in grasslands, which pro-
vides cowbirds and nest predators with perches from whichto search for nests;
♦ changing fire regimes and grazing pressures, which havealtered the variety of vegetation structure; and
♦ increased exposure to pesticides and other agrochemicals.♦ Possible management practices that would benefit grass-
land birds include:♦ increasing the size of prairie restoration sites;♦ maintaining a network of grassland reserves that can act
as refugia;♦ removing encroaching woody vegetation from large tracts
(unless it is along a riparian corridor);♦ maintaining some areas that are not grazed or burned for
at least three years to provide habitat for species that re-quire taller, denser vegetation;
♦ removing drainage tiles from selected watersheds to re-store wet grasslands in which many species nest (includ-ing waterfowl);
♦ developing rotations that provide habitat for species thatneed both tall and short grass;
♦ minimizing early season mowing of hayfields;♦ aggregating fields in the Conservation Reserve Program to
create a few large rather than many small grasslands; and♦ giving special conservation attention to the Western Gulf
Coastal Grasslands.
Excerpted from Terrestrial Ecoregions of North America: A Conserva-
tion Assessment by Taylor H. Ricketts, Eric Dinerstein, David M. Olson,
Colby J. Loucks et al. Copyright 1999 World Wildlife Fund. Pub-
lished in 1999 by Island Press. Reprinted by permission of Island Press.
Modified from Essay 11: The Most Threatened Birds of Continental
North America by Scott Robinson (pp. 69 – 70).
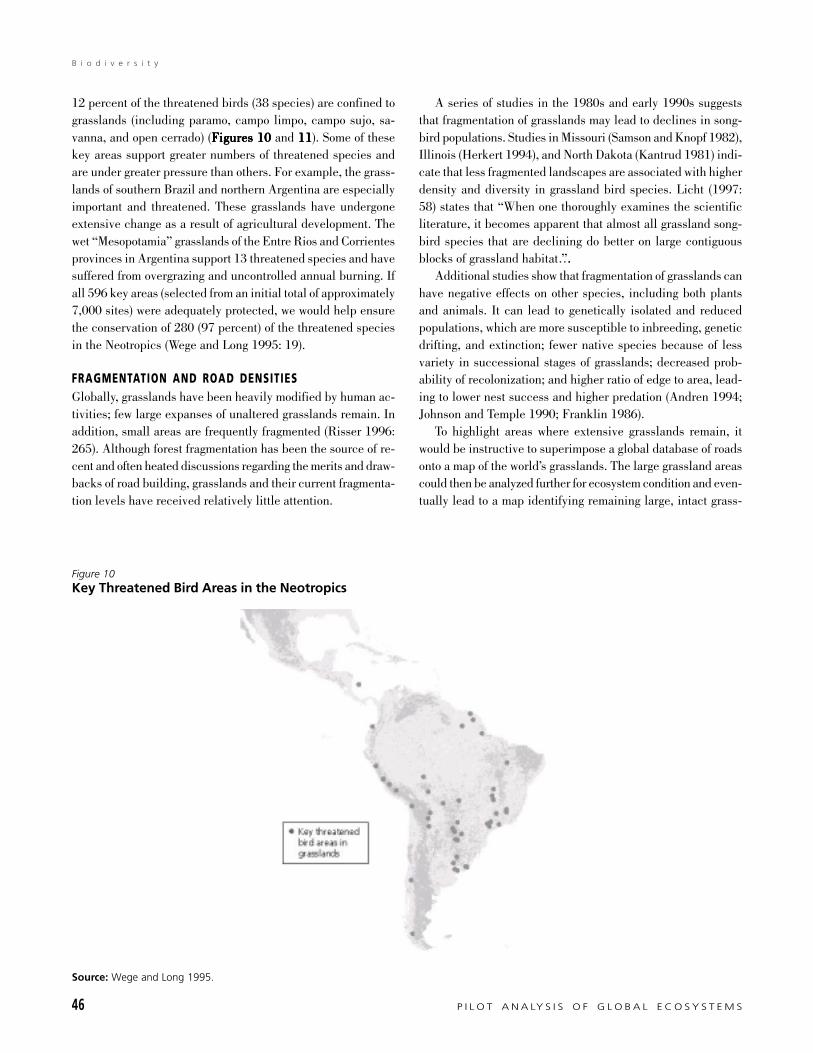
46 P I L O T A N A LY S I S O F G L O B A L E C O S Y S T E M S
B i o d i v e r s i t y
12 percent of the threatened birds (38 species) are confined tograsslands (including paramo, campo limpo, campo sujo, sa-vanna, and open cerrado) (Figures 10 Figures 10 Figures 10 Figures 10 Figures 10 and 11 11 11 11 11). Some of thesekey areas support greater numbers of threatened species andare under greater pressure than others. For example, the grass-lands of southern Brazil and northern Argentina are especiallyimportant and threatened. These grasslands have undergoneextensive change as a result of agricultural development. Thewet “Mesopotamia” grasslands of the Entre Rios and Corrientesprovinces in Argentina support 13 threatened species and havesuffered from overgrazing and uncontrolled annual burning. Ifall 596 key areas (selected from an initial total of approximately7,000 sites) were adequately protected, we would help ensurethe conservation of 280 (97 percent) of the threatened speciesin the Neotropics (Wege and Long 1995: 19).
FRAGMENTATION AND ROAD DENSITIESGlobally, grasslands have been heavily modified by human ac-tivities; few large expanses of unaltered grasslands remain. Inaddition, small areas are frequently fragmented (Risser 1996:265). Although forest fragmentation has been the source of re-cent and often heated discussions regarding the merits and draw-backs of road building, grasslands and their current fragmenta-tion levels have received relatively little attention.
A series of studies in the 1980s and early 1990s suggeststhat fragmentation of grasslands may lead to declines in song-bird populations. Studies in Missouri (Samson and Knopf 1982),Illinois (Herkert 1994), and North Dakota (Kantrud 1981) indi-cate that less fragmented landscapes are associated with higherdensity and diversity in grassland bird species. Licht (1997:58) states that “When one thoroughly examines the scientificliterature, it becomes apparent that almost all grassland song-bird species that are declining do better on large contiguousblocks of grassland habitat…”.
Additional studies show that fragmentation of grasslands canhave negative effects on other species, including both plantsand animals. It can lead to genetically isolated and reducedpopulations, which are more susceptible to inbreeding, geneticdrifting, and extinction; fewer native species because of lessvariety in successional stages of grasslands; decreased prob-ability of recolonization; and higher ratio of edge to area, lead-ing to lower nest success and higher predation (Andren 1994;Johnson and Temple 1990; Franklin 1986).
To highlight areas where extensive grasslands remain, itwould be instructive to superimpose a global database of roadsonto a map of the world’s grasslands. The large grassland areascould then be analyzed further for ecosystem condition and even-tually lead to a map identifying remaining large, intact grass-
Figure 10Key Threatened Bird Areas in the Neotropics
Source: Wege and Long 1995.
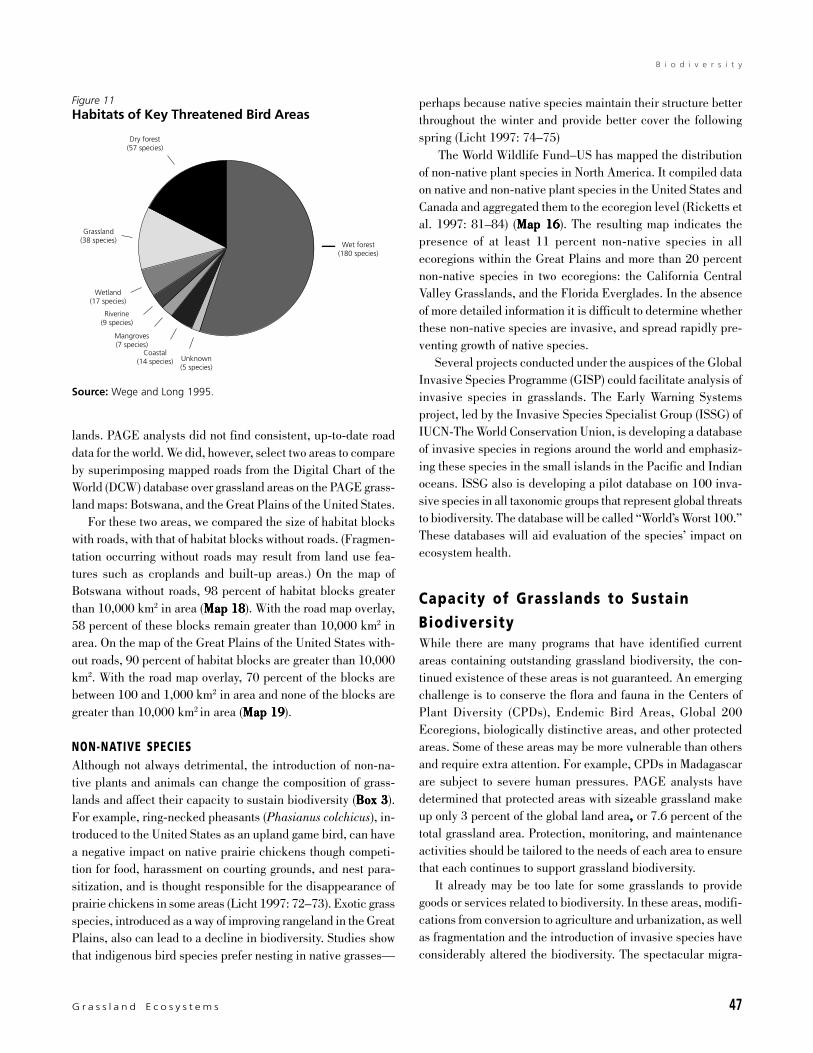
G r a s s l a n d E c o s y s t e m s 47
B i o d i v e r s i t y
lands. PAGE analysts did not find consistent, up-to-date roaddata for the world. We did, however, select two areas to compareby superimposing mapped roads from the Digital Chart of theWorld (DCW) database over grassland areas on the PAGE grass-land maps: Botswana, and the Great Plains of the United States.
For these two areas, we compared the size of habitat blockswith roads, with that of habitat blocks without roads. (Fragmen-tation occurring without roads may result from land use fea-tures such as croplands and built-up areas.) On the map ofBotswana without roads, 98 percent of habitat blocks greaterthan 10,000 km2 in area (Map 18Map 18Map 18Map 18Map 18). With the road map overlay,58 percent of these blocks remain greater than 10,000 km2 inarea. On the map of the Great Plains of the United States with-out roads, 90 percent of habitat blocks are greater than 10,000km2. With the road map overlay, 70 percent of the blocks arebetween 100 and 1,000 km2 in area and none of the blocks aregreater than 10,000 km2 in area (Map 19Map 19Map 19Map 19Map 19).
NON-NATIVE SPECIESAlthough not always detrimental, the introduction of non-na-tive plants and animals can change the composition of grass-lands and affect their capacity to sustain biodiversity (Box 3Box 3Box 3Box 3Box 3).For example, ring-necked pheasants (Phasianus colchicus), in-troduced to the United States as an upland game bird, can havea negative impact on native prairie chickens though competi-tion for food, harassment on courting grounds, and nest para-sitization, and is thought responsible for the disappearance ofprairie chickens in some areas (Licht 1997: 72–73). Exotic grassspecies, introduced as a way of improving rangeland in the GreatPlains, also can lead to a decline in biodiversity. Studies showthat indigenous bird species prefer nesting in native grasses—
perhaps because native species maintain their structure betterthroughout the winter and provide better cover the followingspring (Licht 1997: 74–75)
The World Wildlife Fund–US has mapped the distributionof non-native plant species in North America. It compiled dataon native and non-native plant species in the United States andCanada and aggregated them to the ecoregion level (Ricketts etal. 1997: 81–84) (Map 16Map 16Map 16Map 16Map 16). The resulting map indicates thepresence of at least 11 percent non-native species in allecoregions within the Great Plains and more than 20 percentnon-native species in two ecoregions: the California CentralValley Grasslands, and the Florida Everglades. In the absenceof more detailed information it is difficult to determine whetherthese non-native species are invasive, and spread rapidly pre-venting growth of native species.
Several projects conducted under the auspices of the GlobalInvasive Species Programme (GISP) could facilitate analysis ofinvasive species in grasslands. The Early Warning Systemsproject, led by the Invasive Species Specialist Group (ISSG) ofIUCN-The World Conservation Union, is developing a databaseof invasive species in regions around the world and emphasiz-ing these species in the small islands in the Pacific and Indianoceans. ISSG also is developing a pilot database on 100 inva-sive species in all taxonomic groups that represent global threatsto biodiversity. The database will be called “World’s Worst 100.”These databases will aid evaluation of the species’ impact onecosystem health.
Capacity of Grasslands to SustainBiodiversityWhile there are many programs that have identified currentareas containing outstanding grassland biodiversity, the con-tinued existence of these areas is not guaranteed. An emergingchallenge is to conserve the flora and fauna in the Centers ofPlant Diversity (CPDs), Endemic Bird Areas, Global 200Ecoregions, biologically distinctive areas, and other protectedareas. Some of these areas may be more vulnerable than othersand require extra attention. For example, CPDs in Madagascarare subject to severe human pressures. PAGE analysts havedetermined that protected areas with sizeable grassland makeup only 3 percent of the global land area, , , , , or 7.6 percent of thetotal grassland area. Protection, monitoring, and maintenanceactivities should be tailored to the needs of each area to ensurethat each continues to support grassland biodiversity.
It already may be too late for some grasslands to providegoods or services related to biodiversity. In these areas, modifi-cations from conversion to agriculture and urbanization, as wellas fragmentation and the introduction of invasive species haveconsiderably altered the biodiversity. The spectacular migra-
Figure 11Habitats of Key Threatened Bird Areas
Source: Wege and Long 1995.
Wet forest(180 species)
Dry forest(57 species)
Grassland(38 species)
Wetland(17 species)
Riverine(9 species)
Mangroves(7 species)
Coastal(14 species) Unknown
(5 species)

48 P I L O T A N A LY S I S O F G L O B A L E C O S Y S T E M S
B i o d i v e r s i t y
Box 3
Valuing a Fynbos Ecosystem
Fynbos: sclerophyllous scrub vegetation, or vegetationhaving tough, thick, evergreen leaves, found in areas with aMediterranean climate, including South Africa.
The ability to estimate the value of South Africa’s ecosys-tems with and without invasives has proved key to securingsupport for clearing programs. For example, a 1997 analysisvalued a hypothetical 4-km2 fynbos mountain ecosystem atR19 million (approximately US$3.2 million) with no manage-ment of alien plants and at R300 million (approximately US$50million) with effective management of alien plants. The analysiswas based on the value of just six major goods and servicesprovided by the ecosystem: water production, wildflowerharvest, hiker and ecotourist visitation, endemic species, andgenetic storage (Higgins et al. 1997:165).
The authors also determined that the cost of clearing alienplants was just 0.6– 5 percent of the value of mountain fynbosecosystems. That may be a very conservative estimate, giventhe extraordinary species richness and endemism in SouthAfrica’s eight biomes and the fact that invading plants threatento eliminate about 1,900 species (van Wilgen and van Wyk1999, citing Hilton-Taylor 1996).
In fact, South Africa’s biodiversity is perhaps the strongestlong-term justification for limiting the extent of invasives, butthe most difficult ecosystem service to value. It is possible, forexample, to estimate a “ market worth” for fynbos plants whendeveloped as food and medicines or horticultural crops. How-ever, it is more difficult to put a value on a species like theCape Sugarbird, whose habitat is endangered by invasions inthe Western Cape, or the oribi antelope, threatened by in-vaders that disrupt grasslands habitats.
Source: Modified from WRI 2000: 203.
tions of large vertebrates in the temperate grasslands and steppesof North America and Eurasia now occur only in isolated pock-ets, in the Daurian Steppe and Tibetan Plateau (Olson andDinerstein 1997: 16). And the large-scale migration of herbi-vores, such as wildebeest and zebra, across the savannas ofAfrica now occur only over a much less extensive area, in EastAfrica and the central Zambezian region.
Grassland Biodiversity: InformationStatus and NeedsSome indicators available to evaluate grassland condition relyon subjective data rather than on quantitative measures. Wenow need a more universal adoption of quantitative indicatorsof condition and regularly collected, reliable data to evaluatethe condition of grassland biodiversity on a global scale. Someregional data-gathering efforts are good models. The BreedingBird Survey for North America provides high-quality informationon species abundance and population trends. These survey datapermit evaluation of long-term trends across several habitats. Otherdatasets on grassland wildlife populations are of good quality buthave limited coverage. Datasets on invasive species must be ex-panded to cover the entire globe and must distinguish data onintroduced species from data on harmful species.
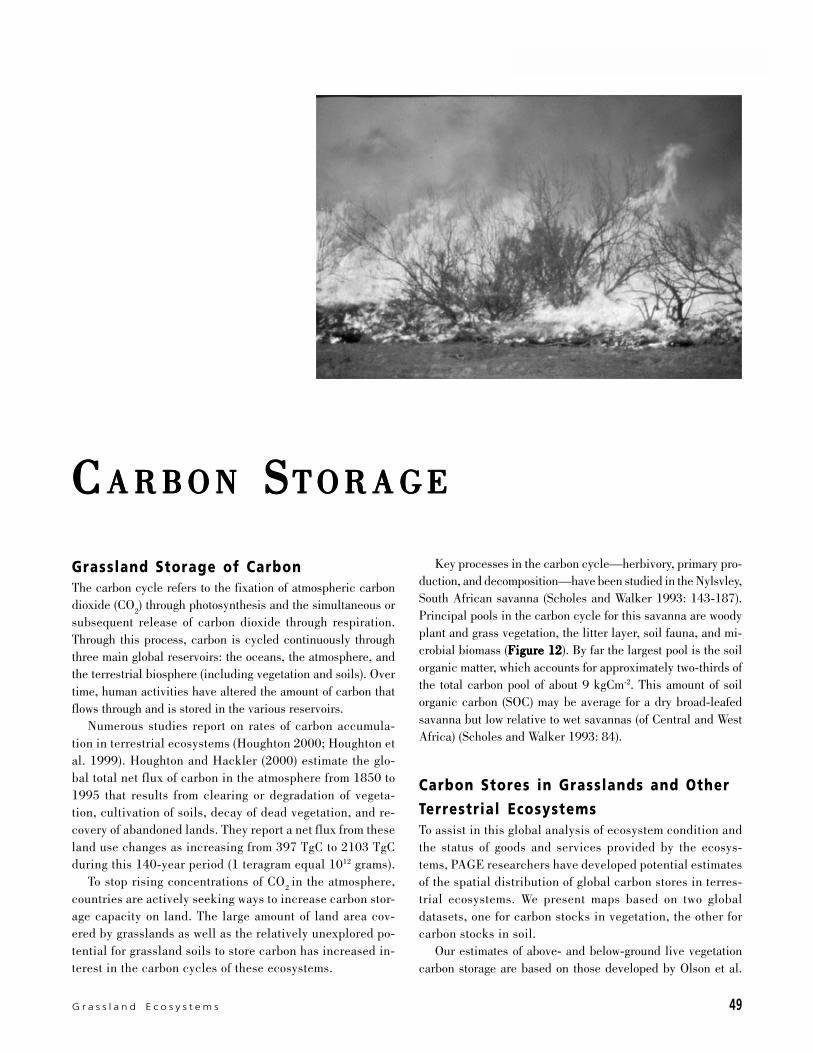
G r a s s l a n d E c o s y s t e m s 49
B i o d i v e r s i t y
Grassland Storage of CarbonThe carbon cycle refers to the fixation of atmospheric carbondioxide (CO
2) through photosynthesis and the simultaneous or
subsequent release of carbon dioxide through respiration.Through this process, carbon is cycled continuously throughthree main global reservoirs: the oceans, the atmosphere, andthe terrestrial biosphere (including vegetation and soils). Overtime, human activities have altered the amount of carbon thatflows through and is stored in the various reservoirs.
Numerous studies report on rates of carbon accumula-tion in terrestrial ecosystems (Houghton 2000; Houghton etal. 1999). Houghton and Hackler (2000) estimate the glo-bal total net flux of carbon in the atmosphere from 1850 to1995 that results from clearing or degradation of vegeta-tion, cultivation of soils, decay of dead vegetation, and re-covery of abandoned lands. They report a net flux from theseland use changes as increasing from 397 TgC to 2103 TgCduring this 140-year period (1 teragram equal 1012 grams).
To stop rising concentrations of CO2
in the atmosphere,countries are actively seeking ways to increase carbon stor-age capacity on land. The large amount of land area cov-ered by grasslands as well as the relatively unexplored po-tential for grassland soils to store carbon has increased in-terest in the carbon cycles of these ecosystems.
Key processes in the carbon cycle—herbivory, primary pro-duction, and decomposition—have been studied in the Nylsvley,South African savanna (Scholes and Walker 1993: 143-187).Principal pools in the carbon cycle for this savanna are woodyplant and grass vegetation, the litter layer, soil fauna, and mi-crobial biomass (Figure 12Figure 12Figure 12Figure 12Figure 12). By far the largest pool is the soilorganic matter, which accounts for approximately two-thirds ofthe total carbon pool of about 9 kgCm-2. This amount of soilorganic carbon (SOC) may be average for a dry broad-leafedsavanna but low relative to wet savannas (of Central and WestAfrica) (Scholes and Walker 1993: 84).
Carbon Stores in Grasslands and OtherTerrestrial EcosystemsTo assist in this global analysis of ecosystem condition andthe status of goods and services provided by the ecosys-tems, PAGE researchers have developed potential estimatesof the spatial distribution of global carbon stores in terres-trial ecosystems. We present maps based on two globaldatasets, one for carbon stocks in vegetation, the other forcarbon stocks in soil.
Our estimates of above- and below-ground live vegetationcarbon storage are based on those developed by Olson et al.
CCCCC A R B O NA R B O NA R B O NA R B O NA R B O N S S S S ST O R A G ET O R A G ET O R A G ET O R A G ET O R A G E

50 P I L O T A N A LY S I S O F G L O B A L E C O S Y S T E M S
C a r b o n S t o r a g e
(1983). These estimates have been described as “the most com-monly used, spatially explicit estimates of biomass carbon den-sities at a global scale” (Gaston et al. 1998: 98). PAGE research-ers applied Olson’s estimates to the classification developed forIGBP and used as a base map in this pilot analysis (GLCCD1998). The USGS EROS Data Center provided us with a matchbetween Olson’s low and high estimates of carbon storage forvarious ecosystems and the global ecosystems used in the IGBPclassifications (USGS EDC 1999a). Although Olson et al.’s es-timates of carbon storage for different vegetation types have beensuperseded by more recent national and regional studies, thePAGE researchers relied on these estimates as the only consis-tent set of estimates for vegetation types at the global level.
PAGE analysts mapped high and low estimates for carbonstorage in above- and below-ground live vegetation (Map 20Map 20Map 20Map 20Map 20).The carbon values are expressed as a range, in metric tons ofcarbon per hectare with only the high values shown on the map.In terms of quantity of carbon stored, tropical forests are visiblyoutstanding, followed by boreal forests, temperate forests andtropical savannas. Non-woody grasslands store less carbon thanthe forested areas. Sparsely vegetated and bare desert areashave the least carbon storage potential.
PAGE researchers also prepared maps of soil carbon storageusing estimates from Batjes (Batjes 1996). Batjes’ estimates arebased primarily on soil samples taken within 100 centimetersof the soil profile with special reference to the upper 50 centi-meters, the depth most directly influenced by interactions withthe atmosphere and with land use and environmental change(Batjes 1996:154). He analyzed over 4,000 soil profiles con-tained in the World Inventory of Soil Emission Potentials (WISE)database compiled by the International Soil Reference and In-formation Centre (ISRIC) (Batjes and Bridges 1994). Batjes thenused these soil profile data to determine the average soil or-ganic carbon (SOC) at several depths for each of the world soiltypes as defined by FAO. He summed the SOC content of the
soil types found in each 30 x 30 minute grid of the digitizedFAO-UNESCO Soil Map of the World (FAO 1991) and weightedthe SOC values according to the portion of soil type area withineach grid cell. Batjes’ estimates of the global stock of organiccarbon in the upper 100 cm of the soil are between 1,462 and1,548 GtC (gigatons of carbon; 1 GtC = 1 billion tons). The highvalue corresponds to “stone-free” soil conditions.
PAGE researchers repeated Batjes’ analysis using a morerecent 5 x 5 minute grid of the Soil Map of the World (FAO1995) and average SOC content values from Batjes (Batjes 1996;Batjes, personal communication, September 2000). We did notadjust for soil stone content, thus the PAGE estimate of globalorganic carbon of 1,553 Gt corresponds to Batjes’ estimate of1,548 Gt. The soil carbon map, as with the vegetation carbonmap, shows forests with the highest carbon storage potential(MapMapMapMapMap 2121212121). When the soil carbon data are compared to the veg-etation carbon data, however, grassland soils have considerablylarger potential carbon storage than grassland vegetation. Thisdifference in carbon storage potential illustrates the fact thatsoils are the major storage pool for carbon in grassland ecosys-tems; unlike tropical forests, where carbon is stored primarilyin above-ground vegetation, carbon in grasslands is stored pre-dominantly in the soil (UNEP 1997: 141).
Our combined estimates for potential carbon storage globallyin vegetation and soil ranges from 1,752 GtC (in the unvegetatedregions) to 2,385 GtC (in forested areas), depicted in a map ofthe distribution and concentration of total carbon stores. Theseresults are consistent with those presented in previous studies(IPCC 2000; Houghton 1996; Dixon et al. 1994). Here again,carbon storage potential appears highest in the tropical andboreal forests (with carbon storage values ranging from 300–400 metric tons per hectare), (Map 22Map 22Map 22Map 22Map 22). Although grasslandsare more extensive than forests, their carbon storage potentialper hectare is less, ranging from 100–300 metric tons. As indi-cated by the wide range between the low and high estimates for
Notes:Total Carbon Pool: 9 kgCm-2
All units are in kgCm-2 . Carbon pools shown are average for a dry broad-leafed savanna; carbon pools for wet savannas would be higher.
Woody Plants:Leaves & Wood: 1.11Coarse Roots: 0.1
Grasses:Shoots: 0.04-0.15Roots: 0.07
Soil Fauna: 0.008Microbial Biomass: 0.1-0.178Soil Organic Carbon: 6.8
Litter:Surface Litter: 0.48-0.72Soil Litter: 0.30-0.40
Figure 12Principal Pools in a Savanna Carbon Cycle
Source: Modified from Scholes and Walker 1993:84.
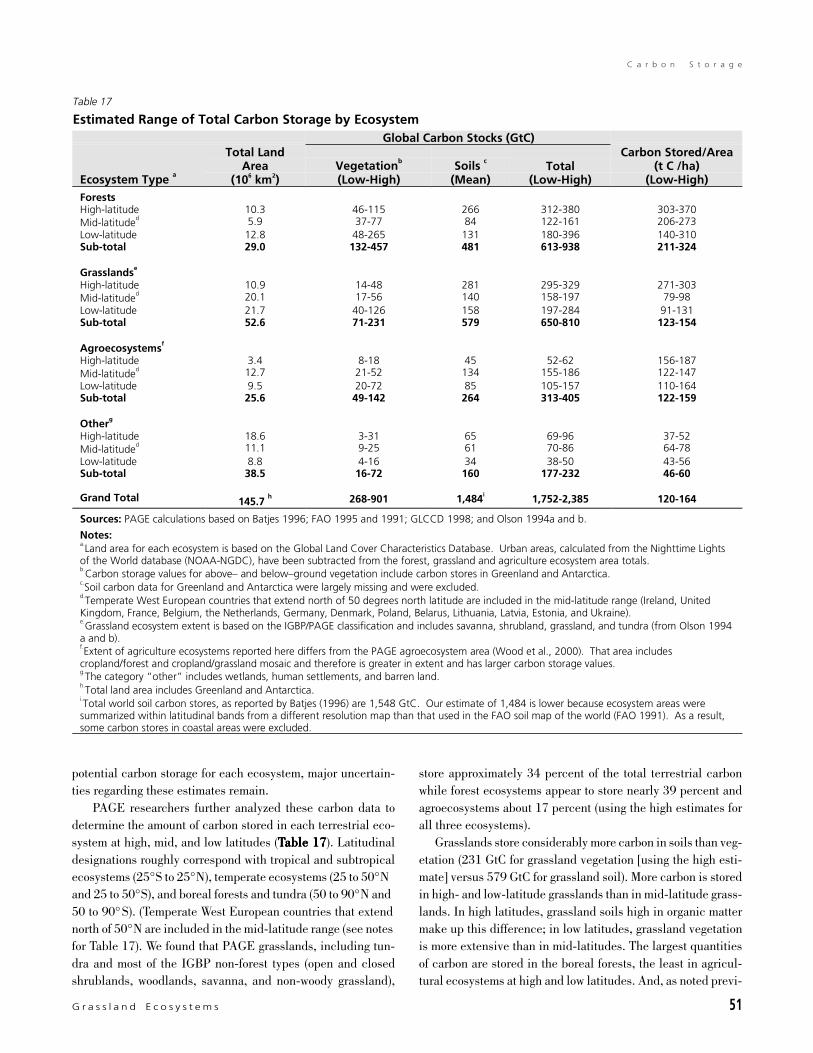
G r a s s l a n d E c o s y s t e m s 51
C a r b o n S t o r a g e
potential carbon storage for each ecosystem, major uncertain-ties regarding these estimates remain.
PAGE researchers further analyzed these carbon data todetermine the amount of carbon stored in each terrestrial eco-system at high, mid, and low latitudes (TTTTTable 17able 17able 17able 17able 17). Latitudinaldesignations roughly correspond with tropical and subtropicalecosystems (25° S to 25° N), temperate ecosystems (25 to 50° Nand 25 to 50° S), and boreal forests and tundra (50 to 90° N and50 to 90° S). (Temperate West European countries that extendnorth of 50° N are included in the mid-latitude range (see notesfor Table 17). We found that PAGE grasslands, including tun-dra and most of the IGBP non-forest types (open and closedshrublands, woodlands, savanna, and non-woody grassland),
store approximately 34 percent of the total terrestrial carbonwhile forest ecosystems appear to store nearly 39 percent andagroecosystems about 17 percent (using the high estimates forall three ecosystems).
Grasslands store considerably more carbon in soils than veg-etation (231 GtC for grassland vegetation [using the high esti-mate] versus 579 GtC for grassland soil). More carbon is storedin high- and low-latitude grasslands than in mid-latitude grass-lands. In high latitudes, grassland soils high in organic mattermake up this difference; in low latitudes, grassland vegetationis more extensive than in mid-latitudes. The largest quantitiesof carbon are stored in the boreal forests, the least in agricul-tural ecosystems at high and low latitudes. And, as noted previ-
Table 17
Estimated Range of Total Carbon Storage by EcosystemGlobal Carbon Stocks (GtC)
Ecosystem Type a
Total LandArea
(106 km2)Vegetationb
(Low-High)Soils c
(Mean)Total
(Low-High)
Carbon Stored/Area(t C /ha)
(Low-High)ForestsHigh-latitude 10.3 46-115 266 312-380 303-370Mid-latituded 5.9 37-77 84 122-161 206-273Low-latitude 12.8 48-265 131 180-396 140-310Sub-total 29.0 132-457 481 613-938 211-324
Grasslandse
High-latitude 10.9 14-48 281 295-329 271-303Mid-latituded 20.1 17-56 140 158-197 79-98Low-latitude 21.7 40-126 158 197-284 91-131Sub-total 52.6 71-231 579 650-810 123-154
Agroecosystemsf
High-latitude 3.4 8-18 45 52-62 156-187Mid-latituded 12.7 21-52 134 155-186 122-147Low-latitude 9.5 20-72 85 105-157 110-164Sub-total 25.6 49-142 264 313-405 122-159
Otherg
High-latitude 18.6 3-31 65 69-96 37-52Mid-latituded 11.1 9-25 61 70-86 64-78Low-latitude 8.8 4-16 34 38-50 43-56Sub-total 38.5 16-72 160 177-232 46-60
Grand Total 145.7 h 268-901 1,484i 1,752-2,385 120-164
Sources: PAGE calculations based on Batjes 1996; FAO 1995 and 1991; GLCCD 1998; and Olson 1994a and b.
Notes:a.Land area for each ecosystem is based on the Global Land Cover Characteristics Database. Urban areas, calculated from the Nighttime Lightsof the World database (NOAA-NGDC), have been subtracted from the forest, grassland and agriculture ecosystem area totals.b.Carbon storage values for above– and below– ground vegetation include carbon stores in Greenland and Antarctica.c.Soil carbon data for Greenland and Antarctica were largely missing and were excluded.d.Temperate West European countries that extend north of 50 degrees north latitude are included in the mid-latitude range (Ireland, UnitedKingdom, France, Belgium, the Netherlands, Germany, Denmark, Poland, Belarus, Lithuania, Latvia, Estonia, and Ukraine).e.Grassland ecosystem extent is based on the IGBP/PAGE classification and includes savanna, shrubland, grassland, and tundra (from Olson 1994a and b).f.Extent of agriculture ecosystems reported here differs from the PAGE agroecosystem area (Wood et al., 2000). That area includescropland/forest and cropland/grassland mosaic and therefore is greater in extent and has larger carbon storage values.g.The category “ other” includes wetlands, human settlements, and barren land.h.Total land area includes Greenland and Antarctica.i.Total world soil carbon stores, as reported by Batjes (1996) are 1,548 GtC. Our estimate of 1,484 is lower because ecosystem areas weresummarized within latitudinal bands from a different resolution map than that used in the FAO soil map of the world (FAO 1991). As a result,some carbon stores in coastal areas were excluded.

52 P I L O T A N A LY S I S O F G L O B A L E C O S Y S T E M S
C a r b o n S t o r a g e
Table 18
Global Estimates of Annual Amounts of Biomass Burning
Source of burningBiomass burned
(Tg dry matter/year)aCarbon released
(TgC/year)b
Savannas 3690 1660Agricultural waste 2020 910Tropical forests 1260 570Fuel wood 1430 640Temperate and boreal forests 280 130Charcoal 20 30World Total 8700 3940
Source: Andreae 1991.
Notes:a.Teragrams; 1 teragram equals 1012 grams or 106 metric tons.
b.Teragrams of carbon per year.
ously, although grasslands generally store less carbon than for-ests on a carbon/unit area basis, the total amount of carbon thatgrasslands store is significant because the area of these ecosys-tems is extensive.
Human Modification of GrasslandCarbon StoresModifications of grasslands that affect carbon storage includeconversion to agriculture, urbanization, desertification, fire, live-stock grazing, fragmentation, and introduction of non-nativespecies. When grasslands are converted to croplands, removalof vegetation and cultivation, especially clean plowing, reducessurface cover and destabilizes soil, leading to the loss of or-ganic carbon (Sala and Paruelo 1997: 238; Samson et al. 1998:32). Similarly, paving of grasslands for urban development re-duces carbon storage potential. Desertification, or degradationof land in dry areas as a result of climate variations and humanactivities, initiates loss of vegetative cover and soil erosion andeventually causes loss of carbon.
Fire in grasslands can release a tremendous amount ofcarbon. Biomass burning, especially from savannas, con-tributes up to 42 percent of gross carbon dioxide to globalemissions (Levine et al. 1999:3; Andreae 1991: 6) (TTTTTableableableableable1818181818). Grazing of large numbers of livestock can lead to re-ductions in plant biomass and cover as well as tramplingand compacting of the soil surface, decreases in water infil-tration, and increases in runoff and soil erosion, along withlosses of soil carbon (Sala and Paruelo 1997: 247). Frag-mentation of grasslands with the construction of wide, pavedroads in dense networks can lead to large losses of carbonstorage in both vegetation and soils.
A recent study suggests that introduction of non-native spe-cies also can play a role in carbon loss from grasslands. Thisresearch suggests that even the introduction of some less ag-
gressive species to grasslands may influence storage area foratmospheric carbon (Christian and Wilson 1999). Two sci-entists from the University of Regina in Saskatchewan,Canada, conducted an experiment using crested wheatgrass(Agropyron cristatum), a perennial tussock grass introducedfrom north Asia. They found that the soil beneath the crestedwheatgrass contained significantly fewer nutrients and lessorganic matter than soil under native prairie (Christian andWilson 1999: 2399). Different growth strategies may explainthe discrepancy. The wheatgrass produces more above-ground shoots and a shallow root system; the native grassesare shorter above ground but have an extensive below-groundroot network. The root network acts as an important storagearea for carbon. One implication of this study is that re-placement of native prairie grasses with wheatgrass may haveeliminated an important storage area for carbon. The effectsof crested wheatgrass, and perhaps of other introduced spe-cies that have not been investigated, may extend beyonddisplacement of native species and reduction of diversity toinclude alteration of carbon pools and the flow of energyand nutrients in grassland systems (Christian and Wilson1999: 2397).
Capacity of Grasslands to Maintain orIncrease Terrestrial Carbon StoresRecent time-series measurements show that between mid-1991and mid-1997, the combustion of fossil fuels added approxi-mately 6.2 GtC per year to the atmosphere as CO
2. This in-
creased the atmospheric concentration of CO2 by 2.8 GtC per
year (Battle et al. 2000: 2467). Of the remainder of the 6.2gigatons, 1.4 GtC per year was sequestered by the terrestrialbiosphere and 2.0 GtC per year by the oceans.
As part of the terrestrial biosphere, grasslands are poten-tially a sink for carbon. Depending on vegetation and soil con-
G r a s s l a n d E c o s y s t e m s 53
C a r b o n S t o r a g e
Box 4
Miombo Woodlands and Carbon Sequestration
The miombo woodlands have a great potential to either addto or help reduce the growing carbon dioxide content of theatmosphere. If substantial areas of miombo are cleared foragriculture, 6– 10 Pg of C could be released. Conversely, ifthe woodlands are managed to maximize carbon storage, asimilar amount could be sequestered. In both situations, ap-proximately half of the change in carbon stocks occurs in thesoil; the rest occurs in the biomass.
Net primary production or NPP in miombo woodlands rangesfrom 900 to 1600gm-2yr-1. The woody-plant biomass increasesby no more than 3– 4 percent annually in mature stands. As theupper limit of the sink strength, these rates could increase slightlyunder an atmosphere high in carbon dioxide, but given thepervasive nutrient limitations, an increase in net primary pro-duction of greater than 15 percent is unlikely.
Land use change does not inevitably lead to reduced car-bon density. Well-managed tropical pastures in comparableenvironments in South America can have high carbon den-sity, especially if the roots are deep (Fisher et al. 1994). Agri-cultural techniques which conserve biomass and build soilorganic matter, such as agroforestry, could result in a landscapethat is both agriculturally productive and rich in carbon.
The main technique for increasing carbon uptake in savanna
woodlands is to reduce fire frequency. Experiments in manyparts of Africa, including some in miombo woodlands, haveshown an increase in woody biomass and soil carbon if fires areexcluded (Trapnell et al. 1976). Permanent fire exclusion is vir-tually impossible in the strongly seasonal miombo climate, buta reduction in frequency from the current annual-to-triennialnorm to once a decade may be achievable at reasonable cost.This would simultaneously increase the uptake of carbon diox-ide, and decrease the emission of methane and ozone precur-sors. The carbon uptake would last from 20– 50 years, as thewoodlands reach a new equilibrium carbon density.
The carbon-storage benefits of miombo managementcould be extended beyond this initial 20– 50 year period byharvesting the timber using sustainable methods, and eitherconverting it to long-lived products such as furniture, or byusing it in place of fossil fuels.
Excerpted from Frost, P. 1996. The ecology of miombo woodlands.
In The Miombo in Transition: Woodlands and Welfare in Africa, ed.
B. Campbell, 11– 57. Bogor, Indonesia: Center for International For-
estry Research (CIFOR). 266pp. Reprinted by permission of CIFOR.
Modified from text box 2.3: Miombo woodlands and carbon seques-
tration (p. 28) by Bob Scholes.
dition, however, this potential may be minimal. Grasslands, es-pecially if overused in terms of plant production, can become anet source of CO
2 (UNEP 1997: 143). Thus, conversion to agri-
culture and degradation of dry grassland areas can reduce car-bon storage potential in many regions of the world, especiallythe arid zones.
Global-scale revegetation programs, aimed at curbing landdegradation and rehabilitating degraded lands, have been de-scribed as ways to increase carbon storage in grasslands (Trexlerand Meganck 1993). Future carbon storage potential of theworld’s grasslands and drylands could vary considerably de-pending on land use practices (Box 4Box 4Box 4Box 4Box 4). Ojima et al. (1993: 102)estimated that “regressive” land management (increased graz-ing levels from 30 percent to 50 percent removal of vegetation)resulted in a loss of soil carbon in all regions after 50 years,with the largest losses in warm grasslands. In contrast, sustain-able management (i.e., light grazing) resulted in a net increasein soil organic carbon.
Grassland Carbon Storage: InformationStatus and NeedsCarbon sequestration has become an important option for re-ducing the amount of CO
2 in the atmosphere and for reducing
the effects of excessive carbon emissions. Although grasslandsoffer extensive area for carbon storage, more information isneeded on how variations in their composition (non-woody veg-etation, shrubs, trees, and soil types) affect the quantities ofcarbon that they can store. Estimates of carbon stores in grass-lands made by PAGE researchers, and similar estimates by oth-ers, undoubtedly will be revised and updated because today’sestimates of annual carbon release and uptake rates in grass-lands, as well as in all other ecosystems, are considerably un-certain. The dynamics of soil carbon stocks have proven espe-cially difficult to assess because of the large number of samplesrequired for accurate estimates. Additional data collection andcomparative analysis will improve our knowledge of potentialvegetation and soil carbon storage capacity.
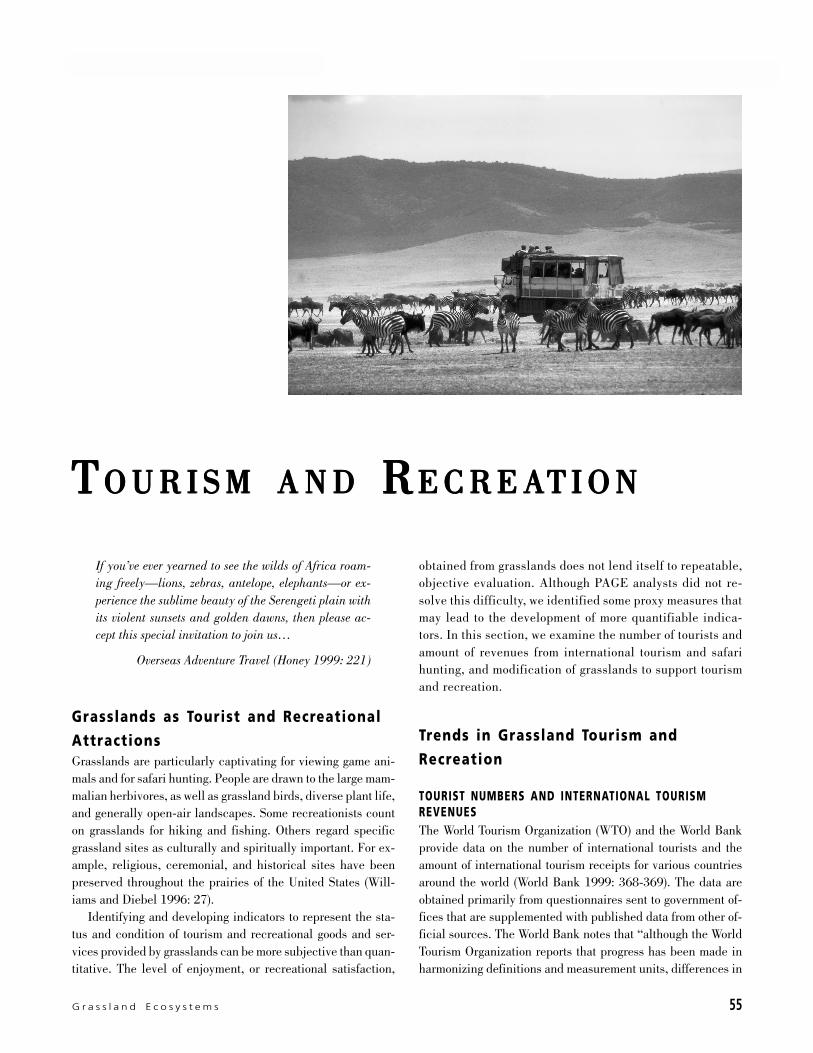
T o u r i s m a n d R e c r e a t i o n
G r a s s l a n d E c o s y s t e m s 55
If you’ve ever yearned to see the wilds of Africa roam-ing freely—lions, zebras, antelope, elephants—or ex-perience the sublime beauty of the Serengeti plain withits violent sunsets and golden dawns, then please ac-cept this special invitation to join us…
Overseas Adventure Travel (Honey 1999: 221)
Grasslands as Tourist and RecreationalAttractionsGrasslands are particularly captivating for viewing game ani-mals and for safari hunting. People are drawn to the large mam-malian herbivores, as well as grassland birds, diverse plant life,and generally open-air landscapes. Some recreationists counton grasslands for hiking and fishing. Others regard specificgrassland sites as culturally and spiritually important. For ex-ample, religious, ceremonial, and historical sites have beenpreserved throughout the prairies of the United States (Will-iams and Diebel 1996: 27).
Identifying and developing indicators to represent the sta-tus and condition of tourism and recreational goods and ser-vices provided by grasslands can be more subjective than quan-titative. The level of enjoyment, or recreational satisfaction,
TTTTT O U R I S MO U R I S MO U R I S MO U R I S MO U R I S M A N DA N DA N DA N DA N D R R R R RE C R E AE C R E AE C R E AE C R E AE C R E AT I O NT I O NT I O NT I O NT I O N
photograph
obtained from grasslands does not lend itself to repeatable,objective evaluation. Although PAGE analysts did not re-solve this difficulty, we identified some proxy measures thatmay lead to the development of more quantifiable indica-tors. In this section, we examine the number of tourists andamount of revenues from international tourism and safarihunting, and modification of grasslands to support tourismand recreation.
Trends in Grassland Tourism andRecreation
TOURIST NUMBERS AND INTERNATIONAL TOURISMREVENUESThe World Tourism Organization (WTO) and the World Bankprovide data on the number of international tourists and theamount of international tourism receipts for various countriesaround the world (World Bank 1999: 368-369). The data areobtained primarily from questionnaires sent to government of-fices that are supplemented with published data from other of-ficial sources. The World Bank notes that “although the WorldTourism Organization reports that progress has been made inharmonizing definitions and measurement units, differences in
T o u r i s m a n d R e c r e a t i o n
56 P I L O T A N A LY S I S O F G L O B A L E C O S Y S T E M S
national practices still prevent full internationalcomparability“(World Bank 2000:359).
The number of international inbound tourists is the numberof visitors traveling to a foreign country for purposes other thanbusiness. The World Bank further clarifies these data by stat-ing that they refer to the number of visitors arriving rather thanthe number of persons traveling. Therefore, a visitor who makesseveral trips to a country during the given period is countedeach time as a new arrival. International visitors include tour-ists (overnight visitors), same-day visitors, cruise passengers,and crew members (World Bank 2000:359).
In developing countries with extensive grassland (countriesin which grasslands cover at least 100,000 km2 and make up atleast 60 percent of the land area), the average annual numberof tourists (between 1995 and 1997) ranged from 4,000 in Af-ghanistan to 4.9 million in South Africa (TTTTTable 19able 19able 19able 19able 19). In Austra-lia, one of three developed countries with extensive grassland,an annual average number of 4 million tourists arrived between1995 and 1997. In most countries with extensive grassland andfor which tourism data are available, the number of interna-tional tourists increased over this 1985–87 to 1995–97 periodby as much as 621 percent in South Africa and 387 percent inZimbabwe. Exceptions include Mongolia, Afghanistan, andSomalia with declines of 57 percent, 56 percent, and 74 per-cent, respectively.
International tourism receipts include all payments for goodsand services by international inbound visitors. In developingcountries with extensive grassland, international tourism re-ceipts, averaged for the three-year period 1995–1997, rangedfrom US$1 million in Afghanistan to US$1.9 billion in SouthAfrica (TTTTTable 20able 20able 20able 20able 20). In Australia, the average annual total of in-ternational tourism receipts received in this same three-yearperiod was US$8.5 billion, an increase of approximately 471percent over 10 years. In all of the countries with extensivegrassland and for which tourism data are available, interna-tional inbound tourism receipts increased over the 1985–87 to1995–97 period by as much as 1,441 percent in Tanzania andover 800 percent in Ghana and Madagascar. Exceptions includeAfghanistan, where receipts remained the same, and three coun-tries that experienced 6–12 percent decreases: Benin, CentralAfrican Republic, and Nigeria.
Is the increase in the number of tourists and in receipts fromtourism in many countries with extensive grassland related tothe recreational and tourism services provided by grasslands?More detailed information on where tourists spend most of theirtime in these countries is needed to answer this question. How-ever, in some countries we may be more certain that the num-ber of tourists and level of receipts are indeed related to grass-lands. In her review of ecotourism in Kenya, Honey (1999: 329)states that despite growth in beach tourism, “more than 90% oftourists visiting Kenya go ‘on safari’ or [visit] a game park, even
if only for a day, and nearly 80% of those interviewed citednature and wildlife as their major reasons for coming to Kenya.”
Safari Hunting and Animal TrophiesPAGE analysts have examined trends in safari hunting in sev-eral African countries. On the assumption that large trophy ani-mals rely on grasslands for daily or seasonal activities, we presentthese trends as proxies for measuring condition of tourism ingrasslands according to revenues earned and numbers of par-ticipants.
In a review of the performance of the tourist hunting indus-try in Tanzania, the Department of Wildlife in Dar es Salaamfound that the number of hunting safaris made by internationalvisitors increased from just over 200 in 1988 to approximately500 in 1993 (IUCN 1996: 72). The most popular safaris were21 days in length, accounting for 71 percent of the safaris from1988 to 1992-93. Shorter safaris were less popular and ac-counted for the remaining safaris. The total dollar value of thesafari hunting industry increased from US$4.6 million in 1988to US$13.9 million in 1992–3 (IUCN 1996: 78).
In Zimbabwe, the number of hunter days and hunting opera-tors and the returns from the hunting industry all grew between1984 and 1990 (Waterhouse 1996b: 85). The number of hunt-ing days increased from 4,000 in 1984 to more than 10,000 in1990. The number of registered hunting operators grew from13 before 1980 to more than 150 in 1996. Total earnings peryear in Zimbabwe’s hunting industry similarly increased fromapproximately US$3 million in 1984 to close to US$9 millionin 1990 (Waterhouse 1996b: 85).
Consistent and reliable data on trends in the size of tro-phy animals might be useful for evaluating the recreationalvalue of grasslands (FigurFigurFigurFigurFigure 13e 13e 13e 13e 13). Such data, however, arenot widely available and are not reported in a consistentformat. Several African countries collect data on returns fromtourist hunting, published by IUCN–The World Conserva-tion Union (IUCN 1996:73–4). Among the species attract-ing tourist hunters according to numbers shot in 1992–93are buffaloes, zebras, lions, and leopards. Between 1988and 1993, both the number of animals killed and the num-ber of tourists increased. Elephants were the only speciesthat experienced a decrease in safari kills due to low over-all numbers from illegal hunting for ivory. The demand formost species, excluding elephants, also increased (IUCN1996: 74). But success in meeting that demand ranged onlyfrom 48 percent to 78 percent. The reliability of these data,and thus whether present harvest levels are sustainable, de-pends on their accuracy for a specified area—animals mi-grate and are attracted out of national parks—and on dataon trends in the size and quality of trophy animals (IUCN1996: 74).

T o u r i s m a n d R e c r e a t i o n
G r a s s l a n d E c o s y s t e m s 57
Grassland Modification to SupportTourism and RecreationTourism provides revenues but at the same time can be the sourceof natural resource degradation (Box 5Box 5Box 5Box 5Box 5). In 1992, the Tanza-nian government closed a luxury campsite inside the NgorongoroCrater because diesel engines, lights, latrines, and a garbagepit were causing environmental damage and disturbing wildlife(Honey 1999: 236). A Wildlife Division official from Tanzaniaclaims that tourist hunters cause less damage than tourists withcameras. The hunters bring less garbage, cause less damage toroads, use mobile campsites instead of game lodges, and harassfewer wild animals. While trophy hunters may need to locatetheir target only once, tourists with cameras often are lookingfor quantity, and, in their quest for photos, may drive off roadsand follow animals too closely (Honey 1999: 244–245).
Poaching is another major modification to grasslands, de-creasing the quality of tourism and recreational services pro-vided by grasslands. Despite government and privately spon-sored efforts to control illegal killing of wildlife, poaching hascontinued to be a problem for several African countries (Honey1999: 247). Tanzania’s elephant population, taking a toll fromillegal hunting, declined from 600,000 in the1960s to approxi-mately 100,000 in the late 1990s. In 1997, as part of a policy tostrengthen antipoaching activities, Kenya banned hunting andthe commercial trade in wildlife trophies and products (Honey1999: 298). Despite these restrictions, Kenya’s elephant popu-lation dropped by 85 percent between 1975 and 1990 to ap-proximately 20,000; the rhino population declined by 97 per-cent to less than 500.
Martha Honey, in her book on ecotourism (1999), helps toilluminate the condition of the recreational services provided
Table 19
International Inbound Tourists in Countries with Extensive Grasslanda
International Inbound Tourists
Region/Country
Average Annual Number(000)
1995-1997Percent ChangeSince 1985-1987b
DEVELOPING COUNTRIESASIA (Excl. Middle East)Mongolia 87 (57)MIDDLE EAST & NORTH AFRICAAfghanistan 4 (56)SUB-SAHARAN AFRICAAngola 8 XBenin 145 150Botswana 693 160Burkina Faso 131 181Central African Rep. 23 331Cote d’ Ivoire 233 25Ethiopiac 109 69Ghana 305 227Guinea 96 XKenya 703 17Madagascar 81 210Mozambique X XNamibia 405 XNigeria 699 202Senegal 287 21Somalia 10 (74)South Africa 4,987 621Tanzania, United Rep. 315 199Zambia 235 85Zimbabwe 1,722 387DEVELOPED COUNTRIESAustralia 4,059 180Kazakhstan X XTurkmenistan 196 X
Source: World Bank 1999.
Notes:a.Countries with extensive grassland have at least 100,000 km2 of grassland which covers at least 60 percent of the country’s total area. An “ X”signifies no data or data unavailable.b.Negative numbers are shown in parentheses.c.Includes Eritrea.

T o u r i s m a n d R e c r e a t i o n
58 P I L O T A N A LY S I S O F G L O B A L E C O S Y S T E M S
by grasslands with her summation of the impacts of ecotourismin three African countries with extensive grassland. In Tanza-nia, most environmental damage has occurred in heavily vis-ited areas. Although poaching has been a serious problem, thenegative environmental effects of nature tourism have been rela-tively limited (Honey 1999: 256). In Kenya, the quality of na-tional parks and reserves has declined since the 1970s as aresult of poorly controlled and excessive tourism and the ac-companying increase in lodges; water, wood, and electricityconsumption; waste; off-road driving; and poaching (Honey1999: 329). In South Africa, parks have long been consideredamong the best protected in the world. Numbers of visitors arewell-regulated and poaching is minimal. A more careful analy-sis reveals that South Africa’s parks were created by evictingrural Africans and making major alterations in the natural en-vironment by importing animals, erecting electric fences, plant-
ing alien trees and shrubs, clearing brush, and building roads.More recently, ecotourism has strived to use low-impact prac-tices through solar power, raised walkways, recycling of waterand waste, use of local materials, and incorporation of indig-enous designs (Honey 1999: 382–3).
Wildlife Exploitation IndexIn their ecoregional assessment of North America, WWF–USpresents a measure of wildlife exploitation (Ricketts 1997:137-138). They have assessed each ecoregion according to threeexploitation categories: hunting and poaching; unsustainableextraction of wildlife as commercial products; and harassmentand displacement of wildlife by commercial and recreationalusers. These categories are ranked according to three levels ofexploitation: high (elimination of local populations of most tar-
Table 20
International Tourism Receipts in Countries with Extensive Grassland a
International Tourism Receipts
Region/Country
Average Annual(million US$)
1995-1997
Percent ChangeSince
1985-1987b
DEVLOPING COUNTRIESASIA (Excl. Middle East)Mongolia 21 XMIDDLE EAST & NORTH AFRICAAfghanistan 1 0SUB-SAHARAN AFRICAAngola 9 XBenin 28 (7)Botswana 174 361Burkina Faso 32 459Central African Rep. 5 (6)Cote d’ Ivoire 78 59Ethiopiac 30 210Ghana 249 801Guinea 4 XKenya 440 46Madagascar 64 814Mozambique X XNamibia 214 XNigeria 75 (12)Senegal 147 33Somalia X XSouth Africa 1,962 312Tanzania, United Rep. 313 1,441Zambia 57 719Zimbabwe 208 624DEVELOPED COUNTRIESAustralia 8,503 471Kazakhstan X XTurkmenistan 7d X
Source: World Bank 1999.
Notes:a.Countries with extensive grassland have at least 100,000 km2 of grassland which covers at least 60percent of the country’s total area. An “ X” signifies no data or data unavailable.b.Negative numbers are shown in parentheses.c.Includes Eritread.Data are for 1996-1997.
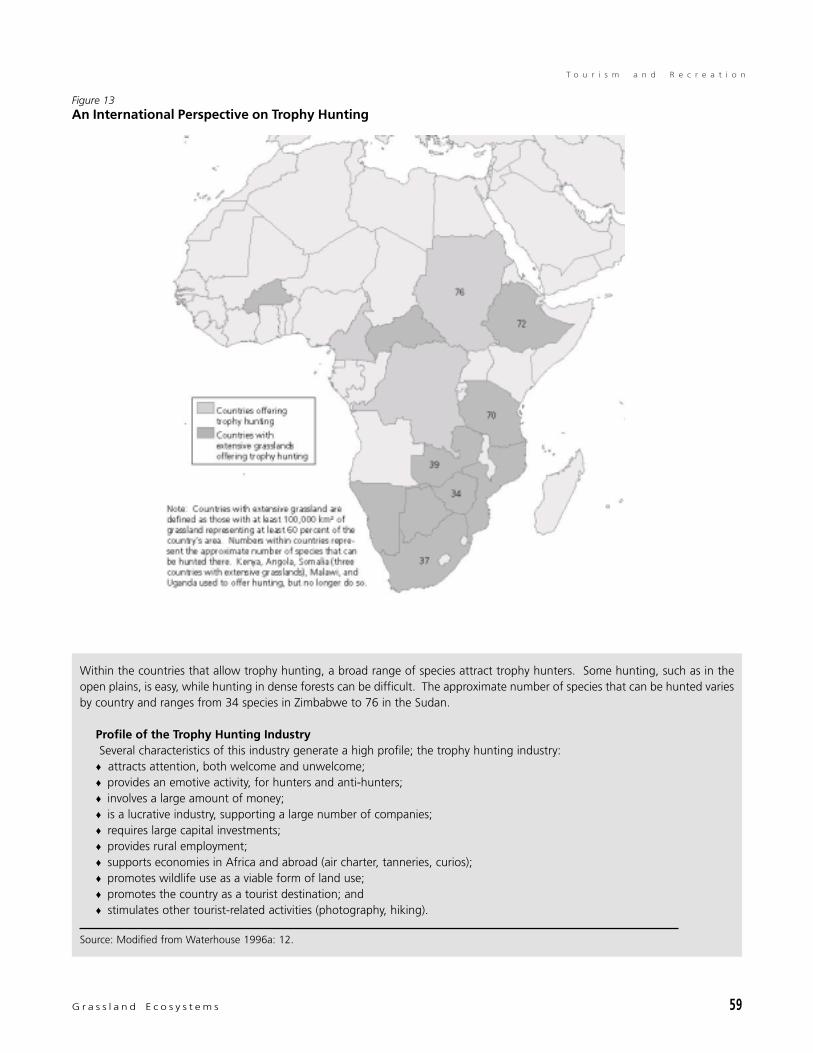
T o u r i s m a n d R e c r e a t i o n
G r a s s l a n d E c o s y s t e m s 59
Figure 13An International Perspective on Trophy Hunting
Within the countries that allow trophy hunting, a broad range of species attract trophy hunters. Some hunting, such as in theopen plains, is easy, while hunting in dense forests can be difficult. The approximate number of species that can be hunted variesby country and ranges from 34 species in Zimbabwe to 76 in the Sudan.
Profile of the Trophy Hunting Industry Several characteristics of this industry generate a high profile; the trophy hunting industry:♦ attracts attention, both welcome and unwelcome;♦ provides an emotive activity, for hunters and anti-hunters;♦ involves a large amount of money;♦ is a lucrative industry, supporting a large number of companies;♦ requires large capital investments;♦ provides rural employment;♦ supports economies in Africa and abroad (air charter, tanneries, curios);♦ promotes wildlife use as a viable form of land use;♦ promotes the country as a tourist destination; and♦ stimulates other tourist-related activities (photography, hiking).
Source: Modified from Waterhouse 1996a: 12.

T o u r i s m a n d R e c r e a t i o n
60 P I L O T A N A LY S I S O F G L O B A L E C O S Y S T E M S
Box 5
Ecotourism and Conservation: Are They Compatible?
From African wildlife safaris, to diving tours in the Caribbean’semerald waters and coral reefs, to guided treks in Brazil’srainforests, nature-based tourism is booming. The value of inter-national tourism exceeds US$444 billion (World Bank 1999:368);nature-based tourism may comprise 40– 60 percent of these ex-penditures and is increasing at 10– 30 percent annually(Ecotourism Society 1998).
This burgeoning interest in traveling to wild or untrammeledplaces may be good news, especially for developing countries. Itoffers a way to finance preservation of unique ecosystems withtourist and private-sector dollars and to provide economic oppor-tunities for communities living near parks and protected areas.
But the reality of nature-based travel is that it can both sus-tain ecosystems and degrade them. Much nature-based tourismfalls short of the social responsibility ideals of “ ecotourism,” de-fined by the Ecotourism Society as “ travel to natural areas thatconserves the environment and sustains the well-being of localpeople” (Ecotourism Society 1998). Destinations and trips mar-keted as ecotourism opportunities may focus more on environ-mentally friendly lodge design than local community develop-ment, conservation, or tourist education. Even some ecosystemsthat are managed carefully with ecotourism principles are show-ing signs of degradation.
Ecotourism’s Costs and Benefits
At first glance, Ecuador’s Galápagos Islands epitomize the prom-ise of ecotourism. Each year the archipelago draws more than62,000 people who pay to dive, tour, and cruise amidst the 120volcanic islands and the ecosystem’s rare tropical birds, iguanas,penguins, and tortoises. Tourism raises as much as $60 millionannually, and provides income for an estimated 80 percent ofthe islands’ residents. The tenfold increase in visitors since 1970has expanded the resources for Ecuador’s park service. Tour op-erators, naturalist guides, park officials, and scientists have workedtogether to create a model for low-impact, high-qualityecotourism (Honey 1999:101, 104, 107).
But closer examination reveals trade-offs: a flood of migrants seek-ing jobs in the islands’ new tourist economy nearly tripled the area’spermanent population over a 15-year period, turned the towns intosources of pollution, and added pressure to fishery resources (Honey1999:115, 117). Only 15 percent of tourist income directly enters theGalápagos economy; most of the profits go to foreign-owned airlinesand luxury tour boats or floating hotels— accommodations that maylessen tourists’ environmental impacts, but provide little benefit to lo-cal residents (Honey 1999:108, citing Epler 1997). The hordes of tour-ists and immigrants have brought new animals and insect species thatthreaten the island’s biodiversity (Honey 1999:54).
The Galápagos Islands well illustrate the complexities ofecotourism, including the potential to realize financial benefitsnationally, even as problems become evident at the local or parkscale. For example, to a government that is promoting ecotourism,more visitors means more income. But more visitors can trans-
late into damage to fragile areas. Park officials often complain ofhabitat fragmentation, air pollution from vehicle traffic, stressedwater supplies, litter, and other problems. In Kenya’s Maasai MaraNational reserve, illegal but virtually unregulated off-road drivingby tour operators has scarred the landscape (Wells 1997:40).
These impacts can be minimized with investments in parkmanagement, protection, and planning. However, developingcountries often lack the resources to monitor, evaluate, and pre-vent visitor impacts, and infrastructure and facilities may be rudi-mentary or nonexistent.
Low entrance fees are part of the problem; they often amountto just 0.01-1 percent of the total costs of a visitor’s trip (Gossling1999:309). Setting an appropriate park entry fee— one that cov-ers the park’s capital costs and operating costs, and ideally eventhe indirect costs of ecological damage— is one way that manage-ment agencies can capture a larger share of the economic value oftourism in parks and protected areas. Most parks have found thatvisitors are willing to pay more if they know their money will beused to enhance their experience or conserve the special area. Toensure broad affordable access to parks, Peru, Ecuador, Kenya,Jordan, Costa Rica, and several other countries have raised feesfor foreigners while maintaining lower fees for residents.
Unfortunately, tourism revenues are not always reinvested inconservation. Of the US$3 million that Galápagos National Parkgenerates each year, for example, only about 20 percent goes tothe national park system. The rest goes to general governmentrevenues (Sweeting et al. 1999:65). This is typical treatment ofpark income in many countries, but it undermines visitors’ supportfor the fees and destroys the incentive for managers to developparks as viable ecotourism destinations. Fortunately, some coun-tries are using special fees and tourism-based trust funds to explic-itly channel tourist dollars to conservation.
Some countries have introduced policies that help reimburselocal residents for the direct and indirect costs of establishing aprotected area. Kenya, for example, aims to share 25 percent ofrevenue from entrance fees with communities bordering protectedareas (Lindberg and Huber 1993:106). Ecotourism planners alsoadvocate sales of local handicrafts in gift stores, patronage of locallodges, use of locally grown food in restaurants and lodges, andtraining programs to enable residents to fill positions as tour guides,hotel managers, and park rangers. Both tour operators and visi-tors have a role to play by screening trips carefully and committingto ecotourist principles. Developers can choose sites based on en-vironmental conditions and local support, and use sustainable de-sign principles in building and resort construction.
Poorly planned, unregulated ecotourism can bring marginal finan-cial benefits and major social and environmental costs. But with well-established guidelines, involvement of local communities, and a long-term vision for ecosystem protection rather than short-term profit bydevelopers, ecotourism may yet live up to its promise.
Source: Modified from WRI 2000:34-35.
T o u r i s m a n d R e c r e a t i o n
G r a s s l a n d E c o s y s t e m s 61
get species is imminent or complete; 20 points); moderate (popu-lations of game and trade species persist but in reduced num-bers; 10 points); and non-existent (0 points). Data are based onexpert opinion from regional workshops.
The index of wildlife exploitation ranges from 0 to 10 (noneto moderate) for the 43 grassland ecoregions in North America.Twelve grassland ecoregions have moderate wildlife exploita-tion: Palouse Grasslands; Canadian Aspen Forest and Parklands;Edwards Plateau Savannas; Western Gulf Coastal Grasslands;California Montane Chaparral and Woodlands; California CoastalSage and Chaparral; Hawaiian High Shrublands; TamaulipanMezquital; Aleutian Islands Tundra; Interior Yukon/Alaska Al-pine Tundra; Olgive/MacKenzie Alpine Tundra; and TorngatMountain Tundra (Ricketts et al. 1997: Appendix D: 145–150)(Map 7Map 7Map 7Map 7Map 7). The wildlife populations in these regions are exploitedby activities such as pesticide use, predator control, urbansprawl, introduction of invasive species, overgrazing, and high-impact recreational activities (for example, off-road vehicle useand hunting). A WWF wildlife exploitation index for other re-gions of the world has not yet been published.
Capacity of Grasslands to SustainTourism and RecreationFrom the analysis above, PAGE researchers found that trendsin number of tourists and revenues received from tourism havegenerally increased in most countries with extensive grassland.So too have the number of safari hunters and revenues from thehunting industry. Data on trends in the size of trophy animalskilled are not readily accessible, although data for a five–yearperiod from Tanzania show the number of safari animals killedincreased for most species. The demand for most species, ex-cluding elephants, also increased (IUCN 1996: 74).
On the other hand, environmental degradation and poach-ing may be having substantial negative effects on grassland tour-ism. And, according to expert opinion, wildlife populations insome grassland ecosystems persist, but in reduced numbers.Therefore, although people may be increasing their use of thetourism and recreational services provided by grasslands, thecapacity of grassland ecosystems to continue to provide theseservices appears to be declining.
Grassland Tourism and Recreation:Information Status and NeedsAt present, evaluation of the quality of recreational servicesprovided by grasslands worldwide is largely subjective. Typi-cally, we must use data that lack consistency and that are with-out comprehensive coverage. Data on recreational services, suchas tourist numbers or hunting returns, are difficult to obtain,are of variable quality, and are not associated with ecosystemtype. Assumptions generally made associating high tourismnumbers and heavily used areas with degraded grasslands, andlow tourism numbers and isolated reserves with grasslands ingood condition, need to be verified with field data over longtime periods. Accurate assessments of the quality of recreationand tourism in grasslands, and predictions about the continuedcapacity of grasslands to provide those services, require en-hanced systems for data collection, monitoring, and reporting.
G r a s s l a n d E c o s y s t e m s 63
R e f e r e n c e s
ABBREVIATIONSASSOD Assessment of the Status of Human-Induced Soil
Degradation in South and Southeast Asia
AVHRR Advanced Very-High-Resolution Radiometer
BBS Breeding Bird Survey
CDIAC Carbon Dioxide Information and Analysis Center
CIAT Centro Internacional de Agricultura Tropical
CIESIN Center for International Earth Science InformationNetwork
CO2 Carbon Dioxide
CPD Center of Plant Diversity
DCW Digital Chart of the World
EBA Endemic Bird Area
EDC EROS Data Center
EROS Earth Resources Observation System
ESA European Space Agency
ESRI Environmental Systems Research Institute
FAO Food and Agriculture Organization of the UnitedNations
FEWS Famine Early Warning System
GIS Geographic Information Systems
GISP Global Invasive Species Programme
GLASOD Global Assessment of Human-Induced SoilDegradation
GLCCD Global Land Cover Characteristics Database
GLO-PEM Global Production Efficiency Model
IFPRI International Food Policy Research Institute
IGBP International Geosphere-Biosphere Programme
ILRI International Livestock Research Institute
IPCC Intergovernmental Panel on Climate Change
ISRIC International Soil Reference and InformationCentre
ISSG Invasive Species Specialist Group
IUCN World Conservation Union
MHT Major Habitat Type
NASA National Aeronautics and Space Administration
NBII National Biological Information Infrastructure
NDVI Normalized Difference Vegetation Index
NGDC National Geophysical Data Center
NOAA National Oceanic and Atmospheric Administration
NPP Net Primary Productivity
NRC National Research Council
ORNL Oak Ridge National Laboratory
OTA Office of Technology Assessment
PAGE Pilot Analysis of Global Ecosystems
RUE Rain-Use Efficiency
SLCR Seasonal Land Cover Region
SOC Soil Organic Carbon
SOTER World Soils and Terrain Digital Database
SPOT Systeme Pour l’Observation de la Terre
TM Thematic Mapper (Landsat)
TNC The Nature Conservancy
UMD University of Maryland
UNCCD United Nations Convention to CombatDesertification
UNDP United Nations Development Programme
UNEP United Nations Environment Programme
UNSO UNDP Office to Combat Desertification andDrought
USAID United States Agency for InternationalDevelopment
USGS United States Geological Survey
VCL Vegetation Canopy Lidar
WCMC World Conservation Monitoring Centre
WISE World Inventory of Soil Emission Potentials
WRI World Resources Institute
WTO World Tourism Organization
WWF-U.S. World Wildlife Fund– United States
UNITSGtC Gigaton of Carbon (1 x 10⁹)
ha Hectare
kg Kilogram
km Kilometer
mm Millimeter
PgC Petagram of Carbon (1 x 10¹⁵)
TgC Teragram of Carbon (1 x 10¹²)
ABBREVIAABBREVIAABBREVIAABBREVIAABBREVIATIONSTIONSTIONSTIONSTIONSAND UNITSAND UNITSAND UNITSAND UNITSAND UNITS
G r a s s l a n d E c o s y s t e m s 65
B i b l i o g r a p h y
RRRRR E F E R E N C E SE F E R E N C E SE F E R E N C E SE F E R E N C E SE F E R E N C E S
Abel, N.O.J. 1993. Reducing cattle numbers on southern African
communal range: Is it worth it? In Range Ecology at Disequilibrium, ed.
R. Behnke, I. Scoones, and C. Kerven, 173–195. London: Overseas
Development Institute.
Ahrens, D.C. 1982. Introduction to Meteorology. St Paul: West Publishing
Company.
Andreae, M.O. 1991. Biomass burning: Its history, use, and distribution
and its impact on environmental quality and global climate. In Global
Biomas Burning, ed. J.S. Levine, 3–21. Cambridge: MIT Press.
Andren, H. 1994. Effects of habitat fragmentation on birds and mammals in
landscapes with different proportions of suitable habitat. Oikos 71:
355–66.
Arino, O. and J.M. Melinotte. 1998. The 1993 Africa Fire Map. Interna-
tional Journal of Remote Sensing 19(11):2019–2023.
Arino, O. and J.M. Melinotte. 1997. European Space Agency World Fire
Atlas. CD ROM.
Atjay, G.L., P. Ketner, and P. Duvigneaud. 1979. Terrestrial primary
production and phytomass. In The Global Carbon Cycle, ed. B. Bolin et
al.,129–181. Chichester: John Wiley & Sons.
Bailey, R.G. 1995. Descriptions of the Ecoregions of the United States.
Miscellaneous Publication 1391. U.S. Department of Agriculture,
Forest Service, Washington, D.C. 108pp.
Bailey, R.G. 1989. Explanatory Supplement to Ecoregions Map of the
Continents. Environmental Conservation 16(4):307–309.
Batjes, N.H. 1996. Total carbon and nitrogen in the soils of the world.
European Journal of Soil Science 47:151–163. World Inventory of Soil
Emission Potentials (WISE) data online at: http://www.isric.nl/
WISE.html.
Batjes, N.H., and Bridges, E.M. 1994. Potential emissions of radiatively
active gases from soil to atmosphere with special reference to methane:
development of a global database (WISE). Journal of Geophysical
Research 99:16479–16489.
Battle, M., M.L. Bender, P.P. Tans, J.W.C. White, J.T. Ellis, T. Conway, R.J.
Francey. 2000. Global carbon sinks and their variability inferred from
atmospheric O2 and O13C. Science: 287:2467–2470.
Behnke, R. and I. Scoones. 1993. Rethinking range ecology: Implications
for rangeland management in Africa. In Range Ecology at Disequilib-
rium, ed. R. Behnke et al., 1–30. London: Overseas Development
Institute.
Behnke, R., I. Scoones, and C. Kerven (eds.). 1993. Range Ecology at
Disequilibrium. London: Overseas Development Institute. 248pp.
Campbell, K. and M. Borner. 1995. Population trends and distribution of
Serengeti herbivores: Implications for management. In Serengeti II:
Dynamics, Management, and Conservation of an Ecosystem, ed. A.R.E.
Sinclair and P. Arcese, 177–145. Chicago: University of Chicago Press.
665 pp.
Campbell, B., P. Frost, and N. Byron. 1996. Miombo woodlands and their
use: overview and key issues. In The Miombo in Transition: Woodlands
and Welfare in Africa, ed. B. Campbell, 1–10. Bogor, Indonesia: Center
for International Forestry Research (CIFOR). 266pp.
Christian J.M., and S.D. Wilson. 1999. Long-term ecosystem impacts of an
introduced grass in the Northern Great Plains. Ecology 80(7): 2397–
2407.
CIESIN. 2000. Center for International Earth Science Information Network
(CIESIN), Columbia University, International Food Policy Research
Institute (IFPRI), and World Resources Institute (WRI). 2000. Gridded
Population of the World, Version 2 Alpha. Palisades, NY: CIESIN and
Columbia University. Data available online at: http://sedac.ciesin.org/
plue/gpw.
Cramer, W. and C.B. Field. 1999. Comparing global models of terrestrial
net primary productivity (NPP): Introduction. Global Change Biology 5
(Supplement):iii–iv.
Cramer, W., D.W. Kicklighter, A. Bondeau III, G. Churkina, B. Nemry. A.
Ruimy. A. Schloss, J. Kaduk, and participants of the Potsdam NPP
Model Intercomparison. 1999. Comparing global models of terrestrial
net primary productivity (NPP): Overview and key results. Global
Change Biology 5 (Supplement):1–15.
D’Antinio, C.M., and P.M. Vitousek. 1992. Biological invasions by exotic
grasses, the grass/fire cycle, and global change. Annual Review of
Ecology and Systematics 23:63–87.
Davis, S.D., V.H. Heywood, and A.C. Hamilton. 1995. Centres of Plant
Diversity: A Guide and Strategy for their Conservation, Vol. 2. IUCN-
World Conservation Union and World Wildlife Fund.
Davis, S.D., V.H. Heywood, and A.C. Hamilton. 1994. Centres of Plant
Diversity: A Guide and Strategy for their Conservation, Vol. 1. IUCN-
World Conservation Union and World Wildlife Fund.
DeFries, R.S., M.C. Hansen, J.R.G.Townshend, A.C. Janetos, and T.R.
Loveland. 2000. A new global 1-km data set of percentage tree cover
derived from remote sensing. Global Change Biology 6: 247-254.
Delgado, C., M. Rosegrant, H. Steinfeld, S. Ehui, and C. Courbois. 1999.
Livestock to 2020, The Next Food Revolution. Food, Agriculture, and the
Environment Discussion Paper 28. International Food Policy Research
Institute. 72pp.
Dinerstein, E., D.M. Olson, D.J. Graham, A.L. Webster, S.A. Primm, M.P.
Bookbinder, and G. Ledec. 1995. A Conservation Assessment of the
Terrestrial Ecoregions of Latin America and the Caribbean. World
Wildlife Fund. 129pp + maps.

66 P I L O T A N A LY S I S O F G L O B A L E C O S Y S T E M S
R e f e r e n c e s
Dixon, R.K., J.K. Winjum, and P.E. Schroeder. 1994. Conservation and
sequestration of carbon. Global Environmental Change 3(2): 159–173.
Dodd, J.L. 1994. Desertification and degradation in Sub-Saharan Africa.
BioScience 44 (1):28–33.
Ecological Stratification Working Group. 1995. A National Ecological
Framework for Canada. Agriculture and Agri-Food Canada, Research
Branch, Centre for Land and Biological Resources, and Environment
Canada, State of the Environment Directorate, Ecozone Analysis
Branch, Ottawa/Hull, Ontario. 125pp.
Ecotourism Society. 1998. Ecotourism Statistical Fact Sheet. Online
at: http://www.ecotourism.org/textfiles/stats.text.
Epler, B. 1997. An Economic and Social Analysis of Tourism in the
Galapagos Islands. Providence: University of Rhode Island, Coastal
Resource Center.
ESRI. 1993. Environmental Systems Research Institute. Digital Chart of
the World CD-ROM. Redlands, CA: ESRI.
Evans, R. 1998. The erosional impacts of grazing animals. Progress in
Physical Geography 22 (2):251–268.
Famine Early Warning System. 1996. Kenya, In Depth. FEWS In Depth
Report 1. USAID Project, Arlington, Virginia. 2 pp.
FAO. 1999. Food and Agriculture Organization of the United Nations.
FAO-STAT On-line Statistical Service. Rome: FAO. Available online
at: http://www.fao.org.
FAO. 995. ood and Agriculture Organization of the United Nations.
Digital Soil Map of the World (DSMW) and Derived Soil Properties.
Version 3.5. CD-ROM. Rome: FAO.
FAO. 1991. Food and Agriculture Organization of the United Nations. The
Digitized Soil Map of the World. World Soil Resources Report 67/1
(Release 1.0). Rome: FAO.
Fisher, M.J., I.M. Rao, M.A. Ayarza, C.E. Lascano, J.I. Sanz, R.J. Thomas,
and R.R. Vera. 1994. Carbon stoage by introduced deep-rooted grasses
in South American savannas. Nature 371:236-238.
Frank, D.A., S.J. McNaughton, and B.F. Tracy. 1998. The ecology of the
Earth’s grazing ecosystems. BioScience 48 (7):513–521.
Franklin, I.R. 1986. Evolutionary change in small populations. In
Conservation Biology, ed. M.E. Soule and B.A. Wilcox, 135–150.
Sunderland: Sinauer Associates.
Frost, P. 1996. The ecology of miombo woodlands. In The Miombo in
Transition: Woodlands and Welfare in Africa, ed. B. Campbell, 11–57.
Bogor, Indonesia: Center for International Forestry Research (CIFOR).
266pp.
Frost, P.G.H. 1985. The response of savanna organisms to fire. In Ecology
and Management of the World’s Savannas, ed. J.C. Tothill and J.J. Mott,
232–237. Canberra: Australian Academy of Science.
Fuller, D.O. 1998. Trends in NDVI time series and their relation to
rangeland and crop production in Senegal, 1987–1993. International
Journal of Remote Sensing 19(10):2013–2018.
Gaston, G., S. Brown, M. Lorenzini, and K.D Singh. 1998. State and
change in carbon pools in the forests of tropical Africa. Global Change
Biology 4:97–114.
GLCCD. 1998. Global Land Cover Characteristics Database, Version 1.2.
Data available online at: http://edcdaac.usgs.gov/glcc/glcc.html. See
also Loveland, T.R., B.C. Reed, J.F. Brown, D.O. Ohlen, Z. Zhu, L.
Yang, J. Merchant. 2000. Development of a global land cover character-
istics database and IGBP DISCover from 1–km AVHRR data.
International Journal of Remote Sensing 21[6-7]: 1303–1330.
Goetz, S.J., S.D. Prince, S.N. Goward, M.M. Thawley, and J. Small. 1999.
Satellite remote sensing of primary production: an improved production
efficiency modeling approach. Ecological Modeling 122:239–255.
Goetz, S.J., S.D. Prince, J. Small, A. Gleason, and M. Thawley. 2000.
Interannual variability of global terrestrial primary production: results of
a model driven with satellite observations. Journal of Geophysical
Research Atmospheres. In Press.
Gossling, S. 1999. Ecotourism: A means to safeguard biodiversity and
ecosystem function? Ecological Economics 29(2):303-320.
Graetz, D. 1994. Grasslands. In Changes in Land Use and Land Cover: a
Global Perspective, ed. W.B. Meyer and B. L. Turner, 125–147.
Cambridge, Cambridge University Press. 537pp.
Hambly, H. and T.O. Angura (Eds.) 1996. Grassroots Indicators for
Desertification: Experience and Perspectives from Eastern and Southern
Africa. Ottawa: International Development Research Centre. 168pp.
Henwood, W.D. 1998. An overview of protected areas in the temperate
grasslands biome. Parks 8(3):3-8.
Herkert, J.R. 1994. Breeding bird communities of midwestern prairie
fragments: the effects of prescribed burning and habitat. Natural Areas
Journal 14(2): 128–35.
Higgins, S.I., J.K. Turpie, R. Costanza, R.M. Cowling, D.C. le Maitre, C.
Marais, and G.G. Midgley. 1997. An ecological simulation model of
mountain fynbos ecosystems. Ecological Economics 22:155-169.
Hilton-Taylor, C. 1996. Red Data List of Southern African Plants.
Pretoria: National Botanical Institute.
Honey, M. 1999. Ecotourism and Sustainable Development: Who Owns
Paradise? Washington, D.C.: Island Press. 405pp.
Houghton, R.A. 1996. Land-use change and terrestrial carbon: the
temporal record. In Forest Ecosystems, Forest Management, and the
Global Carbon Cycle, ed. M.J. Apps, and D.T. Price. New York:
Springer.
Houghton, R.A. and J.L. Hackler. 2000. Carbon flux to the atmosphere
from land-use changes. In Trends: A Compendium of Data on Global
Changes. Carbon Dioxide Information Analysis Center, Oak Ridge
National Laboratory. Oak Ridge, TN: U.S. Department of Energy.
Online at: http://cdiac.esd.ornl.gov/trends/landuse/houghton/
houghton.html
Houghton, R.A., J.L. Hackler, K.T. Lawrence. 1999. The U.S. carbon
budget: contributions from land-use change. Science 285: 574-578.

G r a s s l a n d E c o s y s t e m s 67
R e f e r e n c e s
House, J.I., and D.O. Hall. 2000. Tropical savannas and grasslands. In
Terrestrial Global Productivity: Past, Present, and Future, eds. Mooney,
H., J. Roy, and B. Saugier. In Press.
IPCC. 2000. Intergovernmental Panel on Climate Change. Land Use,
Land-Use Change, and Forestry. R.T. Watson, I.R. Noble, B. Bolin,
N.H. Ravindranath, D.J. Verardo, D.J. Dokken (eds.) Cambridge:
Cambridge University Press.
IUCN-The World Conservation Union. 1998. 1997 United Nations List of
Protected Areas. Cambridge: Page Brothers. 412pp.
IUCN-The World Conservation Union. 1996. Returns from Tourist Hunting
in Tanzania. Planning and Assessment for Wildlife Management,
Department of Wildlife, Dar es Salaam, Tanzania. In Tourist Hunting in
Tanzania, ed. N. Leader-Williams, J.A. Kayera, and G.L. Overton, 71–80.
Proceedings of a workshop held in July 1993. Norwich: U.K. 138pp.
IUCN-The World Conservation Union. 1994. 1993 United Nations List of
National Parks and Protected Areas. Cambridge: Page Brothers. 313pp.
IUCN-The World Conservation Union. 1991. The Lowland Grasslands of
Central and Eastern Europe. IUCN East European Programme in
collaboration with Biodiversity Conservation Strategy Programme of
IUCN, WRI, UNEP. Environmental Research Series. 89pp.
Johnson, D.H., and S.A. Temple. 1990. Nest predation and brood
parasitism of tallgrass prairie birds. Journal of Wildlife Management
54: 106–11.
Kantrud, H.A. 1981. Grazing intensity effects on the breeding avifauna of
North Dakota native grasslands. Canadian Field Naturalist 95:404–17.
Kidwell, K.B. 1997. NOAA Global Vegetation Index User’s Guide. U.S.
Department of Commerce, National Oceanic and Atmospheric
Administration, National Environmental Satellite, Data, and Information
Service, Washington D.C. http://www2ncdc.noaa.gov/docs/.
Knapp, A.K., J.M. Blair, J.M. Briggs, S.L. Collins, D.C. Hartnett, and L.C.
Johnson, and E.G. Towne. 1999. The keystone role of bison in North
American tallgrass prairie. BioScience 49 (1):39–50.
Kruska, R.L., B.D. Perry, and R.S. Reid. 1995. Recent progress in the
development of decision support systems for improved animal health. In
Integrated Geographic Information Systems Useful for a Sustainable
Management of Natural Resources in Africa, Proceedings of the Africa
GIS ’95 meeting. March 6-9, 1995. Abidjan, Ivory Coast. Updated in
October, 1998.
Leader-Williams, N., J.A. Kayera, and G.L. Overton (Eds.). 1996. Tourist
Hunting in Tanzania. . Proceedings of a workshop held in July 1993.
Occasional Paper of the IUCN Species Survival Commission No. 14.
Norwich: U.K. 138pp.
Lerner, J. and E. Matthews. 1988. Methane emission from animals: a global
high-resolution database. Global Biogeochemical Cycles 2 (2): 139-156.
Levine, J.S, T. Bobbe, N. Ray, R. Witt, and A. Singh. 1999. Wildland
Fires and the Environment: A Global Synthesis. UNEP/DEIA&EW/
TR.99-1. 46pp.
Licht, D.S. 1997. Ecology and Economics of the Great Plains. Lincoln:
University of Nebraska Press. 225pp.
Lindberg, K. and R.H. Huber Jr. 1993. Economic Issues in Ecotourism
Management. In Ecotourism: A Guide for Planners and Managers, eds. K.
Lindberg and D.E. Hawkins, 82–115. Vermont: The Ecotourism Society.
McNaughton, S.J. 1993a. Biodiversity and function of grazing ecosystems.
In Biodiversity and Ecosystem Function, ed. E. Schulze and H.A.
Mooney, 316–383. New York: Springer Verlag.
McNaughton, S.J. 1993b. Grasses and grazers, science and management.
Ecological Applications 3:17–20.
McNaughton, S.J. 1985. Ecology of a grazing ecosystem: the Serengeti.
Ecological Monographs 55:259–294.
Menaut, J.C., L. Abbadie, F. Lavenu, P. Loudjani, and A. Podaire. 1991.
Biomass burning in West African savannas. In Global Biomass Burning:
Atmospheric, Climatic, and Biospheric Implications, ed. J. Levine, 133–
149. Cambridge: MIT Press.
Milchunas, D.G., and W.K. Lauenroth. 1993. Quantitative effects of
grazing on vegetation and soils over a global range of environments.
Ecological Monographs 63(4): 327–366.
NOAA NGDC. 1998. National Oceanic and Atmospheric Administration-
National Geophysical Data Center. Stable Lights and Radiance
Calibrated Lights of the World CD-ROM. Boulder, CO: NOAA-NGDC.
View Nighttime Lights of the World database online at: http://
julius.ngdc.noaa.gov:8080/production/html/BIOMASS/night.html.
NRC. 2000. National Research Council. Ecological Indicators for the
Nation. Washington, D.C.: National Academy Press. 180pp.
NRC. 1994. National Research Council. Rangeland Health. Washington,
D.C.: National Academy Press. 180pp.
Ojima, D.S., B.O.M. Dirks, E.P. Glenn, C.E. Owensby, and J.O. Scurlock.
1993. Assessment of C budget for grasslands and drylands of the world.
Water, Air, and Soil Pollution 70:95–109.
Oldeman, L.R. 1994. The global extent of soil degradation. In Soil
Resilience and Sustainable Land Use, ed. D.J. Greenland and T.
Szaboles, 111-116. Wallingford, U.K.: Commonwealth Agricultural
Bureau International.
Oldeman, L.R., and G.W.J. van Lynden. 1997. Revisiting the GLASOD
methodology. In Methods for Assessment of Soil Degradation, ed. R. Lal,
W.H. Blum, C. Valentine, and B.A. Steward, 423–439. New York: CRC
Press.
Olson, J.S. 1994a. Global Ecosystem Framework-Definitions. USGS EROS
Data Center Internal Report. Sioux Falls: USGS EROS Data Center. 37pp.
Olson, J.S. 1994b. Global Ecosystem Framework-Translation Strategy:
USGS EROS Data Center Internal Report. Sioux Falls: USGS EROS
Data Center. 39pp.
Olson, D.M. and E. Dinerstein, E. 1997. The Global 200: A Representation
Approach to Conserving the Earth’s Distinctive Ecoregions. World
Wildlife Fund, draft manuscript. 176pp.
Olson, J.S., J.A. Watts, and L. J. Allison. 1983. Carbon in Live Vegetation
of Major World Ecosystems. Report ORNL-5862. Tennessee: Oak Ridge
National Laboratory.
68 P I L O T A N A LY S I S O F G L O B A L E C O S Y S T E M S
R e f e r e n c e s
Osterheld, M., O.E. Sala, S.J. McNaughton. 1992. Effect of animal
husbandry on herbivore carrying capacity at the regional scale. Nature
356: 234–236.
Ostlie, W.R., and J.L. Haferman. 1999. Ecoregional Conservation in the
Great Plains. In Proceedings of the Sixteenth North American Prairie
Conference: The Central Nebraska Loess Hills Prairie, ed. J.T. Springer,
136–148. Kearney: University of Nebraska at Kearney. 263pp.
OTA. 1993. Office of Technology Assessment. Harmful Non-Indigenous
Species in the United States, OTA –F-565. U. S. Congress. Washington,
D.C.: U.S. Government Printing Office.
Prince, S.D. 1991. Satellite remote sensing of primary production:
comparison of results for Sahelian grasslands, 1981–1988. Interna-
tional Journal of Remote Sensing 12: 1301–1311.
Prince, S.D., and S.N. Goward. 1995. Global primary production: a remote
sensing approach. Journal of Biogeography 22: 815–835.
Prince, S.D., E. Brown de Colstoun, and L.L. Kravitz. 1998. Evidence from
rain-use efficiencies does not indicate extensive Sahelian desertifica-
tion. Global Change Biology 4: 359–374.
Prince, S.D., M.E. Geores, and J. Boberg. 1999. Coping strategies in the
Sahel and the Horn of Africa: a conceptual model based on cultural
behavior and satellite data. In GIS Solutions in Natural Resource
Management, ed. S. Morain, 235–250. Santa Fe: OnWord Press.
Revenga, C., Murray, S., Abramovitz, J., and Hammond, A. 1998.
Watersheds of the World: Ecological Value and Vulnerability. Joint
publication by World Resources Institute and Worldwatch Institute.
Ricciardi, A., W.W.M. Steiner, R.N. Mack, and D. Simberloff. 2000.
Toward a global information system for invasive species. BioScience
50(3): 239–244.
Ricketts, T., E. Dinerstein, D. Olson, C. Loucks, W. Eichbaum, K. Kavanagh,
P. Hedao, P. Hurley, K. Carney, R. Abell, and S. Walters. 1997. A
Conservation Assessment of the Terrestrial Ecoregions of North America
Volume I: The United States and Canada. World Wildlife Fund – United
States and World Wildlife Fund Canada. Prepublication Draft. 547pp.
Ridgeway;, R.L., W.P. Gregg, R.E. Stinner, and A.G. Brown, eds. 1999.
Invasive Species Database: Proceedings of a Workshop. In collaboration
with the U.S. Dept. of Interior, U.S. Dept. of Agriculture, and U.S. Dept.
of Commerce. Maryland: C.V. Riley Memorial Foundation. 50pp.
Riebsame, W.E. 1996. Ending the range wars? Environment 38 (4): 4–
9;27–29
Risser, P.G. 1996. A new framework for prairie conservation. In Prairie
Conservation: Preserving North America’s Most Endangered Ecosystem,
ed. F.B. Samson and F.L. Knopf, 261–274. Washington, D.C.: Island
Press. 339pp.
Sala, E.O., and J.M. Paruelo. 1997. Ecosystem services in grasslands. In
Nature’s Services, Societal Dependence on Natural Ecosystems, ed. G.C.
Daily, 237–252. Washington, D.C.: Island Press. 392pp.
Samson, F.B., and F.L. Knopf. 1994. Prairie conservation in North
America. BioScience 44:418–421.
Samson, F.B., and F.L. Knopf. 1982. In search of a diversity ethic for
wildlife management. Trans. North American Wildlife Natural Resources
Conference 47:421–31.
Samson, F.B., F.L. Knopf, and W.R. Ostlie. 1998. Grasslands. In Status
and Trends of the Nation’s Biological Resources, Vol. 2, ed. M.J. Mac,
P.A. Opler, C.E. Puckett, and P.D. Doran, 437-472. Reston, VA: U.S.
Department of the Interior, U.S. Geological Survey.
Sauer, J.R., J.E. Hines, G. Gough, I. Thomas, and B.G. Perterjohn. 1997.
The North American Breeding Bird Survey Results and Analysis. Version
96.3. Patuxent Wildlife Research Center, Laurel, MD. (Available
online at: www.mbr.nbs.gov/bbs/ htmgu/grass.html)
Sauer, J.R., J.E. Hines, I. Thomas, J. Fallon, and G. Gough. 1999. The
North American Breeding Bird Survey, Results and Analysis 1966–1998.
Version 98.1, USGS Patuxent Wildlife Research Center, Laurel, MD.
(Available online at: www.mrb-pwrc.usgs.gov/bbs/guild/guildlst.html)
Scherr, S.J. 1999. Soil Degradation: A Threat to Developing-Country Food
Security by 2020? Food, Agriculture, and the Environment Discussion
Paper 27. Washington, DC: International Food Policy Research
Institute. 63pp.
Scholes, R.J., and D.O. Hall. 1996. The carbon budget of tropical savannas,
woodlands, and grasslands. In Global Change: Effects on Coniferous
Forests and Grasslands, SCOPE Volume 56, eds. Breymeyer, A.K., D.O.
Hall, J.M. Melillo, and G.I. Agren, 69–100. Chichester: Wiley.
Scholes, R.J., and B.H. Walker. 1993. An African Savanna. Cambridge:
Cambridge University Press. 306pp.
Shan, C. 1996. Inner Asian grassland degradation and plant transforma-
tion. In Culture and Environment in Inner Asia, Volume 1: The Pastoral
Economy and the Environment, ed. C. Humphrey and D. Sneath, 111–
122. Cambridge: White Horse Press.
Sinclair, A.R.E., P. Arcese, eds. 1995. Serengeti II: Dynamics, Manage-
ment, and Conservation of an Ecosystem. Chicago: University of Chicago
Press. 665 pp.
Sneath, D. 1998. State policy and pasture degradation in Inner Asia.
Science 281: 1147–1148.
Sorino, A., R.J.C. Leon, O.C. Sala, R.A. Lavado, V.A. Deregibus, M.A.
Cauhepe, O.A. Scaglia, C.A. Velazquez, and J.H. Lemcoff. 1992. Rio
de Plata Grasslands. In Ecosystems of the World Volume 8A: Natural
Grasslands, ed. R.T. Coupland, 367–407. New York: Elsevier.
State of the Environment Advisory Council. 1996. State of the Environment
Australia. Commonwealth Minister for the Environment. Available
online at: http://www.environment.gov.au.
Stattersfield, A.J., M.J. Crosby, A.J. Long, and D.C. Wege. 1998. Endemic
Bird Areas of the World: Priorities for Biodiversity Conservation. Birdlife
Conservation Series No. 7. Cambridge: Birdlife International. 846pp.
Steinfeld, H., C. de Haan, and H. Blackburn. 1996. Livestock-Environment
Interactions, Issues and Options. Study sponsored by the Commission of
the European Communities, the World Bank, and the governments of
Denmark, France, Germany, The Netherlands, United Kingdom, and the
United States. Coordinated by FAO, USAID, and WB. 56pp.
G r a s s l a n d E c o s y s t e m s 69
R e f e r e n c e s
Sweeting, J.E.N., A.G. Bruner, and A.B. Rosenfeld. 1999. The Green Host
Effect: An Integrated Approach to Sustainable Tourism and Resort
Development. Conservation International Policy Paper. Washington,
D.C.: Conservation International.
Thomas, D.S.G. 1993. Sandstorm in a teacup? Understanding desertifica-
tion. The Geographical Journal 159(3):318–331.
Trapnell, C.G., M.T. Friend, G.T. Chamberlain, and H.F. Birch. 1976. The
effect of fire and termites on a Zambian woodland soil. Journal of
Ecology 64: 577-588.
Trexler, M.C. and R. Meganck. 1993. Biotic carbon offset programs:
sponsors of or impediment to economic development? Climate Research
Special. Science and Policy Interactions 3:129–136.
UNCCD. United Nations Convention to Combat Desertification. 1999.
United Nations Convention to Combat Desertification in Those Countries
Experiencing Serious Drought and/or Desertification, Particularly in
Africa. Text with Annexes. France. 71pp.
UNEP. 1997. United Nations Environment Programme. World Atlas of
Desertification, 2nd edition. Edited by N. Middleton and D. Thomas.
London: UNEP. 182pp.
UNEP 1992. United Nations Environment Programme. World Atlas of
Desertification. Edited by A. Arnold. London:UNEP. 69pp.
UNSO. 1997. Office to Combat Desertification and Drought. Aridity Zones
and Dryland Populations: An Assessment of Population Levels in the
World’s Drylands. New York: UNSO/UNDP. 23pp.
USGS EDC 1999a. United States Geological Survey (USGS) Earth
Resources Observation Systems (EROS) Data Center. Carbon in Live
Vegetation Map. Sioux Falls, SD: USGS/EDC. Unpublished data. For
this digital map, USGS/EDC applied carbon density numbers from a
previous study (Olson et al. 1983)) to a more recent global vegetation
map (GLCCD 1998).
USGS EDC 1999b. United States Geological Survey (USGS) Earth
Resources Observation Systems (EROS) Data Center. 1 km Land Cover
Characterization Database, Database Revisions for Latin America. Sioux
Falls, SD: USGS/EDC. Unpublished data.
Van Wilgen, B.W. and E. van Wyk. 1999. Invading alien plants in South
Africa: Impacts and solutions. In The VI International Rangeland
Congress, 566–571. Townsville, Australia.
Walker, B.H. 1985. Structure and function of savannas: an overview. In
Ecology and Management of the World’s Savannas, ed. J.C. Tothill and
J.J. Mott, 83–92. Canberra: Australian Academy of Science.
Waterhouse, P. 1996a. The trophy hunting industry: an African perspective.
In Tourist Hunting in Tanzania, ed. N. Leader-Williams, J.A. Kayera, and
G.L. Overton, 12–13. IUCN Species Survival Commission. Occasional
Paper of the IUCN Species Survival Commission No.14. 138pp.
Waterhouse, P. 1996b. The hunting industry in Zimbabwe. In Tourist
Hunting in Tanzania, ed. N. Leader-Williams, J.A. Kayera, and G.L.
Overton, 81–93. IUCN Species Survival Commission. Occasional Paper
of the IUCN Species Survival Commission No.14. 138pp.
Wege, D.C. and A.J. Long. 1995. Key Areas for Threatened Birds in the
Neotropics. Birdlife International. 311pp.
Wells, M. 1997. Economic Perspectives on Nature Tourism, Conservation
and Development. Washington, D.C.: The World Bank.
Whittaker, R.H., and E. Likens. 1975. The Biosphere and Man. In
Primary Productivity of the Biosphere, Ecological Studies No. 14, ed. H.
Lieth and R. H. Whittaker, 306, Table 15-1. Berlin: Springer-Verlag.
Whitten, T. 1999. Mongolia: Environment and Natural Resources:
Opportunities for Investment. Unpublished draft. Washington, D.C.:
The World Bank.
Williams, J.R. and P.L. Diebel. 1996. The economic value of the prairie.
Prairie Conservation: Preserving North America’s Most Endangered
Ecosystem, ed. F.B. Samson and F.L. Knopf, 19–35. Washington, D.C.:
Island Press.
Wood, S., K. Sebastian, and S. J. Scherr. 2000. Pilot Analysis of Global
Ecosystems: Agroecosystems. A Joint Study by International Food Policy
Research Institute and World Resources Institute. Washington, D.C.:
IFPRI and WRI.
World Bank. 2000. 2000 World Development Indicators. Washington, D.C.:
International Bank. 389pp.
World Bank. 1999. 1999 World Development Indicators. Washington,
D.C.: International Bank. 400pp.
WCMC. 1999. World Conservation Monitoring Centre. Protected Areas
Database. Cambridge: WCMC. Unpublished data.
WCMC. 1992. World Conservation Monitoring Centre. Grasslands. In
Global Biodiversity, 280–92. London: Chapman and Hall.
WRI. 2000. World Resources Institute. World Resources 2000-2001:
People and Ecosystems: The Fraying Web of Life. Canada: World
Resources Institute. 389pp.
WWF–US. 1999. World Wildlife Fund. Ecoregions Database. Washington,
DC: WWF-US. Unpublished database.

W O R L D R E S O U R C E S I N S T I T U T E
10 G Street NEWashington, D.C. 20002 U.S.A.
http://www.wri.org/wri
WITH ANALYTICAL CONTRIBUTIONS FROM
ISBN: 1-56973-461-5