Embed Size (px)
Citation preview
1
Bristow Group Inc.
Team: Dave Olstein, Griffin Dann, Brett Lacher
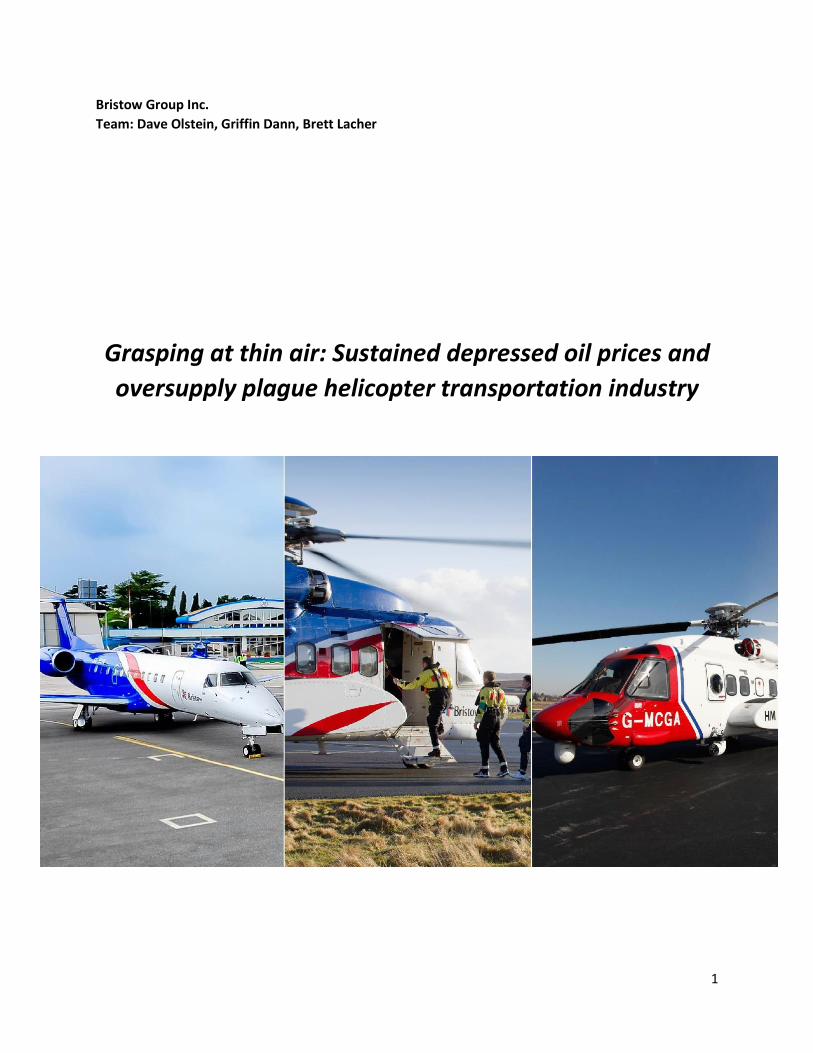
Grasping at thin air: Sustained depressed oil prices and
oversupply plague helicopter transportation industry
2
Table of Contents Bristow Group Overview ............................................................................................................................... 3
Business Overview .................................................................................................................................... 3
Industry Overview ..................................................................................................................................... 5
Situation Overview .................................................................................................................................... 8
Review of Classes / Claims / Liabilities .................................................................................................... 10
Liquidation Analysis ................................................................................................................................ 10
Comp Valuation ...................................................................................................................................... 12
Consensus Case ....................................................................................................................................... 12
Base Case ................................................................................................................................................ 13
Restructuring Overview .............................................................................................................................. 15
Recommendations for Operational Restructuring ................................................................................. 15
Operational Restructuring Plan .............................................................................................................. 17
Operational Restructuring Case .................................................................................................................. 18
Recommendations for Capital Structuring ............................................................................................. 19
Conclusion & Recommendation ................................................................................................................. 20
Works Cited ................................................................................................................................................. 21
3
Bristow Group Overview
Business Overview Bristow Group Inc. (“Bristow” or the “Company”), headquartered in Houston, TX, is a leading global
industrial aviation services provider – primarily to offshore energy producers. The Company was
founded in 1995 and has major transportation operations in the North Sea, Nigeria, and U.S. Gulf of
Mexico, as well as in most of the other major offshore energy producing regions of the world, including
Australia, Brazil, Canada, Russia and Trinidad. The Company also provides search and rescue (“SAR”)
services in Australia, Canada, Norway, Russia, Trinidad and the U.S. Specifically, Bristow provides public
sector SAR services in the U.K. on behalf of the Maritime & Coastguard Agency. Additionally, the
Company provides regional fixed wing scheduled and chartered services in the U.K., Nigeria and
Australia through the consolidated affiliates Eastern Airways International Limited and Capiteq Limited
(operating as Airnorth). The company has 345 aircraft and employs roughly 4,777 employees, many of
whom are represented under collective bargaining agreements.
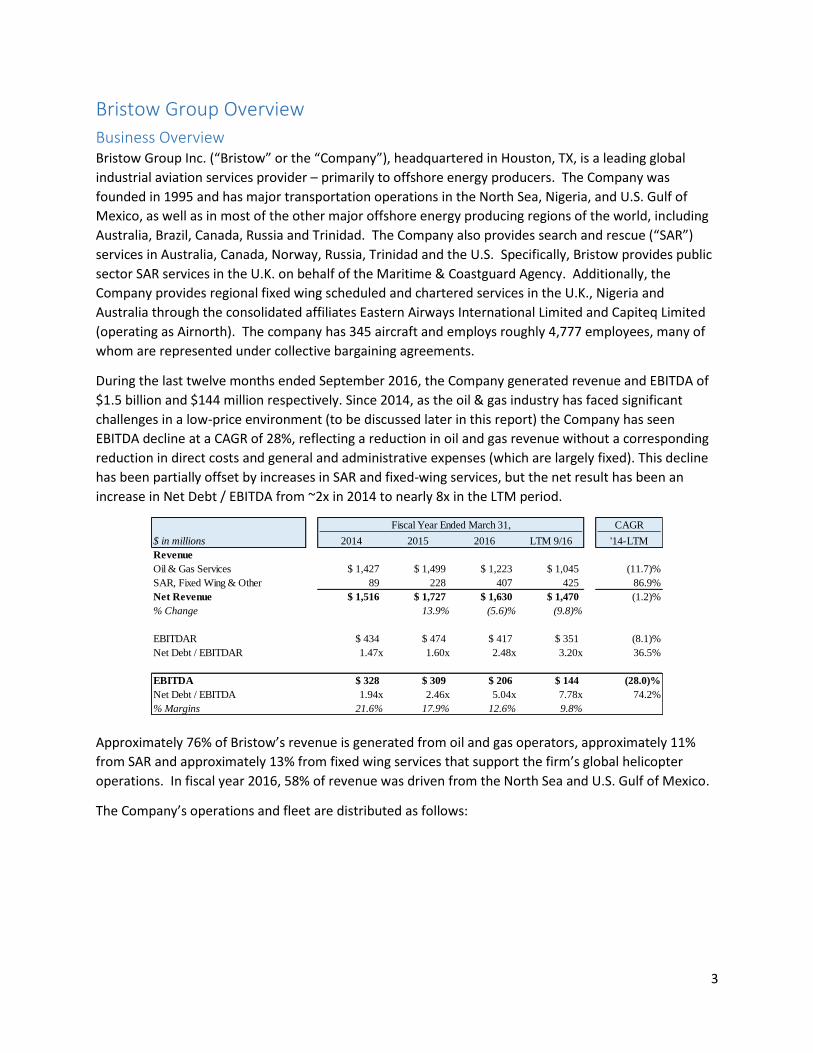
During the last twelve months ended September 2016, the Company generated revenue and EBITDA of
$1.5 billion and $144 million respectively. Since 2014, as the oil & gas industry has faced significant
challenges in a low-price environment (to be discussed later in this report) the Company has seen
EBITDA decline at a CAGR of 28%, reflecting a reduction in oil and gas revenue without a corresponding
reduction in direct costs and general and administrative expenses (which are largely fixed). This decline
has been partially offset by increases in SAR and fixed-wing services, but the net result has been an
increase in Net Debt / EBITDA from ~2x in 2014 to nearly 8x in the LTM period.
Approximately 76% of Bristow’s revenue is generated from oil and gas operators, approximately 11%
from SAR and approximately 13% from fixed wing services that support the firm’s global helicopter
operations. In fiscal year 2016, 58% of revenue was driven from the North Sea and U.S. Gulf of Mexico.
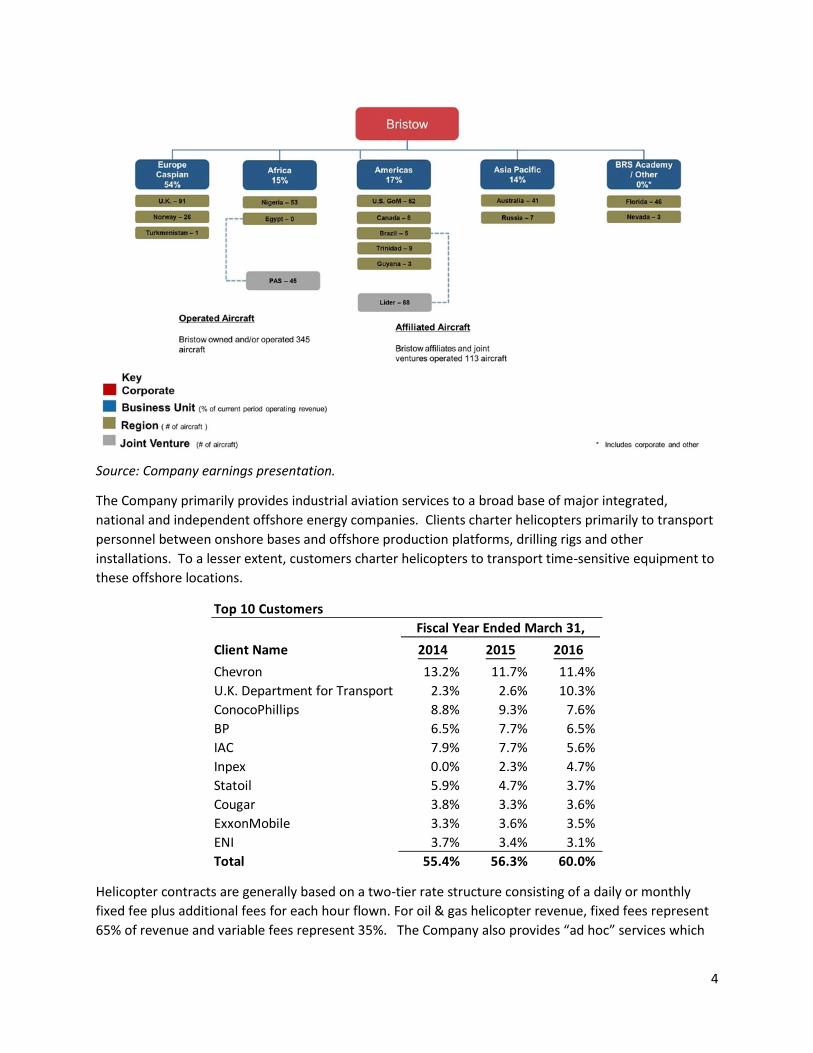
The Company’s operations and fleet are distributed as follows:
Fiscal Year Ended March 31, CAGR
$ in millions 2014 2015 2016 LTM 9/16 '14-LTM
Revenue
Oil & Gas Services $ 1,427 $ 1,499 $ 1,223 $ 1,045 (11.7)%
SAR, Fixed Wing & Other 89 228 407 425 86.9%
Net Revenue $ 1,516 $ 1,727 $ 1,630 $ 1,470 (1.2)%
% Change 13.9% (5.6)% (9.8)%
EBITDAR $ 434 $ 474 $ 417 $ 351 (8.1)%
Net Debt / EBITDAR 1.47x 1.60x 2.48x 3.20x 36.5%
EBITDA $ 328 $ 309 $ 206 $ 144 (28.0)%
Net Debt / EBITDA 1.94x 2.46x 5.04x 7.78x 74.2%
% Margins 21.6% 17.9% 12.6% 9.8%
4
Source: Company earnings presentation.
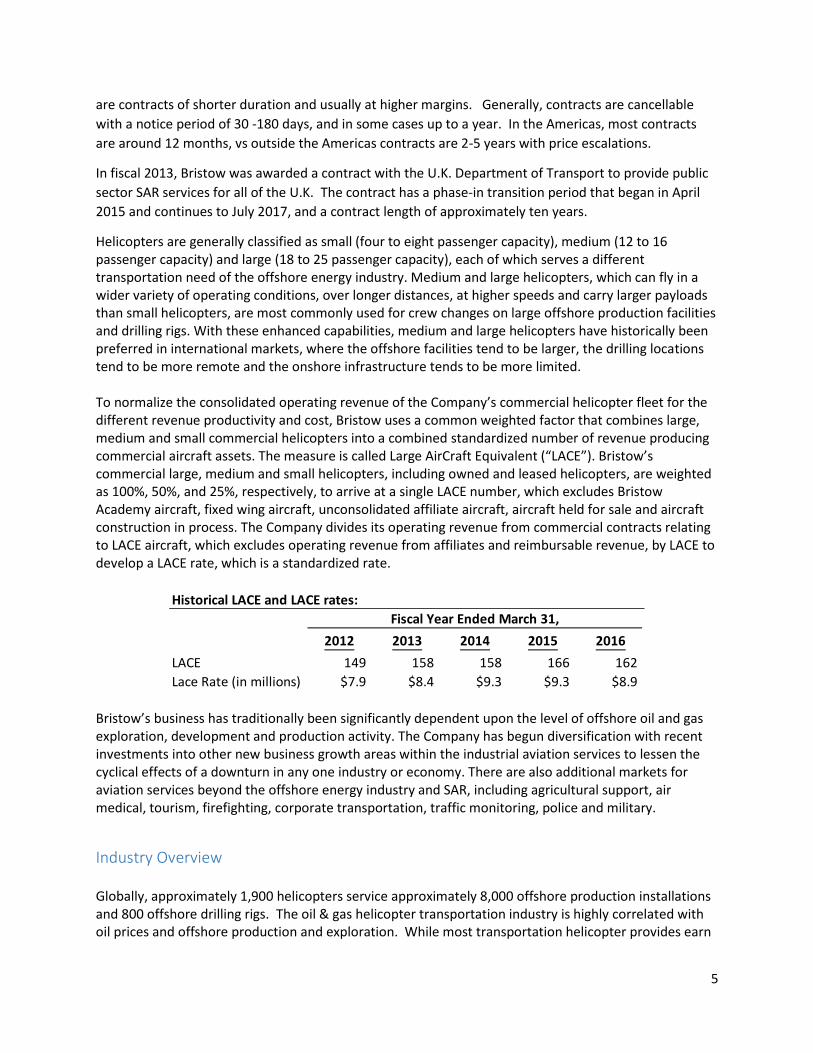
The Company primarily provides industrial aviation services to a broad base of major integrated,
national and independent offshore energy companies. Clients charter helicopters primarily to transport
personnel between onshore bases and offshore production platforms, drilling rigs and other
installations. To a lesser extent, customers charter helicopters to transport time-sensitive equipment to
these offshore locations.
Helicopter contracts are generally based on a two-tier rate structure consisting of a daily or monthly
fixed fee plus additional fees for each hour flown. For oil & gas helicopter revenue, fixed fees represent
65% of revenue and variable fees represent 35%. The Company also provides “ad hoc” services which
Top 10 Customers
Fiscal Year Ended March 31,
Client Name 2014 2015 2016
Chevron 13.2% 11.7% 11.4%
U.K. Department for Transport 2.3% 2.6% 10.3%
ConocoPhillips 8.8% 9.3% 7.6%
BP 6.5% 7.7% 6.5%
IAC 7.9% 7.7% 5.6%
Inpex 0.0% 2.3% 4.7%
Statoil 5.9% 4.7% 3.7%
Cougar 3.8% 3.3% 3.6%
ExxonMobile 3.3% 3.6% 3.5%
ENI 3.7% 3.4% 3.1%
Total 55.4% 56.3% 60.0%
5
are contracts of shorter duration and usually at higher margins. Generally, contracts are cancellable
with a notice period of 30 -180 days, and in some cases up to a year. In the Americas, most contracts
are around 12 months, vs outside the Americas contracts are 2-5 years with price escalations.
In fiscal 2013, Bristow was awarded a contract with the U.K. Department of Transport to provide public
sector SAR services for all of the U.K. The contract has a phase-in transition period that began in April
2015 and continues to July 2017, and a contract length of approximately ten years.
Helicopters are generally classified as small (four to eight passenger capacity), medium (12 to 16 passenger capacity) and large (18 to 25 passenger capacity), each of which serves a different transportation need of the offshore energy industry. Medium and large helicopters, which can fly in a wider variety of operating conditions, over longer distances, at higher speeds and carry larger payloads than small helicopters, are most commonly used for crew changes on large offshore production facilities and drilling rigs. With these enhanced capabilities, medium and large helicopters have historically been preferred in international markets, where the offshore facilities tend to be larger, the drilling locations tend to be more remote and the onshore infrastructure tends to be more limited. To normalize the consolidated operating revenue of the Company’s commercial helicopter fleet for the different revenue productivity and cost, Bristow uses a common weighted factor that combines large, medium and small commercial helicopters into a combined standardized number of revenue producing commercial aircraft assets. The measure is called Large AirCraft Equivalent (“LACE”). Bristow’s commercial large, medium and small helicopters, including owned and leased helicopters, are weighted as 100%, 50%, and 25%, respectively, to arrive at a single LACE number, which excludes Bristow Academy aircraft, fixed wing aircraft, unconsolidated affiliate aircraft, aircraft held for sale and aircraft construction in process. The Company divides its operating revenue from commercial contracts relating to LACE aircraft, which excludes operating revenue from affiliates and reimbursable revenue, by LACE to develop a LACE rate, which is a standardized rate.
Bristow’s business has traditionally been significantly dependent upon the level of offshore oil and gas exploration, development and production activity. The Company has begun diversification with recent investments into other new business growth areas within the industrial aviation services to lessen the cyclical effects of a downturn in any one industry or economy. There are also additional markets for aviation services beyond the offshore energy industry and SAR, including agricultural support, air medical, tourism, firefighting, corporate transportation, traffic monitoring, police and military.
Industry Overview Globally, approximately 1,900 helicopters service approximately 8,000 offshore production installations and 800 offshore drilling rigs. The oil & gas helicopter transportation industry is highly correlated with oil prices and offshore production and exploration. While most transportation helicopter provides earn
Historical LACE and LACE rates:
Fiscal Year Ended March 31,
2012 2013 2014 2015 2016
LACE 149 158 158 166 162
Lace Rate (in millions) $7.9 $8.4 $9.3 $9.3 $8.9
6
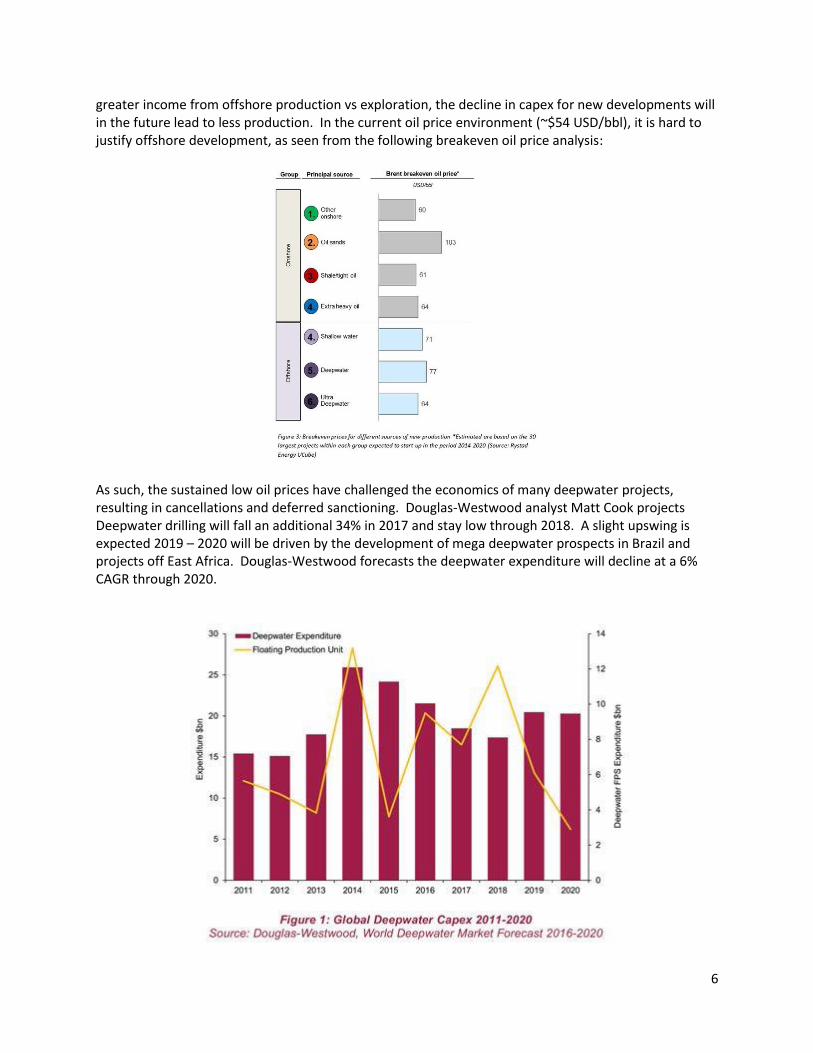
greater income from offshore production vs exploration, the decline in capex for new developments will in the future lead to less production. In the current oil price environment (~$54 USD/bbl), it is hard to justify offshore development, as seen from the following breakeven oil price analysis:
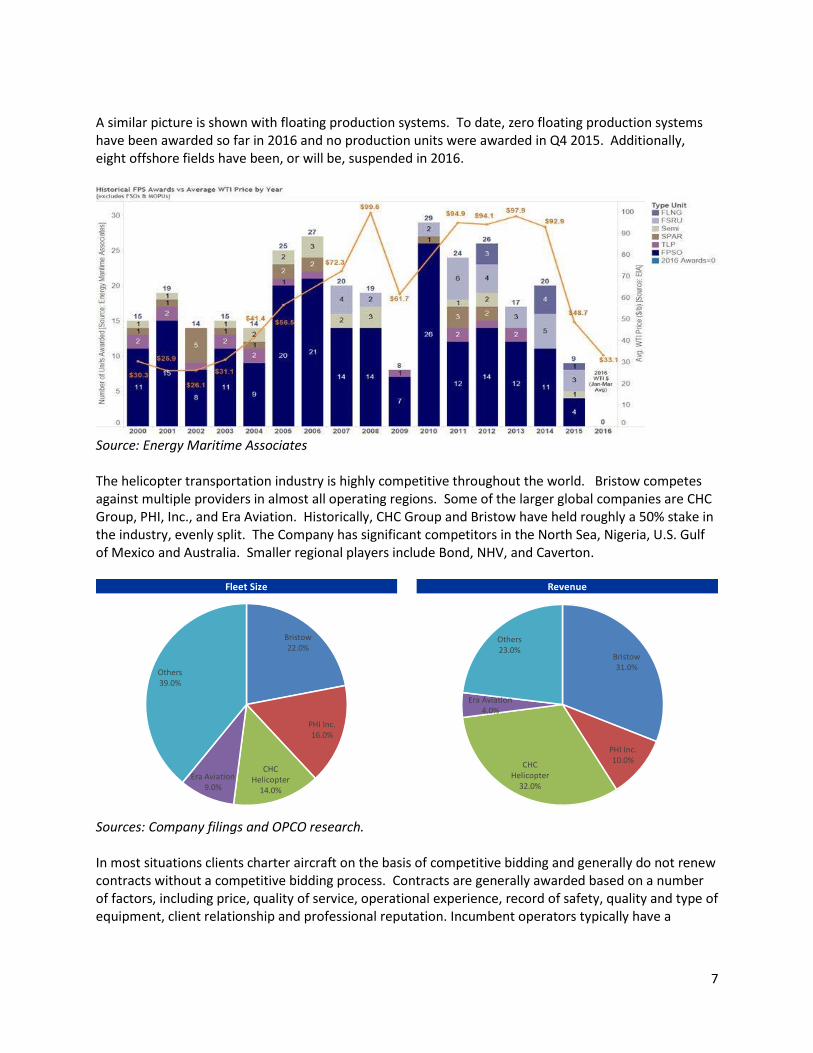
As such, the sustained low oil prices have challenged the economics of many deepwater projects, resulting in cancellations and deferred sanctioning. Douglas-Westwood analyst Matt Cook projects Deepwater drilling will fall an additional 34% in 2017 and stay low through 2018. A slight upswing is expected 2019 – 2020 will be driven by the development of mega deepwater prospects in Brazil and projects off East Africa. Douglas-Westwood forecasts the deepwater expenditure will decline at a 6% CAGR through 2020.
7
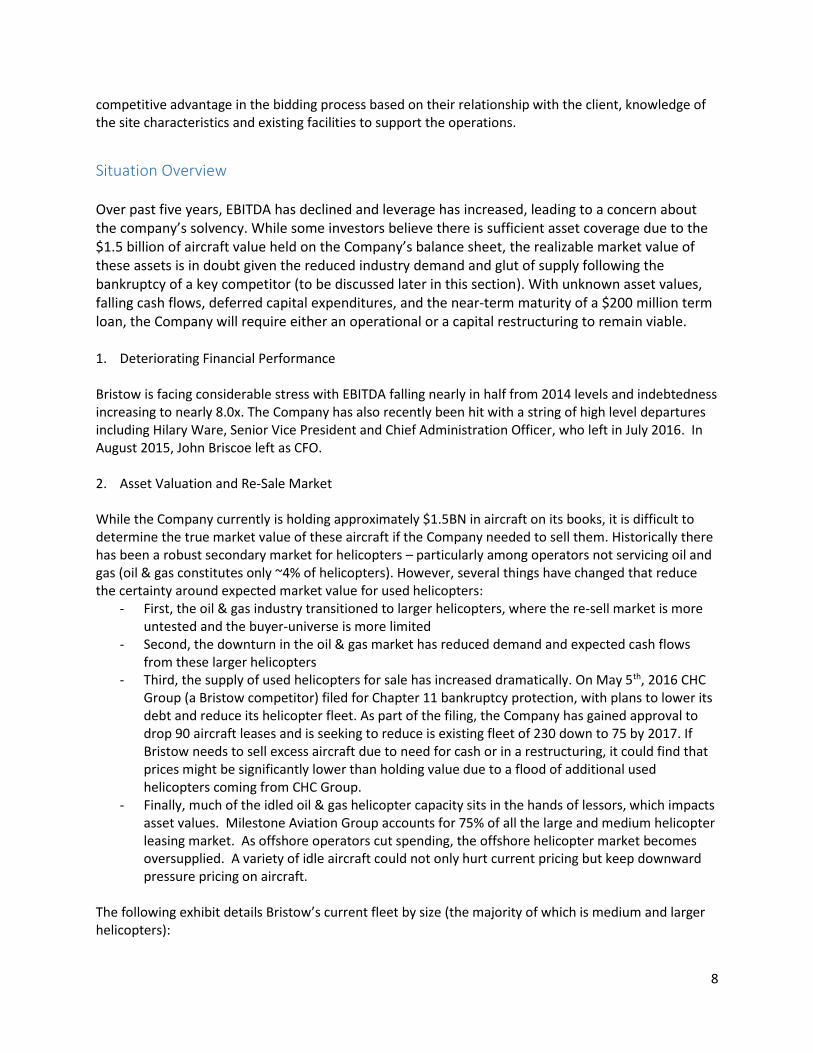
A similar picture is shown with floating production systems. To date, zero floating production systems have been awarded so far in 2016 and no production units were awarded in Q4 2015. Additionally, eight offshore fields have been, or will be, suspended in 2016.
Source: Energy Maritime Associates The helicopter transportation industry is highly competitive throughout the world. Bristow competes against multiple providers in almost all operating regions. Some of the larger global companies are CHC Group, PHI, Inc., and Era Aviation. Historically, CHC Group and Bristow have held roughly a 50% stake in the industry, evenly split. The Company has significant competitors in the North Sea, Nigeria, U.S. Gulf of Mexico and Australia. Smaller regional players include Bond, NHV, and Caverton.
Sources: Company filings and OPCO research. In most situations clients charter aircraft on the basis of competitive bidding and generally do not renew contracts without a competitive bidding process. Contracts are generally awarded based on a number of factors, including price, quality of service, operational experience, record of safety, quality and type of equipment, client relationship and professional reputation. Incumbent operators typically have a
Fleet Size Revenue
Bristow22.0%
PHI Inc.16.0%
CHC Helicopter
14.0%
Era Aviation9.0%
Others39.0%
Bristow31.0%
PHI Inc.10.0%
CHC Helicopter
32.0%
Era Aviation4.0%
Others23.0%
8
competitive advantage in the bidding process based on their relationship with the client, knowledge of the site characteristics and existing facilities to support the operations.
Situation Overview Over past five years, EBITDA has declined and leverage has increased, leading to a concern about the company’s solvency. While some investors believe there is sufficient asset coverage due to the $1.5 billion of aircraft value held on the Company’s balance sheet, the realizable market value of these assets is in doubt given the reduced industry demand and glut of supply following the bankruptcy of a key competitor (to be discussed later in this section). With unknown asset values, falling cash flows, deferred capital expenditures, and the near-term maturity of a $200 million term loan, the Company will require either an operational or a capital restructuring to remain viable. 1. Deteriorating Financial Performance
Bristow is facing considerable stress with EBITDA falling nearly in half from 2014 levels and indebtedness increasing to nearly 8.0x. The Company has also recently been hit with a string of high level departures including Hilary Ware, Senior Vice President and Chief Administration Officer, who left in July 2016. In August 2015, John Briscoe left as CFO. 2. Asset Valuation and Re-Sale Market While the Company currently is holding approximately $1.5BN in aircraft on its books, it is difficult to determine the true market value of these aircraft if the Company needed to sell them. Historically there has been a robust secondary market for helicopters – particularly among operators not servicing oil and gas (oil & gas constitutes only ~4% of helicopters). However, several things have changed that reduce the certainty around expected market value for used helicopters:
- First, the oil & gas industry transitioned to larger helicopters, where the re-sell market is more untested and the buyer-universe is more limited
- Second, the downturn in the oil & gas market has reduced demand and expected cash flows from these larger helicopters
- Third, the supply of used helicopters for sale has increased dramatically. On May 5th, 2016 CHC Group (a Bristow competitor) filed for Chapter 11 bankruptcy protection, with plans to lower its debt and reduce its helicopter fleet. As part of the filing, the Company has gained approval to drop 90 aircraft leases and is seeking to reduce is existing fleet of 230 down to 75 by 2017. If Bristow needs to sell excess aircraft due to need for cash or in a restructuring, it could find that prices might be significantly lower than holding value due to a flood of additional used helicopters coming from CHC Group.
- Finally, much of the idled oil & gas helicopter capacity sits in the hands of lessors, which impacts asset values. Milestone Aviation Group accounts for 75% of all the large and medium helicopter leasing market. As offshore operators cut spending, the offshore helicopter market becomes oversupplied. A variety of idle aircraft could not only hurt current pricing but keep downward pressure pricing on aircraft.
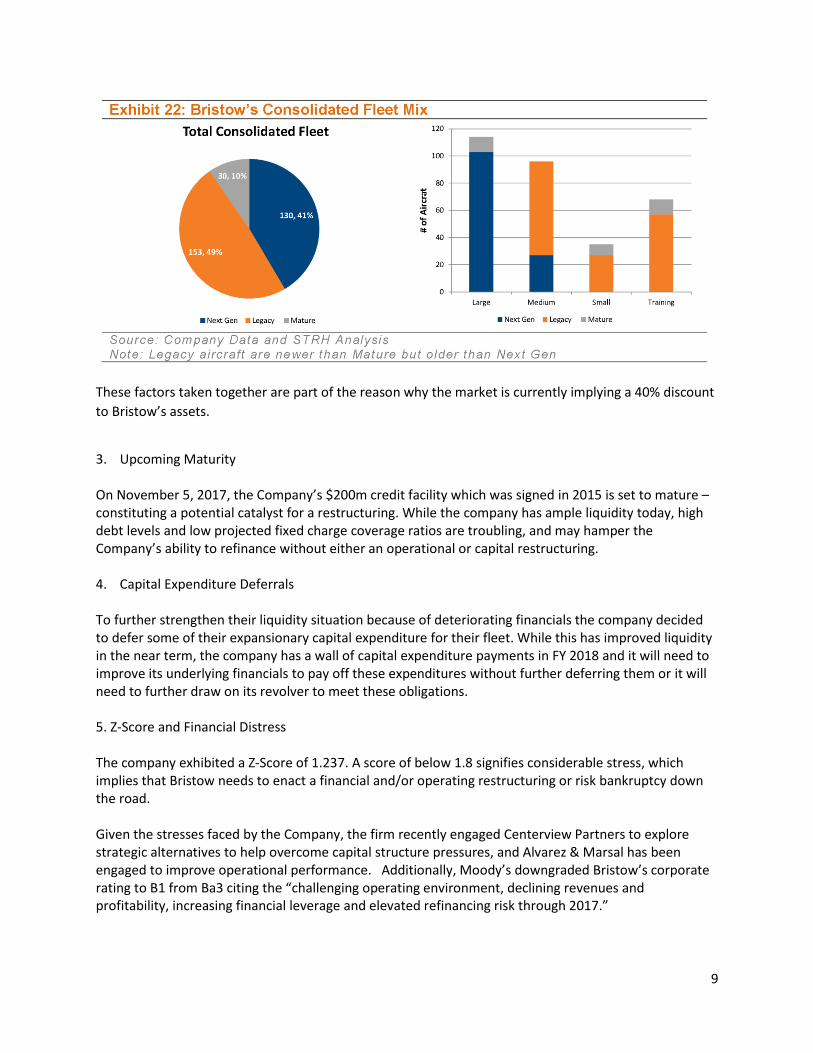
The following exhibit details Bristow’s current fleet by size (the majority of which is medium and larger helicopters):
9
These factors taken together are part of the reason why the market is currently implying a 40% discount
to Bristow’s assets.
3. Upcoming Maturity On November 5, 2017, the Company’s $200m credit facility which was signed in 2015 is set to mature – constituting a potential catalyst for a restructuring. While the company has ample liquidity today, high debt levels and low projected fixed charge coverage ratios are troubling, and may hamper the Company’s ability to refinance without either an operational or capital restructuring. 4. Capital Expenditure Deferrals To further strengthen their liquidity situation because of deteriorating financials the company decided to defer some of their expansionary capital expenditure for their fleet. While this has improved liquidity in the near term, the company has a wall of capital expenditure payments in FY 2018 and it will need to improve its underlying financials to pay off these expenditures without further deferring them or it will need to further draw on its revolver to meet these obligations. 5. Z-Score and Financial Distress The company exhibited a Z-Score of 1.237. A score of below 1.8 signifies considerable stress, which implies that Bristow needs to enact a financial and/or operating restructuring or risk bankruptcy down the road. Given the stresses faced by the Company, the firm recently engaged Centerview Partners to explore strategic alternatives to help overcome capital structure pressures, and Alvarez & Marsal has been engaged to improve operational performance. Additionally, Moody’s downgraded Bristow’s corporate rating to B1 from Ba3 citing the “challenging operating environment, declining revenues and profitability, increasing financial leverage and elevated refinancing risk through 2017.”
10
Review of Classes / Claims / Liabilities
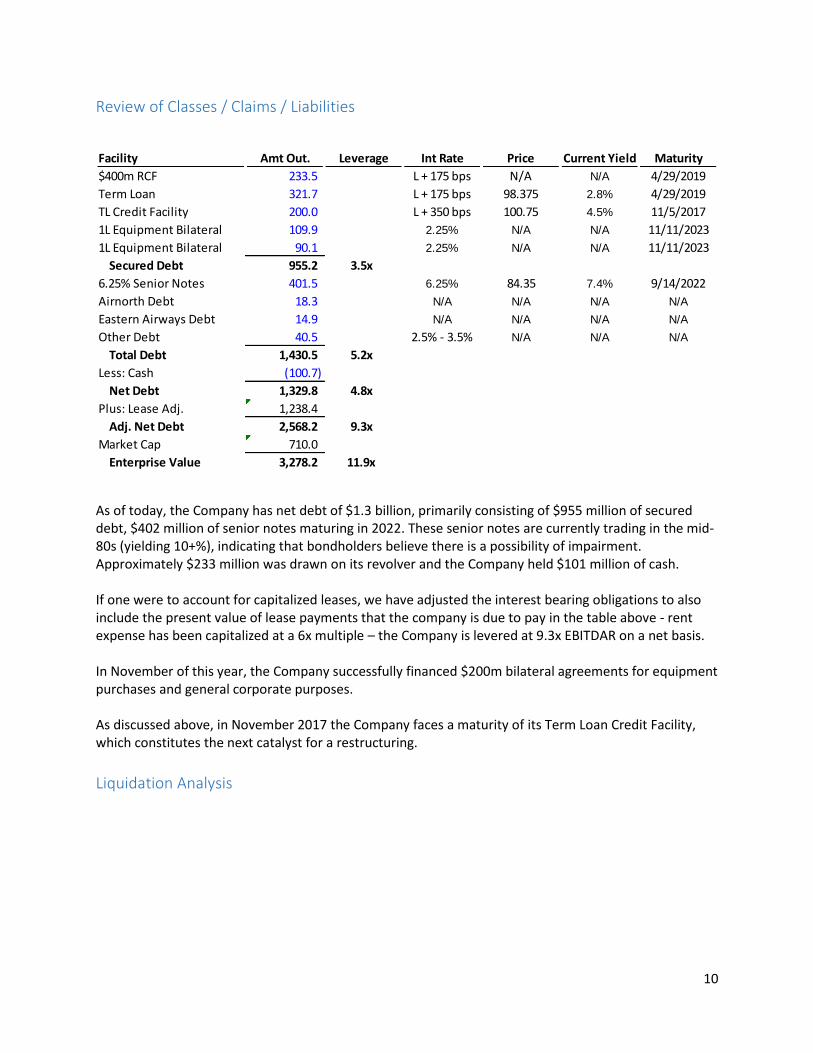
As of today, the Company has net debt of $1.3 billion, primarily consisting of $955 million of secured debt, $402 million of senior notes maturing in 2022. These senior notes are currently trading in the mid-80s (yielding 10+%), indicating that bondholders believe there is a possibility of impairment. Approximately $233 million was drawn on its revolver and the Company held $101 million of cash. If one were to account for capitalized leases, we have adjusted the interest bearing obligations to also include the present value of lease payments that the company is due to pay in the table above - rent expense has been capitalized at a 6x multiple – the Company is levered at 9.3x EBITDAR on a net basis. In November of this year, the Company successfully financed $200m bilateral agreements for equipment purchases and general corporate purposes. As discussed above, in November 2017 the Company faces a maturity of its Term Loan Credit Facility, which constitutes the next catalyst for a restructuring.
Liquidation Analysis
Facility Amt Out. Leverage Int Rate Price Current Yield Maturity
$400m RCF 233.5 L + 175 bps N/A N/A 4/29/2019
Term Loan 321.7 L + 175 bps 98.375 2.8% 4/29/2019
TL Credit Facility 200.0 L + 350 bps 100.75 4.5% 11/5/2017
1L Equipment Bilateral 109.9 2.25% N/A N/A 11/11/2023
1L Equipment Bilateral 90.1 2.25% N/A N/A 11/11/2023
Secured Debt 955.2 3.5x
6.25% Senior Notes 401.5 6.25% 84.35 7.4% 9/14/2022
Airnorth Debt 18.3 N/A N/A N/A N/A
Eastern Airways Debt 14.9 N/A N/A N/A N/A
Other Debt 40.5 2.5% - 3.5% N/A N/A N/A
Total Debt 1,430.5 5.2x
Less: Cash (100.7)
Net Debt 1,329.8 4.8x
Plus: Lease Adj. 1,238.4
Adj. Net Debt 2,568.2 9.3x
Market Cap 710.0
Enterprise Value 3,278.2 11.9x
11
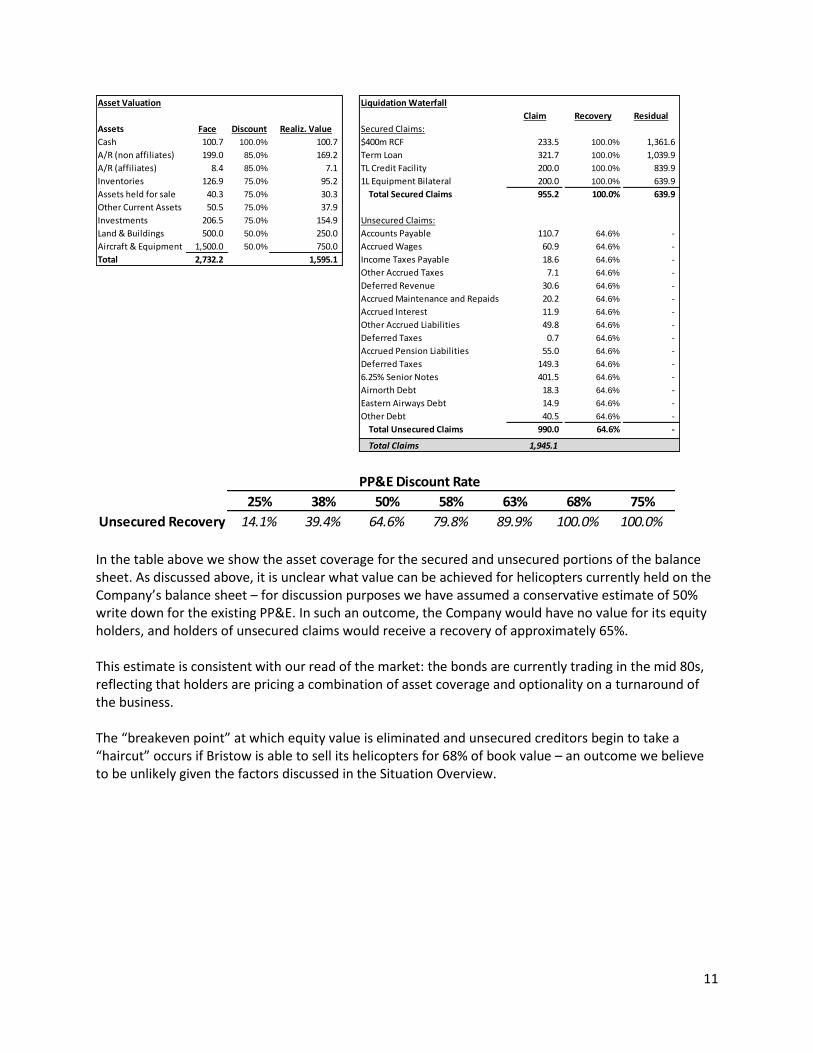
In the table above we show the asset coverage for the secured and unsecured portions of the balance sheet. As discussed above, it is unclear what value can be achieved for helicopters currently held on the Company’s balance sheet – for discussion purposes we have assumed a conservative estimate of 50% write down for the existing PP&E. In such an outcome, the Company would have no value for its equity holders, and holders of unsecured claims would receive a recovery of approximately 65%. This estimate is consistent with our read of the market: the bonds are currently trading in the mid 80s, reflecting that holders are pricing a combination of asset coverage and optionality on a turnaround of the business. The “breakeven point” at which equity value is eliminated and unsecured creditors begin to take a “haircut” occurs if Bristow is able to sell its helicopters for 68% of book value – an outcome we believe to be unlikely given the factors discussed in the Situation Overview.
Asset Valuation Liquidation Waterfall
Claim Recovery Residual
Assets Face Discount Realiz. Value Secured Claims:
Cash 100.7 100.0% 100.7 $400m RCF 233.5 100.0% 1,361.6
A/R (non affiliates) 199.0 85.0% 169.2 Term Loan 321.7 100.0% 1,039.9
A/R (affiliates) 8.4 85.0% 7.1 TL Credit Facility 200.0 100.0% 839.9
Inventories 126.9 75.0% 95.2 1L Equipment Bilateral 200.0 100.0% 639.9
Assets held for sale 40.3 75.0% 30.3 Total Secured Claims 955.2 100.0% 639.9
Other Current Assets 50.5 75.0% 37.9
Investments 206.5 75.0% 154.9 Unsecured Claims:
Land & Buildings 500.0 50.0% 250.0 Accounts Payable 110.7 64.6% -
Aircraft & Equipment 1,500.0 50.0% 750.0 Accrued Wages 60.9 64.6% -
Total 2,732.2 1,595.1 Income Taxes Payable 18.6 64.6% -
Other Accrued Taxes 7.1 64.6% -
Deferred Revenue 30.6 64.6% -
Accrued Maintenance and Repaids 20.2 64.6% -
Accrued Interest 11.9 64.6% -
Other Accrued Liabilities 49.8 64.6% -
Deferred Taxes 0.7 64.6% -
Accrued Pension Liabilities 55.0 64.6% -
Deferred Taxes 149.3 64.6% -
6.25% Senior Notes 401.5 64.6% -
Airnorth Debt 18.3 64.6% -
Eastern Airways Debt 14.9 64.6% -
Other Debt 40.5 64.6% -
Total Unsecured Claims 990.0 64.6% -
Total Claims 1,945.1
PP&E Discount Rate
25% 38% 50% 58% 63% 68% 75%
Unsecured Recovery 14.1% 39.4% 64.6% 79.8% 89.9% 100.0% 100.0%
12
Comp Valuation
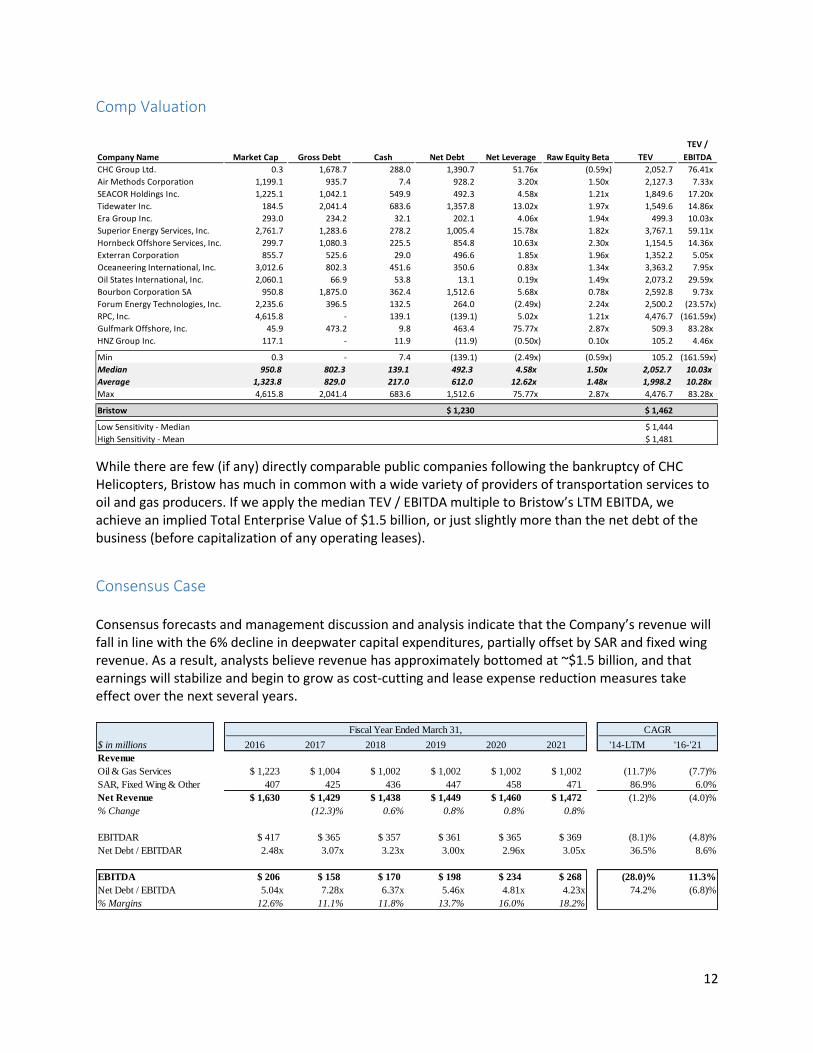
While there are few (if any) directly comparable public companies following the bankruptcy of CHC Helicopters, Bristow has much in common with a wide variety of providers of transportation services to oil and gas producers. If we apply the median TEV / EBITDA multiple to Bristow’s LTM EBITDA, we achieve an implied Total Enterprise Value of $1.5 billion, or just slightly more than the net debt of the business (before capitalization of any operating leases).
Consensus Case Consensus forecasts and management discussion and analysis indicate that the Company’s revenue will fall in line with the 6% decline in deepwater capital expenditures, partially offset by SAR and fixed wing revenue. As a result, analysts believe revenue has approximately bottomed at ~$1.5 billion, and that earnings will stabilize and begin to grow as cost-cutting and lease expense reduction measures take effect over the next several years.
TEV /
Company Name Market Cap Gross Debt Cash Net Debt Net Leverage Raw Equity Beta TEV EBITDA
CHC Group Ltd. 0.3 1,678.7 288.0 1,390.7 51.76x (0.59x) 2,052.7 76.41x
Air Methods Corporation 1,199.1 935.7 7.4 928.2 3.20x 1.50x 2,127.3 7.33x
SEACOR Holdings Inc. 1,225.1 1,042.1 549.9 492.3 4.58x 1.21x 1,849.6 17.20x
Tidewater Inc. 184.5 2,041.4 683.6 1,357.8 13.02x 1.97x 1,549.6 14.86x
Era Group Inc. 293.0 234.2 32.1 202.1 4.06x 1.94x 499.3 10.03x
Superior Energy Services, Inc. 2,761.7 1,283.6 278.2 1,005.4 15.78x 1.82x 3,767.1 59.11x
Hornbeck Offshore Services, Inc. 299.7 1,080.3 225.5 854.8 10.63x 2.30x 1,154.5 14.36x
Exterran Corporation 855.7 525.6 29.0 496.6 1.85x 1.96x 1,352.2 5.05x
Oceaneering International, Inc. 3,012.6 802.3 451.6 350.6 0.83x 1.34x 3,363.2 7.95x
Oil States International, Inc. 2,060.1 66.9 53.8 13.1 0.19x 1.49x 2,073.2 29.59x
Bourbon Corporation SA 950.8 1,875.0 362.4 1,512.6 5.68x 0.78x 2,592.8 9.73x
Forum Energy Technologies, Inc. 2,235.6 396.5 132.5 264.0 (2.49x) 2.24x 2,500.2 (23.57x)
RPC, Inc. 4,615.8 - 139.1 (139.1) 5.02x 1.21x 4,476.7 (161.59x)
Gulfmark Offshore, Inc. 45.9 473.2 9.8 463.4 75.77x 2.87x 509.3 83.28x
HNZ Group Inc. 117.1 - 11.9 (11.9) (0.50x) 0.10x 105.2 4.46x
Min 0.3 - 7.4 (139.1) (2.49x) (0.59x) 105.2 (161.59x)
Median 950.8 802.3 139.1 492.3 4.58x 1.50x 2,052.7 10.03x
Average 1,323.8 829.0 217.0 612.0 12.62x 1.48x 1,998.2 10.28x
Max 4,615.8 2,041.4 683.6 1,512.6 75.77x 2.87x 4,476.7 83.28x
Bristow $ 1,230 $ 1,462
Low Sensitivity - Median $ 1,444
High Sensitivity - Mean $ 1,481
Fiscal Year Ended March 31, CAGR
$ in millions 2016 2017 2018 2019 2020 2021 '14-LTM '16-'21
Revenue
Oil & Gas Services $ 1,223 $ 1,004 $ 1,002 $ 1,002 $ 1,002 $ 1,002 (11.7)% (7.7)%
SAR, Fixed Wing & Other 407 425 436 447 458 471 86.9% 6.0%
Net Revenue $ 1,630 $ 1,429 $ 1,438 $ 1,449 $ 1,460 $ 1,472 (1.2)% (4.0)%
% Change (12.3)% 0.6% 0.8% 0.8% 0.8%
EBITDAR $ 417 $ 365 $ 357 $ 361 $ 365 $ 369 (8.1)% (4.8)%
Net Debt / EBITDAR 2.48x 3.07x 3.23x 3.00x 2.96x 3.05x 36.5% 8.6%
EBITDA $ 206 $ 158 $ 170 $ 198 $ 234 $ 268 (28.0)% 11.3%
Net Debt / EBITDA 5.04x 7.28x 6.37x 5.46x 4.81x 4.23x 74.2% (6.8)%
% Margins 12.6% 11.1% 11.8% 13.7% 16.0% 18.2%
13
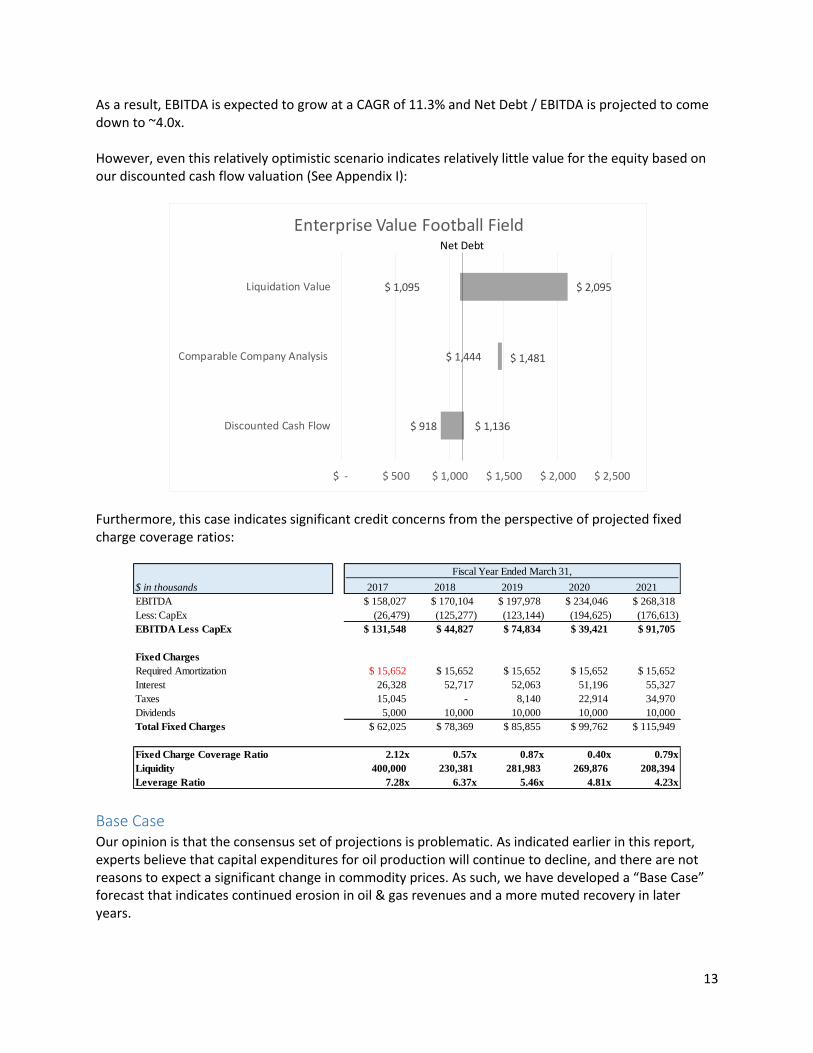
As a result, EBITDA is expected to grow at a CAGR of 11.3% and Net Debt / EBITDA is projected to come down to ~4.0x. However, even this relatively optimistic scenario indicates relatively little value for the equity based on our discounted cash flow valuation (See Appendix I):
Furthermore, this case indicates significant credit concerns from the perspective of projected fixed charge coverage ratios:
Base Case Our opinion is that the consensus set of projections is problematic. As indicated earlier in this report, experts believe that capital expenditures for oil production will continue to decline, and there are not reasons to expect a significant change in commodity prices. As such, we have developed a “Base Case” forecast that indicates continued erosion in oil & gas revenues and a more muted recovery in later years.
$ 918
$ 1,444
$ 1,095
$ 1,136
$ 1,481
$ 2,095
$ - $ 500 $ 1,000 $ 1,500 $ 2,000 $ 2,500
Discounted Cash Flow
Comparable Company Analysis
Liquidation Value
Enterprise Value Football FieldNet Debt
Fiscal Year Ended March 31,
$ in thousands 2017 2018 2019 2020 2021
EBITDA $ 158,027 $ 170,104 $ 197,978 $ 234,046 $ 268,318
Less: CapEx (26,479) (125,277) (123,144) (194,625) (176,613)
EBITDA Less CapEx $ 131,548 $ 44,827 $ 74,834 $ 39,421 $ 91,705
Fixed Charges
Required Amortization $ 15,652 $ 15,652 $ 15,652 $ 15,652 $ 15,652
Interest 26,328 52,717 52,063 51,196 55,327
Taxes 15,045 - 8,140 22,914 34,970
Dividends 5,000 10,000 10,000 10,000 10,000
Total Fixed Charges $ 62,025 $ 78,369 $ 85,855 $ 99,762 $ 115,949
Fixed Charge Coverage Ratio 2.12x 0.57x 0.87x 0.40x 0.79x
Liquidity 400,000 230,381 281,983 269,876 208,394
Leverage Ratio 7.28x 6.37x 5.46x 4.81x 4.23x
14
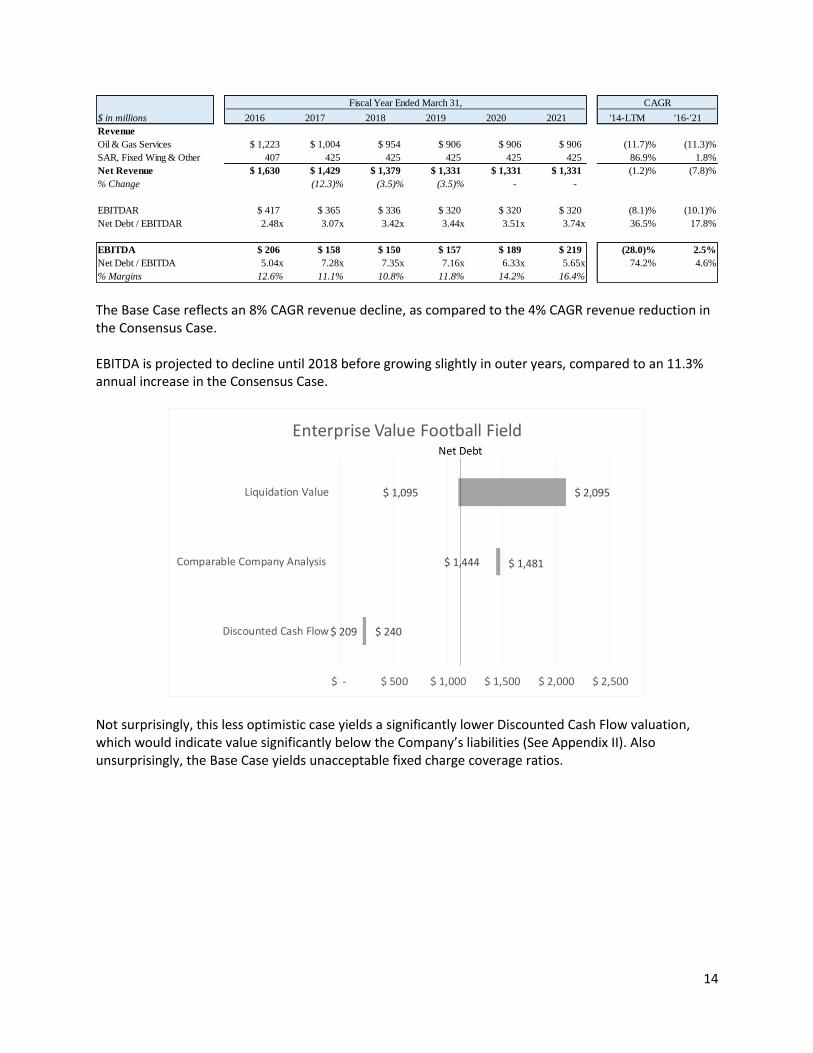
The Base Case reflects an 8% CAGR revenue decline, as compared to the 4% CAGR revenue reduction in the Consensus Case. EBITDA is projected to decline until 2018 before growing slightly in outer years, compared to an 11.3% annual increase in the Consensus Case.
Not surprisingly, this less optimistic case yields a significantly lower Discounted Cash Flow valuation, which would indicate value significantly below the Company’s liabilities (See Appendix II). Also unsurprisingly, the Base Case yields unacceptable fixed charge coverage ratios.
Fiscal Year Ended March 31, CAGR
$ in millions 2016 2017 2018 2019 2020 2021 '14-LTM '16-'21
Revenue
Oil & Gas Services $ 1,223 $ 1,004 $ 954 $ 906 $ 906 $ 906 (11.7)% (11.3)%
SAR, Fixed Wing & Other 407 425 425 425 425 425 86.9% 1.8%
Net Revenue $ 1,630 $ 1,429 $ 1,379 $ 1,331 $ 1,331 $ 1,331 (1.2)% (7.8)%
% Change (12.3)% (3.5)% (3.5)% - -
EBITDAR $ 417 $ 365 $ 336 $ 320 $ 320 $ 320 (8.1)% (10.1)%
Net Debt / EBITDAR 2.48x 3.07x 3.42x 3.44x 3.51x 3.74x 36.5% 17.8%
EBITDA $ 206 $ 158 $ 150 $ 157 $ 189 $ 219 (28.0)% 2.5%
Net Debt / EBITDA 5.04x 7.28x 7.35x 7.16x 6.33x 5.65x 74.2% 4.6%
% Margins 12.6% 11.1% 10.8% 11.8% 14.2% 16.4%
$ 209
$ 1,444
$ 1,095
$ 240
$ 1,481
$ 2,095
$ - $ 500 $ 1,000 $ 1,500 $ 2,000 $ 2,500
Discounted Cash Flow
Comparable Company Analysis
Liquidation Value
Enterprise Value Football FieldNet Debt
15
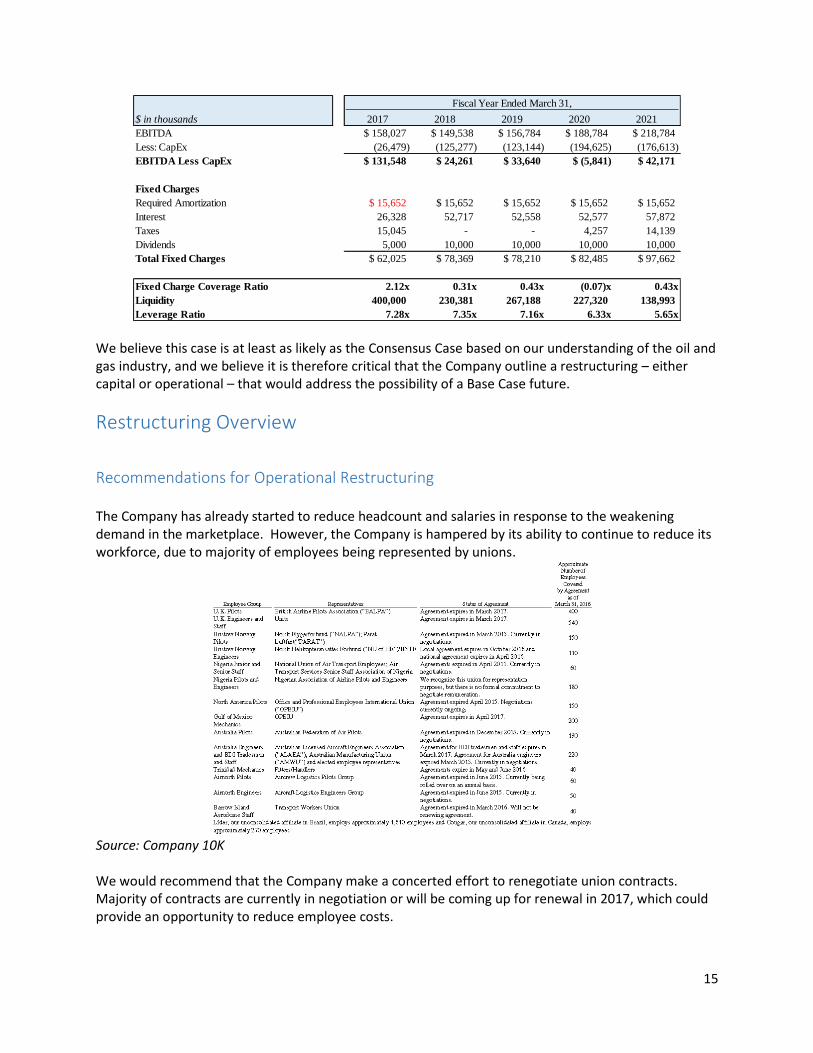
We believe this case is at least as likely as the Consensus Case based on our understanding of the oil and gas industry, and we believe it is therefore critical that the Company outline a restructuring – either capital or operational – that would address the possibility of a Base Case future.
Restructuring Overview
Recommendations for Operational Restructuring The Company has already started to reduce headcount and salaries in response to the weakening demand in the marketplace. However, the Company is hampered by its ability to continue to reduce its workforce, due to majority of employees being represented by unions.
Source: Company 10K We would recommend that the Company make a concerted effort to renegotiate union contracts. Majority of contracts are currently in negotiation or will be coming up for renewal in 2017, which could provide an opportunity to reduce employee costs.
Fiscal Year Ended March 31,
$ in thousands 2017 2018 2019 2020 2021
EBITDA $ 158,027 $ 149,538 $ 156,784 $ 188,784 $ 218,784
Less: CapEx (26,479) (125,277) (123,144) (194,625) (176,613)
EBITDA Less CapEx $ 131,548 $ 24,261 $ 33,640 $ (5,841) $ 42,171
Fixed Charges
Required Amortization $ 15,652 $ 15,652 $ 15,652 $ 15,652 $ 15,652
Interest 26,328 52,717 52,558 52,577 57,872
Taxes 15,045 - - 4,257 14,139
Dividends 5,000 10,000 10,000 10,000 10,000
Total Fixed Charges $ 62,025 $ 78,369 $ 78,210 $ 82,485 $ 97,662
Fixed Charge Coverage Ratio 2.12x 0.31x 0.43x (0.07)x 0.43x
Liquidity 400,000 230,381 267,188 227,320 138,993
Leverage Ratio 7.28x 7.35x 7.16x 6.33x 5.65x
16
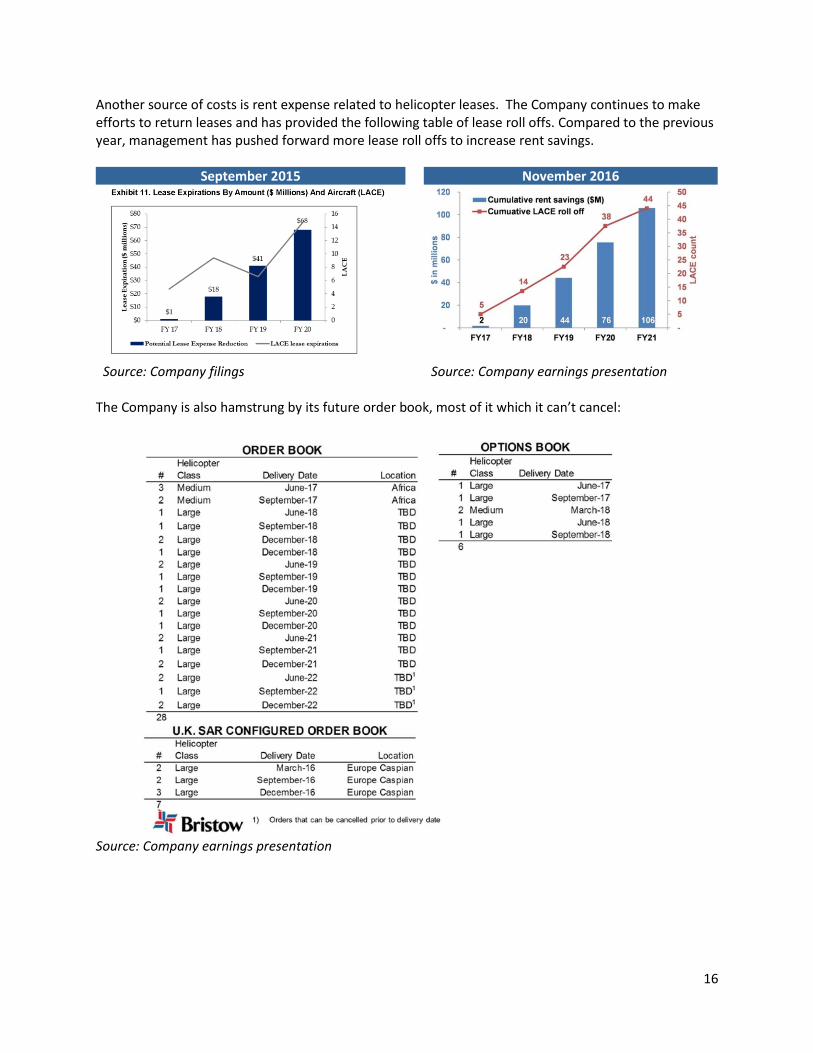
Another source of costs is rent expense related to helicopter leases. The Company continues to make efforts to return leases and has provided the following table of lease roll offs. Compared to the previous year, management has pushed forward more lease roll offs to increase rent savings.
September 2015 November 2016
Source: Company filings Source: Company earnings presentation The Company is also hamstrung by its future order book, most of it which it can’t cancel:
Source: Company earnings presentation
17
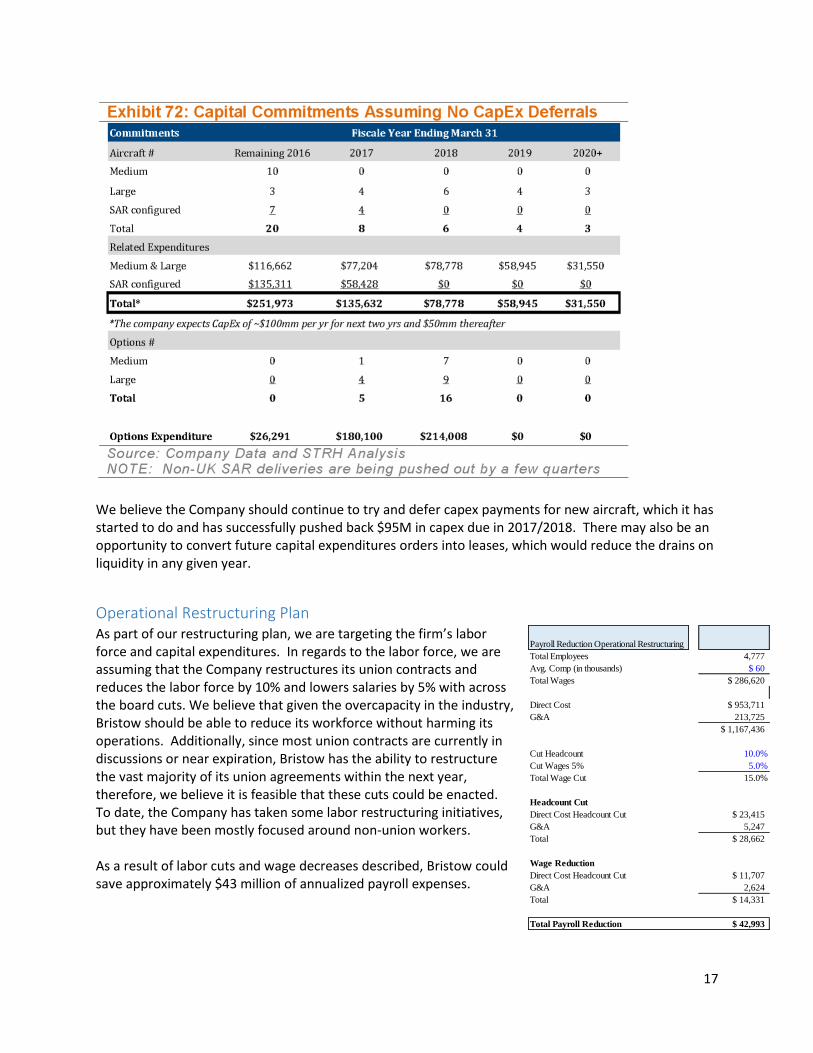
We believe the Company should continue to try and defer capex payments for new aircraft, which it has started to do and has successfully pushed back $95M in capex due in 2017/2018. There may also be an opportunity to convert future capital expenditures orders into leases, which would reduce the drains on liquidity in any given year.
Operational Restructuring Plan As part of our restructuring plan, we are targeting the firm’s labor force and capital expenditures. In regards to the labor force, we are assuming that the Company restructures its union contracts and reduces the labor force by 10% and lowers salaries by 5% with across the board cuts. We believe that given the overcapacity in the industry, Bristow should be able to reduce its workforce without harming its operations. Additionally, since most union contracts are currently in discussions or near expiration, Bristow has the ability to restructure the vast majority of its union agreements within the next year, therefore, we believe it is feasible that these cuts could be enacted. To date, the Company has taken some labor restructuring initiatives, but they have been mostly focused around non-union workers. As a result of labor cuts and wage decreases described, Bristow could save approximately $43 million of annualized payroll expenses.
Payroll Reduction Operational Restructuring
Total Employees 4,777
Avg. Comp (in thousands) $ 60
Total Wages $ 286,620
Direct Cost $ 953,711
G&A 213,725
$ 1,167,436
Cut Headcount 10.0%
Cut Wages 5% 5.0%
Total Wage Cut 15.0%
Headcount Cut
Direct Cost Headcount Cut $ 23,415
G&A 5,247
Total $ 28,662
Wage Reduction
Direct Cost Headcount Cut $ 11,707
G&A 2,624
Total $ 14,331
Total Payroll Reduction $ 42,993
18
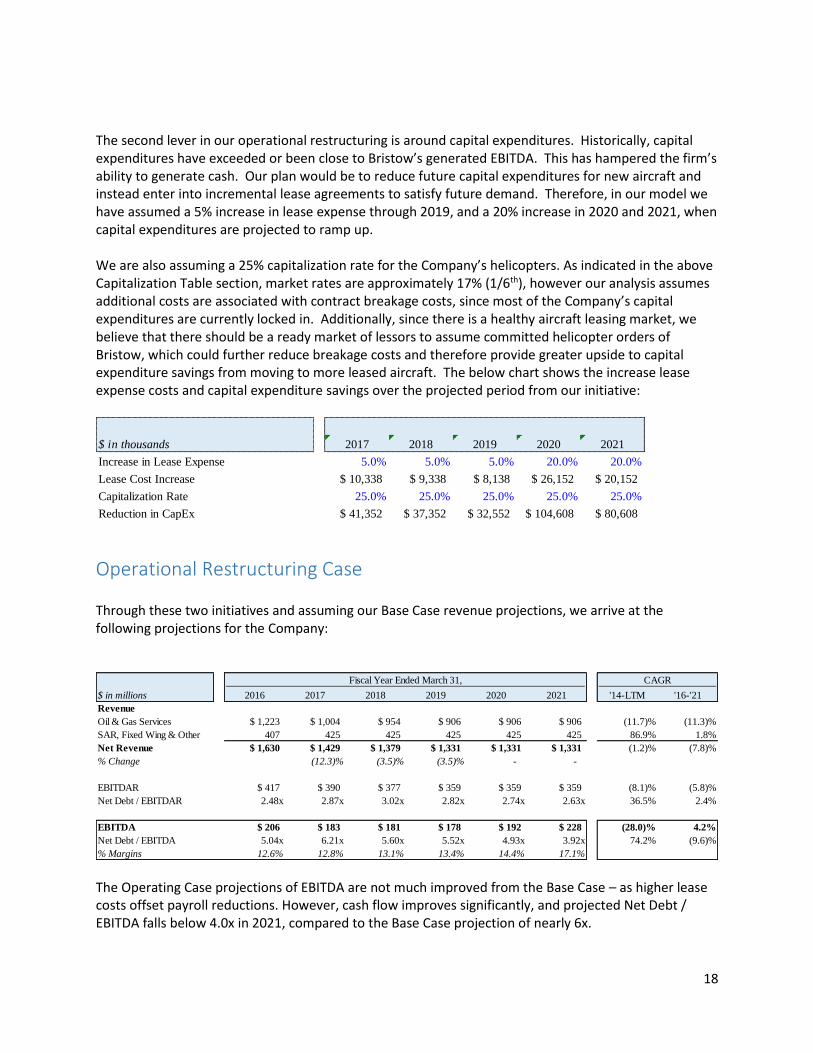
The second lever in our operational restructuring is around capital expenditures. Historically, capital expenditures have exceeded or been close to Bristow’s generated EBITDA. This has hampered the firm’s ability to generate cash. Our plan would be to reduce future capital expenditures for new aircraft and instead enter into incremental lease agreements to satisfy future demand. Therefore, in our model we have assumed a 5% increase in lease expense through 2019, and a 20% increase in 2020 and 2021, when capital expenditures are projected to ramp up. We are also assuming a 25% capitalization rate for the Company’s helicopters. As indicated in the above Capitalization Table section, market rates are approximately 17% (1/6th), however our analysis assumes additional costs are associated with contract breakage costs, since most of the Company’s capital expenditures are currently locked in. Additionally, since there is a healthy aircraft leasing market, we believe that there should be a ready market of lessors to assume committed helicopter orders of Bristow, which could further reduce breakage costs and therefore provide greater upside to capital expenditure savings from moving to more leased aircraft. The below chart shows the increase lease expense costs and capital expenditure savings over the projected period from our initiative:
Operational Restructuring Case Through these two initiatives and assuming our Base Case revenue projections, we arrive at the following projections for the Company:
The Operating Case projections of EBITDA are not much improved from the Base Case – as higher lease costs offset payroll reductions. However, cash flow improves significantly, and projected Net Debt / EBITDA falls below 4.0x in 2021, compared to the Base Case projection of nearly 6x.
$ in thousands 2017 2018 2019 2020 2021
Increase in Lease Expense 5.0% 5.0% 5.0% 20.0% 20.0%
Lease Cost Increase $ 10,338 $ 9,338 $ 8,138 $ 26,152 $ 20,152
Capitalization Rate 25.0% 25.0% 25.0% 25.0% 25.0%
Reduction in CapEx $ 41,352 $ 37,352 $ 32,552 $ 104,608 $ 80,608
Fiscal Year Ended March 31, CAGR
$ in millions 2016 2017 2018 2019 2020 2021 '14-LTM '16-'21
Revenue
Oil & Gas Services $ 1,223 $ 1,004 $ 954 $ 906 $ 906 $ 906 (11.7)% (11.3)%
SAR, Fixed Wing & Other 407 425 425 425 425 425 86.9% 1.8%
Net Revenue $ 1,630 $ 1,429 $ 1,379 $ 1,331 $ 1,331 $ 1,331 (1.2)% (7.8)%
% Change (12.3)% (3.5)% (3.5)% - -
EBITDAR $ 417 $ 390 $ 377 $ 359 $ 359 $ 359 (8.1)% (5.8)%
Net Debt / EBITDAR 2.48x 2.87x 3.02x 2.82x 2.74x 2.63x 36.5% 2.4%
EBITDA $ 206 $ 183 $ 181 $ 178 $ 192 $ 228 (28.0)% 4.2%
Net Debt / EBITDA 5.04x 6.21x 5.60x 5.52x 4.93x 3.92x 74.2% (9.6)%
% Margins 12.6% 12.8% 13.1% 13.4% 14.4% 17.1%
19
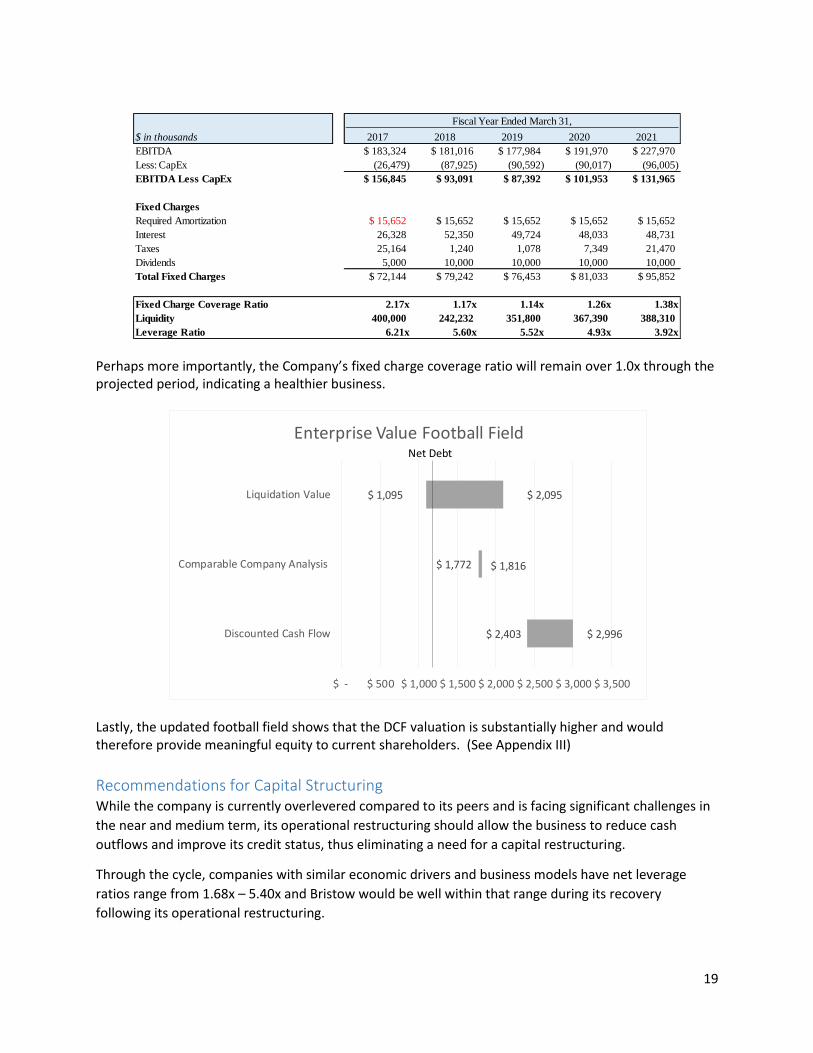
Perhaps more importantly, the Company’s fixed charge coverage ratio will remain over 1.0x through the projected period, indicating a healthier business.
Lastly, the updated football field shows that the DCF valuation is substantially higher and would therefore provide meaningful equity to current shareholders. (See Appendix III)
Recommendations for Capital Structuring While the company is currently overlevered compared to its peers and is facing significant challenges in
the near and medium term, its operational restructuring should allow the business to reduce cash
outflows and improve its credit status, thus eliminating a need for a capital restructuring.
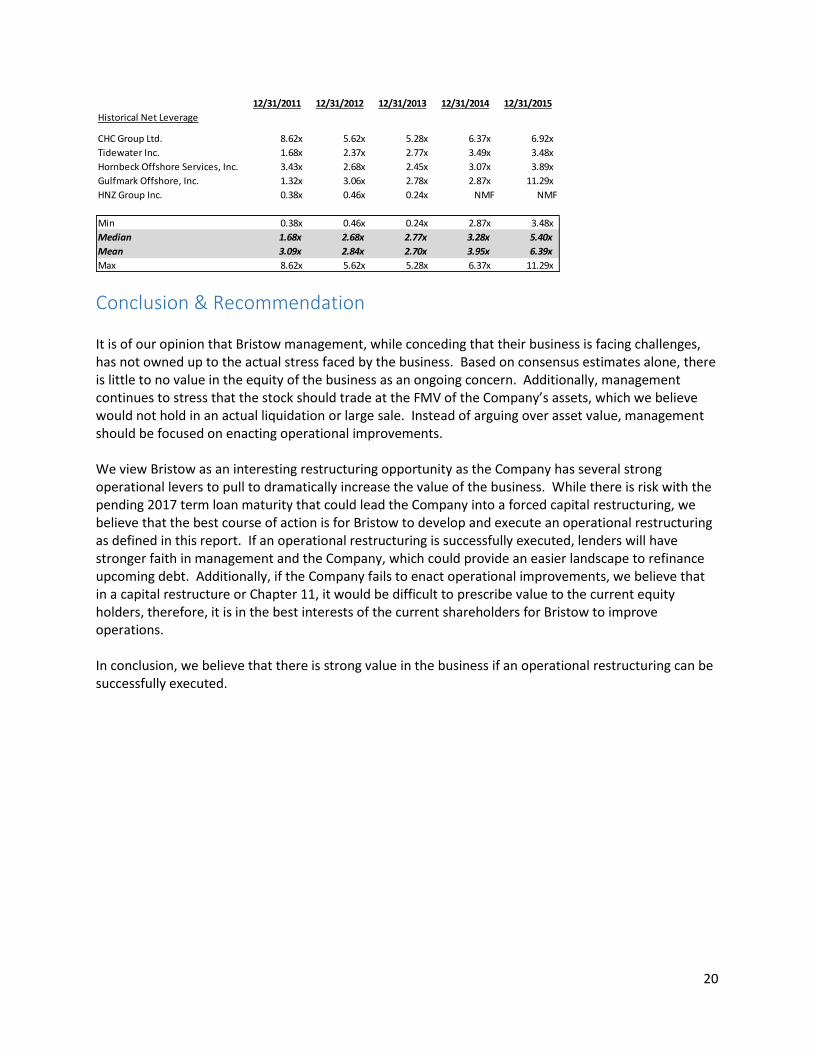
Through the cycle, companies with similar economic drivers and business models have net leverage
ratios range from 1.68x – 5.40x and Bristow would be well within that range during its recovery
following its operational restructuring.
Fiscal Year Ended March 31,
$ in thousands 2017 2018 2019 2020 2021
EBITDA $ 183,324 $ 181,016 $ 177,984 $ 191,970 $ 227,970
Less: CapEx (26,479) (87,925) (90,592) (90,017) (96,005)
EBITDA Less CapEx $ 156,845 $ 93,091 $ 87,392 $ 101,953 $ 131,965
Fixed Charges
Required Amortization $ 15,652 $ 15,652 $ 15,652 $ 15,652 $ 15,652
Interest 26,328 52,350 49,724 48,033 48,731
Taxes 25,164 1,240 1,078 7,349 21,470
Dividends 5,000 10,000 10,000 10,000 10,000
Total Fixed Charges $ 72,144 $ 79,242 $ 76,453 $ 81,033 $ 95,852
Fixed Charge Coverage Ratio 2.17x 1.17x 1.14x 1.26x 1.38x
Liquidity 400,000 242,232 351,800 367,390 388,310
Leverage Ratio 6.21x 5.60x 5.52x 4.93x 3.92x
$ 2,403
$ 1,772
$ 1,095
$ 2,996
$ 1,816
$ 2,095
$ - $ 500 $ 1,000 $ 1,500 $ 2,000 $ 2,500 $ 3,000 $ 3,500
Discounted Cash Flow
Comparable Company Analysis
Liquidation Value
Enterprise Value Football FieldNet Debt
20
Conclusion & Recommendation It is of our opinion that Bristow management, while conceding that their business is facing challenges, has not owned up to the actual stress faced by the business. Based on consensus estimates alone, there is little to no value in the equity of the business as an ongoing concern. Additionally, management continues to stress that the stock should trade at the FMV of the Company’s assets, which we believe would not hold in an actual liquidation or large sale. Instead of arguing over asset value, management should be focused on enacting operational improvements. We view Bristow as an interesting restructuring opportunity as the Company has several strong operational levers to pull to dramatically increase the value of the business. While there is risk with the pending 2017 term loan maturity that could lead the Company into a forced capital restructuring, we believe that the best course of action is for Bristow to develop and execute an operational restructuring as defined in this report. If an operational restructuring is successfully executed, lenders will have stronger faith in management and the Company, which could provide an easier landscape to refinance upcoming debt. Additionally, if the Company fails to enact operational improvements, we believe that in a capital restructure or Chapter 11, it would be difficult to prescribe value to the current equity holders, therefore, it is in the best interests of the current shareholders for Bristow to improve operations. In conclusion, we believe that there is strong value in the business if an operational restructuring can be successfully executed.
12/31/2011 12/31/2012 12/31/2013 12/31/2014 12/31/2015
Historical Net Leverage
CHC Group Ltd. 8.62x 5.62x 5.28x 6.37x 6.92x
Tidewater Inc. 1.68x 2.37x 2.77x 3.49x 3.48x
Hornbeck Offshore Services, Inc. 3.43x 2.68x 2.45x 3.07x 3.89x
Gulfmark Offshore, Inc. 1.32x 3.06x 2.78x 2.87x 11.29x
HNZ Group Inc. 0.38x 0.46x 0.24x NMF NMF
Min 0.38x 0.46x 0.24x 2.87x 3.48x
Median 1.68x 2.68x 2.77x 3.28x 5.40x
Mean 3.09x 2.84x 2.70x 3.95x 6.39x
Max 8.62x 5.62x 5.28x 6.37x 11.29x
21
Works Cited Adeosun, M. (2016, May 4). Low oil prices taking toll on deepwater capex. Retrieved from Offshore Mag:
http://www.offshore-mag.com/articles/print/volume-76/issue-5/deepwater-update/low-oil-
prices-taking-toll-on-deepwater-capex.html
Alexander Gladstone, R. B. (2016, October 21). Bristow taps advisor to explore strategic alternatives.
Retrieved from DebtWire:
https://www.debtwire.com/intelligence/view/2322869?searchTerm=company%253A%25.
B. Chase Mulvehill, J. L. (2015). Bracing for Lower-for-Longer Offshore Environment; Initiating Neutral.
Atlanta: SunTrust.
Bankruptcy court allows CHC to 'reject' 90 aircraft leases. (2016, May 12). Retrieved from Vertical Mag:
https://www.verticalmag.com/news/bankruptcycourtallowschctoreject90aircraftleases/
Brandon Dobell, T. D. (2016). Financing Likely Puts a Floor Under the Stock, but Is Bristow Trading Below
Fair Value? Delaware: William Blair.
Bristow Group. (2015). Form 10K. Houston: Bristow Group.
Bristow Group. (2016). FQ2 2017 Earnings Call Transcripts. Houston: Bristow Group.
Bristow Group. (2016). Investor Presentation. Houston: Bristow Group.
Bristow Group. (2016). Third quarter FY16 earnings presentation. Houston: Bristow Group.
CHC Helicopter. (2014). Investor Presentation . Richmond: CHC Helicopter.
Gregory Lewis, N. K. (2016). Clearing the Near Term Runway. New York: Credit Suisse.
Jacqueline Palank, D. C. (2016, May 5). Helicopter Operator CHC Group Files for Bankruptcy Protection.
Retrieved from The Wall Street Journal:
http://www.wsj.com/articles/helicopteroperatorchcgroupfilesforbankruptcyprotection1462429
695
New report paints bleak picture of FPS market for 2016. (2016, April 20). Retrieved from Offshore Mag:
http://www.offshore-mag.com/articles/2016/04/new-report-paints-bleak-picture-of-floating-
production-systems-market-for-2016.html
Schaefer, K. (2016, May 31). The Offshore Oil Business Is Crippled And It May Never Recover. Retrieved
from OilPrice.com: http://oilprice.com/Energy/Crude-Oil/The-Offshore-Oil-Business-Is-Crippled-
And-It-May-Never-Recover.html
Schumm, J. (2015). High-Quality Assets at a Steep Discount; Initiate With Outpeform. New York:
Oppenheimer.
Skierholic. (2016, January 26). BRISTOW GROUP INC . Retrieved from Value Investors Club:
https://www.valueinvestorsclub.com/idea/BRISTOW_GROUP_INC/137927
William Thompson, J. D. (2016). Downgrade to EW Given Difficulty in Discounting Refinancing Risk. New
York: Barclays.

22
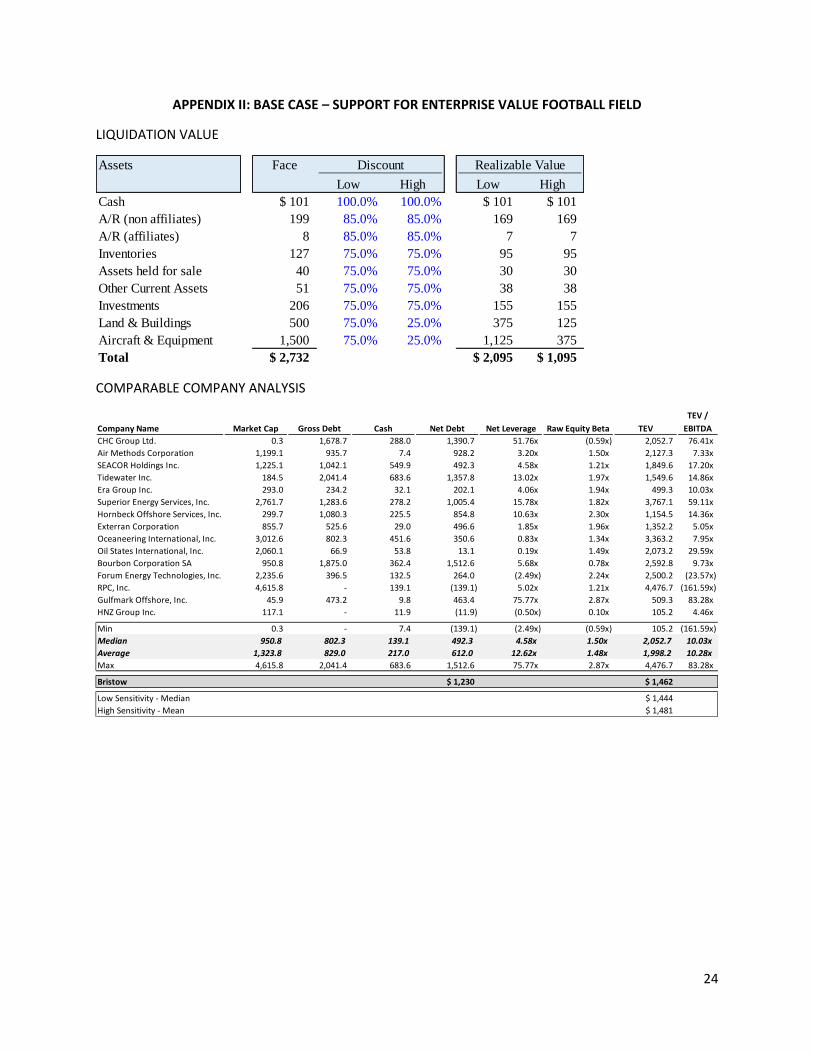
APPENDIX I: CONSENSUS CASE – SUPPORT FOR ENTERPRISE VALUE FOOTBALL FIELD
LIQUIDATION VALUE
COMPARABLE COMPANY ANALYSIS
Assets Face Discount Realizable Value
Low High Low High
Cash $ 101 100.0% 100.0% $ 101 $ 101
A/R (non affiliates) 199 85.0% 85.0% 169 169
A/R (affiliates) 8 85.0% 85.0% 7 7
Inventories 127 75.0% 75.0% 95 95
Assets held for sale 40 75.0% 75.0% 30 30
Other Current Assets 51 75.0% 75.0% 38 38
Investments 206 75.0% 75.0% 155 155
Land & Buildings 500 75.0% 25.0% 375 125
Aircraft & Equipment 1,500 75.0% 25.0% 1,125 375
Total $ 2,732 $ 2,095 $ 1,095
TEV /
Company Name Market Cap Gross Debt Cash Net Debt Net Leverage Raw Equity Beta TEV EBITDA
CHC Group Ltd. 0.3 1,678.7 288.0 1,390.7 51.76x (0.59x) 2,052.7 76.41x
Air Methods Corporation 1,199.1 935.7 7.4 928.2 3.20x 1.50x 2,127.3 7.33x
SEACOR Holdings Inc. 1,225.1 1,042.1 549.9 492.3 4.58x 1.21x 1,849.6 17.20x
Tidewater Inc. 184.5 2,041.4 683.6 1,357.8 13.02x 1.97x 1,549.6 14.86x
Era Group Inc. 293.0 234.2 32.1 202.1 4.06x 1.94x 499.3 10.03x
Superior Energy Services, Inc. 2,761.7 1,283.6 278.2 1,005.4 15.78x 1.82x 3,767.1 59.11x
Hornbeck Offshore Services, Inc. 299.7 1,080.3 225.5 854.8 10.63x 2.30x 1,154.5 14.36x
Exterran Corporation 855.7 525.6 29.0 496.6 1.85x 1.96x 1,352.2 5.05x
Oceaneering International, Inc. 3,012.6 802.3 451.6 350.6 0.83x 1.34x 3,363.2 7.95x
Oil States International, Inc. 2,060.1 66.9 53.8 13.1 0.19x 1.49x 2,073.2 29.59x
Bourbon Corporation SA 950.8 1,875.0 362.4 1,512.6 5.68x 0.78x 2,592.8 9.73x
Forum Energy Technologies, Inc. 2,235.6 396.5 132.5 264.0 (2.49x) 2.24x 2,500.2 (23.57x)
RPC, Inc. 4,615.8 - 139.1 (139.1) 5.02x 1.21x 4,476.7 (161.59x)
Gulfmark Offshore, Inc. 45.9 473.2 9.8 463.4 75.77x 2.87x 509.3 83.28x
HNZ Group Inc. 117.1 - 11.9 (11.9) (0.50x) 0.10x 105.2 4.46x
Min 0.3 - 7.4 (139.1) (2.49x) (0.59x) 105.2 (161.59x)
Median 950.8 802.3 139.1 492.3 4.58x 1.50x 2,052.7 10.03x
Average 1,323.8 829.0 217.0 612.0 12.62x 1.48x 1,998.2 10.28x
Max 4,615.8 2,041.4 683.6 1,512.6 75.77x 2.87x 4,476.7 83.28x
Bristow $ 1,230 $ 1,462
Low Sensitivity - Median $ 1,444
High Sensitivity - Mean $ 1,481
23
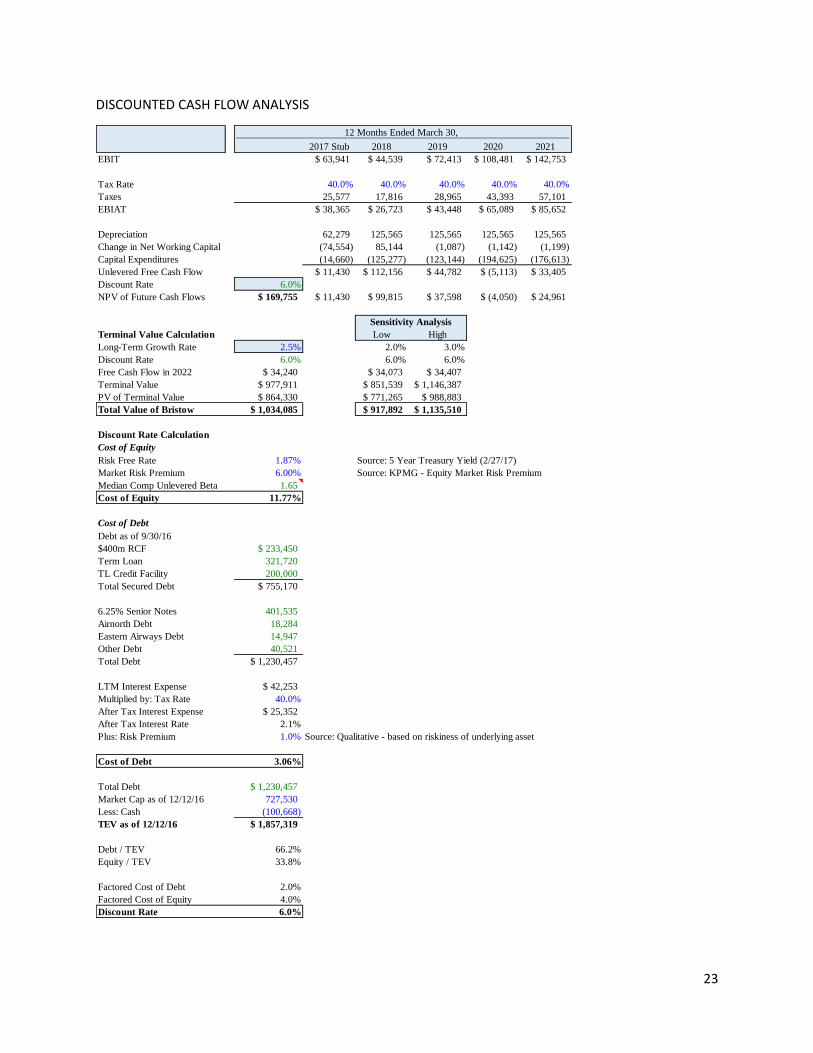
DISCOUNTED CASH FLOW ANALYSIS
12 Months Ended March 30,
2017 Stub 2018 2019 2020 2021
EBIT $ 63,941 $ 44,539 $ 72,413 $ 108,481 $ 142,753
Tax Rate 40.0% 40.0% 40.0% 40.0% 40.0%
Taxes 25,577 17,816 28,965 43,393 57,101
EBIAT $ 38,365 $ 26,723 $ 43,448 $ 65,089 $ 85,652
Depreciation 62,279 125,565 125,565 125,565 125,565
Change in Net Working Capital (74,554) 85,144 (1,087) (1,142) (1,199)
Capital Expenditures (14,660) (125,277) (123,144) (194,625) (176,613)
Unlevered Free Cash Flow $ 11,430 $ 112,156 $ 44,782 $ (5,113) $ 33,405
Discount Rate 6.0%
NPV of Future Cash Flows $ 169,755 $ 11,430 $ 99,815 $ 37,598 $ (4,050) $ 24,961
Sensitivity Analysis
Terminal Value Calculation Low High
Long-Term Growth Rate 2.5% 2.0% 3.0%
Discount Rate 6.0% 6.0% 6.0%
Free Cash Flow in 2022 $ 34,240 $ 34,073 $ 34,407
Terminal Value $ 977,911 $ 851,539 $ 1,146,387
PV of Terminal Value $ 864,330 $ 771,265 $ 988,883
Total Value of Bristow $ 1,034,085 $ 917,892 $ 1,135,510
Discount Rate Calculation
Cost of Equity
Risk Free Rate 1.87% Source: 5 Year Treasury Yield (2/27/17)
Market Risk Premium 6.00% Source: KPMG - Equity Market Risk Premium
Median Comp Unlevered Beta 1.65
Cost of Equity 11.77%
Cost of Debt
Debt as of 9/30/16
$400m RCF $ 233,450
Term Loan 321,720
TL Credit Facility 200,000
Total Secured Debt $ 755,170
6.25% Senior Notes 401,535
Airnorth Debt 18,284
Eastern Airways Debt 14,947
Other Debt 40,521
Total Debt $ 1,230,457
LTM Interest Expense $ 42,253
Multiplied by: Tax Rate 40.0%
After Tax Interest Expense $ 25,352
After Tax Interest Rate 2.1%
Plus: Risk Premium 1.0% Source: Qualitative - based on riskiness of underlying asset
Cost of Debt 3.06%
Total Debt $ 1,230,457
Market Cap as of 12/12/16 727,530
Less: Cash (100,668)
TEV as of 12/12/16 $ 1,857,319
Debt / TEV 66.2%
Equity / TEV 33.8%
Factored Cost of Debt 2.0%
Factored Cost of Equity 4.0%
Discount Rate 6.0%
24
APPENDIX II: BASE CASE – SUPPORT FOR ENTERPRISE VALUE FOOTBALL FIELD
LIQUIDATION VALUE
COMPARABLE COMPANY ANALYSIS
Assets Face Discount Realizable Value
Low High Low High
Cash $ 101 100.0% 100.0% $ 101 $ 101
A/R (non affiliates) 199 85.0% 85.0% 169 169
A/R (affiliates) 8 85.0% 85.0% 7 7
Inventories 127 75.0% 75.0% 95 95
Assets held for sale 40 75.0% 75.0% 30 30
Other Current Assets 51 75.0% 75.0% 38 38
Investments 206 75.0% 75.0% 155 155
Land & Buildings 500 75.0% 25.0% 375 125
Aircraft & Equipment 1,500 75.0% 25.0% 1,125 375
Total $ 2,732 $ 2,095 $ 1,095
TEV /
Company Name Market Cap Gross Debt Cash Net Debt Net Leverage Raw Equity Beta TEV EBITDA
CHC Group Ltd. 0.3 1,678.7 288.0 1,390.7 51.76x (0.59x) 2,052.7 76.41x
Air Methods Corporation 1,199.1 935.7 7.4 928.2 3.20x 1.50x 2,127.3 7.33x
SEACOR Holdings Inc. 1,225.1 1,042.1 549.9 492.3 4.58x 1.21x 1,849.6 17.20x
Tidewater Inc. 184.5 2,041.4 683.6 1,357.8 13.02x 1.97x 1,549.6 14.86x
Era Group Inc. 293.0 234.2 32.1 202.1 4.06x 1.94x 499.3 10.03x
Superior Energy Services, Inc. 2,761.7 1,283.6 278.2 1,005.4 15.78x 1.82x 3,767.1 59.11x
Hornbeck Offshore Services, Inc. 299.7 1,080.3 225.5 854.8 10.63x 2.30x 1,154.5 14.36x
Exterran Corporation 855.7 525.6 29.0 496.6 1.85x 1.96x 1,352.2 5.05x
Oceaneering International, Inc. 3,012.6 802.3 451.6 350.6 0.83x 1.34x 3,363.2 7.95x
Oil States International, Inc. 2,060.1 66.9 53.8 13.1 0.19x 1.49x 2,073.2 29.59x
Bourbon Corporation SA 950.8 1,875.0 362.4 1,512.6 5.68x 0.78x 2,592.8 9.73x
Forum Energy Technologies, Inc. 2,235.6 396.5 132.5 264.0 (2.49x) 2.24x 2,500.2 (23.57x)
RPC, Inc. 4,615.8 - 139.1 (139.1) 5.02x 1.21x 4,476.7 (161.59x)
Gulfmark Offshore, Inc. 45.9 473.2 9.8 463.4 75.77x 2.87x 509.3 83.28x
HNZ Group Inc. 117.1 - 11.9 (11.9) (0.50x) 0.10x 105.2 4.46x
Min 0.3 - 7.4 (139.1) (2.49x) (0.59x) 105.2 (161.59x)
Median 950.8 802.3 139.1 492.3 4.58x 1.50x 2,052.7 10.03x
Average 1,323.8 829.0 217.0 612.0 12.62x 1.48x 1,998.2 10.28x
Max 4,615.8 2,041.4 683.6 1,512.6 75.77x 2.87x 4,476.7 83.28x
Bristow $ 1,230 $ 1,462
Low Sensitivity - Median $ 1,444
High Sensitivity - Mean $ 1,481
25
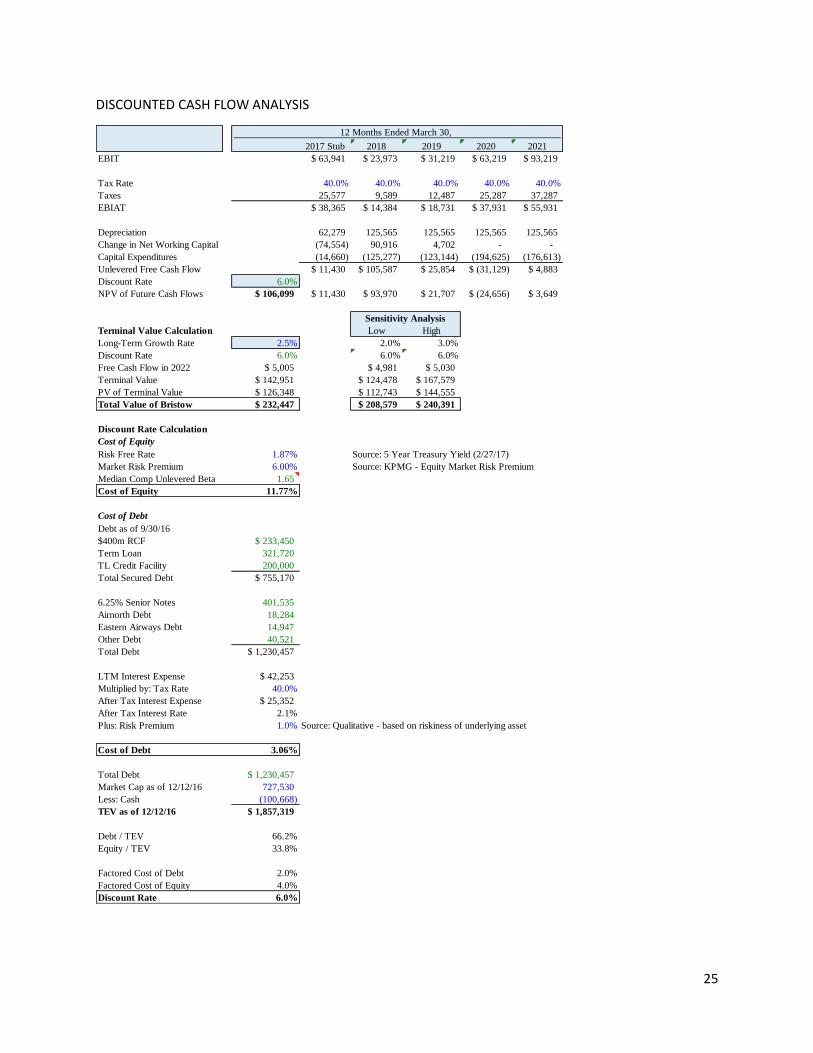
DISCOUNTED CASH FLOW ANALYSIS
12 Months Ended March 30,
2017 Stub 2018 2019 2020 2021
EBIT $ 63,941 $ 23,973 $ 31,219 $ 63,219 $ 93,219
Tax Rate 40.0% 40.0% 40.0% 40.0% 40.0%
Taxes 25,577 9,589 12,487 25,287 37,287
EBIAT $ 38,365 $ 14,384 $ 18,731 $ 37,931 $ 55,931
Depreciation 62,279 125,565 125,565 125,565 125,565
Change in Net Working Capital (74,554) 90,916 4,702 - -
Capital Expenditures (14,660) (125,277) (123,144) (194,625) (176,613)
Unlevered Free Cash Flow $ 11,430 $ 105,587 $ 25,854 $ (31,129) $ 4,883
Discount Rate 6.0%
NPV of Future Cash Flows $ 106,099 $ 11,430 $ 93,970 $ 21,707 $ (24,656) $ 3,649
Sensitivity Analysis
Terminal Value Calculation Low High
Long-Term Growth Rate 2.5% 2.0% 3.0%
Discount Rate 6.0% 6.0% 6.0%
Free Cash Flow in 2022 $ 5,005 $ 4,981 $ 5,030
Terminal Value $ 142,951 $ 124,478 $ 167,579
PV of Terminal Value $ 126,348 $ 112,743 $ 144,555
Total Value of Bristow $ 232,447 $ 208,579 $ 240,391
Discount Rate Calculation
Cost of Equity
Risk Free Rate 1.87% Source: 5 Year Treasury Yield (2/27/17)
Market Risk Premium 6.00% Source: KPMG - Equity Market Risk Premium
Median Comp Unlevered Beta 1.65
Cost of Equity 11.77%
Cost of Debt
Debt as of 9/30/16
$400m RCF $ 233,450
Term Loan 321,720
TL Credit Facility 200,000
Total Secured Debt $ 755,170
6.25% Senior Notes 401,535
Airnorth Debt 18,284
Eastern Airways Debt 14,947
Other Debt 40,521
Total Debt $ 1,230,457
LTM Interest Expense $ 42,253
Multiplied by: Tax Rate 40.0%
After Tax Interest Expense $ 25,352
After Tax Interest Rate 2.1%
Plus: Risk Premium 1.0% Source: Qualitative - based on riskiness of underlying asset
Cost of Debt 3.06%
Total Debt $ 1,230,457
Market Cap as of 12/12/16 727,530
Less: Cash (100,668)
TEV as of 12/12/16 $ 1,857,319
Debt / TEV 66.2%
Equity / TEV 33.8%
Factored Cost of Debt 2.0%
Factored Cost of Equity 4.0%
Discount Rate 6.0%
26
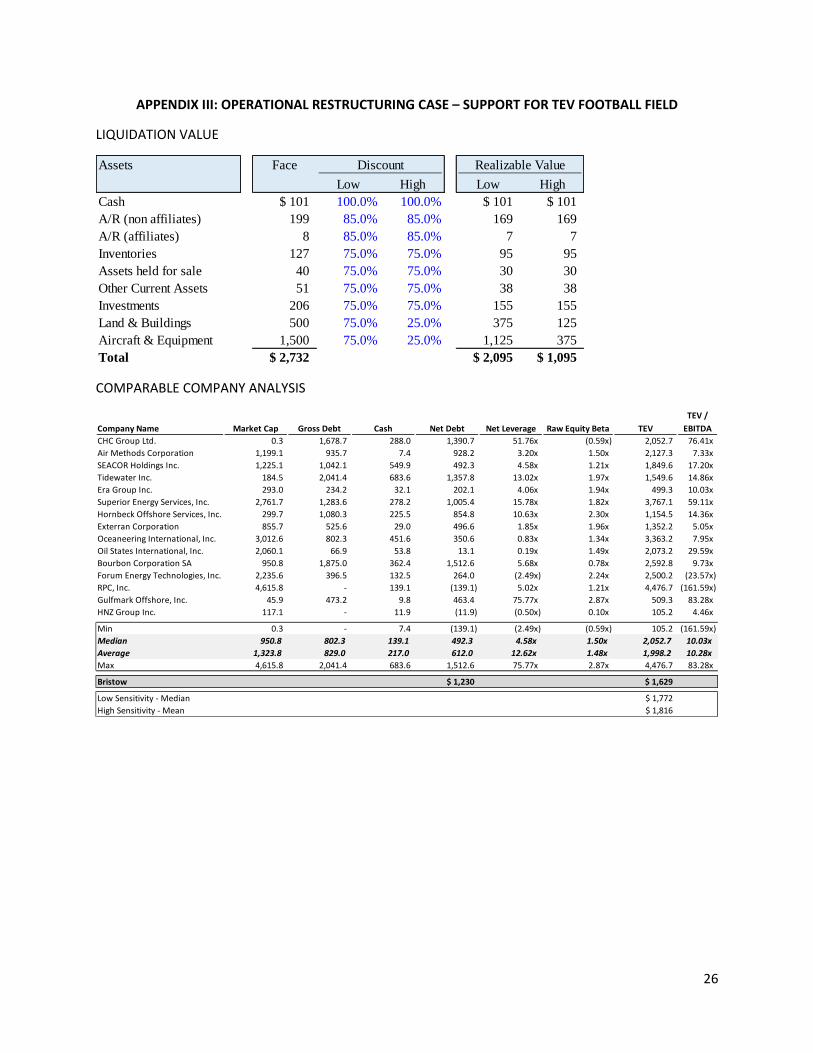
APPENDIX III: OPERATIONAL RESTRUCTURING CASE – SUPPORT FOR TEV FOOTBALL FIELD
LIQUIDATION VALUE
COMPARABLE COMPANY ANALYSIS
Assets Face Discount Realizable Value
Low High Low High
Cash $ 101 100.0% 100.0% $ 101 $ 101
A/R (non affiliates) 199 85.0% 85.0% 169 169
A/R (affiliates) 8 85.0% 85.0% 7 7
Inventories 127 75.0% 75.0% 95 95
Assets held for sale 40 75.0% 75.0% 30 30
Other Current Assets 51 75.0% 75.0% 38 38
Investments 206 75.0% 75.0% 155 155
Land & Buildings 500 75.0% 25.0% 375 125
Aircraft & Equipment 1,500 75.0% 25.0% 1,125 375
Total $ 2,732 $ 2,095 $ 1,095
TEV /
Company Name Market Cap Gross Debt Cash Net Debt Net Leverage Raw Equity Beta TEV EBITDA
CHC Group Ltd. 0.3 1,678.7 288.0 1,390.7 51.76x (0.59x) 2,052.7 76.41x
Air Methods Corporation 1,199.1 935.7 7.4 928.2 3.20x 1.50x 2,127.3 7.33x
SEACOR Holdings Inc. 1,225.1 1,042.1 549.9 492.3 4.58x 1.21x 1,849.6 17.20x
Tidewater Inc. 184.5 2,041.4 683.6 1,357.8 13.02x 1.97x 1,549.6 14.86x
Era Group Inc. 293.0 234.2 32.1 202.1 4.06x 1.94x 499.3 10.03x
Superior Energy Services, Inc. 2,761.7 1,283.6 278.2 1,005.4 15.78x 1.82x 3,767.1 59.11x
Hornbeck Offshore Services, Inc. 299.7 1,080.3 225.5 854.8 10.63x 2.30x 1,154.5 14.36x
Exterran Corporation 855.7 525.6 29.0 496.6 1.85x 1.96x 1,352.2 5.05x
Oceaneering International, Inc. 3,012.6 802.3 451.6 350.6 0.83x 1.34x 3,363.2 7.95x
Oil States International, Inc. 2,060.1 66.9 53.8 13.1 0.19x 1.49x 2,073.2 29.59x
Bourbon Corporation SA 950.8 1,875.0 362.4 1,512.6 5.68x 0.78x 2,592.8 9.73x
Forum Energy Technologies, Inc. 2,235.6 396.5 132.5 264.0 (2.49x) 2.24x 2,500.2 (23.57x)
RPC, Inc. 4,615.8 - 139.1 (139.1) 5.02x 1.21x 4,476.7 (161.59x)
Gulfmark Offshore, Inc. 45.9 473.2 9.8 463.4 75.77x 2.87x 509.3 83.28x
HNZ Group Inc. 117.1 - 11.9 (11.9) (0.50x) 0.10x 105.2 4.46x
Min 0.3 - 7.4 (139.1) (2.49x) (0.59x) 105.2 (161.59x)
Median 950.8 802.3 139.1 492.3 4.58x 1.50x 2,052.7 10.03x
Average 1,323.8 829.0 217.0 612.0 12.62x 1.48x 1,998.2 10.28x
Max 4,615.8 2,041.4 683.6 1,512.6 75.77x 2.87x 4,476.7 83.28x
Bristow $ 1,230 $ 1,629
Low Sensitivity - Median $ 1,772
High Sensitivity - Mean $ 1,816
27
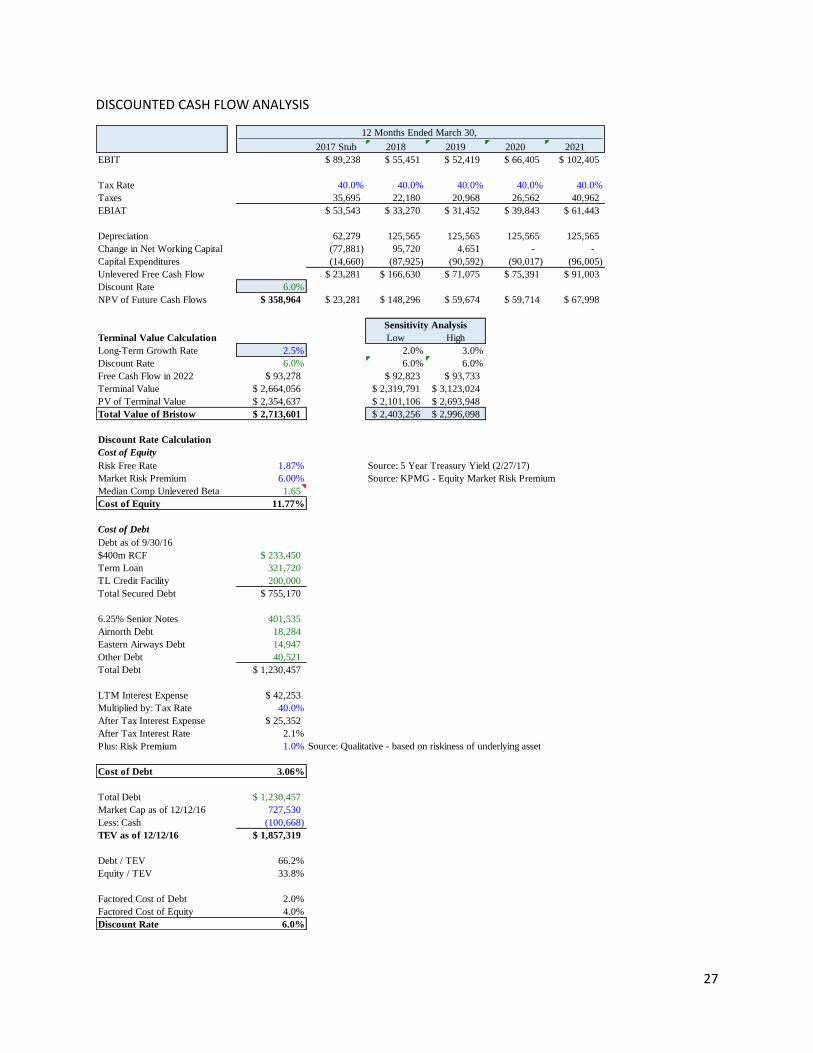
DISCOUNTED CASH FLOW ANALYSIS
12 Months Ended March 30,
2017 Stub 2018 2019 2020 2021
EBIT $ 89,238 $ 55,451 $ 52,419 $ 66,405 $ 102,405
Tax Rate 40.0% 40.0% 40.0% 40.0% 40.0%
Taxes 35,695 22,180 20,968 26,562 40,962
EBIAT $ 53,543 $ 33,270 $ 31,452 $ 39,843 $ 61,443
Depreciation 62,279 125,565 125,565 125,565 125,565
Change in Net Working Capital (77,881) 95,720 4,651 - -
Capital Expenditures (14,660) (87,925) (90,592) (90,017) (96,005)
Unlevered Free Cash Flow $ 23,281 $ 166,630 $ 71,075 $ 75,391 $ 91,003
Discount Rate 6.0%
NPV of Future Cash Flows $ 358,964 $ 23,281 $ 148,296 $ 59,674 $ 59,714 $ 67,998
Sensitivity Analysis
Terminal Value Calculation Low High
Long-Term Growth Rate 2.5% 2.0% 3.0%
Discount Rate 6.0% 6.0% 6.0%
Free Cash Flow in 2022 $ 93,278 $ 92,823 $ 93,733
Terminal Value $ 2,664,056 $ 2,319,791 $ 3,123,024
PV of Terminal Value $ 2,354,637 $ 2,101,106 $ 2,693,948
Total Value of Bristow $ 2,713,601 $ 2,403,256 $ 2,996,098
Discount Rate Calculation
Cost of Equity
Risk Free Rate 1.87% Source: 5 Year Treasury Yield (2/27/17)
Market Risk Premium 6.00% Source: KPMG - Equity Market Risk Premium
Median Comp Unlevered Beta 1.65
Cost of Equity 11.77%
Cost of Debt
Debt as of 9/30/16
$400m RCF $ 233,450
Term Loan 321,720
TL Credit Facility 200,000
Total Secured Debt $ 755,170
6.25% Senior Notes 401,535
Airnorth Debt 18,284
Eastern Airways Debt 14,947
Other Debt 40,521
Total Debt $ 1,230,457
LTM Interest Expense $ 42,253
Multiplied by: Tax Rate 40.0%
After Tax Interest Expense $ 25,352
After Tax Interest Rate 2.1%
Plus: Risk Premium 1.0% Source: Qualitative - based on riskiness of underlying asset
Cost of Debt 3.06%
Total Debt $ 1,230,457
Market Cap as of 12/12/16 727,530
Less: Cash (100,668)
TEV as of 12/12/16 $ 1,857,319
Debt / TEV 66.2%
Equity / TEV 33.8%
Factored Cost of Debt 2.0%
Factored Cost of Equity 4.0%
Discount Rate 6.0%