Embed Size (px)
Citation preview
Winter
Imag
es c
ourt
esy
of G
etty
Imag
es.
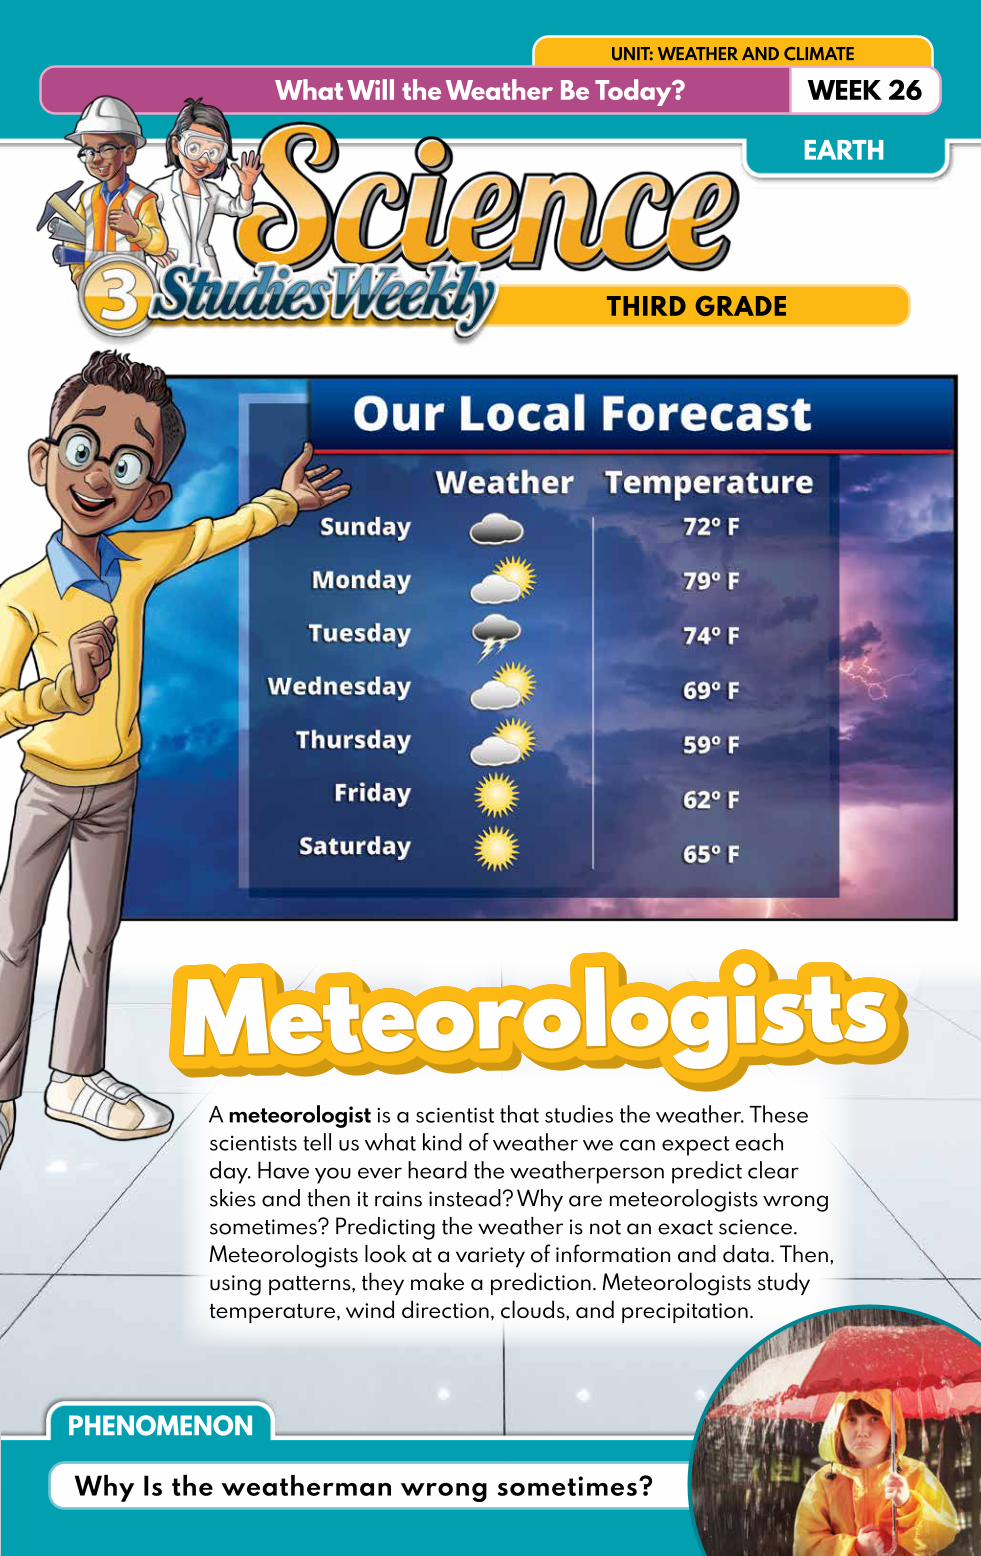
A meteorologist is a scientist that studies the weather. These scientists tell us what kind of weather we can expect each day. Have you ever heard the weatherperson predict clear skies and then it rains instead? Why are meteorologists wrong sometimes? Predicting the weather is not an exact science. Meteorologists look at a variety of information and data. Then, using patterns, they make a prediction. Meteorologists study temperature, wind direction, clouds, and precipitation.
Patterns are repetitions, or a repeat of events, that help predict what will come next. Meteorologists look at temperature, precipitation, wind, and cloud patterns to make predictions. The information they have collected helps us know what type of weather to expect during each season. A season is a time of year marked by an expected type of weather. There are four seasons: summer, fall, winter, and spring. Summer is hot, and trees are green. Fall is cool, and the leaves start changing colors as the temperatures get colder. Winter is cold, and it can snow. Spring is when it slowly gets warmer. The grass starts to get green, and it rains a lot.
Being a Meteorologist MeteorologistsMeteorologists
Spring Summer Fall
Patterns
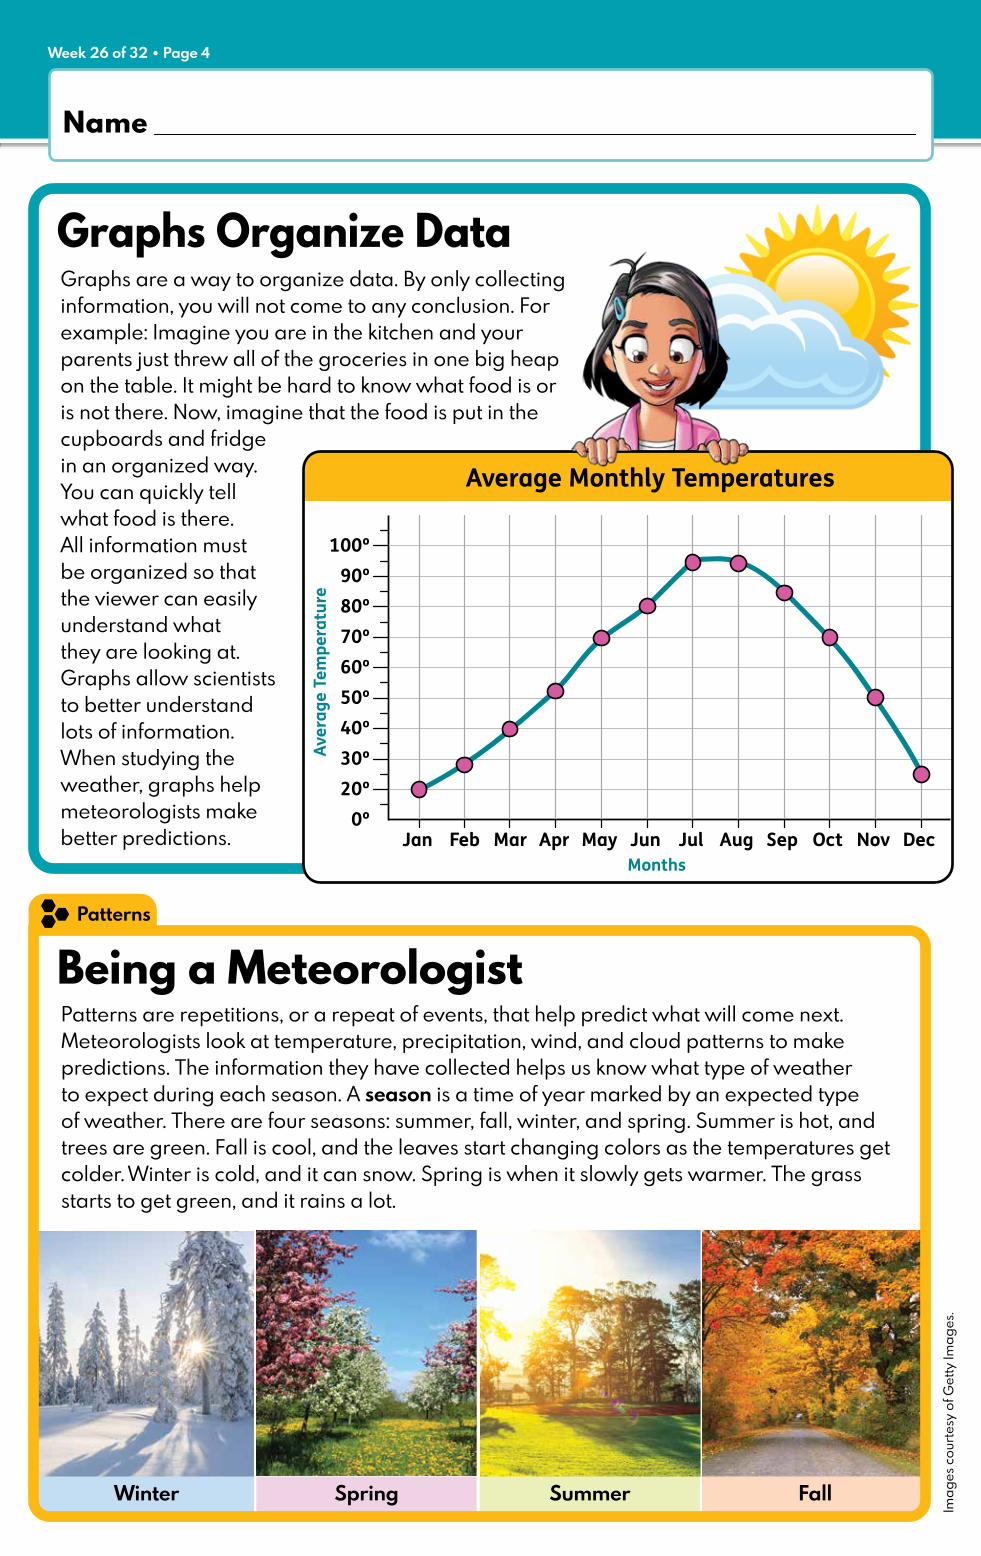
Graphs are a way to organize data. By only collecting information, you will not come to any conclusion. For example: Imagine you are in the kitchen and your parents just threw all of the groceries in one big heap on the table. It might be hard to know what food is or is not there. Now, imagine that the food is put in the cupboards and fridge in an organized way. You can quickly tell what food is there. All information must be organized so that the viewer can easily understand what they are looking at. Graphs allow scientists to better understand lots of information. When studying the weather, graphs help meteorologists make better predictions.
Graphs Organize Data
0º20º30º40º50º60º70º80º90º
100º
Jan Feb Mar Apr May Jun Jul Aug Sep Oct Nov DecMonths
Aver
age
Tem
pera
ture
Average Monthly Temperatures
PHENOMENON
Name ________________________________________________________________________________EARTH
Week 26 of 32 • Page 4 UNIT: WEATHER AND CLIMATE
What Will the Weather Be Today? WEEK 26
THIRD GRADE
Why Is the weatherman wrong sometimes?
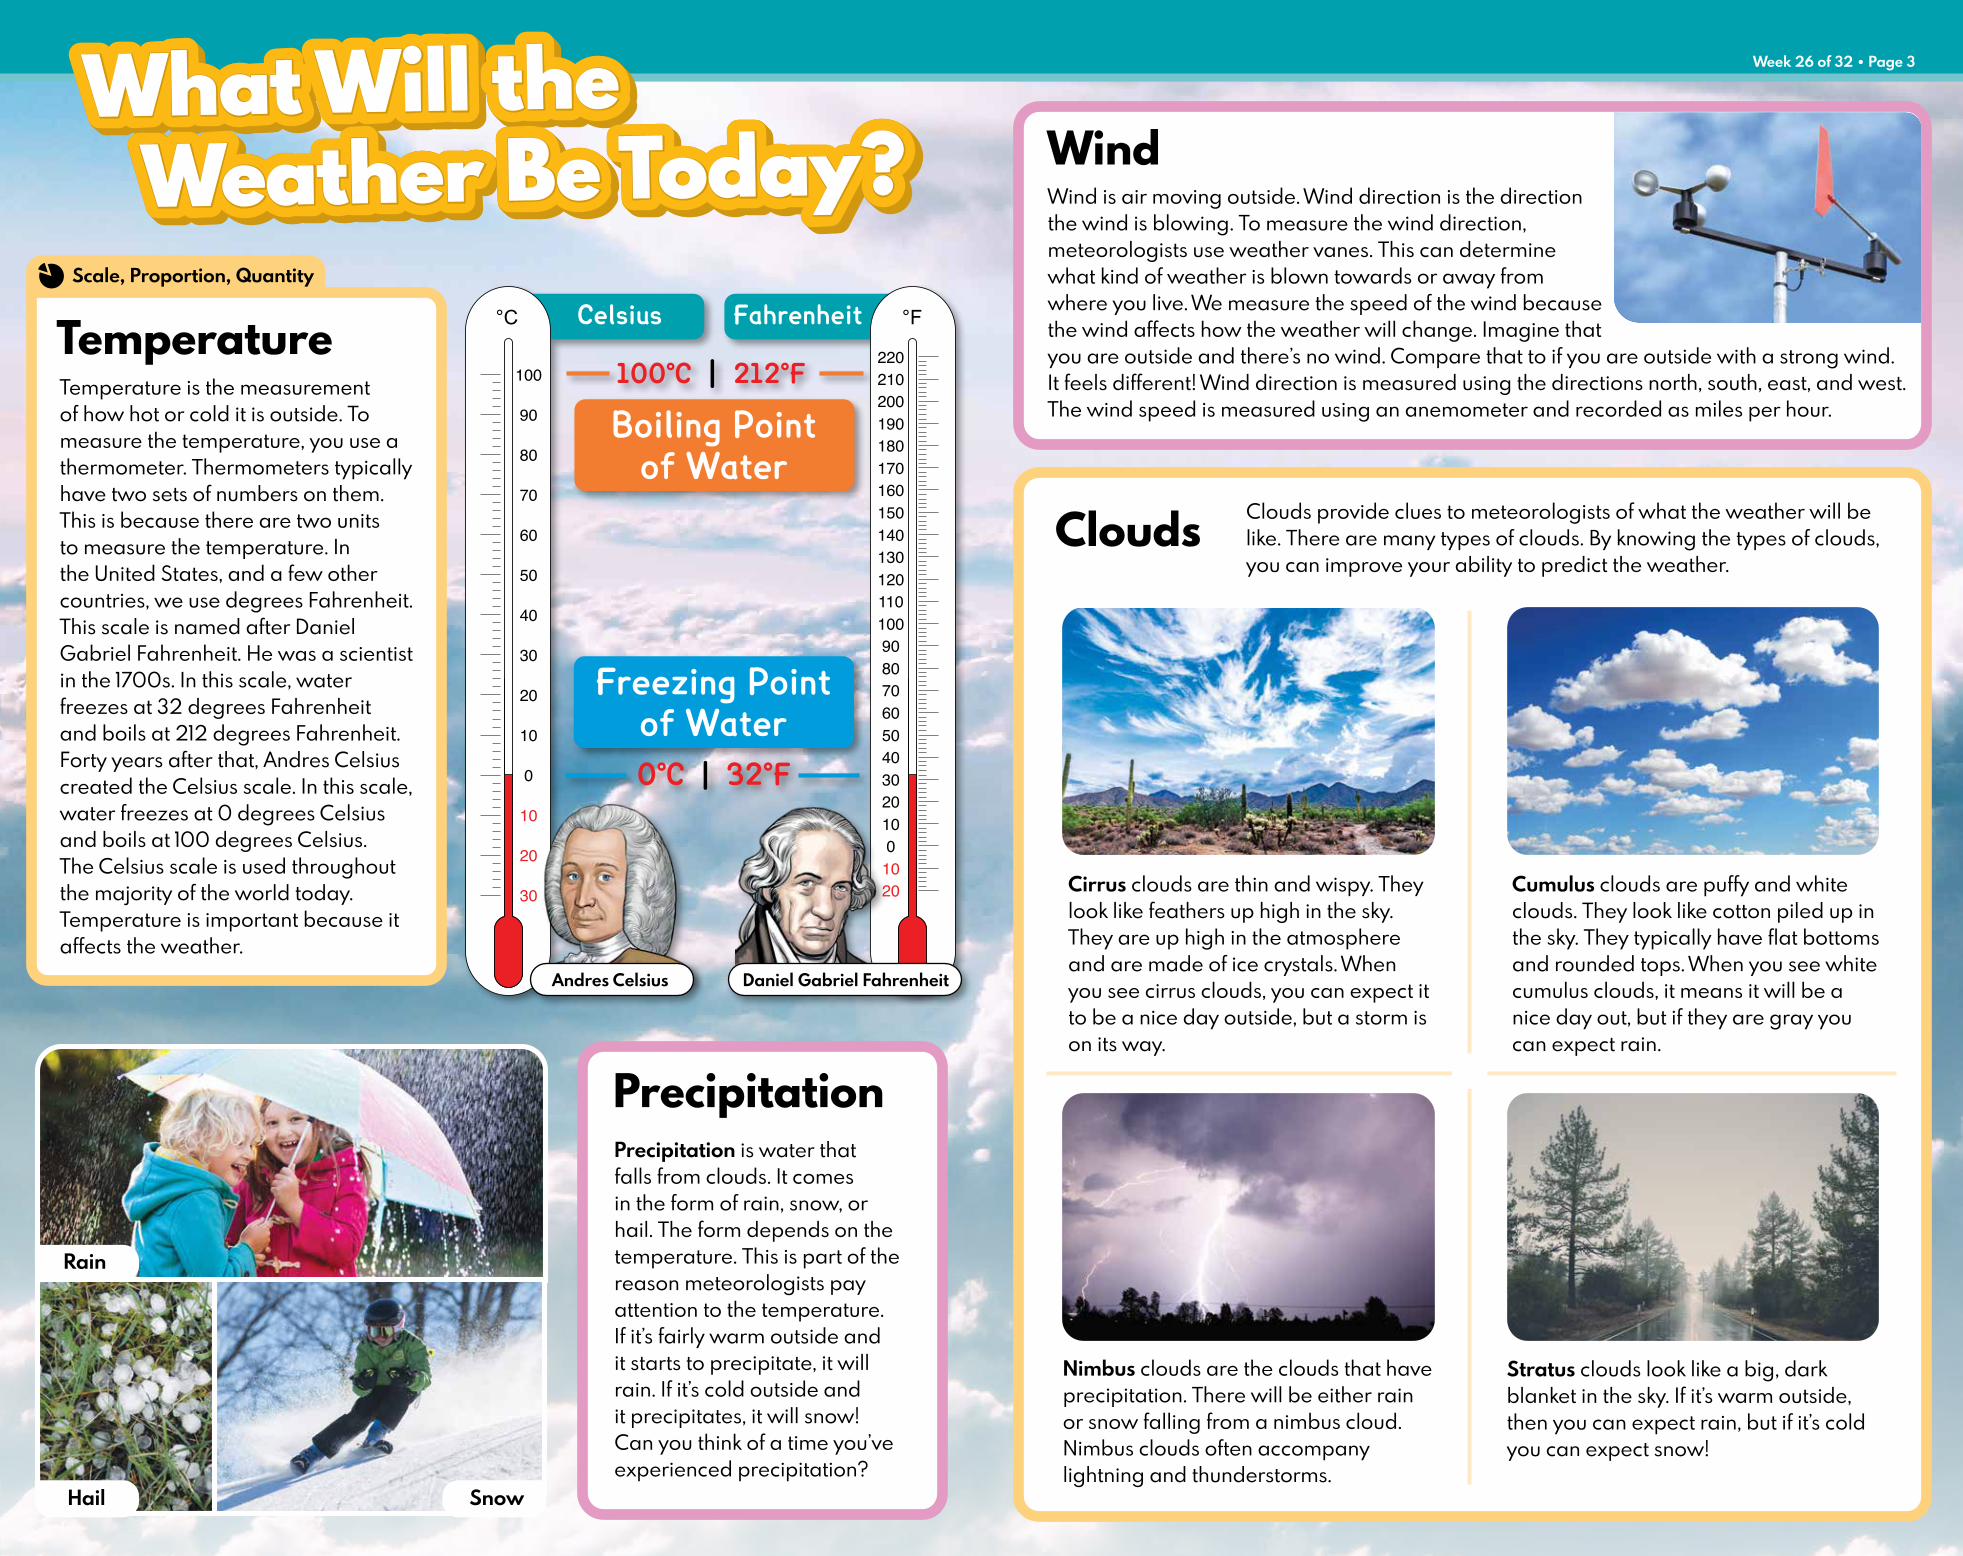
Wind is air moving outside. Wind direction is the direction the wind is blowing. To measure the wind direction, meteorologists use weather vanes. This can determine what kind of weather is blown towards or away from where you live. We measure the speed of the wind because the wind affects how the weather will change. Imagine that you are outside and there’s no wind. Compare that to if you are outside with a strong wind. It feels different! Wind direction is measured using the directions north, south, east, and west. The wind speed is measured using an anemometer and recorded as miles per hour.
Cirrus clouds are thin and wispy. They look like feathers up high in the sky. They are up high in the atmosphere and are made of ice crystals. When you see cirrus clouds, you can expect it to be a nice day outside, but a storm is on its way.
Week 26 of 32 • Page 3
Clouds
WindWhat Will the Weather Be Today?What Will the Weather Be Today?
100°C | 212°F
Freezing Pointof Water0°C | 32°F
30
20
10
0
10
20
30
40
50
60
70
80
90
100
Celsius°C
20100
102030405060708090
100110120130140150160170180190200210220
Fahrenheit °F
Boiling Pointof Water
Daniel Gabriel FahrenheitAndres Celsius
Precipitation is water that falls from clouds. It comes in the form of rain, snow, or hail. The form depends on the temperature. This is part of the reason meteorologists pay attention to the temperature. If it’s fairly warm outside and it starts to precipitate, it will rain. If it’s cold outside and it precipitates, it will snow! Can you think of a time you’ve experienced precipitation?
Precipitation
SnowHail
Rain
Scale, Proportion, Quantity
Temperature is the measurement of how hot or cold it is outside. To measure the temperature, you use a thermometer. Thermometers typically have two sets of numbers on them. This is because there are two units to measure the temperature. In the United States, and a few other countries, we use degrees Fahrenheit. This scale is named after Daniel Gabriel Fahrenheit. He was a scientist in the 1700s. In this scale, water freezes at 32 degrees Fahrenheit and boils at 212 degrees Fahrenheit. Forty years after that, Andres Celsius created the Celsius scale. In this scale, water freezes at 0 degrees Celsius and boils at 100 degrees Celsius. The Celsius scale is used throughout the majority of the world today. Temperature is important because it affects the weather.
Temperature
Clouds provide clues to meteorologists of what the weather will be like. There are many types of clouds. By knowing the types of clouds, you can improve your ability to predict the weather.
Stratus clouds look like a big, dark blanket in the sky. If it’s warm outside, then you can expect rain, but if it’s cold you can expect snow!
Nimbus clouds are the clouds that have precipitation. There will be either rain or snow falling from a nimbus cloud. Nimbus clouds often accompany lightning and thunderstorms.
Cumulus clouds are puffy and white clouds. They look like cotton piled up in the sky. They typically have flat bottoms and rounded tops. When you see white cumulus clouds, it means it will be a nice day out, but if they are gray you can expect rain.
Winter
Imag
es c
ourt
esy
of G
etty
Imag
es.
A meteorologist is a scientist that studies the weather. These scientists tell us what kind of weather we can expect each day. Have you ever heard the weatherperson predict clear skies and then it rains instead? Why are meteorologists wrong sometimes? Predicting the weather is not an exact science. Meteorologists look at a variety of information and data. Then, using patterns, they make a prediction. Meteorologists study temperature, wind direction, clouds, and precipitation.
Patterns are repetitions, or a repeat of events, that help predict what will come next. Meteorologists look at temperature, precipitation, wind, and cloud patterns to make predictions. The information they have collected helps us know what type of weather to expect during each season. A season is a time of year marked by an expected type of weather. There are four seasons: summer, fall, winter, and spring. Summer is hot, and trees are green. Fall is cool, and the leaves start changing colors as the temperatures get colder. Winter is cold, and it can snow. Spring is when it slowly gets warmer. The grass starts to get green, and it rains a lot.
Being a Meteorologist MeteorologistsMeteorologists
Spring Summer Fall
Patterns
Graphs are a way to organize data. By only collecting information, you will not come to any conclusion. For example: Imagine you are in the kitchen and your parents just threw all of the groceries in one big heap on the table. It might be hard to know what food is or is not there. Now, imagine that the food is put in the cupboards and fridge in an organized way. You can quickly tell what food is there. All information must be organized so that the viewer can easily understand what they are looking at. Graphs allow scientists to better understand lots of information. When studying the weather, graphs help meteorologists make better predictions.
Graphs Organize Data
0º20º30º40º50º60º70º80º90º
100º
Jan Feb Mar Apr May Jun Jul Aug Sep Oct Nov DecMonths
Aver
age
Tem
pera
ture
Average Monthly Temperatures
PHENOMENON
Name ________________________________________________________________________________EARTH
Week 26 of 32 • Page 4 UNIT: WEATHER AND CLIMATE
What Will the Weather Be Today? WEEK 26
THIRD GRADE
Why Is the weatherman wrong sometimes?