Embed Size (px)
Citation preview

I2T2 Final Project
Graphing and Writing LinearEquations
Catherine ZimmermanMath 8/Grade 8Five class periodsTechnology: Graphing Calculator, The Geometer’s Sketchpad,Green Globs

2
Overall Objectives for Unit
Sections 5-1 through 5-5 in text:
1. Students will be able to calculate the slope of a line.
2. They will be able to draw a line through a point with a given slope.
3. Find rates of change from tables and graphs.
4. Determine whether a graph or table is representative of a linear function.
5. Graph data on a graphing calculator to determine the rate of change of a function and whether itis linear.
6. Relate the slope to constant of variation.
7. Use constant of variation to solve problems.
8. Students will be able to write their own realistic word problems with a constant variation.
9. Use the slope and Y-Intercept to draw graphs and write equations.
10. Use a graphing calculator to determine how the change in slope and Y-intercept affect thegraph of a line.
11. Students will be able to write an equation given 2 points from a graph or table. They will beable to compute it manually and electronically using The Geometer’s Sketchpad program on thecomputer.

3
New York State Standards Addressed
Standard 1: Student will use mathematical analysis, scientific inquiry, and engineering designas appropriate, to pose questions, seek answers, and develop solutions.
Standard 2: Students will access, generate, process, and transfer information using appropriatetechnologies.
Standard 3: Students will understand mathematics and become mathematically confident bycommunicating and reasoning mathematically, by applying mathematics in real-world setting, andby solving problems through the integrated study of number systems, geometry, algebra, dataanalysis, probability, and trigonometry.
Standard 7: Students will apply the knowledge and thinking skills of mathematics, science, andtechnology to address real-life problems and make informed decisions.
Materials and Equipment Needed
• A textbook is used for assignments (doesn’t recognize a particular a series)• TI graphing calculator• Computer with the mathematical software Green Globs and The Geometerr’s Sketchpad.
Resources
Textbook:1) Prentice Hall, Algebra, Bellman, Bragg, Chapin, Gardella, Hall, Handlin, Manfre, chapter 5pages 213-240, 1998.
Internet Site:2) www.keypress.com/sketchpad, The Geometer’s Sketchpad, KCP Technology, Inc.
Mathematical Software:3) Green Globs and Graphing Equations, Dugdale and Kibbey, 1980-1996

4
Overview of Unit
A. Lesson 1: 5-1 SlopeThink and Discuss – What does the slope mean? Give example using real-life scenario.Display overhead for introduction of new material.Group Practice – Have students graph example together to find the slope of a line.Assign homework
B. Lesson 2: 5-2 Rates of ChangeReview homework – give answers and explain.Think and Discuss – rate of change. Give exampleDisplay Overhead – Review and demonstrate new materialModel example 2, p221 from text for studentsTechnology Group Work
Hand out worksheetStudents will use graphing calculators to complete worksheetHand in worksheet for assessment
Assign homework
C. Lesson 3: 5-3 Direct VariationThink and Discuss – Review example from book page 225Display overhead to explain new materialModel for students example 2 page 226Group Work – Edit and solve each other’s word problems they created for homework
Hand in for assessment
D. Lesson 4: 5-4 Slope Intercept FormHand back homework problems created by students. Review and commentThink and Discuss
The slope-intercept form of a line equationDemonstrate how to graph themDisplay them on overheadHave students graph examples on their graphing calculators
Technology Group WorkHand out worksheetsHave students complete them in class using graphing calculatorsHand in for assessment
Assign Homework
E. Lesson 5: 5-5Check homework. ReviewDisplay overhead to show how they can find equation of line given 2 pointsTechnology Group Work
The Geometer’s SketchpadStudents answer questionsHand in graphs with answers for assessment
Green GlobsContest for who can get the highest score

5
Lesson 15.1 Slope
(a) Objectives: 1. Students will be able to calculate the slope of a line.2. They will be able to draw a line through a point with a given slope.
(b) Instructions: 1. Inform students of goals for the day2. Think and Discuss: State a problem or situation from a real-life experience toget students to think about slopes and rates of change from their backgroundknowledge.
Example: Can anyone give an example of a slope?Who has gone skiing or snowboarding?Wouldn't the hill you go down be a slope?Don't you think it's important to be able to measure the slope todetermine whether a hill should be labeled, easy, intermediate, orexpert? We will discover how they would do that.
3. Instructional Portion:~ Refer to overhead #1. Ask the students to take a moment and copydown the notes and draw the graphs. Can anyone find the slope of theline for the first graph on the overhead?~ Explain all new material on the overhead.
4. Group Practice:~ Hand out blank graph paper to each student.~ Refer back to original ski slope problem - You are at the top of amountain and want to snowboard down. When you are at the top you are1000 feet from the bottom. On this run, you have to travel 400 feet to getacross the mountain to reach the bottom. What is the slope of themountain?~ Have students draw and label their axes. Determine what the intervalswill be for the tick marks on your axes. Mark and label on your graph thetwo points that we are given in the problem. Draw the line through thepoints and calculate the slope of that line.
5. Independent Practice: Homework p 217, 3-25 odd numbers only.

6
Lesson 1 - Overhead 15.1 Slope
~ The mathematical term to describe steepness is slope.
~ Counting units to find slope:
Slope = vertical change (rise) horizontal change (run)
~ Draw examples of slope -
A line with a positive slope A line with a negative slopegoes upward and to the right. goes downward from left to right.
The slope of a horizontal line is 0. The slope of a vertical line is undefined.
~ You can use any two coordinates of a line to find the slope of the line.
vertical change Y2 - Y1Slope = horizontal change X2 - X1 where x does not = 0
~ Example : (X2,Y2) = (4,3)(X1,Y1) = (-1,1)
Slope = 3 - 1 = 24-(-1) 5
.

7
Lesson 1 - Overhead 2
8
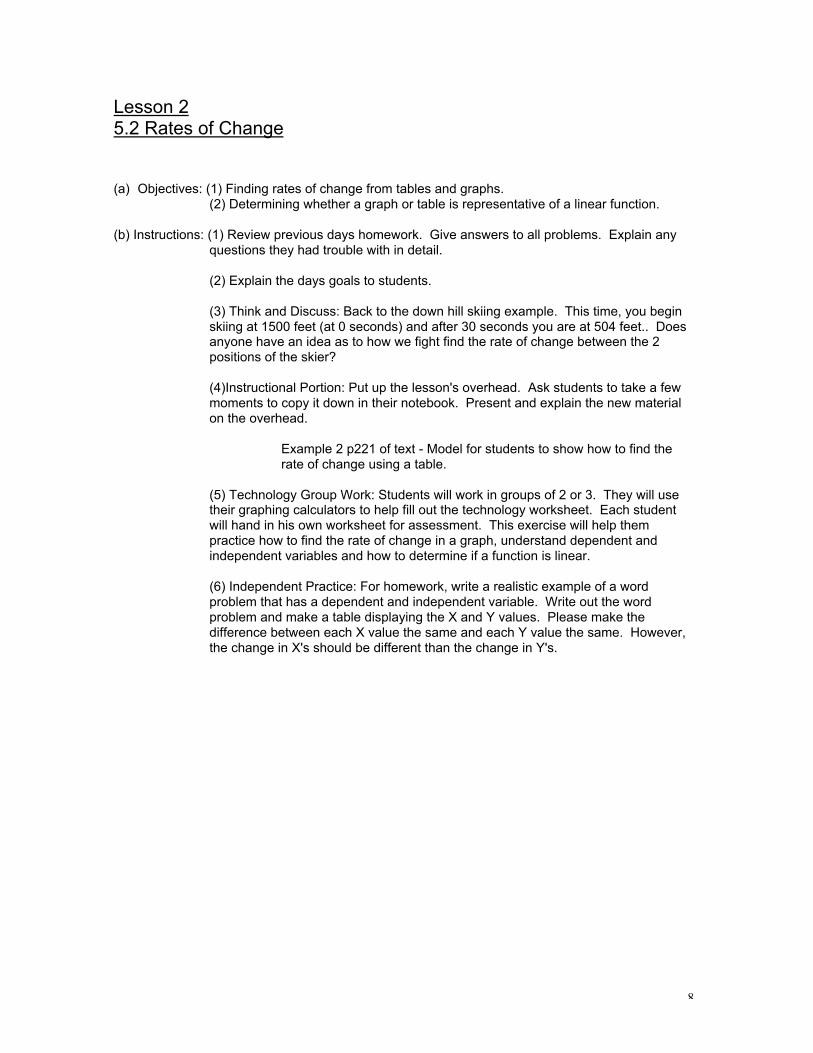
Lesson 25.2 Rates of Change
(a) Objectives: (1) Finding rates of change from tables and graphs.(2) Determining whether a graph or table is representative of a linear function.
(b) Instructions: (1) Review previous days homework. Give answers to all problems. Explain any questions they had trouble with in detail.
(2) Explain the days goals to students.
(3) Think and Discuss: Back to the down hill skiing example. This time, you beginskiing at 1500 feet (at 0 seconds) and after 30 seconds you are at 504 feet.. Doesanyone have an idea as to how we fight find the rate of change between the 2positions of the skier?
(4)Instructional Portion: Put up the lesson's overhead. Ask students to take a fewmoments to copy it down in their notebook. Present and explain the new materialon the overhead.
Example 2 p221 of text - Model for students to show how to find therate of change using a table.
(5) Technology Group Work: Students will work in groups of 2 or 3. They will usetheir graphing calculators to help fill out the technology worksheet. Each studentwill hand in his own worksheet for assessment. This exercise will help thempractice how to find the rate of change in a graph, understand dependent andindependent variables and how to determine if a function is linear.
(6) Independent Practice: For homework, write a realistic example of a wordproblem that has a dependent and independent variable. Write out the wordproblem and make a table displaying the X and Y values. Please make thedifference between each X value the same and each Y value the same. However,the change in X's should be different than the change in Y's.

9
Lesson 2 - Overhead 35.2 Rates of Change
~ The rate of change allows you to see the relationship between two quantities that are changing.
Change in the dependent variable~ Rate of Change = Change in the independent variable
~ On a graph: The dependent variable is on the vertical axis (Y-axis).The independent variable is on the horizontal axis.The slope of the line is the rate of change relating the variables.
~ Linear Functions - The graph of a linear function is a straight line. You can also use a table todetermine whether the relationship between sets of data is linear.
A function is linear if the rate of change between consecutive pairs of data is thesame. Such as the table below which shows the difference between each X valueis 3 and the difference between each Y value is 2. It does not change. Using theformula above for rate of change we can compute the rate of change from thistable is 2/3.
X Y0 13 36 59 7
10
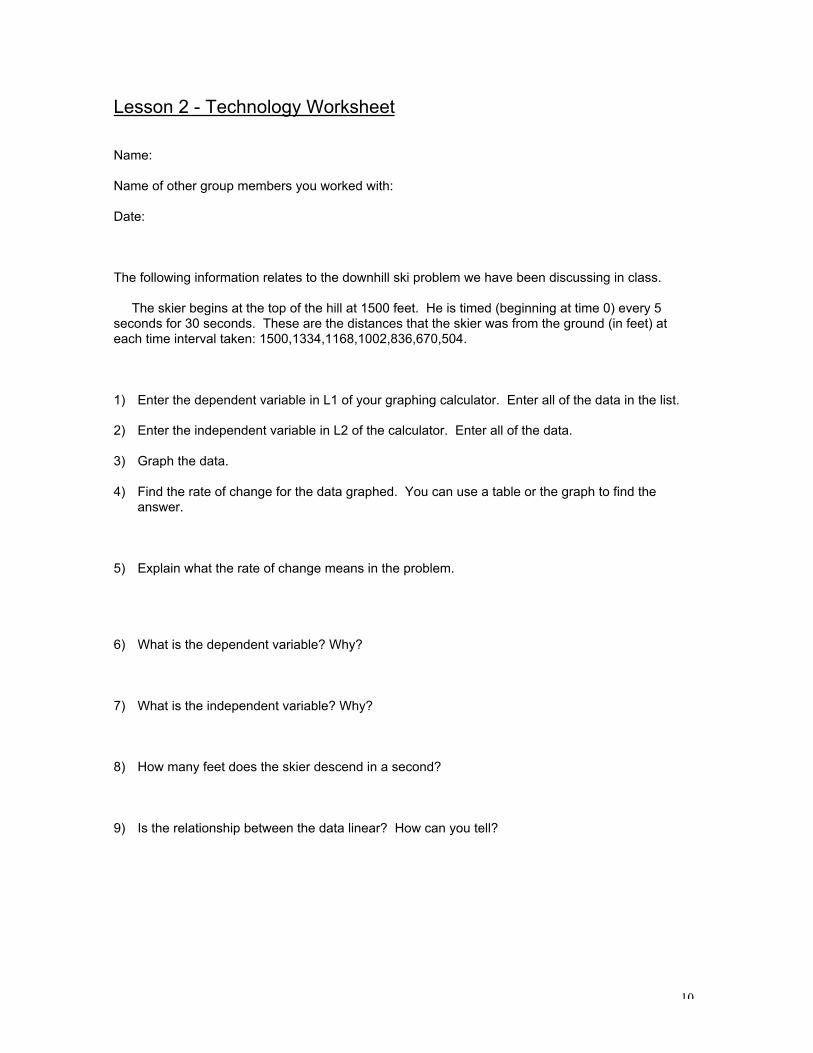
Lesson 2 - Technology Worksheet
Name:
Name of other group members you worked with:
Date:
The following information relates to the downhill ski problem we have been discussing in class.
The skier begins at the top of the hill at 1500 feet. He is timed (beginning at time 0) every 5seconds for 30 seconds. These are the distances that the skier was from the ground (in feet) ateach time interval taken: 1500,1334,1168,1002,836,670,504.
1) Enter the dependent variable in L1 of your graphing calculator. Enter all of the data in the list.
2) Enter the independent variable in L2 of the calculator. Enter all of the data.
3) Graph the data.
4) Find the rate of change for the data graphed. You can use a table or the graph to find theanswer.
5) Explain what the rate of change means in the problem.
6) What is the dependent variable? Why?
7) What is the independent variable? Why?
8) How many feet does the skier descend in a second?
9) Is the relationship between the data linear? How can you tell?

11

12
Lesson 3:5-3 Direct Variation
(a) Objectives: (1) Relate the slope to constant of variation(2) Use constant of variation to solve problems
(b) Instructions: (1) State the days goals to students.
(2) Think and Discuss: Open the text to page 225 and refer to the table on thepage. Can anyone tell what the rate of change is for the data in the table? Whoknows what the slope of the line in the graph is? What do you suppose therelationship is between the rate of change, the slope, and the coefficient of X inthe function rule?
(3) Instructional presentation: Display overhead. Ave students take a fewmoments to copy the information into their notebook.
(4) Teacher will review and explain all new concepts on overhead.
(5) Modeling: Teacher will review example 2, page 226 from the text with thestudents to relate constant variation to real world situations. The example is alsoon the overhead.
(c) Group Work: (1) Arrange the class into groups of 4 students per group. Have them pull out theword problem they created for homework. Ask them to exchange their problemwith a member from their group for editing. Editors use the following guidelines:
~ Make sure they have a dependent variable, an independentvariable. And a table set up with all data.~ Make sure the data for all X values has the same rate of change,and the Y values have the same rate of change.~ The problem must contain all necessary information and be realistic.
(2) Give the word problems back to the writers and have them make anynecessary adjustments. Then, exchange the word problem with another memberfrom their group and have them solve the problem.
(3) Assist students when needed. All students must hand in their problem and thesolution for assessment.

13
Lesson 3 -Overhead 45.3 Direct Variation
~ A direct variation is a linear function that can be written in the form Y=KX, where K does not=0.
~ The function rule for a linear function is called a linear equation.
~ When X=0 for Y=KX, then Y=0 means that a direct variation will pass through the origin (0,0).
~ The constant of variation K, equals the rate of change of the data and the slope of the line thatgraphs the equation.
~ Example 2, page 226 from the text:
The time it takes you to hear thunder varies directly with your distance from the lightning. Ifyou are 2 miles from where the lightning strikes, you will hear thunder about 10 secondsafter you see the lightning. Write an equation for the relationship between time anddistance.
- Define Variables: X = your distance in miles from the lightning.Y= the number of seconds between seeing lightning and hearingthunder.
- Relate: The time varies directly with the distance when X=2 and Y=10.- Write: Y = KX (general formula for a direct variable)
10 = K (2) - substitute 2 for X and 10 for Y10/2 = 2K/2 - solve for K5 = K - substitute 5 for K to write an equation Y = 5X.
*The equation Y = 5X relates the distance X in miles you are from lightning to the time Y inseconds, it takes you to hear the thunder.
*Question: Use this equation to find about how far you are from lightning if you hear thunder7 seconds after you see lightning.

14
Lesson 45-4 Slope-Intercept Form
(a) Objectives: Use the slope and Y-Intercept to draw graphs and write equations.
(b) Instruction: (1) Hand back homework word problems from previous lesson. Comment on anygeneral problems students had when writing or solving them.
(2) State the days goals to students.
(3) Think and Discuss:~ The point where a line crosses the Y-axis is the Y-intercept.~ The slope-intercept form of a linear equation is Y = MX + b, where m is theslope and b is the Y-intercept.~ Ask students to graph the following formulas on their graphing calculators:Y = 1/2X, Y = X and Y = 5X. Display equations all on one graph on theoverhead.~ Ask students, by looking at their graphs and comparing the lines, how doesthe coefficient of X affect the graph of an equation. Discuss. Ask them tochange some of their X coefficients and see what the results are.~ Graph there 3 equations on their graphing calculator: Y = 2X, Y = 2X + 3,and Y = 2X – 4. Display all three lines on one graph on the overhead.~ Ask students to identify where each line crosses the Y-axis.~ These equations are in the form Y = MX + b. What effect does the value ofb have on the graph of an equation? Discuss.
(4) Group Work/Technology: Hand out worksheets. They should complete themin class and hand them in for assessment. Teacher will assist when needed.If they are not finished, they can bring them home for homework.
(5) Independent Practice: Text p 233 1-29 odd.

15

16
Lesson 4-Worksheet name: ____________________
5-4 Slope-Intercept Form date:______________________
Using the slope and Y-intercept to graph and write equations
1) Write an equation of a line in Y = MX + b form, with the given slope and Y-intercept.
• m = 2/3, b = -5
• m = -1/2, b = 0
• m = 0, b = -2
2) Please graph the following equations on your graphing calculator. Sketch the three of themtogether on one graph in the space below.
• Y = 1/2X• Y = X• Y = 5X.
3) How does the coefficient of X affect the graph of an equation?
4) Change the value of an X coefficient from one of the equations and see what it does to it. Writethe new equation and make a quick sketch of what the new line looks like.
5) Graph 3 new equations on your graphing calculators. Sketch the three of them together on onegraph in the space below.
• Y = 2X,• Y = 2X + 3• Y = 2X - 4
6) Where does each line cross the Y-axis?
7) These equations are in the form Y = MX + b. What effect does the value of b have on the graphof an equation?

17

18
Lesson 55-5 Writing the Equation of a Line
(a) Objectives: Students will be able to write an equation given 2 points from a graph or table.
(b) Instruction: (1) Check homework. Give students answers. Go over any they did notunderstand.
(2) State goals of the day for students.
(3) Ask students to copy all notes on overhead. Refer to overhead to show how towrite an equation manually, given 2 points.
(4) Technology Group Work:~ Have each student working on a computer with The Geometer’s Sketchpad.Demonstrate how you can enter two points in the program and the graph of theline and its equation are electronically calculated for you.~Assignment: Ask students to graphs lines for the following points on differentgraphs and print out their work. Then, next to each graph they should answer thequestions that follow.
1) Points (6,0) and (-10, 1). What is the formula of the line?2) Points (0,0) and (6,6). What is the formula of the line? What is special about
this graph?3) Points (3,0) and (3,7). What is the formula of the line? Why do you think the
formula is described that way?4) What is the equation of the Y-axis?5) What is the equation of the X-axis?6) What are the slopes of these 2 lines? Why?
~ When they are finished direct them to the Green Globs program. Theinstructions are written right into the program. Explain that the object of the gameis to hit as many green globs as possible with each shot. In order to do this, youmust write the equation of a line you think would go through the points where thegreen globs are. The game ends when all the green globs are gone. The methodof point scoring is listed.~ There is a contest for the person in the class who has the most points wheneveryone is finished. Keep a tally, until the period is over. Bonus points for thewinner.~ Ask students to print out some samples of their equations and hand in beforethey leave.

19
Lesson 5 - Overhead 55-5 Writing the Equation of a Line
Writing an equation given 2 points from a graph or table:Example, (3,4) and (-2,1)
Step 1 - Use the coordinates of two points to find the slope of the line.
Y2 - Y1 4 -1 3Slope = X2 - X1 = 3-(-2) = 5
Step 2 - Find the Y-intercept.
Y = MX + b
4 = 3/5(3) + b *plug in a point and the slope.
4 = 9/5 + b *solve for b.
2 1/5 = b
Step 3 - Substitute the values you have found in the original formula.
Y = 3/5X + 2 1/5
*You can also write a linear equation from data in a table. Two sets of data have a linearrelationship if the rate of change between consecutive pairs of data is the same.
Example (p 237):X Y-1 43 65 79 9
Step 1 - Find the rate of change for consecutive ordered pairs. (-1,4) to (3,6), (3,6) to(5,7) and (5,7) to (9,9).
Answers = _, _ and _.
*Therefore, the relationship is linear. The rate of change equals the slope, so theslope is _.
Step 2 – Find the Y-intercept and write an equation
Y = MX + b4 = _(-1) + b *substitute any point from the table in for
x and y, and _ for M.4 = -1/2 + b4 _ = b *now substitute b back into original
equation with x ,y and the slope.Y = 1/2X + 4 _

20

21

22