Embed Size (px)
Citation preview
GRAPHICAL USER INTERFACE FOR SIGNAL GENERATOR
MUHAMMAD LOKMAN AL-HAKIM BIN ABU BAKAR
Universiti Malaysia Pahang
viii
ABSTRACT
Graphical User Interface (GUI) for Signal Generator is a project MATLAB
software base. Its objective is to generate signal using MATLAB and then can be verify
using oscilloscope. MATLAB includes high-level commands for two-dimensional and
three-dimensional data visualization, image processing, animation, and presentation
graphics. GUIDE is the tools in MATLAB graphical user interface development
environment, provides a set of tools for creating GUIs. The fundamental power of GUIs
is that they provide a means through which individuals can communicate with the
computer without programming commands. This project divides in two phase, software
phase and hardware phase. Software phase, develop Graphical User Interface using
MATLAB, interface boxes, syntax for user application to generate and display desired
graphical signal. This MATLAB GUI-based program offer user only using mouse clicks
(or possibly keyboard input) for any GUI element to display programmed wave form
and generate signal. Hardware phase, develop hardware using MAX232 as an interface
to pass information between output from computer to oscilloscope for measurement and
comparison purpose. Output port is serial port using DB9 interface.
1
Chapter 1
Introduction
1.1 The Soft Scope
In educational field, especially for electrical engineering course, the function of
function generator is very important to the student. A lot of assessment are using
function generator to generate pulse and signal; completing their syllabus that were
applied in industries and engineering field.
But there is a limitation of spaces, time and devices that can interrupt the
teaching and learning process. Also the function generators it self is that costing in the
term of its value and maintenances.
An alternative for this situation, within this Engineering Project the title
‘Graphical User Interface for Signal Generator’ is proposed. This Project will use
MATLAB® GUI as main engine to generate signal that can replace the application of
function generator.
Wider awareness of these new methods of generating signal will be of great
benefit to those who work in the area of signal processing especially to student and
industry. It also has commercialized value.
Within this thesis the creation of MATLAB GUI (Graphical User Interface) for
generating or processing signal is proposed. The development of the GUI will increase
exposure for this method, which will help to spread valuable information throughout the
engineering, mathematical and scientific communities. It will also provide an intuitive,
easy-to-use interface to generate simple signal.
Graphical User Interfaces are a common sight in the digital age. They have
become ubiquitous to the point of being invisible. They are used every day without
2
being noticed, on ATM’s, websites and PC’s. GUI’s provide a pictorial faceplate that
allows users to call various functions and edit their parameters without ever touching a
program’s actual code. GUI’s are the bridge that connects computer code to something
everyday users can utilize [1-Matcovic].
MATLAB, a product of The MathWorks, Inc., is a program widely used
throughout the target community. MATLAB, or Matrix Laboratory, is used for
“mathematical computation, analysis, visualization, and algorithm development.” [2-
www.mathworks.com/products]. The use of MATLAB to develop the GUI will allow
its use on multiple operating platforms, including Windows and Linux, thereby
increasing its versatility.
The GUI will provide an interface between the MATLAB user and the
application of the soft function generator. Thus, the user will not need to have a
complete knowledge of command-line level MATLAB programming to effectively
utilize the graphical user interface MATLAB. In this way, knowledge and use of these
applications will greatly increase, to the benefit users.
Within this thesis, a GUI is created for generating signal as sinusoid, linear, and
pulse. Mathematical equation as the signal function and the user could select the
application; that is using the button or key in the equation for the signal generation.
Output from this function then can be measured using Oscilloscope via PIC 16F877A.
1.2 Scope of Project
This project divided into two parts, part 1 is implementing MATLAB software as
graphical user interface. Part 2 is the output from MATLAB, interface between output
from computer to oscilloscope for measurement, comparison and analysis purpose.
3
1.2.1 Part 1.
Develop software. MATLAB 7.1 is as the main software for this project. Create
MATLAB M-file for Graphical User Interface to write the script and function files,
interface boxes, function for user application to generate desired signal. Mathematical
functions syntax is written at the functions for callback function and generating signal.
The generated signal wave form will be displayed at GUI window after the user clicking
the selected button. Then the generated output will be transfer using serial port.
Construct serial port object as the output port for the generated signal.
1.2.2 Part 2.
Develop hardware. Interface between output from computer to oscilloscope for
measurement, comparison and analysis purpose. From the serial port, IC MAX232 used
to amplify the signal. Output from the IC MAX232 then can be measured through
oscilloscope. Two LED diode used as indicator, which is blinking when sending data
and another blinking if there is receiving input data.
1.3 Problem Statement
Function Generator is an expensive electrical device whether its price or
maintenance. Thus this soft function generator is software without costing of
maintenance because it can be easily duplicated and modify.
Nowadays function generator just provide some type of signal, limited to
sinusoidal, square and sawtooth signal waveform. It also has to use additional hardware
to analysis the output waveform. MATLAB GUI soft function generator can be modified
to create any type of signal as the user desired and MATLAB offer the function that user
can analysis the signal mathematical algorithm without additional hardware.

4
1.4 Objective
The objective of this project is to gain output signal using MATLAB GUI replacing
function generator.
The objective of this Engineering Project is to generating output using
software MATLAB® GUI that can be replacing the function generator. Function
generator is an electrical device that commonly used to generate signal for experiment
purpose but it is costing. By applying ‘Graphical User Interface for Signal
Generator’, user much more easy to applying the signal in their experiments; just run
the program in user personal computer, the user interface at the desktop and clicking the
mouse rather than setting function generator manually at the lab.
1.5 Project Result
A type of signal can be generate using software MATLAB GUI same as function
generator.

5
CHAPTER 2
LITERATURE REVIEW
2.1 Introduction to Graphical User Interface (GUI)
Definition from dictionary, Graphical User Interface is a way of arranging
information on a computer screen that is easy to understand and use because it uses
icons, menus and a mouse rather than only text [1].
According www.mathwork.com, a graphical user interface (GUI) is a
pictorial interface to a program. It shows graphical display that contains devices, or
components, that enable a user to perform interactive tasks [7]. A good GUI can
make programs easier to use by providing them with a consistent appearance and
with intuitive controls like pushbuttons, list boxes, sliders, menus, and so forth [3]. A
graphical User interface (GUI) is a system of graphical elements that allow a user to
interact with software using mouse application [5]. The GUI should behave in an
understandable and predictable manner, so that a user knows what to expect when
user performs an action. For example, when a mouse click occurs on a pushbutton,
the GUI should initiate the action described on the label of the button [3]. MATLAB
GUI is Script files that have interaction with the user by using Windows. In
MATLAB, a GUI can also display data in tabular form or as plots, and can group
related components [7]. MATLAB offers you a variety of data plotting functions plus
a set of GUI tools to create, and modify graphic displays. The GUI tools afford most
of the control over graphic properties and options that typed commands such as
annotate, get, and set provide [7]. The Graphical User Interface, or GUI, refers to the

6
now universal idea of icons, buttons, etc., that are visually presented to a user as a
“front-end” of a software application [6].
2.2 Using MATLAB GUI
A graphical user interface provides the user with a familiar environment in
which to work [3]. This environment contains pushbuttons, toggle buttons, lists,
menus, text boxes, and so forth, all of which are already familiar to the user, so that
the user can concentrate on using the application rather than on the mechanics
involved in doing things [3]. MATLAB includes high-level commands for two-
dimensional and three-dimensional data visualization, image processing, animation,
and presentation graphics [10]. However, GUIs are harder for the programmer
because a GUI-based program must be prepared for mouse clicks (or possibly
keyboard input) for any GUI element at any time [3]. Such inputs are known as
events, and a program that responds to events is said to be event driven [3]. The
fundamental power of GUIs is that they provide a means through which individuals
can communicate with the computer without programming commands [6].
2.3 Three principal elements required to create a MATLAB Graphical User
Interface [3]:
2.3.1 Components. Each item on a MATLAB GUI (pushbuttons, labels,
edit boxes, etc.) is a graphical component. The types of components include
graphical controls (pushbuttons, edit boxes, lists, sliders, etc.), static elements
(frames and text strings), menus, and axes. Graphical controls and static
elements are created by the function uicontrol, and menus are created by the
functions uimenu and uicontextmenu. Axes, which are used to display
graphical data, are created by the function axes [3]. User graphical elements
that serve no other purpose than to allow the user to interact (visual bottons,
switches, knobs, sliders, popup menus, and so on) [5].

7
2.3.2 Figures. The components of a GUI must be arranged within a figure,
which is a window on the computer screen. In the past, figures have been
created automatically whenever we have plotted data. However, empty
figures can be created with the function figure and can be used to hold any
combination of components [3]. Use graphical elements that perform a dual
function: display data and interaction. For example, a plotted line can both
display data and can alter data when a user click on the line drag it on a new
position [5]. Use mouse downs, drags, and mouse ups anywhere within the
figure to perform an action [5].
2.3.3 Callbacks. Finally, there must be some way to perform an action if a
user clicks a mouse on a button or types information on a keyboard. A mouse
click or a key press is an event, and the MATLAB program must respond to
each event if the program is to perform its function. For example, if a user
clicks on a button, that event must cause the MATLAB code that implements
the function of the button to be executed. The code executed in response to an
event is known as a call back. There must be a callback to implement the
function of each graphical component on the GUI [3].
Figure 2.0: Lay out of MATLAB GUI [4].

8
2.4 MATLAB GUIDE
GUIDE is the tools in MATLAB graphical user interface development
environment, provides a set of tools for creating graphical user interfaces (GUIs) [3].
These tools simplify the process of programming layout the components on a figure.
The size of the figure and the alignment and spacing of components on the figure can
be adjusted using the tools built into guide [3]. This tool allows a programmer to
layout the GUI, selecting and aligning the GUI components to be placed in it. Once
the components are in place, the programmer can edit their properties: name, color,
size, font, text to display, and so forth. When guide saves the GUI, it creates working
program including skeleton functions that the programmer can modify to implement
the behavior of the GUI [3].
When guide is executed, it creates the Layout Editor, shown in Figure 1[7].
The large white area with grid lines is the layout area, where a programmer can
layout the GUI. The Layout Editor window has a palate of GUI components along
the left side of the layout area. A user can create any number of GUI components by
first clicking on the desired component, and then dragging its outline in the layout
area. The top of the window has a toolbar with a series of useful tools that allow the
user to distribute and align GUI components, modify the properties of GUI
components, add menus to GUIs [3].
Three special functions are used occasionally in the design of callback
functions: gcbo, gcbf, and findobj. Function gcbo (get callbackobject) returns the
handle of the object that generated the callback, and function gebf (get
callbackfigure) returns the handle of the figure containing that object. These
functions can be used by the callback function to determine the object and figure
producing the callback, so that it can modify objects on that figure. Function findobj
searches through all of the child objects within a parent object, looking for ones that
have a specific value of a specified property. It returns a handle to any objects with
the matching characteristics. The most common form of findobj is where parent is
the handle of a parent object such as a figure, 'Property' is the property to examine,
and 'Value' is the value to look for. For example, suppose that a programmer would
like to change the text on a pushbutton with the tag 'Buttonl' when a callback
function executes [3].
9
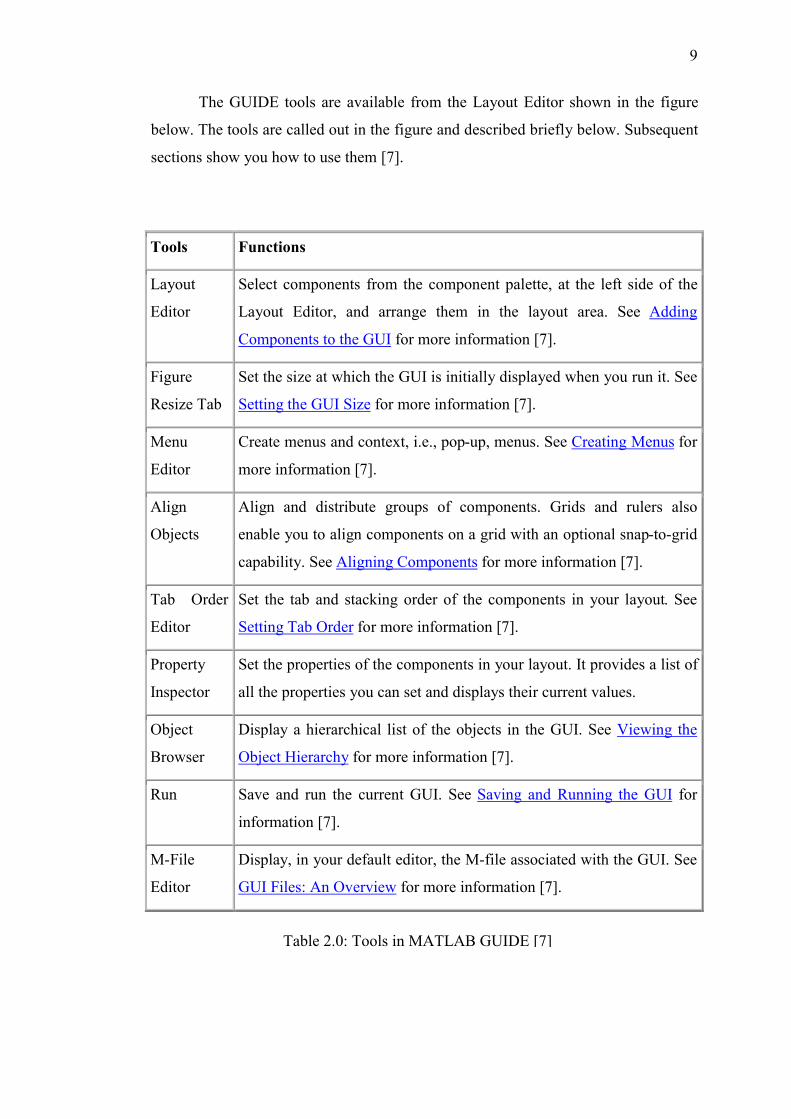
The GUIDE tools are available from the Layout Editor shown in the figure
below. The tools are called out in the figure and described briefly below. Subsequent
sections show you how to use them [7].
Tools Functions
Layout
Editor
Select components from the component palette, at the left side of the
Layout Editor, and arrange them in the layout area. See Adding
Components to the GUI for more information [7].
Figure
Resize Tab
Set the size at which the GUI is initially displayed when you run it. See
Setting the GUI Size for more information [7].
Menu
Editor
Create menus and context, i.e., pop-up, menus. See Creating Menus for
more information [7].
Align
Objects
Align and distribute groups of components. Grids and rulers also
enable you to align components on a grid with an optional snap-to-grid
capability. See Aligning Components for more information [7].
Tab Order
Editor
Set the tab and stacking order of the components in your layout. See
Setting Tab Order for more information [7].
Property
Inspector
Set the properties of the components in your layout. It provides a list of
all the properties you can set and displays their current values.
Object
Browser
Display a hierarchical list of the objects in the GUI. See Viewing the
Object Hierarchy for more information [7].
Run Save and run the current GUI. See Saving and Running the GUI for
information [7].
M-File
Editor
Display, in your default editor, the M-file associated with the GUI. See
GUI Files: An Overview for more information [7].
Table 2.0: Tools in MATLAB GUIDE [7]

10
2.5 Oscilloscope
The oscilloscope is a tool commonly used by engineers and technicians to
analyze and troubleshoot electronic systems. In addition, real signals, such as those
which carry voice or data, can be very complex and difficult to analyze [9].
The oscilloscope is basically a graph-displaying device - it draws a graph of
an electrical signal. In most applications the graph shows how signals change over
time: the vertical (Y) axis represents voltage and the horizontal (X) axis represents
time. The intensity or brightness of the display is sometimes called the Z axis. This
simple graph can tell many things about a signal[9]:
1. Determine the time and voltage values of a signal.
2. Calculate the frequency of an oscillating signal.
3. Analyses the "moving parts" of a circuit represented by the signal.
4. Detect the malfunctioning component is distorting the signal.
5. Analyze a signal direct current (DC) or alternating current (AC) is.
6. Analyze how much of the signal is noise and whether the noise is changing
with time.
2.6 Function Generator
The function generator is a device used to generate an electronic signal with
specific known characteristics, thereby enabling an engineer or technician to test and
examine a circuit [8].
The six waveforms that the function generator can produce are the sine wave,
the square wave, the triangle wave, two sawtooth waves, and the variable-width
pulse wave[8][9].

11
Figure 2.1: Available Generated Waveforms
There are two types of alternating-current signals waveform output from generator:
2.6.1 Periodic
2.6.2 Non-periodic
Periodic signals, such as sine or triangle waves, behave in a uniform manner
and repeat themselves over a given length of time. Each repetition of a repeating
signal is called a period or a cycle [8] [9].
2.7 Interface concept
Interface is the process of connecting devices together for changing
information. It is physical connection, the hardware and asset of rules or procedure,
the software. The person writing the program needs only to know how to use the
software driver for the input/output tasks. The process of reading input signal and
sending output signals called I/O, short form of input/output [4].
12
2.8 Example/Reference Project
Eamples project that using MATLAB GUI from other thesis, Development of
MATLAB® GUI for Signal Processing Methods for the Extraction of Non-Stationary
Sinusoids (Diana L. Matcovich, 2005) [11]. The thesis scope is about Amplitude
Phase Model (APM) which is capable of tracking an input signal that varies in
amplitude and phase. Second is the Amplitude Phase Frequency Model (APFM) that
for tracking an input signals that varies in amplitude, phase and frequency.
2.8.1 Project Theory:
“Non-linear adaptive filters” which are designed to extract “a desired signal
and estimate its amplitude, phase angle and frequency.”
2.8.2 Project Similarity
This project is using MATLAB GUI to demonstrate the potential uses of
mathematical algorithms as user interface.

13
CHAPTER3
Methodology
3.0 Introduction
In developing a project, methodologies is one of the most important element to be
consider to make sure that the development of the project is smooth and get the expected
result. A good methodologies can described the structure or the flow of the project
where by it can be the guideline in managing it. It is also to avoid the project to alter
course from the objectives that have been stated or in other words the project follow the
guideline based on the objectives.
3.1 Method of Developing GUI for Signal Generator:
3.1.1 Developing Graphical User Interface for Signal Generator using version
MATLAB 7.1. Begin to create MATLAB GUI by creating their figure
file name fig-file. By typing ‘GUIDE’ at the command window or click at
GUIDE symbol A GUIDE Quick Start window will prompt out.

14
The GUIDE Quick Start dialog will pop up and select the pre-built templates.
Select the default blank GUI template. Here user also can open exiting GUI.
Figure 3.0: MATLAB Command Window
Figure 3.1: MATLAB GUIDE Quick Start Window

15
3.1.2 The GUIDE layout editor that appears for design the layout of GUI.
GUI can be creating using collection of components available in the
pallet.
Layout Editor can be resized
Figure 3.2: Layout Editor with a blank GUI template display
Figure 3.3: Layout Editor
Component
palette
16
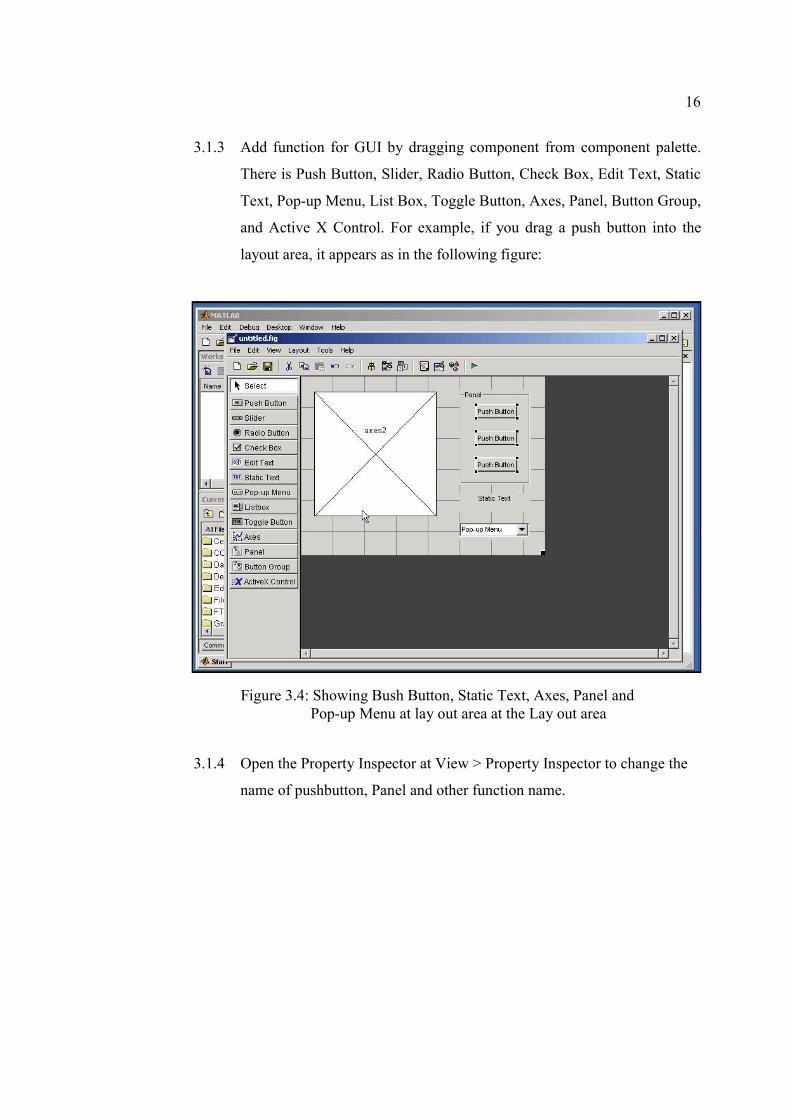
3.1.3 Add function for GUI by dragging component from component palette.
There is Push Button, Slider, Radio Button, Check Box, Edit Text, Static
Text, Pop-up Menu, List Box, Toggle Button, Axes, Panel, Button Group,
and Active X Control. For example, if you drag a push button into the
layout area, it appears as in the following figure:
3.1.4 Open the Property Inspector at View > Property Inspector to change the
name of pushbutton, Panel and other function name.
Figure 3.4: Showing Bush Button, Static Text, Axes, Panel and
Pop-up Menu at lay out area at the Lay out area
17
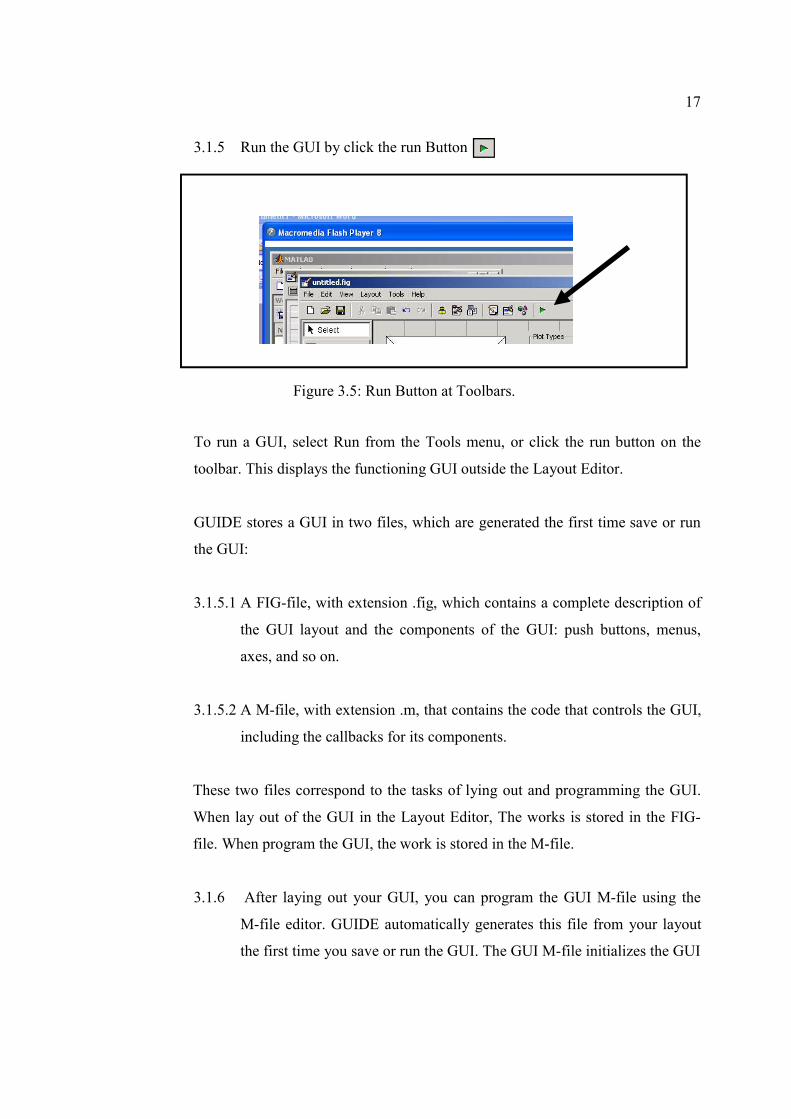
3.1.5 Run the GUI by click the run Button
To run a GUI, select Run from the Tools menu, or click the run button on the
toolbar. This displays the functioning GUI outside the Layout Editor.
GUIDE stores a GUI in two files, which are generated the first time save or run
the GUI:
3.1.5.1 A FIG-file, with extension .fig, which contains a complete description of
the GUI layout and the components of the GUI: push buttons, menus,
axes, and so on.
3.1.5.2 A M-file, with extension .m, that contains the code that controls the GUI,
including the callbacks for its components.
These two files correspond to the tasks of lying out and programming the GUI.
When lay out of the GUI in the Layout Editor, The works is stored in the FIG-
file. When program the GUI, the work is stored in the M-file.
3.1.6 After laying out your GUI, you can program the GUI M-file using the
M-file editor. GUIDE automatically generates this file from your layout
the first time you save or run the GUI. The GUI M-file initializes the GUI
Figure 3.5: Run Button at Toolbars.

18
Contains code to perform tasks before the GUI appears on the screen,
such as creating data or graphics contains the callback functions that are
executed each time a user clicks a GUI component.
Initially, each callback contains just a function definition line. Use the M-
file editor to add code that makes the component. To open the M-file,
click the M-file Editor icon on the Layout Editor toolbar.
You can view the callback for any of the GUI components by clicking the
function icon on the toolbar. This displays a list of all the callbacks,
as shown in the following figure.
Figure 3.6: List of Callback function
19
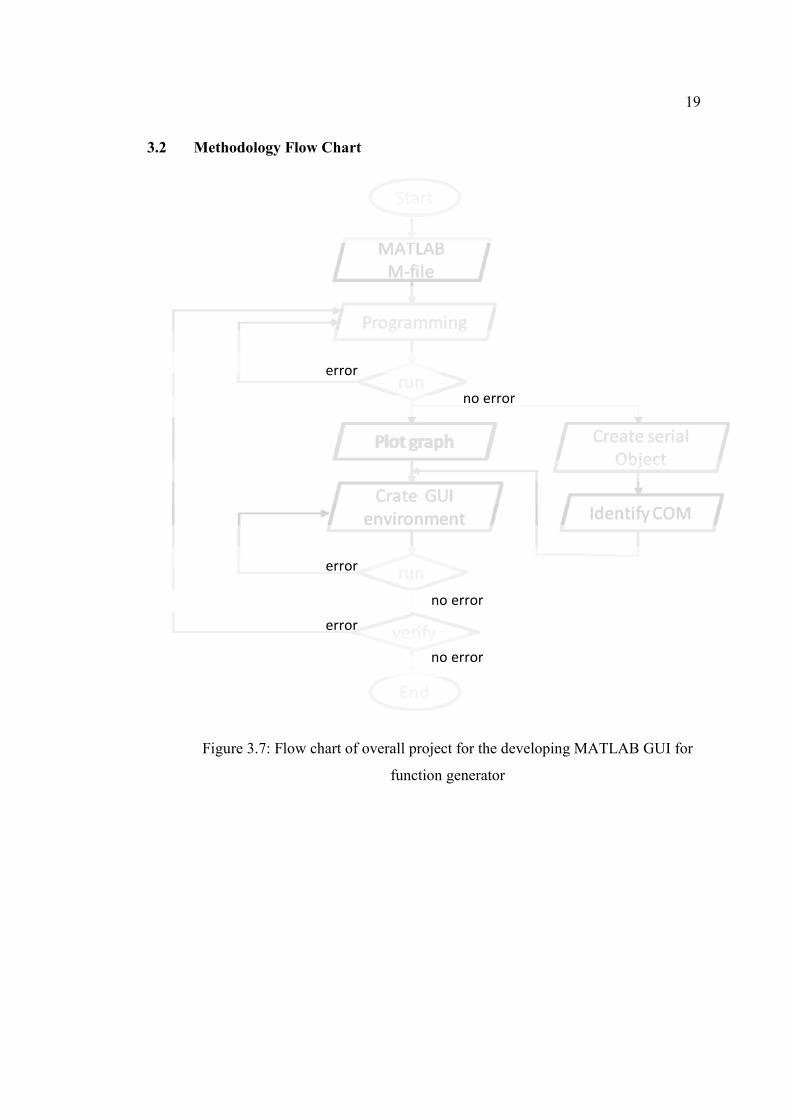
3.2 Methodology Flow Chart
error
no error
error
no error
error
no error
Figure 3.7: Flow chart of overall project for the developing MATLAB GUI for
function generator

20
3.3 Main Window
In this project, Main Window is the first GUI for user to interface with other soft
function generator. Users have to click to the six push button option to proceed the
application.
3.3.1 Main Window Figure Description
Figure 3.8: Main Window for Graphical User Interface for
Signal Generator
7 Push Button with notes is
hyperlink to other
application/function
Quit Push Button to close
Main Window
Window label
Figure 3.9: Main Window figure description

21
3.3.1.1 Waveform Example pushbutton, it is a hyperlink to Waveform example
window. At this window, user can select the six types of waveform and
it will display notes at the right side. GUI will display the graph for
selected button.
3.3.1.2 User Manipulation pushbutton, it is a hyperlink to Variable Input For
Waveform window. At this window, user can give input to the edit boxes
and click the push button to display the graph of waveform. At this
window, it is easily to define every change in amplitudes, frequency and
sampling time for selected signal wave.
3.3,1.3 Display MATLAB Syntax pushbutton, it is a hyperlink to Signal And
Equation Syntax window. At this window, user can select the six types of
waveform pushbutton. GUI will display the background MATLAB
syntax at the right side of the graph line by line.
3.3.1.4 To Serial, it is a hyperlink to create serial communication window from
this soft function generator to hardware. User can select to send
mathematical value by clicking pushbutton or sending data by filling in
the edit boxes. It has a symbol, as indicator to display the communication
status.
3.3.1.5 COM Guideline pushbutton, it is a hyperlink to Established Serial
Communication for Graphical User Interface for Signal Generator. This
window shows the guideline to create communication with serial port and
the necessary change the M-file in order to use this software.
3.3.1.6 About, it is a hyperlink to show project’s info window.
3.3.1.7 Quit pushbutton, to close Main Window.

22
3.3.2 Main Window M-File Descriptions
All programs must be written at M-file after running the FIG-file, after the
function line.
3.3.2.1 Main Window M-file
See appendix M-file for Main Window programming.
3.3.2.2 Description
Figure 3.10: Display the code for Opening Function.
Program
write here
Figure 3.11: Display the Opening Function position
23
Opening Function syntax:
movegui('center')
This syntax demonstrates the usefulness of movegui to ensure that saved
GUIs appear on screen when reloaded, regardless of the target computer's
screen sizes and resolution. The position argument can be any of the
following strings:
north - Top center edge of screen
south - Bottom center edge of screen
east - Right center edge of screen
west - Left center edge of screen
northeast - Top right corner of screen
northwest - Top left corner of screen
southeast - Bottom right corner of screen
southwest - Bottom left corner
center - Center of screen
onscreen - Nearest location with respect to current location that is on
screen
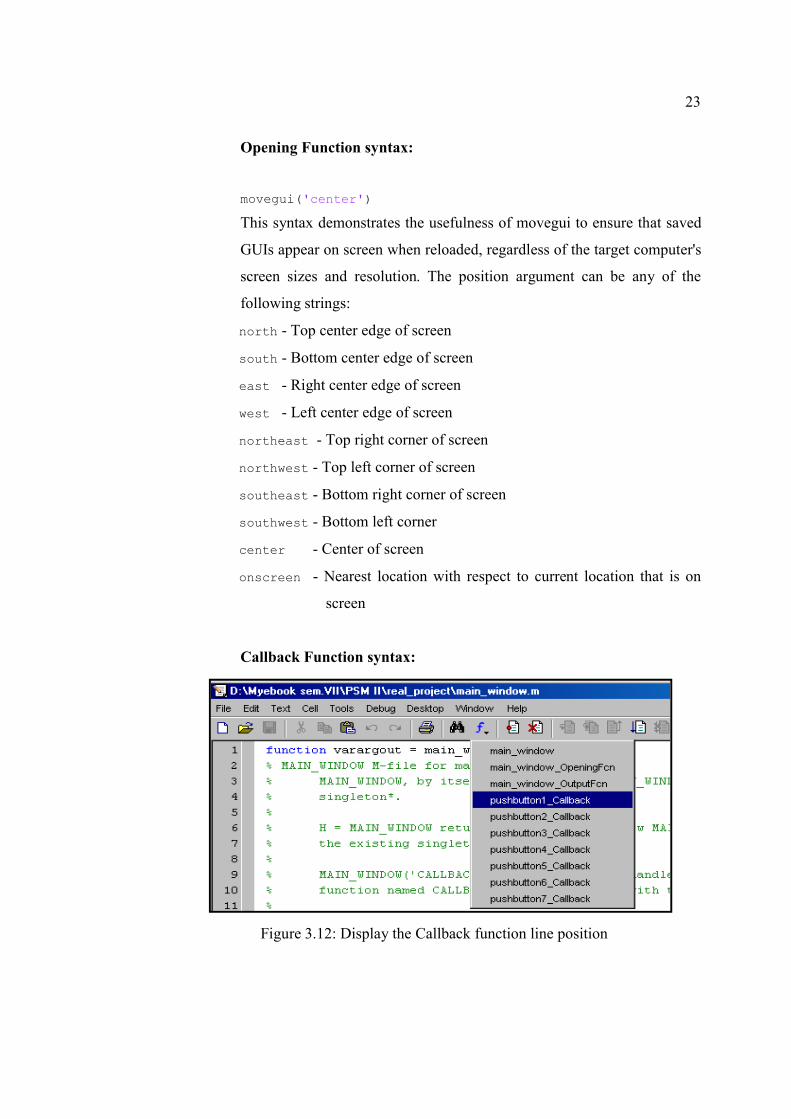
Callback Function syntax:
Figure 3.12: Display the Callback function line position

24
Callback Function syntax:
A callback is a function that executes when a user performs a specific
action such as clicking a push button or pressing a keyboard key, or when
a component is created or deleted. Each component and menu item has
properties that specify its callbacks. When you create a GUI, you must
program the callbacks you need to control operation of the GUI.
When a user activates a component of the GUI, the GUI executes the
corresponding callback. The name of the callback is determined by the
component's Tag property and the type of callback. For example, a push
button with the Tag print_button executes the callback.
Syntax:
user_response=second_sub
Description:
This is the command to call Waveform Example window that has been
named second_sub by clicking Waveform Example pushbutton at Main
Window option.
Syntax:
user_response=third_sub
Description:
This is the command to call Variable Input For Waveform window that
has been named third_sub by clicking User Manipulation pushbutton at
Main Window option.
Syntax:
user_response=fourth_sub
Description: