Embed Size (px)
Citation preview
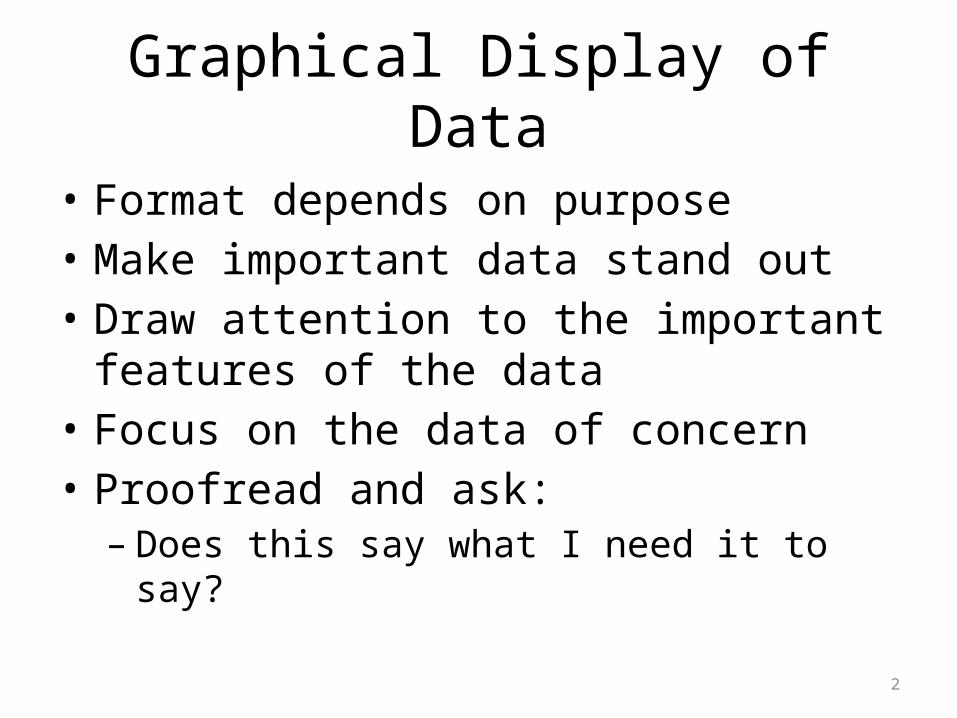
Graphical Display of Data
• Format depends on purpose• Make important data stand out• Draw attention to the important features of
the data• Focus on the data of concern• Proofread and ask:
– Does this say what I need it to say?
2
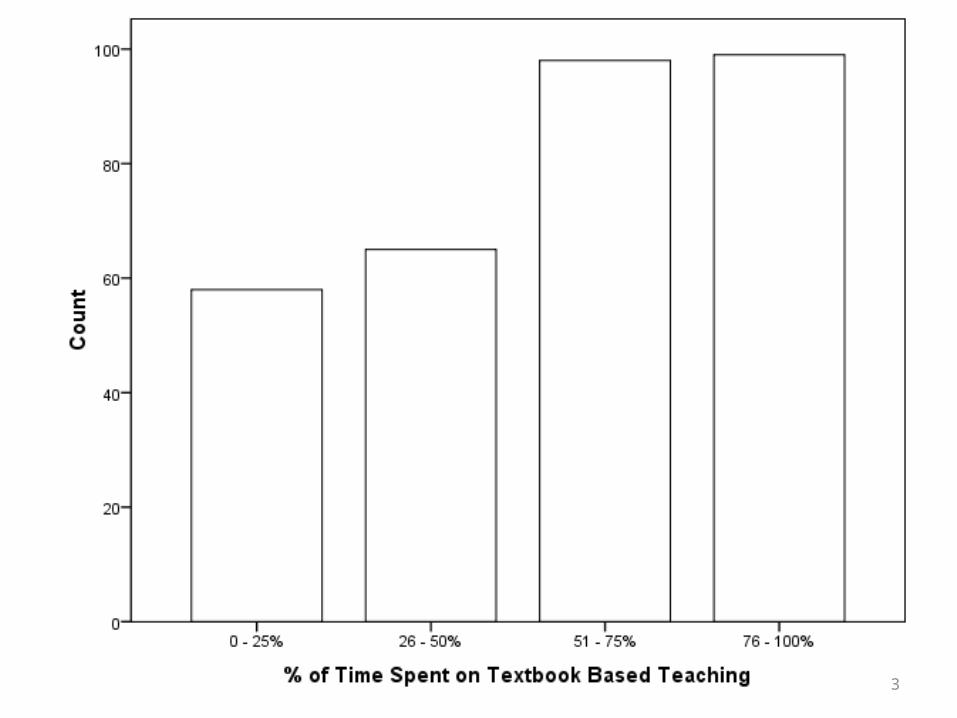
3
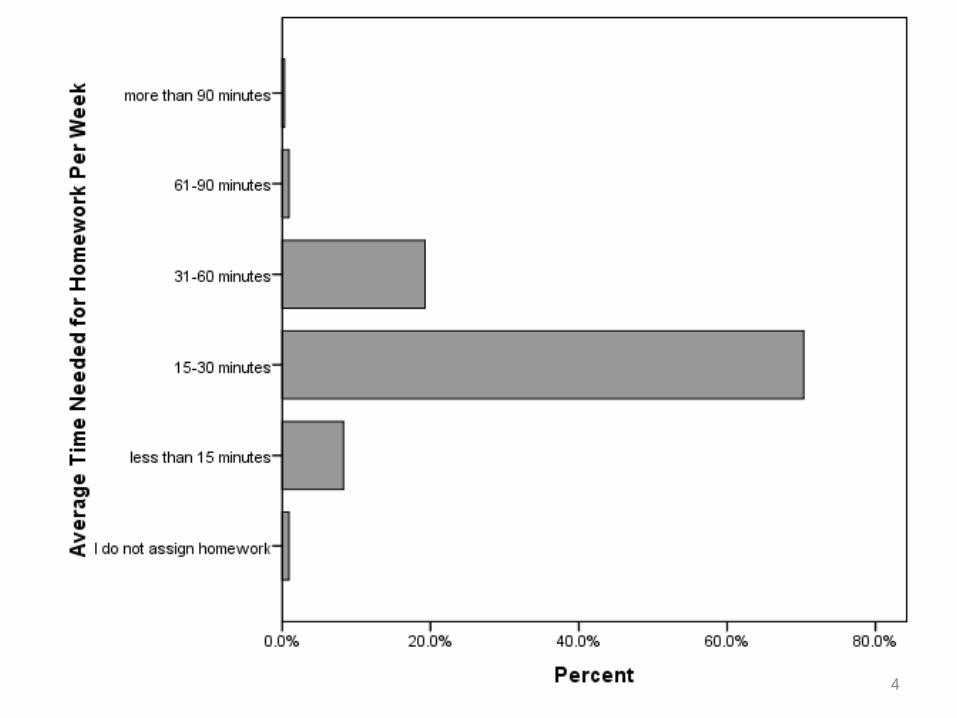
4
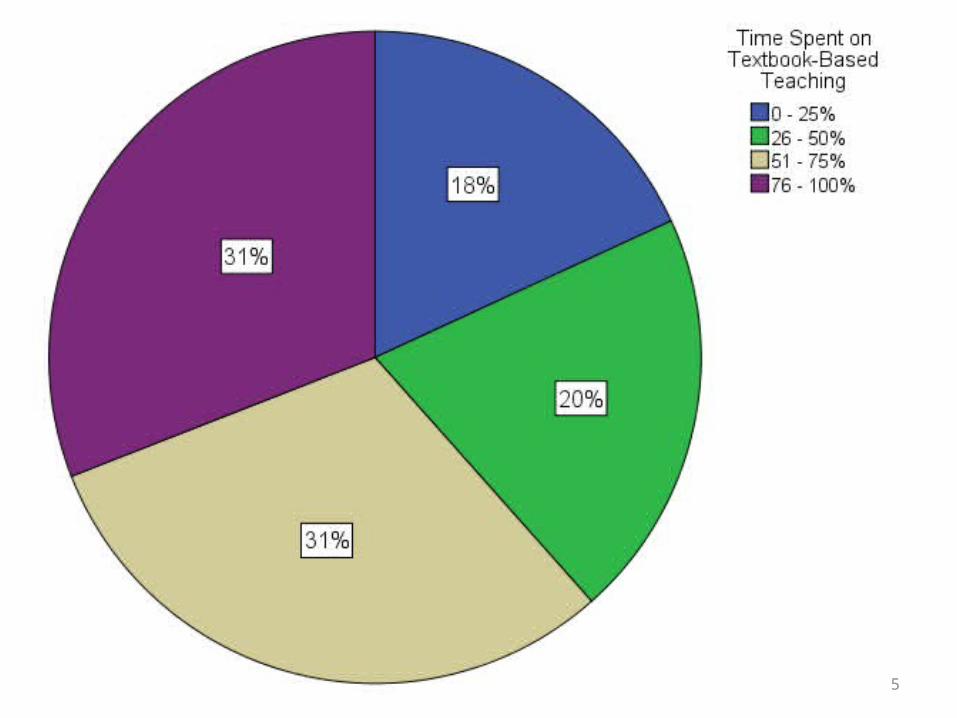
5
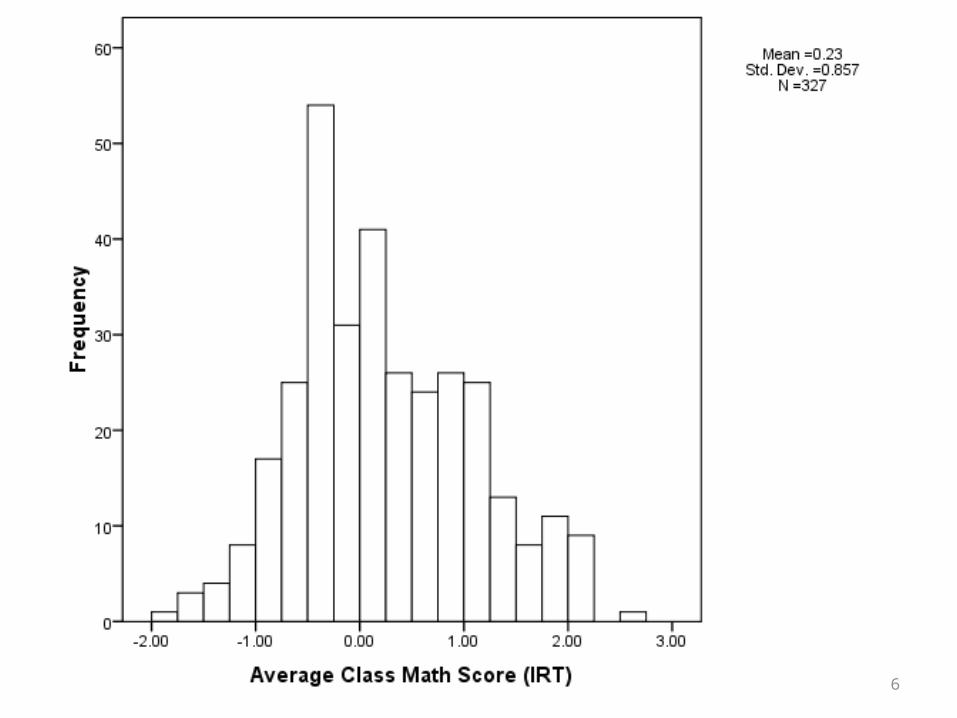
6
7
8
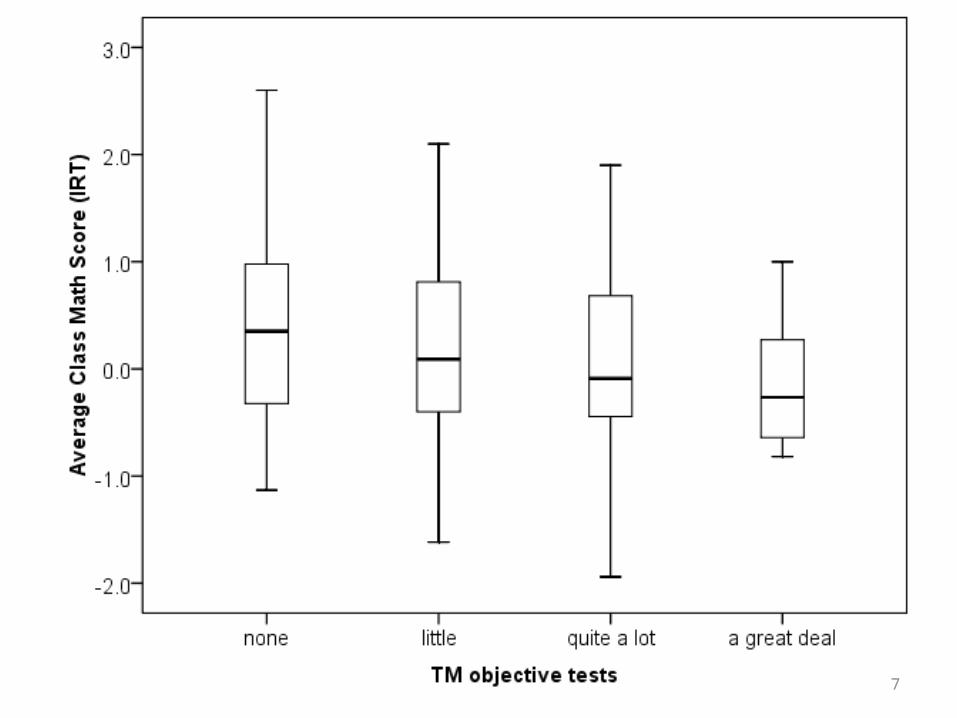
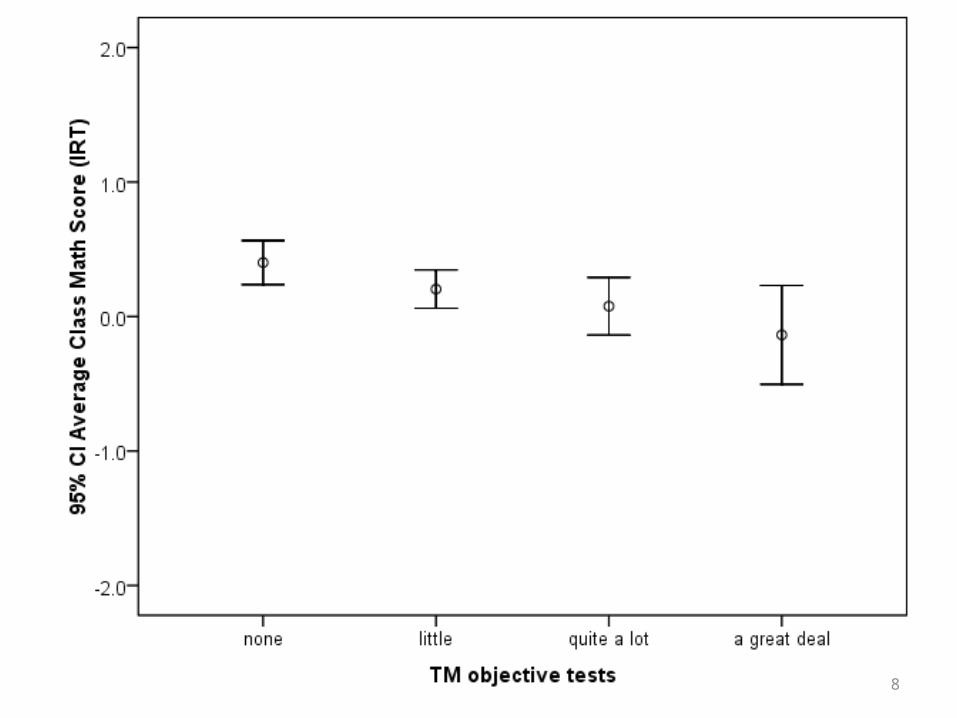
Graphs• Everything on the graph should be explained
– Title (descriptive & distinguishing, yet brief)– Labels (scale metric, categories, data points)– Legend (should also have a title)
• Items on the graph should be easily distinguished:– Design (draws focus to important data)– Shading (remains distinguishable after poor copying)– Size (legibility)
9
Graphs
• The scale should be sensible – showing the full range of possible values
• Avoid 3-D, creating distortion and false contrasts; unless you have a genuine 3rd dimension
• At a minimum, displayed scale values should be consistent across a set of graphs
• Date and source the graphs– At the bottom, place the data the graph was
produced and ID the producer10
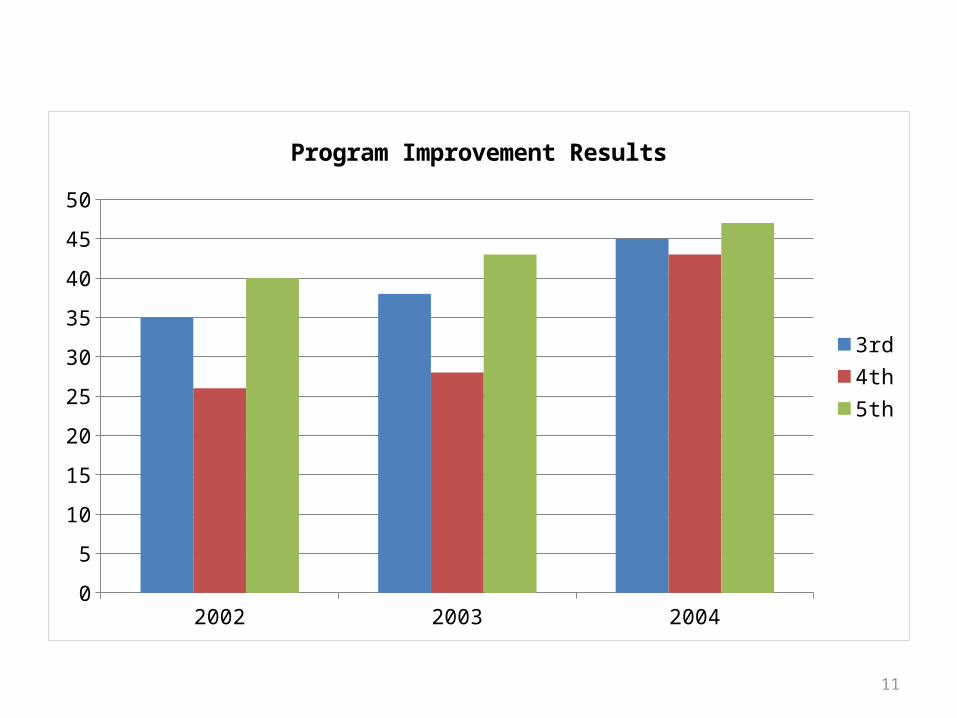
2002 2003 20040
5
10
15
20
25
30
35
40
45
50
Program Improvement Results
3rd4th5th
11
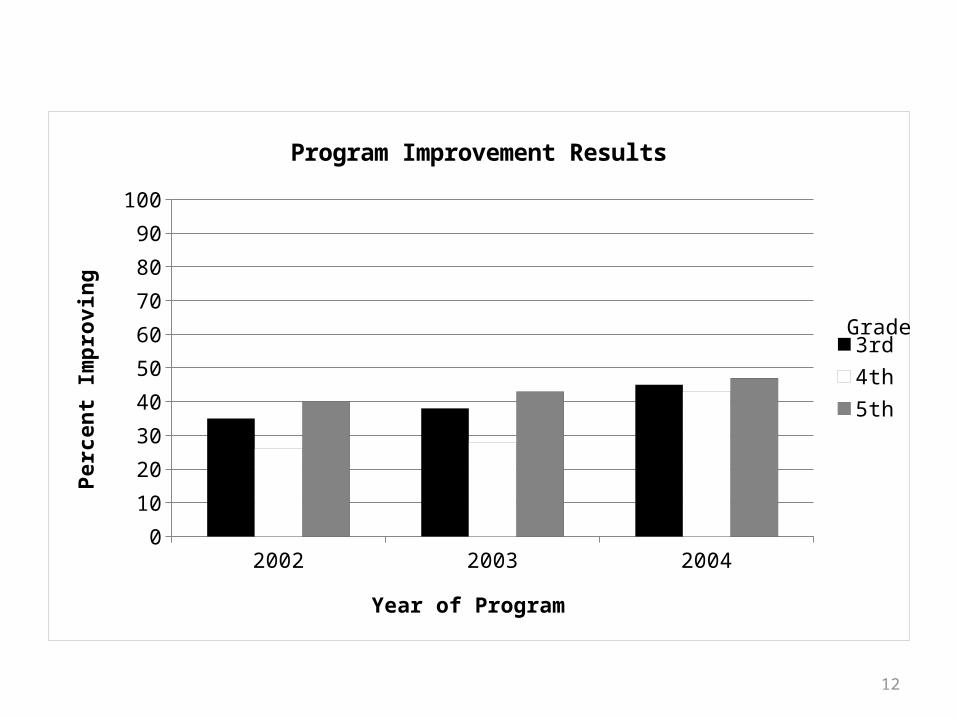
2002 2003 20040
10
20
30
40
50
60
70
80
90
100
Program Improvement Results
3rd4th5th
Year of Program
Perc
ent I
mpr
ovin
g
Grade
12
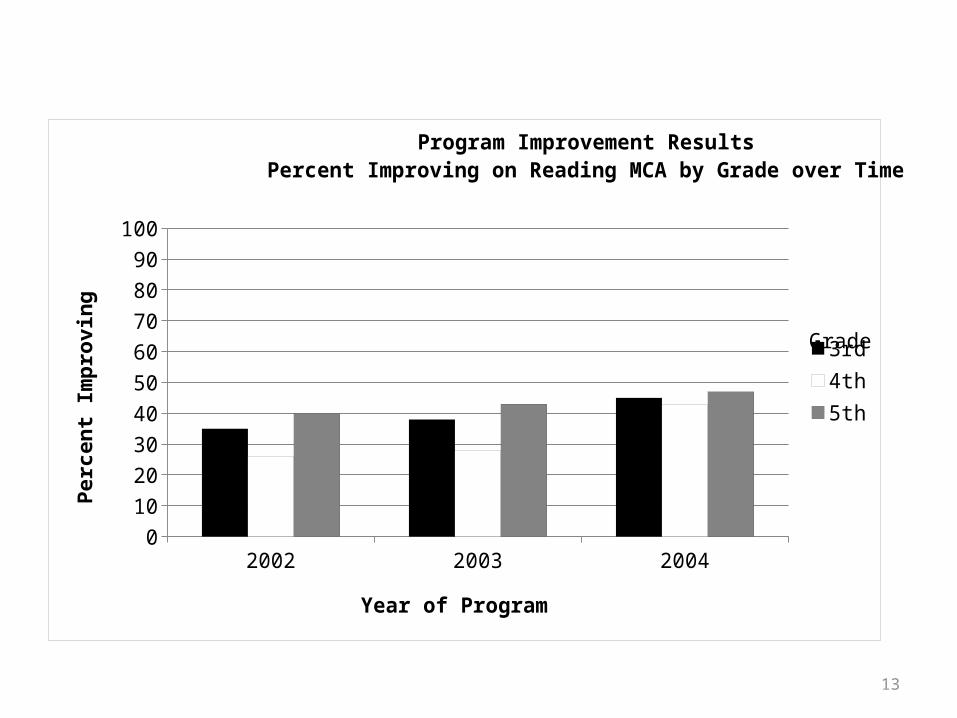
2002 2003 20040
10
20
30
40
50
60
70
80
90
100
Program Improvement ResultsPercent Improving on Reading MCA by Grade over Time
3rd4th5th
Year of Program
Perc
ent I
mpr
ovin
g
Grade
13
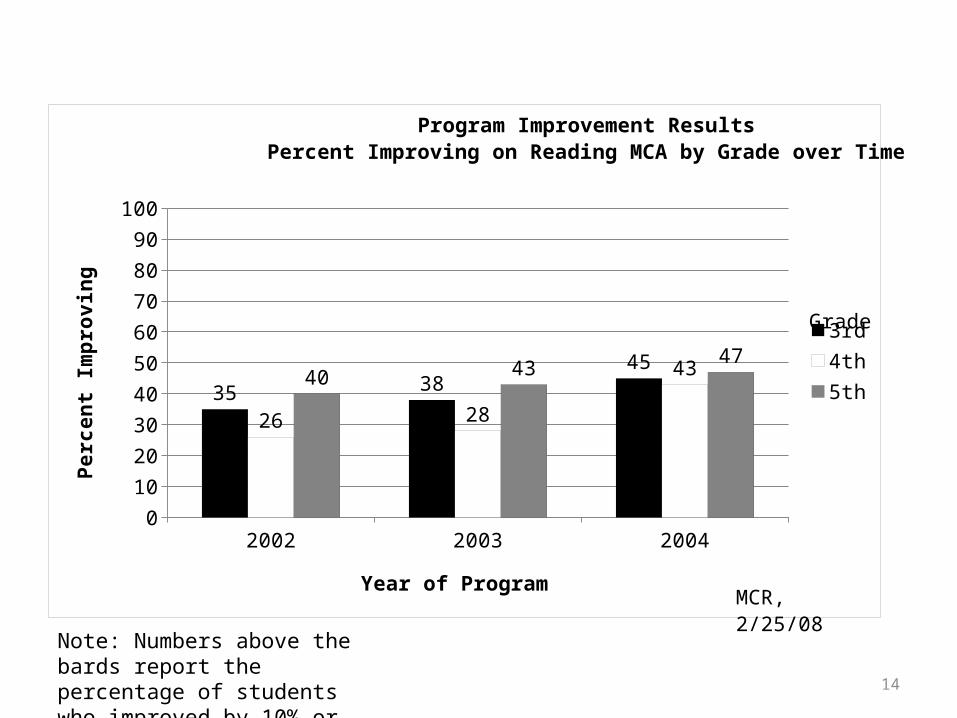
Note: Numbers above the bards report the percentage of students who improved by 10% or more.
2002 2003 20040
10
20
30
40
50
60
70
80
90
100
35 3845
26 28
4340 4347
Program Improvement ResultsPercent Improving on Reading MCA by Grade over Time
3rd4th5th
Year of Program
Perc
ent I
mpr
ovin
g
Grade
MCR, 2/25/08
14
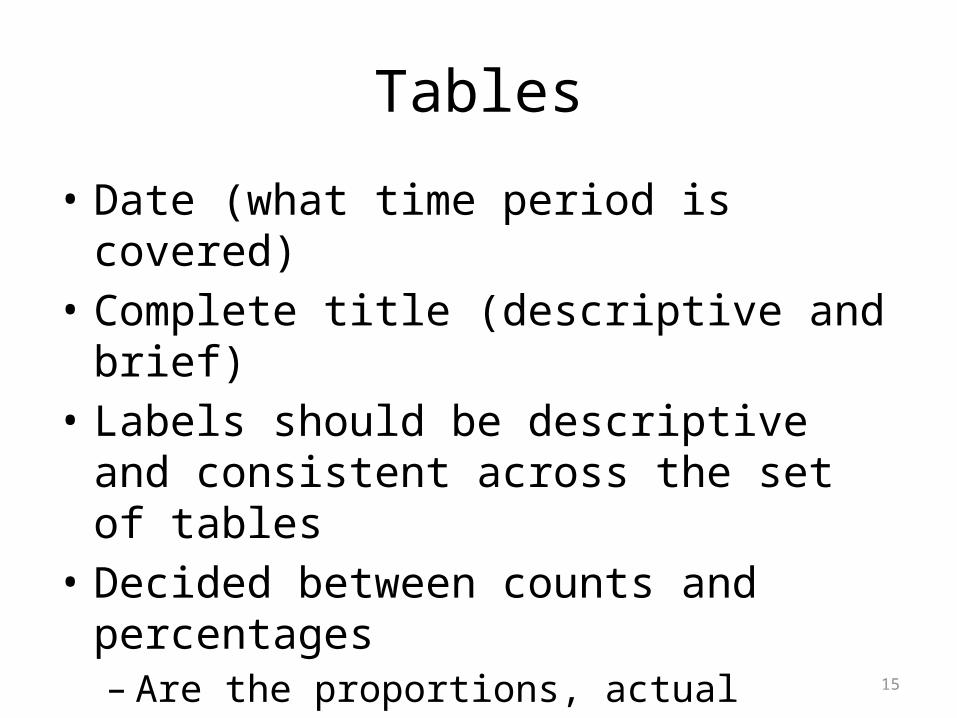
Tables
• Date (what time period is covered)• Complete title (descriptive and brief)• Labels should be descriptive and consistent
across the set of tables• Decided between counts and percentages
– Are the proportions, actual numbers, or both important?
• Always report totals and sample sizes– Allow readers ability to recalculate percentages.
15
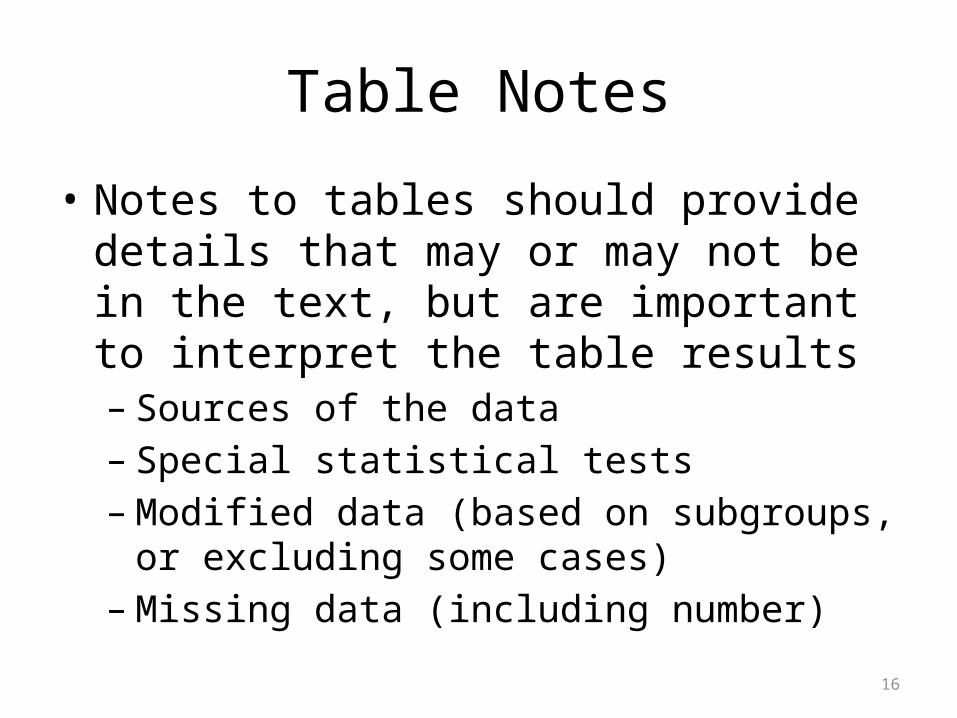
Table Notes
• Notes to tables should provide details that may or may not be in the text, but are important to interpret the table results– Sources of the data– Special statistical tests– Modified data (based on subgroups, or excluding
some cases)– Missing data (including number)
16
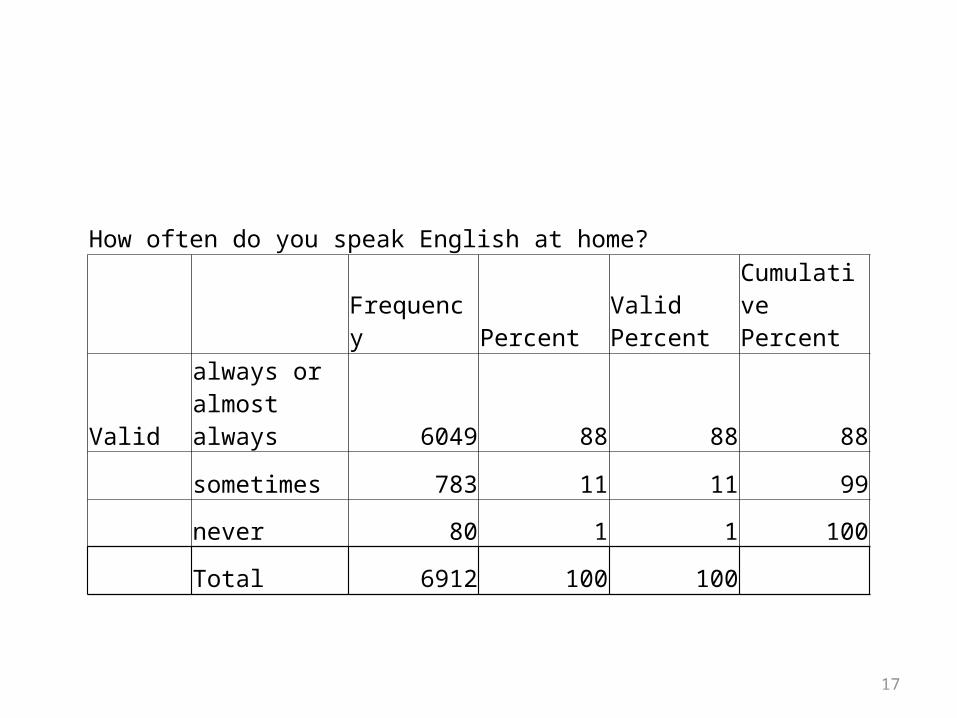
How often do you speak English at home?
Frequency Percent Valid PercentCumulative Percent
Validalways or almost always 6049 88 88 88
sometimes 783 11 11 99
never 80 1 1 100
Total 6912 100 100
17
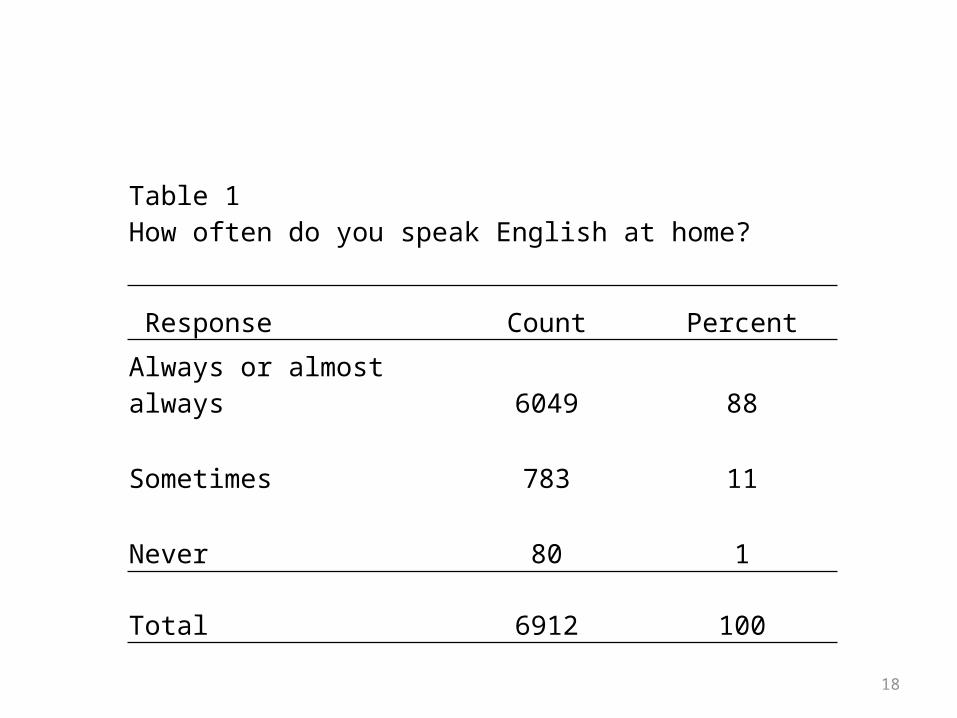
Table 1How often do you speak English at home?
Response Count Percent
Always or almost always 6049 88
Sometimes 783 11
Never 80 1
Total 6912 100
18
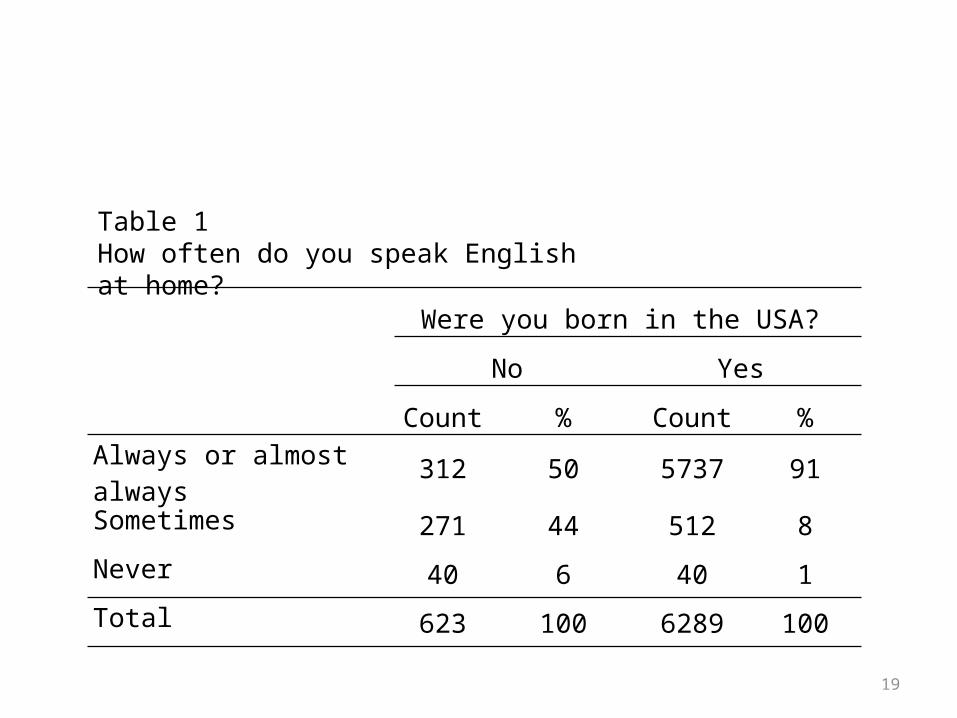
Table 1How often do you speak English at home?
Were you born in the USA?
No Yes
Count % Count % Always or almost always 312 50 5737 91
Sometimes 271 44 512 8
Never 40 6 40 1
Total 623 100 6289 100
19
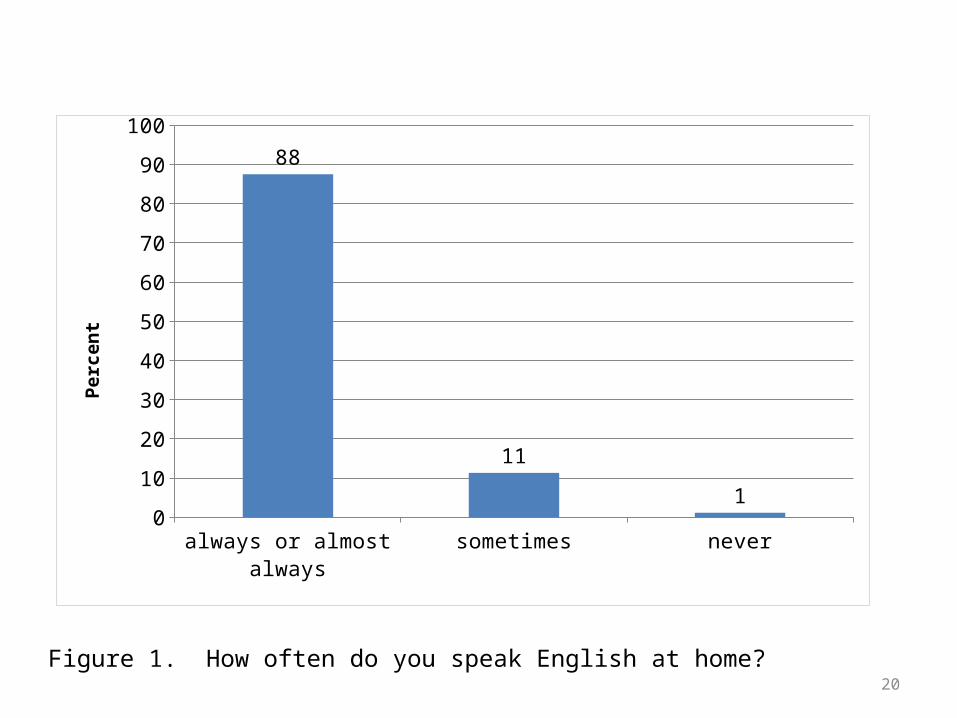
Figure 1. How often do you speak English at home?
always or almost always sometimes never0
10
20
30
40
50
60
70
80
90
100
88
11
1
Perc
ent
20
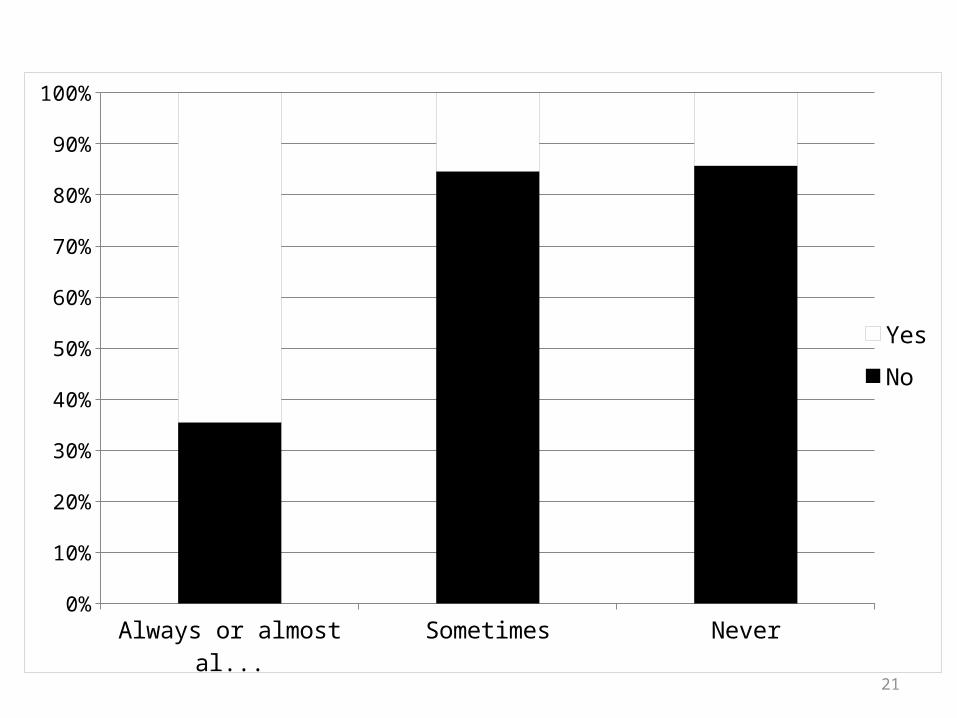
Always or almost always Sometimes Never0%
10%
20%
30%
40%
50%
60%
70%
80%
90%
100%
Yes
No
21
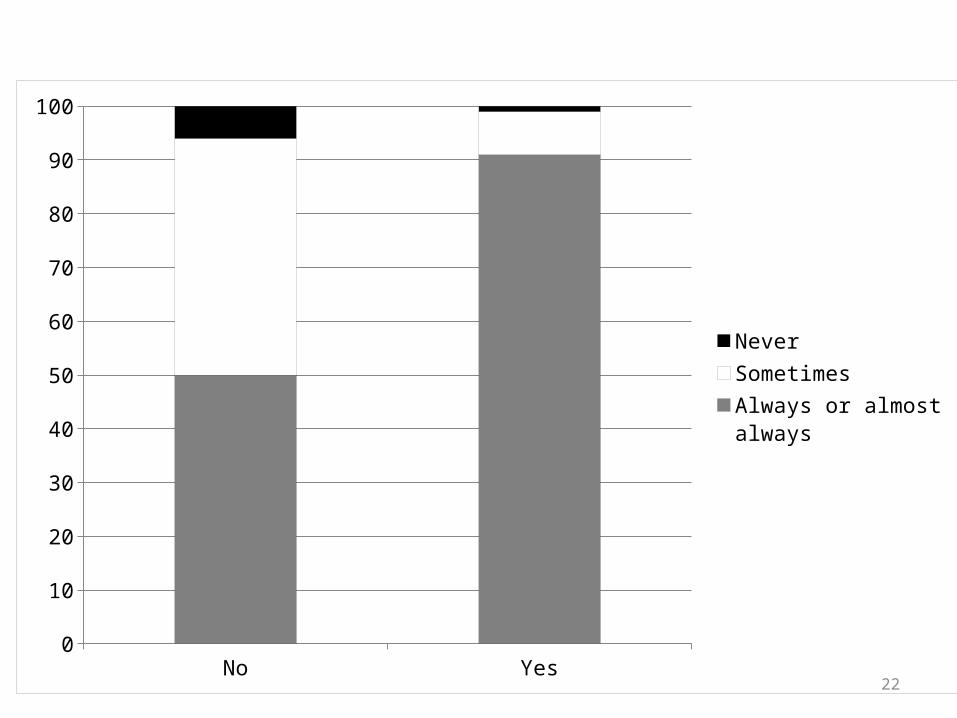
No Yes0
10
20
30
40
50
60
70
80
90
100
NeverSometimesAlways or almost always
22
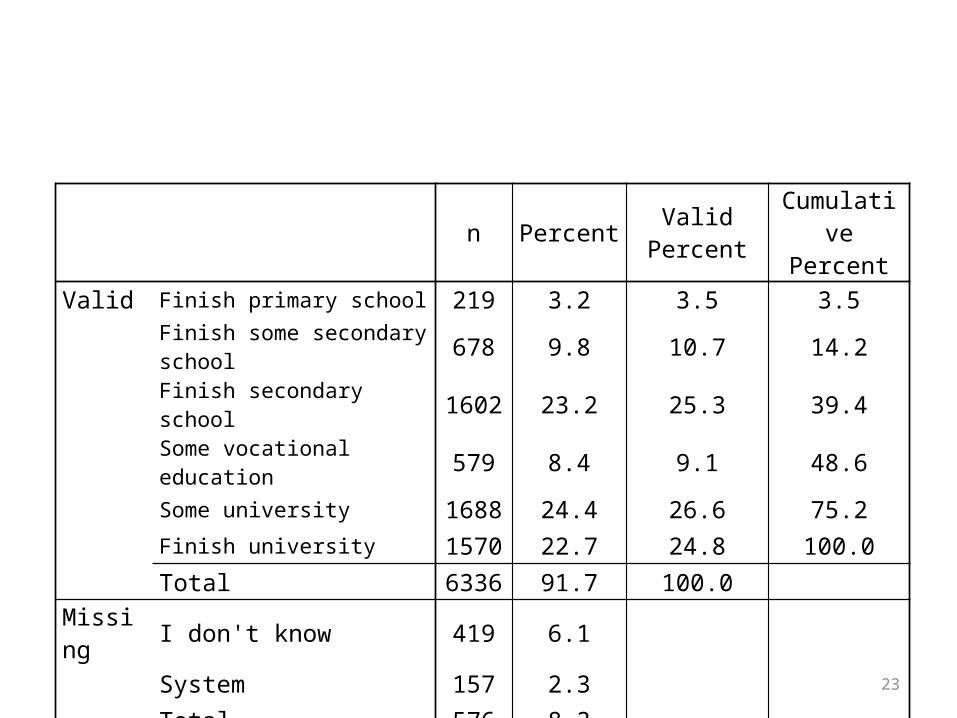
n PercentValid
PercentCumulative
Percent
Valid Finish primary school 219 3.2 3.5 3.5Finish some secondary school 678 9.8 10.7 14.2
Finish secondary school 1602 23.2 25.3 39.4
Some vocational education 579 8.4 9.1 48.6
Some university 1688 24.4 26.6 75.2
Finish university 1570 22.7 24.8 100.0
Total 6336 91.7 100.0
Missing I don't know 419 6.1
System 157 2.3
Total 576 8.3
Total 6912 100.023
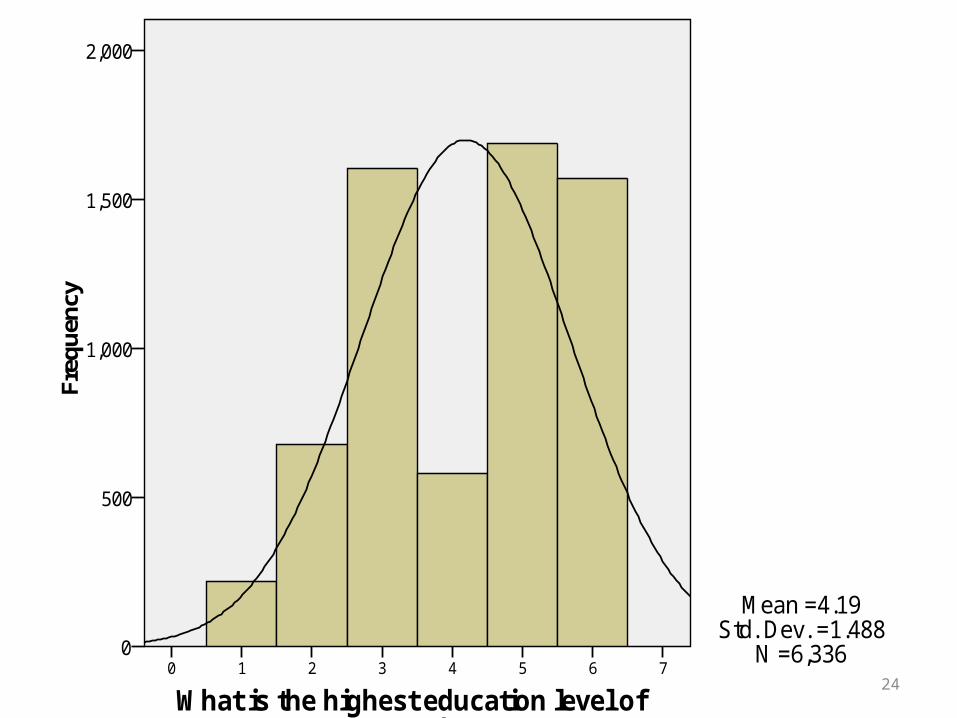
What is the highest education level of your mother?
76543210
Freq
uen
cy2,000
1,500
1,000
500
0
Mean =4.19Std. Dev. =1.488
N =6,33624
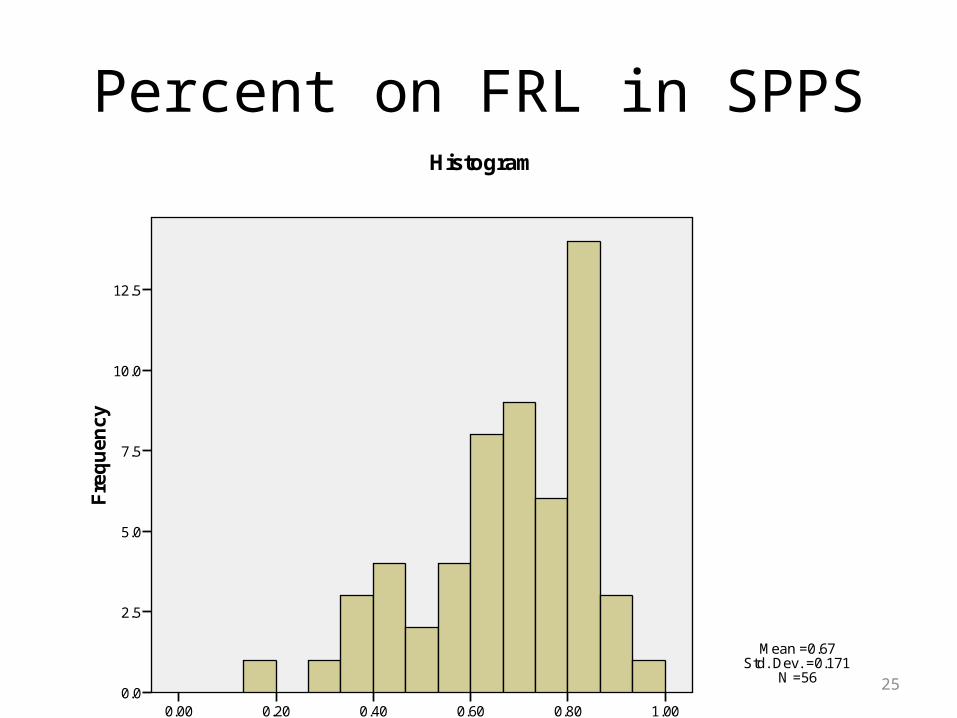
FRL1.000.800.600.400.200.00
Fre
qu
ency
12.5
10.0
7.5
5.0
2.5
0.0
Histogram
Mean =0.67Std. Dev. =0.171
N =56
Percent on FRL in SPPS
25
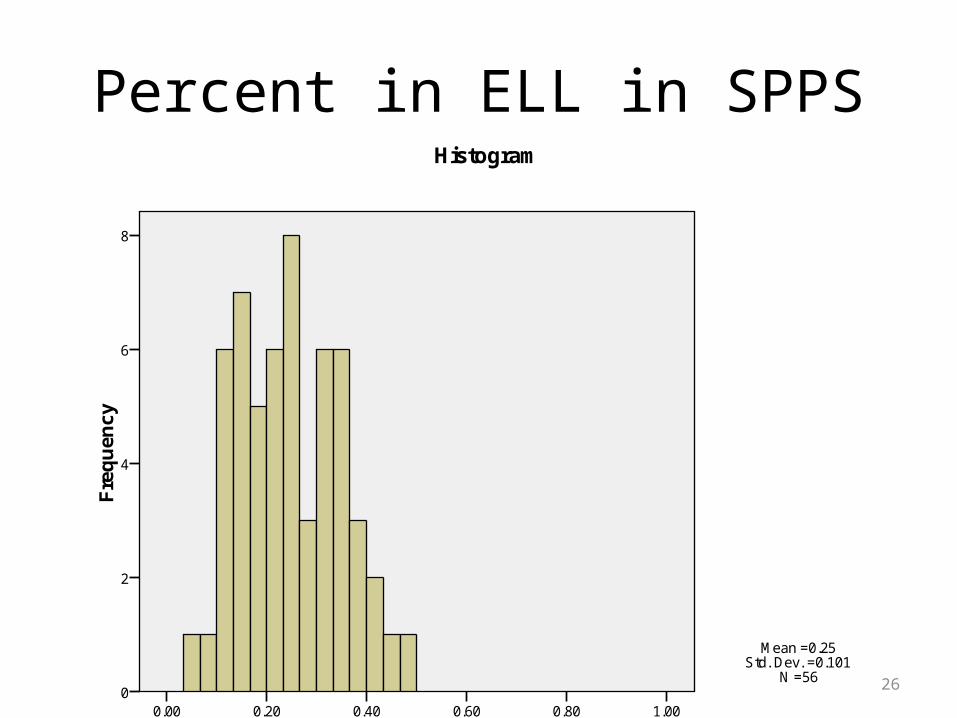
ELL1.000.800.600.400.200.00
Fre
qu
ency
8
6
4
2
0
Histogram
Mean =0.25Std. Dev. =0.101
N =56
Percent in ELL in SPPS
26
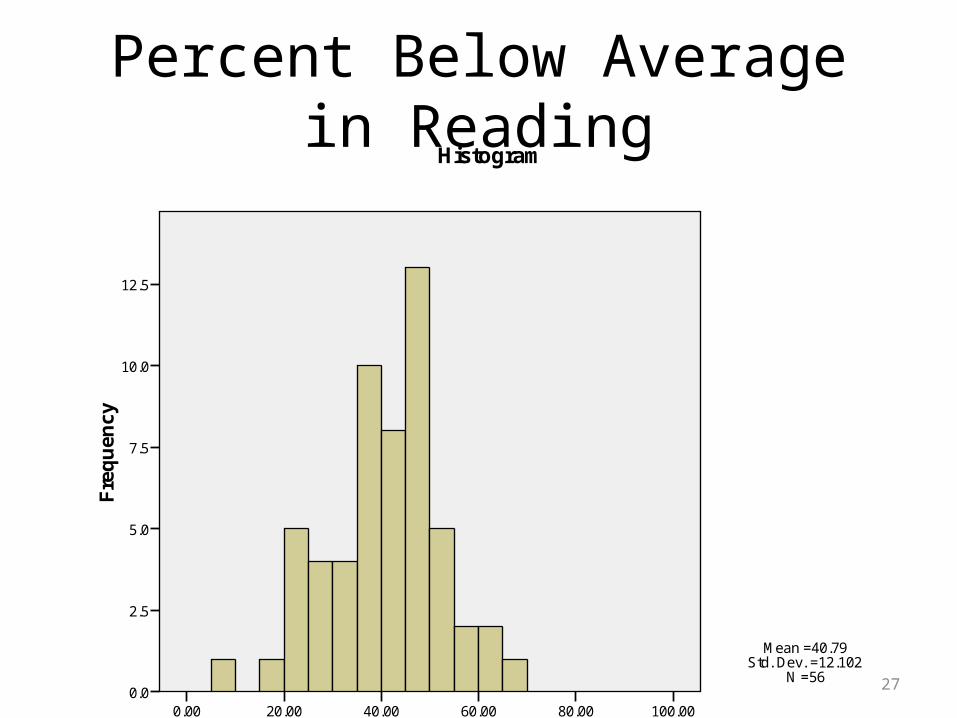
BelowAve100.0080.0060.0040.0020.000.00
Fre
qu
ency
12.5
10.0
7.5
5.0
2.5
0.0
Histogram
Mean =40.79Std. Dev. =12.102
N =56
Percent Below Average in Reading
27
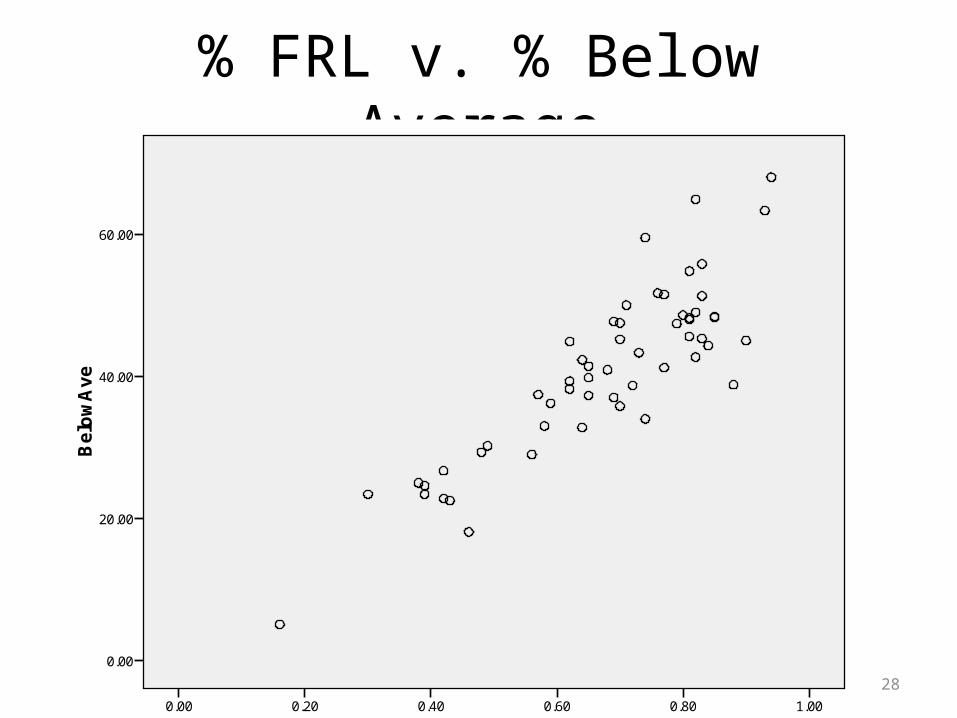
% FRL v. % Below Average
FRL1.000.800.600.400.200.00
Belo
wA
ve
60.00
40.00
20.00
0.00
28
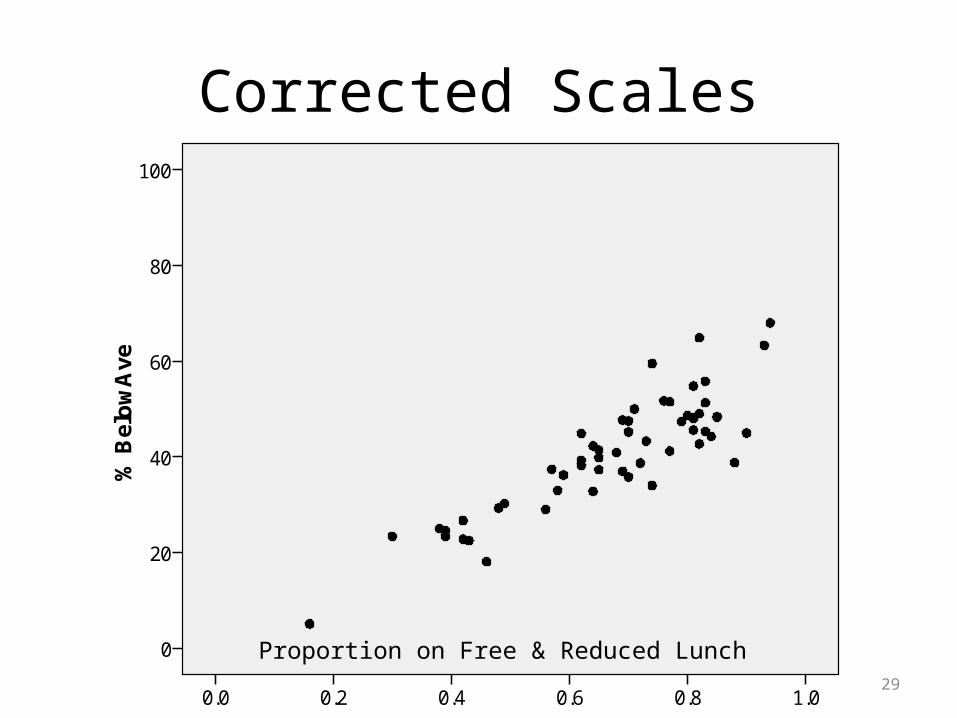
Corrected Scales
Proportion FRL1.00.80.60.40.20.0
% B
elo
wA
ve
100
80
60
40
20
0 Proportion on Free & Reduced Lunch29
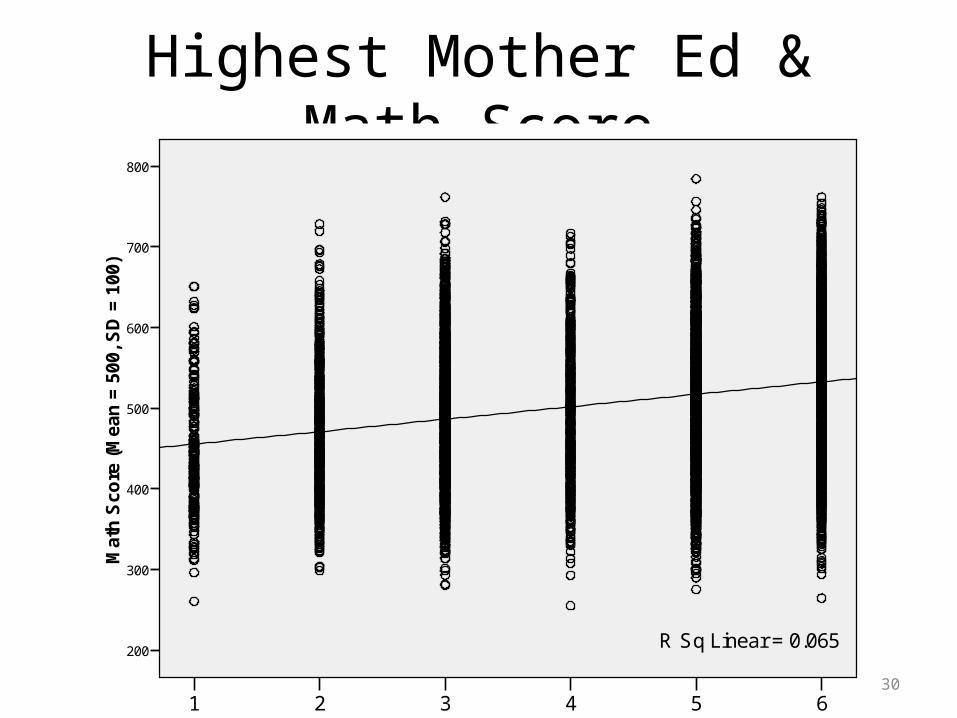
Highest Mother Ed & Math Score
What is the highest education level of your mother?
654321
Mat
h S
core
(M
ean
= 5
00, S
D =
100
)
800
700
600
500
400
300
200R Sq Linear = 0.065
30
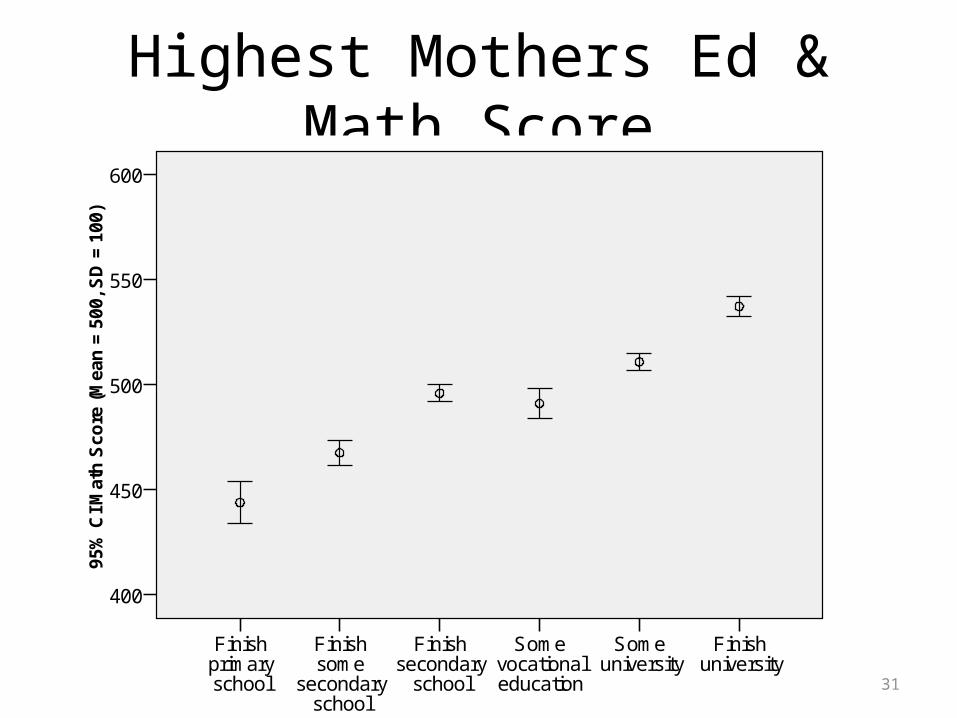
Highest Mothers Ed & Math Score
What is the highest education level of your mother?
Finish university
Some university
Some vocational education
Finish secondary
school
Finish some
secondary school
Finish primary school
95%
CI M
ath
Sco
re (
Mea
n =
500
, SD
= 1
00)
600
550
500
450
400
31
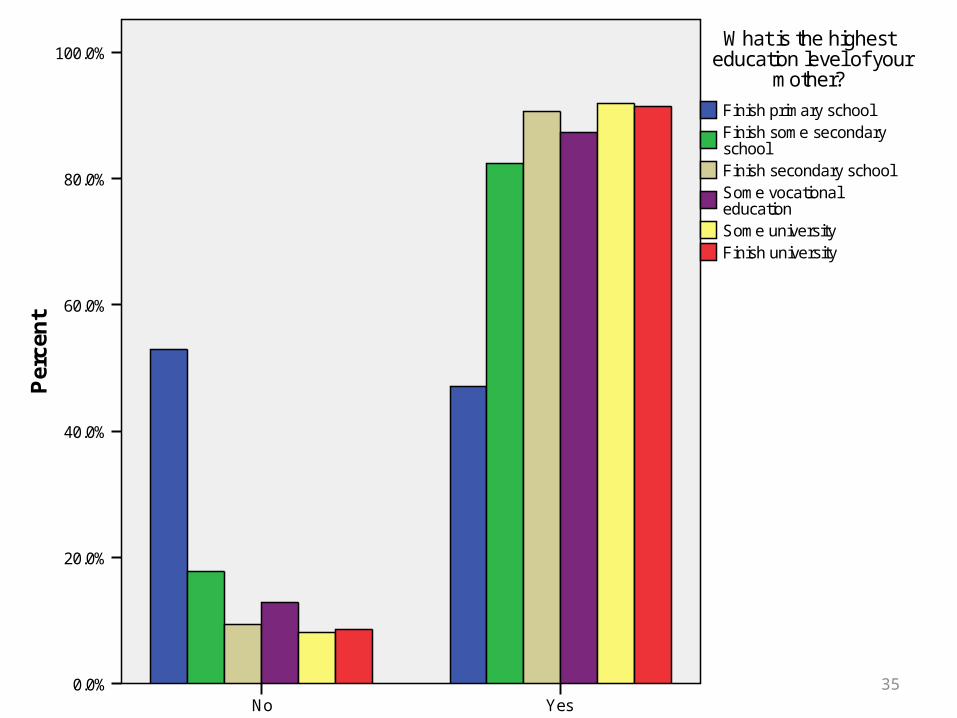
Crosstab
Usually Speak English at Home Total
No Yes NoWhat is the highest education level of your mother?
Finish primary school
116 103 21953.0% 47.0% 100.0%
Finish some secondary school
120 558 67817.7% 82.3% 100.0%
Finish secondary school
151 1451 16029.4% 90.6% 100.0%
Some vocational education
74 505 57912.8% 87.2% 100.0%
Some University
136 1552 16888.1% 91.9% 100.0%
Finish University
135 1435 15708.6% 91.4% 100.0%
Total 732 5604 633611.6% 88.4% 100.0%
What is the highest education level of your mother? * Usually Speak English at Home Crosstabulation
32
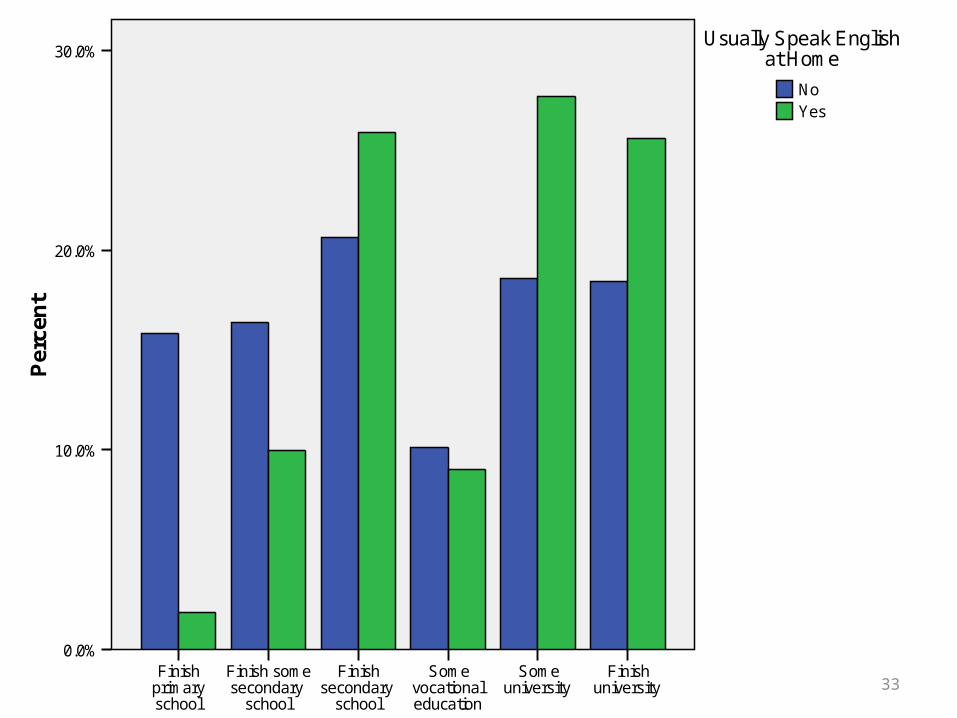
What is the highest education level of your …
Finish university
Some university
Some vocational education
Finish secondary
school
Finish some secondary
school
Finish primary school
Per
cen
t30.0%
20.0%
10.0%
0.0%
YesNo
Usually Speak English at Home
33
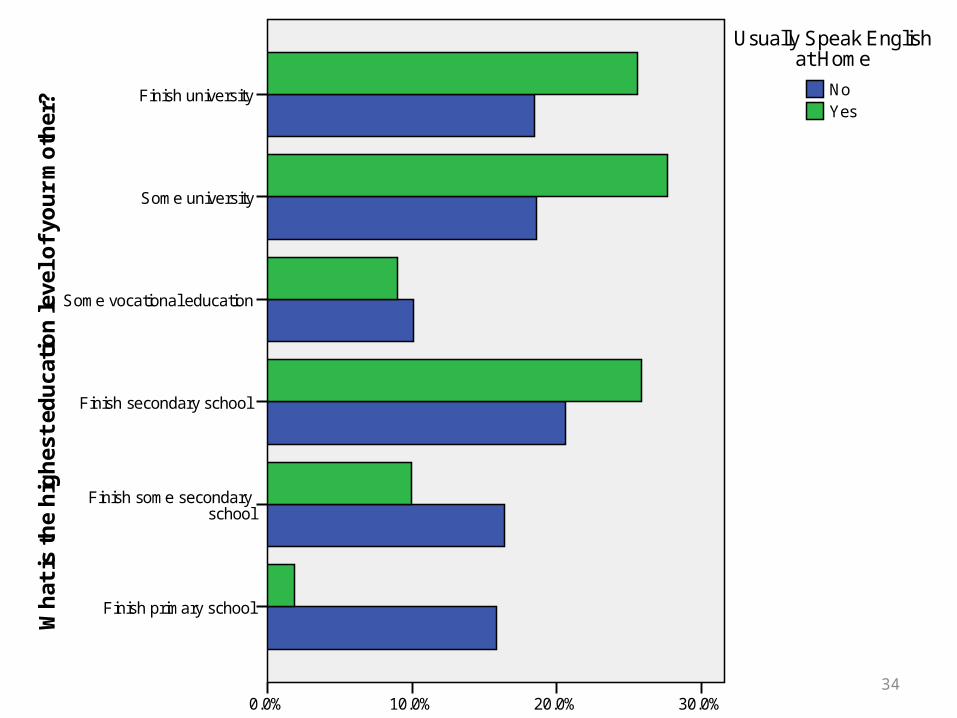
Wh
at is
th
e h
igh
est
edu
cati
on
leve
l of
you
r m
oth
er? Finish university
Some university
Some vocational education
Finish secondary school
Finish some secondary school
Finish primary school
Percent30.0%20.0%10.0%0.0%
YesNo
Usually Speak English at Home
34
Usually Speak English at HomeYesNo
Per
cen
t100.0%
80.0%
60.0%
40.0%
20.0%
0.0%
Finish universitySome university
Some vocational education
Finish secondary school
Finish some secondary school
Finish primary school
What is the highest education level of your
mother?
35
Final Notes
• Make it easier for the reader• Keep graph and associated text (explanation)
on the same page; text first, followed by graph• Graphs and associated tables can be
presented, if discussed in the text – otherwise put associated tables in the appendix (especially if tables are large)
• Use consistent font – so that when printed, is 12 pt.
36