Embed Size (px)
Citation preview

Graphic State Coulbourn Instruments
0
USER’S MANUAL

Contents INTRODUCTION ....................................................................................................................................................... 1 INSTALLATION ......................................................................................................................................................... 1
Hardware Connections .......................................................................................................................................... 2 DEFINITIONS ............................................................................................................................................................ 2 GENERAL PROGRAM FEATURES .......................................................................................................................... 3 GRAPHIC STATE PROTOCOL BUILDER ................................................................................................................ 3 CREATING A PROTOCOL – A Tutorial .................................................................................................................... 4
Protocol Builder Menus ........................................................................................................................................ 11 File .................................................................................................................................................................... 11 Find ................................................................................................................................................................... 11 Settings ............................................................................................................................................................. 11 Help .................................................................................................................................................................. 12
Controls, Indicators and Operation ...................................................................................................................... 12 Stimulus and Input Configuration ..................................................................................................................... 12 Register Math ................................................................................................................................................... 13 State List Control .............................................................................................................................................. 13 Status Indicators ............................................................................................................................................... 13 Stimuli ............................................................................................................................................................... 13 GoTo’s .............................................................................................................................................................. 14
Counters ............................................................................................................................................................... 17 Local Counters ................................................................................................................................................. 17 External Counters ............................................................................................................................................. 17
Registers .............................................................................................................................................................. 18 Register Math ....................................................................................................................................................... 18 Expression Configuration ..................................................................................................................................... 20 Lists ...................................................................................................................................................................... 21 The Global State .................................................................................................................................................. 23 Debugging a Protocol .......................................................................................................................................... 23
RUNNING AN EXPERIMNT .................................................................................................................................... 24 Program menus .................................................................................................................................................... 27
DATA ANALYSIS ..................................................................................................................................................... 28 Data format .......................................................................................................................................................... 28 Data Log Display .................................................................................................................................................. 28 Analysis Display ................................................................................................................................................... 30 Register Display ................................................................................................................................................... 32 APPENDIX A ........................................................................................................................................................ 34
APPENDIX B ........................................................................................................................................................... 35

Graphic State Coulbourn Instruments
2
Graphic State Coulbourn Instruments
1
INTRODUCTION Graphic State 4 (GS4) begins a new era in state notation control systems. The ease in creating protocols by simple point-and-click of the mouse and/or using keyboard entries remains, but unlike previous versions of Graphic State, GS4 now incorporates real-time mathematical functions. Protocols can now be designed that progress and change based on factors that occur during an experimental session. GS4 has many new features:
• Independently configure display of real-time parameters for each protocol • Simultaneously run experimental sessions with different configuration of Habitest Lincs • Stand-alone data and protocol files (No Access Database) • Windows-like drop down menus for selecting options • Context sensitive help screens for each control and indicator for quickly learning new features • Math functions for real-time calculation of parameters during a trial. These parameters can be used as
criteria for state transitions so that a protocol can actively respond to subject behavior. • Parameters can be set at the start of each trial in order to tailor protocols to individual animals. For
example, enter a subject’s weight for tailoring drug delivery, or performance in previous sessions for tailoring response criteria.
• A 10-fold improvement in response time. Graphic State 4 responds to external events within 1 ms, and records event times with 1-ms precision.
• Improvements and new features in the user interface for easier protocol design. There are so many upgrades and improvements that users of previous versions of Graphic State may see as many differences as similarities in GS4 compared to previous versions of Graphic State. GS4 employs the same Habitest Lincs as Graphic State 2 and Graphic State 3. GS4 interfaces to the Habitest system via a single USB Port so the PCI card is no longer needed. The Coulbourn USB Interface (P/N U90-11) along with the upgrade in software to GS4 allows existing users to easily upgrade Graphic State 2 and Graphic State 3 systems. Graphic State 4 is compatible with Windows XP and Windows 7 (32-bit and 64-bit) operating systems.
INSTALLATION Graphic State 4 (GS4) consists of two programs, GraphicState, for building protocols and viering and analyzing data, and GraphicStateRT, for running and the sessions. Protocol desing and data analyses can be performed on any number of computers. Running experiments requires the U90-10 USB interface, a set of Habitest Lincs and a GS4 software license. Be sure that you are logged onto the computer as administrator or user with complete administrator rights when installing GS4 and the USB Interface drivers. To install Graphic State 4 (GS4), place the CD into your disk drive, select Start, then Run, and then browse to the disk drive. Select the setup.exe file and GS4 will install automatically. The USB Interface (P/N U90-10) includes a CD. To install the U90-10, place this CD in your disk drive. The software should automatically start running but if after a minute or so the software installation is not running, select Start, then choose Run, browse to the disk drive, select the setup.exe file and choose Open and then click the OK button. Once the USB interface drivers are installed, connect the U90-10 to a USB port. The Windows Hardware Wizard should start indicating that new hardware has been found. If it does not start after a period of time you can start the Wizard by choosing the “Add New Hardware” utility from Control Panel.

Graphic State Coulbourn Instruments
2
Hardware Connections The U90-10 includes two cables, a USB cable and a 25-Pin DSub cable. Connect the Type B USB connector on the USB cable to the U90-10. Connect the Type A USB connector to a USB Port of the computer. Connect one end of the 25-Pin DSub cable to the U90-10 and the other end to the H01-01 Habitest Power Base or to the H02-01 Self-Powered Habitest Linc. See Figure 1.
DEFINITIONS Throughout this manual some words will be used frequently and in some cases, generically. The following is a list of these words and their meaning for purposes of this manual. Input(s) – Any device that is connected to one the four “Switch” connectors on the Environment Control Board (ECB). The activation (onset) and the release (offset) of any input device is time stamped in all GS4 data files. Environment Control Board (ECB) – The circuit board in which the response devices and stimuli are connected. Event – A response that registers on any of the Switch Inputs of the Environment Control Board (ECB) Exit Line (or GoTo) – The collection of controls (Parameter, Exit Criterion, Comparison, P, Target) that specify when a State will exit. Response – A behavior by a subject that is recorded in GS4 such as a lever response, nose poke response, interrupting a photo beam by movement, pecking key, activating an infrared heat detector, licking an optical lickometer, etc.
DESKTOP
OR
LAPTOP COMPUTER
USB CABLE
COULBOURN USB INTERFACE
POWER BASE WITH HABITEST LINCS
OR
SELF-POWERED HABITEST LINC
FIGURE 1
U90-10 Buffer U90-10B

Graphic State Coulbourn Instruments
3
Switch Input – See Input Stimulus – Any device that is controlled by an output from a Habitest Linc. This includes devices that are activated by a pulse of any duration, devices that are activated for the duration of the output and programmable devices that require a voltage signal to operate and an analog voltage for controlling some parameter of the stimulus such as amplitude, frequency, color, etc. Output – A -24 to -30 Volt DC signal produced by any of the 32 outputs of a Habitest Linc.
GENERAL PROGRAM FEATURES Context Help: Before you start working with GS4, note that help text is available within the program itself. Select the Show Context Help item in the Help menu of GraphicState or GraphicState RT to view the context help (or use the menu shortcut CTRL-H). A floating window will appear. Now move the cursor over any control or indicator in the currently open program window. The floating help window will display text related to the selected control. Select the Show Context Help menu item again to hide the help window. Shortcut menus (when in doubt, right-click): In Graphic State, actions and configuration options that are specific to a particular control are attached to the control itself through its shortcut menu. Except for drop-down menus and buttons, almost every control in Graphic State has a shortcut menu that is accessed by right-clicking on the control. User feedback: Many of Graphic State’s features were developed in response to suggestions from users. No one has more experience working with the program and testing its capabilities and limits than users do. If you find bugs or have ideas for improvements or new features that would be broadly useful, don’t hesitate to let us know. Many ideas can be implemented quickly.
GRAPHIC STATE PROTOCOL BUILDER The Graphic State protocol builder is the program for creating experimental protocols. This can be run from any computer in which GS4 has been installed. The first time you run the Graphic State Protocol Builder the Window displayed in Figure 2 will appear. Graphic State experiments consist of a series of states through which an experiment moves, each state transition being contingent on what happens during the experiment. A state defines the environmental conditions (i.e., the state of each stimulus) and the exit condition(s) that will pass control to another state. A protocol consists of several elements including some or all of the following. Those in bold are included in every protocol
- A Group of States (each with its own set of configured Stimuli and list of GoTo’s) - Configuration information about how many Lincs are to be used, the names given to the Linc input
lines, and whether Register Math is being used. - A set of External Counters - A set of Registers - A set of Lists - The Run-Time display setup
The box in the upper left hand corner of the window in FIGURE 2 provides a listing of all states that are included in a protocol. There are four states that appear when a starting any protocol.
Graphic State Coulbourn Instruments
4
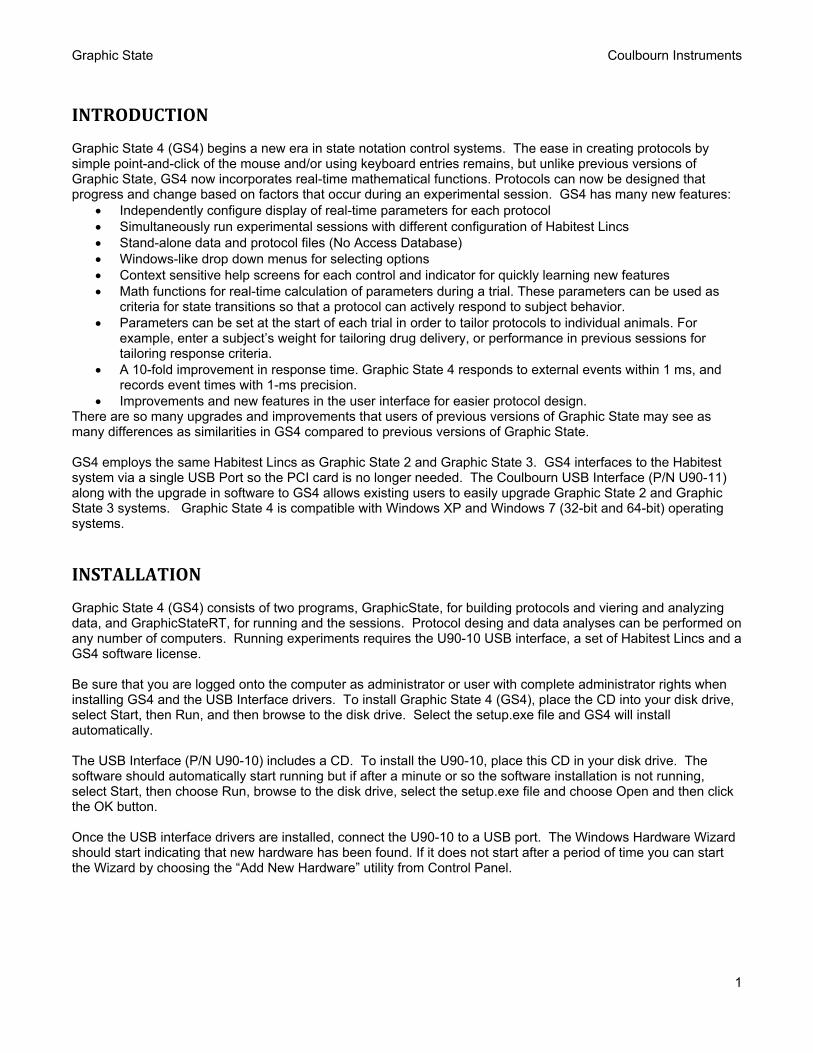
FIGURE 2
RDY (Ready) State – This state is used to define the status of the environment before a session begins. The stimuli specified in this state are put in place as soon as the protocol is loaded into GraphicStateRT. The RDY State also specified the parameter(s) for starting the experiment once the protocol is initiated in GRaphicStateRT. FIGURE 6 depicts the default values for the Ready State. The default exit conditions in the RDY State will result in the session moving to STATE 1 (S1) as soon as the session is started. S1 (State 1) – Defines the initial state although it is no longer necessary to start with State 1 or even use State 1 since the Ready State can exit to any state or a List of states. FIN (Finished) – Defines the state of the stimuli when an experimental session is completed. For example, retractable levers could be extended or retracted; guillotine doors could be opened or closed, etc. GBL (Global) – State exit parameters and stimulus conditions specified in the Global State will remain in effect for the duration of an experimental session.
CREATING A PROTOCOL – A Tutorial We will begin by creating a simple Fixed Interval 15 second (FI 15) protocol. This experiment will require three states and will run for 20 minutes or 50 reinforcements, whichever occurs first. The default Linc configuration is a half Linc per station, 4 inputs per station. This is the configuration we will use for this experiment but if your protocol required more than 4 inputs but less than 9, you would specify one full Linc per station. For 9 to 16 inputs two Lincs would be configured for each station and for 17 to 32 inputs four Lincs would be required. To specify the configuration of the Habitest Lincs (the number of Habitest Lincs per station for any protocol select the Settings menu and choose Protocol Settings… The window in Figure 3 will appear.

Graphic State Coulbourn Instruments
5
FIGURE 3
Protocol Configuration: To change the Linc configuration you would click on the “1/2 Lincs per station” drop-down menu and select one of the other Linc combinations. In this window, you can also provide names for the input devices. We will name Switch Input 1 (On1A1) “Lever”. As you type Lever in this box you will see the word “Lever” appear in the Offset Box for this switch (Off1A1) as the default, but the offset name can be changed as well. Every event that occurs during a session is time-stamped so the pressing of the lever (Onset) will be recorded as well as the time when the lever is released (Offset). Offsets are useful when parameters of the session are dependent upon the duration of the response. Click on the File menu in the Protocol Configuration window and select the Save and Exit option. Note: If you change the Linc configuration the main window of the Protocol Generator will change to accommodate the number of stimuli and switch inputs. For example, if you selected the 2 Lincs (16 inputs) option the Protocol Builder screen will appear as indicated in Figure 4.
FIGURE 4 State Configuration: We will use State 1 to detect the response from the subject on the Lever input, State 2 to deliver a reward, and State 3 to time the 15 second interval. Highlight State 1 in the State List Box by clicking on S1. Right click on S1 and select the Description… item in the short-cut menu. A window will appear allowing you to name State 1. Type “Response”, click the OK button and this description will appear at S1 in the Table List Box. Begin by turning on the house light: Click on the darkened yellow button labeled “H LITE” and click. The button becomes a bright yellow, indicating that the House Light – or whatever is connected to the House Light on the ECB – will be activated whenever S1 is in control during the session.

Graphic State Coulbourn Instruments
6
We want this State to exit when the subject presses the Lever input once. The exit parameters of a state are configured in the array of controls located below the stimulus window. Each new state begins with one empty Exit Line or GoTo. Although State 1 will require only a single exit line, additional lines can be added (or removed) by right-clicking on the “1” in the “GoTo #” exit parameter box, and selecting “New” or “Delete”. To configure the exit line, start by right-clicking the Parameter control. It is here you select the type of exit parameter. The options are time, a response onset or offset, or the number of times the state has been entered (entries) during an experimental session. Select the Lever (On1A1) from the Inputs submenu. Next set the Exit Criterion. The default value is 1 so we do not need to change this value. That is, the State will exit when 1 response on Lever occurs. If the Exit Criterion were set to 5, the State would exit only when Lever is pressed 5 times. Next set the Target, which is the State to which the protocol will go once the current State is completed. Click in the Target control and enter “2”. This completes the exit condition that states that when one response is made on the Lever (switch 1), control will be passed to State 2. You will likely have noticed that when you entered “2” into the Target and hit return, the dialog in Figure 5 appeared to warn you that the current State (State 1) is targeting a State (State 2) that doesn’t exist. Click Yes to create S2, which will appear in the State list in the upper left of the window. If you want Graphic State to create non-existent states automatically when they are targeted without prompting you, click in the “Don’t ask me again.” box before clicking on the Yes button, and this window will no longer appear when new states are added to the protocol.
FIGURE 5 At this point, your screen should appear as follows:
FIGURE 6 Note that the Comparison in the Exit line has defaulted to “greater than or equal to” (>=). This denotes that when the number of responses is greater than or equal to 1, the protocol will pass control to State 2. “Greater than or equal to” is the setting that is used in the great majority of cases. The comparison can be changed to one of five other options but this requires the activation of math options (covered later in this manual).

Graphic State Coulbourn Instruments
7
Also notice that the Probability [P(%)] box has defaulted to 100%. With P=100, every response on the Lever input will pass control to State 2. In many applications, however, users prefer to have a set of responses lead to a reward with less than 100% certainty. In that case, P should be set to less than 100. Technically, whenever the Parameter reaches the Exit Criterion (in this case, 1 response on the Lever input), Graphic State generates a random number between 0 and 100; if the number is less than P, then the Exit Line executes and causes a transition to the Target State. If the number is greater than P, the accumulated responses (or Time or Entries) are discarded and the State starts over again. If P=10, for example, then 1 out of 10 times, on average, when the subject presses the Lever, the program will proceed to State 2. The other 9 times, State 1 will repeat. Note that if the exit criterion were increased to 5 and probability increased to 50%, a State transition would occur, on average, every 10 responses, but the distribution of responses that meet the conditions to pass control to State 2 would be much different. In the first example (exit criterion of 1; probability of 10%) the possible number of responses would consist of 1, 2, 3, 4, 5, 6, 7, 8, 9, 10, 11, 12, 13, 14, etc. In the second example (exit criterion of 5; probability of 50%) the possible number of responses necessary to meet the exit condition would be 5, 10, 15, 20, 25, 30, 35, etc. In both examples the mean number of responses necessary to cause a State transition would be 10. In other words, the Probability test (drawing a random number and comparing to P) is applied only after the chosen Parameter reaches the Exit Criterion. To configure the reward, click on S2 in the State List Box to view State 2. Set its description to “Reinforcer” by right-clicking on S2. Click on the HLITE in the stimulus are to activate the house light. Also click on the red and yellow “FDR1” (Feeder 1) stimuli to activate the pellet feeder. Both stimuli are required in order activate the magazine lamp (ML) in the pellet trough (OP). Enter the exit condition parameters as indicated in Figure 7:
• Parameter “t(ms)”, for time in milliseconds. • Target = 3. • Exit Criterion = 20.
This will activate the feeder for 20 milliseconds, which is long enough to deliver a single pellet.
FIGURE 7
To configure 15-second interval, select S3 from the State List, right-click and select “Description” and enter “15 Second Interval”. Set the exit criterion to 15, and the target S1. When all of the entries in State 3 have been completed the screen should appear as Figure 8.

Graphic State Coulbourn Instruments
8
FIGURE 8
Two more steps are required to complete the protocol. First, the termination conditions must be specified. This experiment will be allowed to run for 20 minutes or until 50 reinforcers are delivered, whichever occurs first. Click on S3 in the State List box, right-click on the 1 in the “GoTo #” box, and select New. In this new GoTo, set the Parameter to Entries, Exit Criterion to 50 and Target to “FIN”. With this setting, on the 50th time the State is entered during a session (which will occur on the 50th time that the subject responds in State 1 and a reward is delivered in State 2), the session move to the FIN state and terminate.
An aside on the Reset button: You will notice that up until now, the Reset button, labeled “R” in GoTo, has been blue. For GoTo 2 in State 3, however, the button is black. To understand why, we have to go into some details of how Graphic State counts time or events.
Each GoTo keeps track of time or events using internal counter. For time GoTo’s the counter increments as time passes; for Input GoTo’s the counter increments when an event occurs. If the counter reaches the Exit Criterion, that GoTo “hits”, its counter is reset to 0 and the State exits to the GoTo’s target. There are cases, however, when a State can Exit BEFORE a GoTo reaches its Exit Criterion, for example, if GoTo 2 hits before GoTo 1 hits. In that case, the control passes to GoTo 2’s target, and GoTo 1’s counter is left with some non-zero value. The next time the State is entered, the user must decide whether the counter for GoTo 1 starts where it left off the last time, or is reset to 0. The Reset button is used to control this behavior, and it defaults to ON (blue): The default is that the counter is always reset when the State is entered.
As an example, consider a state with 2 GoTo’s. GoTo 1 exits on 5 responses on switch 1; GoTo 2 exits after 30 seconds. The first exit condition to reach criterion will cause the state to exit. Suppose that the first time the State is entered, the subject makes 5 responses on switch one, thus causing the exit, but only 10 seconds has elapsed. The next time the State is entered, GoTo 1 will start counting inputs from 0, since it hit on the last round and its counter was reset. But the counter for GoTo 2 still says 10 seconds. The next time the State is entered, we have choice as to whether to start counting time from 0 again (Reset ON), or to pick up at 10 (Reset OFF), in which case GoTo 2 will hit 20 seconds after the State is entered for the second time. In different protocols, the different options might be preferable.
Why then, does the reset button the Entry GoTo of State 3 default to OFF (black)? The reason is that Entry GoTo’s count State entries. It therefore makes no sense to reset the counter to 0 every time the State is entered. Each time the State is entered, the counter would start at 0 and so would never get beyond 1. So Entry GoTo’s always have their reset buttons OFF.

Graphic State Coulbourn Instruments
9
FIGURE 9
We now need to add the 20 minute session termination criteria. We cannot enter this in any one state because time would only count down when that specific state is in control. This is where a Global exit condition can be used. The Global State is a special purpose State that always executes, in parallel with the main sequence of States. It is perfect for keeping track of total time in the protocol and exiting after a fixed interval. Click on Global in the State List box and enter the exit criteria in the same manner as was done in the states: Parameter = Time (minutes); Exit Condition = 20, Target = FIN (Figure 10). For now, we’ll leave Global stimuli off, but if any stimuli needed to be on for the duration of the session, these could be set in the Global State..
FIGURE 10
Run-Time Display: The last part of the protocol to be configured is the information that will be displayed while the protocol is running. From the Settings menu select “Run-Time Display…” The window that is displayed during a session will appear. There are five parameters that are always included in the display (Figure 11).
Graphic State Coulbourn Instruments
10
FIGURE 11
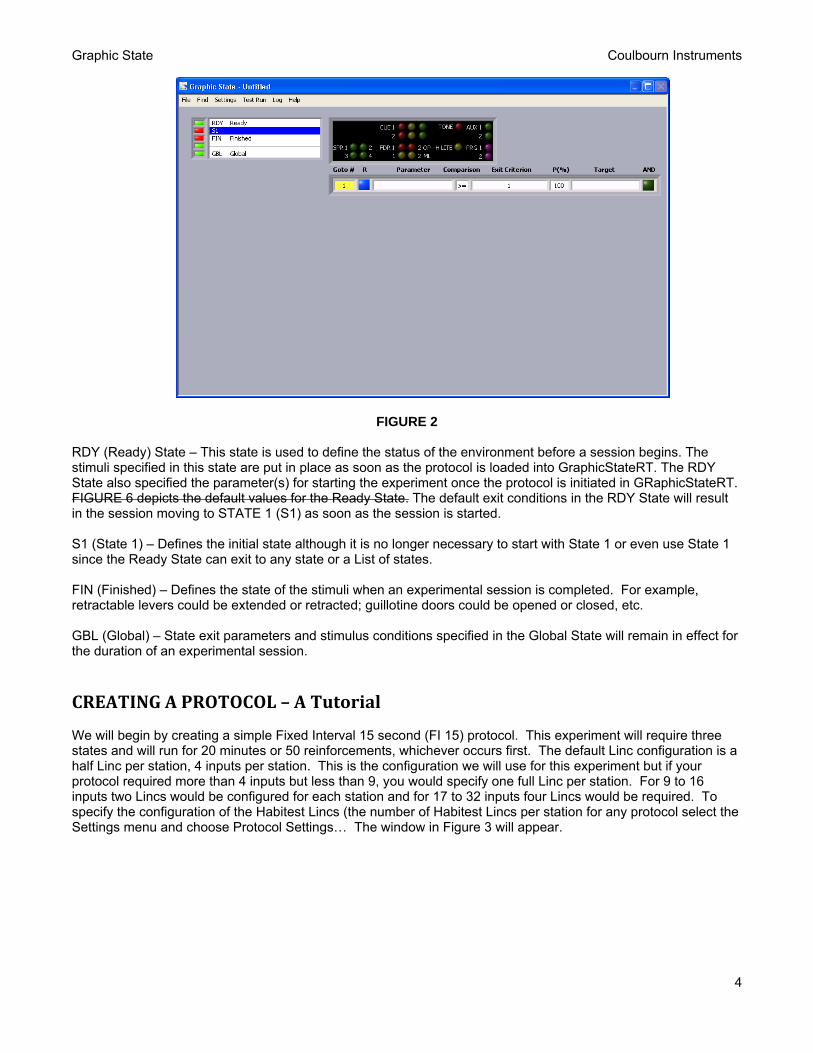
GS4, like its predecessors, records every event that occurs during a session (State transitions, inputs, etc.). However, you can choose what data you would like displayed on the monitor during a session. To add additional data, in addition to the five defaults (Protocol Name, Subject ID, Elapsed Time, Active State, and previous Active State), right click on one of the white cells (either the column labeled “#” or “Parameter”) and drop down window will appear. With the MATH option disabled (see below), there are a several types of information that can be displayed.
- Input Totals - total number of inputs based on the onset of any switch response and/or the total number of inputs based on the offset of any switch response
- State Entry Totals – (SE) the number of times a specified state was entered during the session - State Time Totals – (ST) the duration a state was active during the session - SP0:Time of Day – Special Counter zero displays the time of day - SP1:Time in Trial – the duration the session has been running - SP2:Time in State – the duration the current state has been active
With MATH enabled, the values of Registers can also be displayed. Registers give Graphic State immense flexibility in designing protocols and displaying information during run-time, and will be covered in detail below. The short-cut (right-click) menu can also be used to Insert new items and delete items from the data display. Figure 12 depicts some example selections we might choose for this experiment.
1. Number of responses on Lever 1 2. Number of times State 2 is entered (SE2). This being the state where reinforcement is delivered will
provide a continuous display of the number of reinforcers that have been delivered during a session. 3. Cumulative duration of State 1 (ST1). This is the state where the subject must respond to receive a
reinforcer. 4. Time in Trial (SP1). The duration the session has been running. 5. Time in State (SP2). The duration the active state has been running.

Graphic State Coulbourn Instruments
11
FIGURE 12
After setting up the Run Time Display be sure to choose the “Save And Exit’ option from the Run Time Display File menu. This protocol is now complete and ready to run. From the File menu in the main Graphic State widow select the “Save As…” option and save this protocol. Now select “Quit” from the File menu to exit the Graphic State Protocol builder. This short tutorial is meant to have given a brief outline of the program’s operation and design of a protocol. We now consider Graphic State’s menus, controls and operation in more detail.
Protocol Builder Menus File New – Create a new protocol. Open – Open a previously created protocol and data files from previous sessions. Next – Advance to the next protocol file or the next data file in a folder, in alphabetical order. Previous – Return to the previous data file (alphabetical) in sequence from the same protocol. A data file must be
open to use this menu item. Save… - Saves the current protocol. Save As… - Saves the currently open protocol to a new file. Quit – Exit Graphic State Find State Name… – Search for a State by name. Advances directly to a specific state in an opened protocol. Find Again… – Find another state of the same name after employing the State Name option from the Find menu. State Number… – Enter the state number to go directly to that state. Settings Protocol Settings… – Set the Linc configuration and provide names for the switches. The default Linc
configuration is ½ Linc 4 Inputs per station. That is, the protocol will control (receive inputs from and set stimuli on) one half of a Habitest Linc. The other half of the Habitest Linc can be used to interface to a different station. This configuration will allow you to run up to 16 different stations from a single computer. Each station can be running the same or completely different protocols. The other configuration options are:
- 1 Linc 8 inputs per station (maximum of 8 stations per computer)

Graphic State Coulbourn Instruments
12
- 2 Lincs 16 inputs per station (maximum of 4 stations per computer) - 4 Lincs 32 inputs per station (maximum of 2 stations per computer)
Note for GS3 Users: Unlike previous versions of Graphic State, protocols with different Linc configurations can be run simultaneously on different stations from a single computer.
Run-Time Display – Specify the data that will be displayed when the protocol is running. Five items are displayed in every session:
- Protocol Name - Subject ID - Elapsed Time - Active State - Previous Active State
Additional options include: - Input Totals - total number of inputs based on the onset of any switch response and/or the total
number of inputs based on the offset of any switch response - State Entry Totals – (SE) the number of times a specified state was entered during the session - State Time Totals – (ST) the duration a state was active during the session - Register and Counter values (when the Math option in active)
Protocol Description – Enter a description, notes or instructions about the protocol (optional). Counters – View or modify the list of global counters (refer Counters on page 15) Registers – View or modify the list of Registers, or specify starting value (refer to Registers on page 16) Lists – View or modify a list Show Reg/Ctr/List # - Displays the ordinal number of registers, counters, lists in the GoTo displays Allow Math – Toggles between allowing Math function capability and disallowing math operations when
constructing a protocol. Help Show Context Sensitive Help – Displays (or hides) the floating context sensitive help window. When activated,
hover the cursor over any control or indicator in the active program window and the context sensitive help window displays information regarding that element.
About… – Displays the opening icon (“splash screen”) that includes the version number. Check for Updates… – If the computer is connected to internet, checks to see there is a more recent version of
Graphic State available and if so, opens a browser to the Graphic State software updates page. Updates are available at no charge.
Controls, Indicators and Operation A minimal (blank) Protocol can be created using the File->New menu item. It contains the Ready and Finish States (RDY and FIN), 1 intermediate State (S1) and the Global State (GBL). Stimulus and Input Configuration Select the Protocol Configuration item from the Settings menu to set the number of ½ Lincs being used by the Protocol. The group of ½ Lincs used by the Protocol is referred to as a Station; use the “Lincs per Station” pop-up menu to select ½, 1, 2 or 4 Lincs. Use the array of text boxes below the Linc display to give each of the 4 inputs to a ½ Linc descriptive names. Each input can have 2 names, one for a stimulus onset (transition from OFF to ON) and one for stimulus offset (transition from ON to OFF). The defaults for the names (On1A1, Off1A1, etc.) can be used, but more descriptive names are helpful during protocol configuration and data analysis. Specify the Onset name for an input first; the same name will appear for the Offset. The Offset name can then be edited independently, either replacing or adding to the existing name. Each Protocol can be given a name (distinct from the name of the file in which it is stored). Optional.

Graphic State Coulbourn Instruments
13
Register Math For many protocols, Registers are not needed. But for more complex protocols, Registers makes it possible to pass information from State to State, and modify Exit Criteria as a session progresses on the basis of previous subject behavior. This allows for extremely flexible and powerful protocols. To enable Register Math for a Protocol, select the Show Math item from the Settings Menu. See Registers and Counters below. State List Control The State List has several uses.
- To select which State is being displayed in the Stimulus and Go-To displays, click on the corresponding
line of the list. - To create a new State, delete a State from the list, copy a State, or paste the most recently cut or copied
State into the list, right-click on the desired line. - The right-click menu can also be used to create multiple new States, or paste multiple copies of the most
recently cut or copied State into the list. To give a State a descriptive name (e.g., Reward, Time Out, Lever Press), right-click and select “Description”. Status Indicators To the left of the State List the red/green indicators show whether the State is ready to run (green) or contains errors (red). Errors can be local to the State, such as an incomplete GoTo. But an error is also indicated for a State if it is not targeted by any other States. To see a list of what other States target a State, hover the cursor over that State. The FIN state indicator will remain black until it is targeted by another State. A fourth status (blue), indicates that all of the States GoTo’s have the potential to be withdrawn (see Lists below). In other words, each GoTo uses a List that has the potential to run out of elements. In that case, the protocol could get stuck in the State at some point during a session. It is advisable to correct any such conditions. Note that any State can be run, whether it contains errors or not. This can be useful for testing protocols as they are developed. But it is recommended that any errors be resolved before using a protocol in an experiment. Stimuli The Stimulus display shows the configuration of the programmable stimuli on the Linc interface that will in effect during the selected State. Each State has its own stimulus configuration. Depending on how many ½ Lincs you’ve chosen to be controlled during the current Protocol, the corresponding number of Linc controls will be active in the program window. Stimuli are activated immediately (within 1 ms) on State entry. To turn a stimulus on during a State, click on the corresponding button in the stimulus display. Stimuli can be made to flash at any rate and for any number of cycles. By default, a stimulus will simply be turned at State entry and be left on for the duration of the State. To set a stimulus to flash, right-click its button and select Configure. Use the dialog to set:
- Steady or Pulse (whether the stimulus flashes) - Starting State of the stimulus (On or Off: Bright Green Bar indicates stimulus will start on) - On and Off duration in seconds. Minimum duration is one millisecond (0.001 seconds) The frequency of
pulsing will be 1/(On Dur + Off Dur) - Number of times the stimulus will flash. To have the stimulus repeat until the State terminates select the
“Until state terminates” in the “Repeat” options. When a stimulus is configured to pulse, the button for that stimulus will contain a black dot in the middle.

Graphic State Coulbourn Instruments
14
Legacy Stimuli: It is important to consider what will happen if you set a stimulus to flash for a fixed number of cycles: In some cases, the State might terminate before the cycles are complete. For example, you could specify 10 flashes at 1 second per cycle, and the State terminates after 6 seconds. There are two possibilities in the case, controlled by the When State Terminates radio buttons: either terminate the flashing when the State terminates, or continue flashing until the cycles are complete. In the latter case, depending on the duration of subsequent States, the flashing could continue through several States until it is done. There is a further level of control that Graphic State gives you in regard to these “Legacy Stimuli” that continue beyond the State in which they are initiated. Note that when a State is allowed to complete its flashing cycle in the next State, it will normally over-ride whatever settings have been made for that stimulus in the next State(s). There may be some States however, for which you never want allow a previous State to over-ride a stimulus setting. For those States, right-click on the stimuli for which you want to override any previous State’s flashing configuration, and click the Deny option in the Legacies control (upper right of the Stimulus configuration window). Any left-over flashes from previous States (Legacies) will be cancelled. You do not have to set the stimulus on or to flash in order to deny legacy stimuli.
GoTo’s GoTo’s are the heart of a protocol, in that they determine the progression of States during a session by defining the conditions under which a State transition will occur. GoTo’s are displayed underneath the Stimulus Diagram to the right of the main window. Each GoTo consists of the following elements:
- Number (Goto #): Right-click on this indicator to add or delete a GoTo. This control will have a yellow
background if the GoTo is improperly configured and might cause an error during a session. Hover the cursor over the GoTo line for a couple of seconds to display a list of possible errors.
- Reset: When this blue button is clicked on (bright blue), the counter associated with the GoTo is reset to 0 upon each State entry. The counter is always reset when the criterion is met, but since a state may include more than one GoTo, the State might exit before the criterion of some GoTo’s are met. When this happens, the Counter will NOT be zero when the State is entered the next time, and counting will continue from wherever the GoTo left off in the previous round. In some cases, this behavior may be desirable. But if it is not, click the Reset button to ON (blue). Now, the counter will reset to 0 every time the State is entered. Reset is set to ON by default for GoTo’s with Parameter set to Time or Input. Reset is set to OFF for GoTo’s with Parameter set to Entry. Since Entry GoTo’s by definition count how many times a State is entered, it would make no sense in that case to reset the counter when the State is entered.
- Parameter: Right-click to select what parameter will be tested to determine when the State will complete. There are 4 types of parameters:
- Time: Time can be specified in millisecond, seconds, minutes or hours. During a trial, time is tracked with a resolution of 1 ms.
- Input: The GoTo tracks the number of times a switch input occurs. The different inputs are listed (with their user-defined names) in the Inputs submenu of right-click menu.
- State Entry: Keeps track of how many times the State has been entered. Each time the State is entered, a counter will increment.
- Register: When the Math option is activated, the current value of a Register may be used as the Parameter for the GoTo. For example, it may be desired to exit a State when the value of a Register is greater than or equal to a fixed number, or the value of another register. See Math below.
Counters: When the parameter type is set to time, inputs, or State entries, (but not a Register), the GoTo keeps track of the current value of the parameter using a Counter. By default, a GoTo

Graphic State Coulbourn Instruments
15
uses a counter that is local to the GoTo. No other States or GoTo’s have access to the value of this local counter. Its value is preserved between the time the State exits and the next time it is entered, except under two circumstances. 1) The local counter is reset to 0 on State exit if the GoTo has reached its Exit Criterion, or “hits”. 2) The local counter is reset to 0 on State entry if the Reset button is set. That is, if neither of these two conditions is met, the value of the local counter is the same on State entry as it was on the last State exit. There might be some circumstances, however, when it would helpful for two different GoTo’s to use the same counter. For example, you might be monitoring responses on an input in three different States and want to trigger an exit from each of those States when the total count over all three States reaches some value. Or you might be keeping track of elapsed time over the course of several different States and want to trigger an exit from each of those States when the total time reaches some value. In these cases, you can use an External Counter. External Counters act very similarly to the local counter, but are accessible from any State (see Counters below). External Counters are selected or created from the Counter submenu of the Parameter Control’s right-click menu. Note that all counters in Graphic State are “up” counters. An input event, State entry, or the passage of time increments a counter. A reset sets the counter’s value to 0. The value of a Counter can never be less than 0.
- Comparison: How the counter or Register is to be compared to the Exit Criterion in order to meet the
GoTo requirement. When Math is not enabled the only option is >= (greater than or equal to). With Math enabled any of the following options can be selected:
- <= (less than or equal to) - > (greater than) - < (less than) - = (equal to) - ≠ (not equal to) Together with the Exit Criterion, the Comparison operation setting determines when a GoTo reaches criterion. Only > and >= make sense for use with counters, since counters count up. Otherwise, the comparison will likely be true immediately upon State entry when the Counter is 0. Use <, <= or ≠ only for Register-Register comparisons.
- Exit Criterion: There are three ways in which the Exit Criterion can be specified. - Fixed value: A fixed value is the simplest in which a value is chosen directly and used each time
the State is entered. You can click on this control and enter the value manually, or right-click to bring up a setting dialog.
- List: If a List is specified, a value from the list is chosen each time the State is entered, according to rules specified for the List (See Lists below).
- Register: If a Register is specified, the current value of the Register is used for comparison to the Counter value. Register values are manipulated using the Math functions specified for each State (see below). Registers are available only when the Show Math item is selected in the Setting menu.
- Probability: A value between 0 and 100 that specifies the likelihood that when the Exit Criterion is met
the GoTo will proceed to the target state. If P is 100%, then the State will exit every time the GoTo reaches criterion, unless the GoTo is conjoined with another GoTo (See AND below). If P is less than 100%, then the Go-To will cause a state transition in only P% of the cases in which it reaches criterion. In practice, the program picks a random number between 0 and 100 and triggers a State exit when that number is less than P. For example, if P=25, then on average in only ¼ of the cases that the parameter reaches criterion will a State exit occur. Note that no matter whether the probability test passes or fails, the GoTo’s counter (local or external) is reset to 0 because it has reached Exit Criterion. If the P test passes, however, a State exit will occur.
- Target State: A specific state (e.g. 7) or a State Target List consisting of multiple states is used to
identify where the protocol is to proceed when the GoTo is met. There are two other options that can be used. Entering “BACK” as the target will return the protocol to the state from where it came when the

Graphic State Coulbourn Instruments
16
GoTo is met. Entering “FIN” will cause the protocol to go to the Finished state and the session will terminate.
- AND: GoTo’s by default are logically OR’ed together. That is when multiple GoTo’s are specified in a
single state, the first one to meet the exit criterion will cause an exit from the state. The AND option changes this so that two or more states can be logically AND’ed (conjoined). Right click on the green AND button of one GoTo and select Group 1. Do the same for one or more additional GoTo’s to conjoin the GoTo’s as a group. When states are conjoined, they are identified by group number so multiple groups of AND’ed GoTo’s can be used in a single state. It is also possible for two AND’ed GoTo’s to have different Target States. In this case, the target specified in the last GoTo to reach criterion is used to determine where the protocol will go. When using multiple AND groups, the groups are OR’ed in the same way that single GoTo’s are OR’ed by default. That is the first Group to have all of the GoTo’s in the Group met will determine where the next progression of the protocol.
FIGURE 13
Configure the GoTo by right-clicking on any of its elements. Add or delete a GoTo by right clicking on the “GoTo #” indicator. If a GoTo is improperly configured and might cause an error when running a session, the background behind the GoTo number will be dark pink. If there is an issue with any GoTo in a state, the indicator to the left of the state number is red. Hover the cursor over that GoTo line for a couple of seconds to display a list of possible errors. See Figure 14.
Graphic State Coulbourn Instruments
17
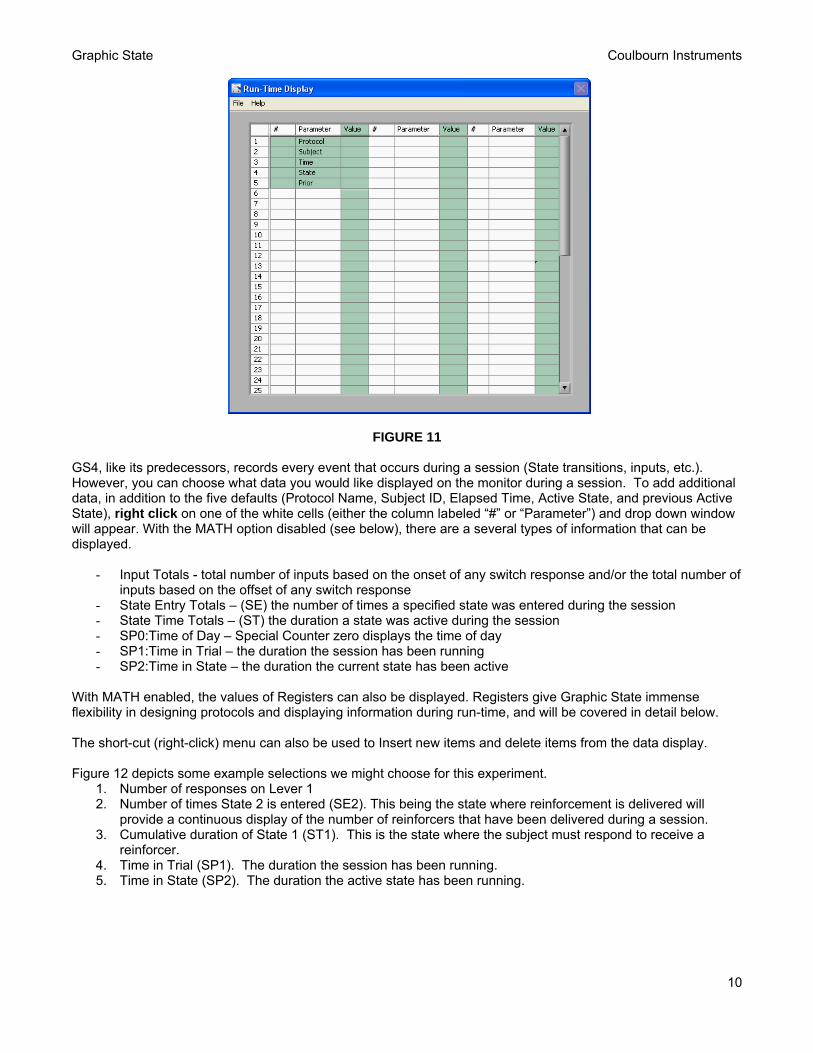
FIGURE 14
Correct the error and the background of the GoTo number changes from yellow to white and the bar next to the state in the state list changes from red to green. To insert a new GoTo, copy or paste an existing one, or delete a GoTo, right-click on the GoTo # indicator.
Counters Local Counters When counting switch inputs, time, or State entries, a GoTo, by default, uses its local counter. The value of the local counter is only available to its GoTo. The local counter is reset on State exit whenever it reaches its GoTo’s Exit Criterion, no matter whether the State exits or not. A reset also occurs on State entry if the GoTo’s Reset button is set. Conversely, if the State exits before the counter reaches the Exit Criterion (because another GoTo has hit), and if the GoTo’s reset button is not set, then the value of the local counter is preserved until the next time the State is entered. That is, on the next State entry, the counter will be the value it had when the State was last exited. Note that all counters in Graphic State are UP-counters. That is, they start at 0 and count upward when an Event or State Entry occurs, or when time passes. External Counters When the “Allow Math” option is on (see the Settings menu in the Protocol Builder), any GoTo can access an External Counter for keeping track of time, state entries or input events. External Counters don’t belong to any single State or GoTo: They are created at the level of the Protocol. But they are available for use in any State. Any number of External Counters can be created and given unique names using the Counter dialog, which is opened from the Settings menu or by right-clicking the Parameter control in the GoTo list and selecting Counter->New. Like Local Counters, an External Counter gets reset by a GoTo that uses it when the Counter reaches the Exit Criterion for that GoTo. It also gets reset on State entry if the GoTo that uses it has its Reset button set to ON (blue). External Counters have type, either Input, Entry or Time. That is, an Input type counter can only be used in GoTo’s that count input events; an Entry type counter can only be used in GoTo’s that count State Entries; a Time counter can only be used in GoTo’s that count Time. Example: An External Counter named IdleTime is used in GoTo 3 of State 4 to count seconds. State 4 exits to State 10 as a result of GoTo 1 (which counts inputs) after 43 seconds, so IdleTime has a value of 43. GoTo 1 in State 10 also uses IdleTime and has an Exit Criterion of 80 seconds. After 37 seconds (80 – 43), then, GoTo 1 will hit and cause an exit from State 10. Upon exit, IdleTime will have a value of 0; it gets reset because GoTo 1 hits its Exit Criterion. Unlike Local Counters, External Counters can be used in Register Math (see below). That is, the mathematical expression that is used to calculate the value of a Register on State entry can include the value of any External

Graphic State Coulbourn Instruments
18
Counter. This feature makes External Counters useful for tracking the progress of a session and modifying the sequence of State on the basis of subject behavior. It is also useful to displaying the progress of a session. You can, for example, set the value of a Register to the current value of an External Counter and then display the Register in the Run-Time displays. The value of any counter, whether local or External, cannot be changed using Register Math. Its value only changes when it is actively counting in a GoTo that is set to use it.
Registers Note: To use Registers, you must activate the Allow Math option in the Settings menu of the Protocol Builder (GraphicState.exe). Registers are simply places to store numbers, very much like the variables in a programming language. The Register belongs to the Protocol (not to a State or GoTo) and their values are available to any State or GoTo. Registers are created and named in the Register dialog, which is accessed from the Settings menu or by right-clicking the Exit Criterion control or the Parameter control in a GoTo. Right-click in the list of Registers to create, rename or delete a Register. Registers are only available when the Show Math option is on for the current Protocol (Settings menu). Registers have no type (unlike External Counters) and can be used in GoTo’s of any type (State Entry, Time, and Event). The starting value of a Register is 0 by default, but can be set in three ways.
- In the Register Dialog, right-click on the “Starting” column to set the value that the Register will have at the start of a trial.
- A simple Math Expression (see below) can be placed in the RDY State, such as 1 >> TotalCounts where
TotalCounts is the name of a register.
The two methods above – Using a math expression in the RDY state or setting the starting value in the Register Dialog – will give the same starting value for every run of the protocol. There may be times, however, when you want to give a Register a different starting value on each trial. For example, the starting value of a register at run-time could be set to the weight of an animal. That register value would then be used to set the Exit Criterion of a Time GoTo at some point in the Protocol, which in turn would control the time that an injection pump is on. Or, a Register can be set at run-time to the number of times an animal has previously been run in the protocol, and the number of lever presses required in a particular State can be set accordingly. To select a starting value for a Register at Run-time, first add Register to the Run-Rime display. To do so, open the Run-Time display window in the Protocol Builder, right-click on one of the blank spaces in the display table and select the register to be displayed. Now, to set the register value at run-time, load the protocol, right-click on the displayed name of the register and select Starting Value.
Register Math The real power of Registers lies in two features of the program: 1) They can be used as an Exit Criterion in any GoTo, or as a Parameter in a GoTo. 2) The value of a Register can be set using Math expressions upon entry to any State. That is, the value of a
Register can be calculated from a wide array of mathematical operations performed on the values of other Registers and External Counters.
To set the Math Expression for a State, open the Math Expression dialog that is used to configure expressions by double-clicking or right-clicking the Expression indicator (just above the GoTo’s). The indicator is only visible when Show Math is selected in the Settings menu. In the dialog, specify mathematical expression using the values of other Registers and External Counters (for details, see Math Configuration below). These expressions will be used to calculate the value of the target Register upon State entry.

G
Row AinS
I S B% T
Graphic State
Register expreoperations (suwas modified
As an exampln a previous SState, and an
n the Correct
Similarly, in th
Both the Corre%Correct and
The Done stat
e
essions are euch a counterin the first ex
e, let’s imaginState. We staincorrect res
t State we will
he Incorrect S
rect and Incord places it in th
te appears in
evaluated upor resets). Multxpression, tha
ne that we waart with a Testponse (time o
l use a simple
State, we will u
rrect States tahe Register P
Figure 16.
on entry into atiple expressit modified va
ant to calculatt State in whicout of 5 secon
F
e Math Expre
use a Math E
arget the DonePercentCorrec
F
a State, and thons are evalulue will be us
te the percench the correcnds) will send
IGURE 15
ssion to incre
xpression to
e? State, whict: 100 * Corr
IGURE 16
he new valueuated sequened in subseq
tage of correct response w
d the Protocol
ement the Reg
increment the
ch contains arect/(Correct+
C
es of Registerstially, so if a Ruent express
ct responses ill send the pr to the Incorre
gister C: C+1
e Register I: I
an Expression+Incorrect) >>
Coulbourn Ins
s set prior to Register valuions.
that the subjerotocol to the ect State.
>>C.
+1>>I.
n that calculat PercentCorr
struments
19
any other e that
ect gave Correct
tes rect

G
F
Acb(Nb Asbfbwg Hlio
O
E TETa
Graphic State
Figure 17 disp
At the start of contain the mbeing used asGoTo 2) and
Note also the back to State
A second exastimulus of ranbe delivered wfrequency eacbetween 0 anwould then begenerator. (Ri
Here is a set oimits the resuof rand, min a
T + randmin(T, 3)max(T, 1
Or, to make th
Expression
To configure tExpression baThe Math Conan Error indict
e
plays the Mat
the Done? Sost recent ca
s the ParametPercentCorreuse of the AN1 (after 1 sec
mple of how ndomly is delwith randomlych time a Statd 1, so this ex
e used to set oight-click on a
of expressionult to a range and max):
(x) – 0.5 >> T) >> T ) >> T
he expression
n Configur
the expressioar (just below nfiguration diator and Error
h Expression
tate, the exprlculation of %ter in a GoToect is greater ND controls. Icond) to repea
Math expressivered throug
y varying frequte is entered: xpression willone of the Proa Programma
ns that incrembetween 1 an
T
ns as cryptic a
ration
ns for a Statethe Stimulus
alog shows a text for each
as it appears
F
ressions get e%Correct. Noteo. When Corre
than 75 (GoTIf either of theat the Test.
sions might begh a programmuency on an Arand(x) * 750l generate a rogrammable ble output PR
ments the Regnd 3 (see the
as possible: m
e, first select t display) to olist of ExpresExpression.
s in the Math
IGURE 17
evaluated, ane that in the Dect (the numbTo 1), the Proese two criteri
e used arisesmable (analogA12-33 tone g00 + 2500 >> random numboutputs conn
RG 1 or PRG
ister T by a ralist of accepte
min(max(T+ra
the Show Mapen the Math
ssions and co
Configuration
d the value oDone? State, ber of correct otocol will movia is NOT me
s in a protocog) output on agenerator, anFreq. rand(x)
ber between 2ected to the F2 to specify w
andom value ed functions i
and(x)-0.5, 3),
th item in theh dialog (or rigorresponding T
C
n Window:
of the Registethe values oftrials) is greave to State 5,t, then GoTo
l in which a raa Linc. If, for en expression c) generates a2500 and 100Frequency inpwhich register
between -0.5in the Append
, 1) >> T
Settings menght-click and sTarget Regist
Coulbourn Ins
r PercentCorrf two Registerter than or eq which then e3 moves the
andomly varyexample, a tocan be used t
a random num000. The Regiput for the tonr to use for ou
5 and 0.5 anddix for an exp
nu. Double-clselect Configuters. You will
struments
20
rect will rs are qual to 15 exits. Protocol
ying one is to to set the
mber ister Freq ne utput.)
d then planation
ick the ure). also see

Graphic State Coulbourn Instruments
21
Build an Expression using the names of Registers, the names of Counters, numeric constants (2, 4.7, -9), operators (+ - * / ^), parentheses, or permissible functions (See Appendix the Context Help for the Expression control). You can simply type an expression by hand into a line of the Expression control. Or, you can right click at any point in an Expression and select a number of preconfigured elements to be inserted at the cursor. These elements include operators and the names of existing Registers and Counters. In addition, you can select from three sets of preconfigured counters. During run-time, Graphic State keeps track of the total number of times that an input has been activated, the total number of times a State has been entered, and the total time spent in each State. You can access these values in Expressions from the right-click menu of an Expression. The special registers have preset names such ST4, SE10 and On1A3, which represent time in State 4, Entries into State 10 and Onsets for Input 1 on Station A3. As you enter an Expression, the error indicator will turn dark green or yellow as the Expression becomes valid and invalid. When yellow, some text will appear to the right to give a description of the error. These messages can be somewhat cryptic. Check for unbalanced parentheses, misspelled names, and sequential operators. Note that upon entry into a State, Expressions are evaluated in the order in which they are listed. And order matters. Let’s say, for example, that a State has 2 expressions, in the following order. ST4 * 10 >> Reg1 ST5*10 + Reg1 >> Reg2 If Reg1 has the value 20 upon entry into the State, and SE4 is 4, Reg1 will immediately take on the new value 40. 40, and not 20, therefore, is the value that will then be used to calculate Reg2, since Reg2 is set after Reg1.
Lists Lists are simply that, lists of values that can be drawn upon during the execution of a protocol. Any GoTo can access a list of the type matching its parameter type (Event or Time). Each successive call to a given list produces a value as determine by the List configuration (below). For example, a GoTo might be set to select its Exit Criterion from a List with the values 1, 2, 3, 4, 5, to be taken in order. The first time the GoTo executes, its Exit Criterion will be 1; the second time 2, etc. Multiple GoTo’s can draw from the same list. If, in the example above, a second GoTo in another State (or in the same state) also draws from the List, and executes after the first GoTo has executed 3 times, its Exit Criterion will be 4. Lists can also be used for the Target of a GoTo. For example, if a list contains the items 5, 6, 7, 10, then at GoTo will target these different States when its Exit Criterion is reached (and the probability test passed). Use the value -1 in a target list to represent BAK (the previously entered State). The value Inf (infinite) can be used to represent the FIN state. Note that a new value will NOT be selected from a List unless a GoTo reached its Exit Criterion on the previous entry into the State. For example, if GoTo 1 uses a list and the State exits on the basis of another GoTo, the same List value will be used by GoTo 1 when the State is next entered. Lists are created in the List dialog, which can be accessed from the Setting menu or by right-clicking the Target or Exit Criterion controls of a GoTo. In the dialog, right-click in the list of Lists to create, rename or delete a List. Double-click a line in the list to enter values into the list and configure how elements are selected. In the List configuration the values in the list can be set, along with the behavior of the List during run-time. List Values Enter the desired list values into the List Items control. Use the vertical scrollbar to access items beyond #15.

Graphic State Coulbourn Instruments
22
You may also use Math to set the values of a list, using the variable x in a mathematical expression to represent the item number. For example, enter “x” into the Math textbox and click the “Eval” button (or hit the Enter key). With the “# of items” control set to 10, the values 1 through 10 will appear in the list. Enter x+10 to get the values 11 through 20, or 11-x to get the values 10 through 1. x^2 (x to the power 2) or x*x will generate the squares of the values 1, 4, 9, 16, 25, … 100. 2^x will generate 2, 4, 8, 16, etc. A wide variety of functions is also available for use, such a log (logarithm base 10), ln (logarithm base e), exp (exponent), and rand (random number between 0 and 1). See the Appendix for valid functions. The Eval button will indicate whether the expression entered into the Math textbox is valid or not. When the expression contains errors, the button will be dimmed and disabled. Note that the Math functions are used to populate the List only when you press the Evaluate button. The resulting values (and not the function itself) are what are passed to the Run-Time engine during a session. In other words, a list of items such as 2 4 6 8 10 in a list work identically, no matter whether they were entered by hand or created using 2*x in the Math functions. Selection order At run-time, the values in a list can be selected in three different ways.
- In order: The program starts with item 1 and proceeds down the list with subsequent choices, removing values from the list as they are used.
- At random - replacement: Items are chosen at random and the list is left unchanged. That is, items are
not removed from the list when used and are always available to be chosen when the list is used.
- At random - no replacement: Items are chosen at random, and removed from the list once used. When finished: With “In order”, or “At random – no replacement” the list can eventually be depleted. The “when finished” control determines what happens next. There are four options.
- Restart: The List is filled up again with its starting list of values. - Hold: Subsequent calls to the List give the last value that was selected from the List.
- Hold at: Subsequent calls to the List give the value specified in the numeric control to the right.
- Withdraw: Once the List is depleted, a call to the List gives Not A Number (NaN). A GoTo that requests a
value from the List therefore becomes inoperative and can generate no further hits for the remainder of the protocol. The GoTo is effectively withdrawn from the protocol. Note that a State with a GoTo that has the withdraw option set must have an alternate way to exit. Otherwise the State could be left with no way to Exit and protocol could get stuck in that State. Graphic State will warn you if a State only has GoTo’s that might be withdrawn (the state’s Status button to the left of the State list will turn blue).
Creating long lists manually can be a little laborious, so Graphic State allows Lists to be saved to a file, recalled, and reused (with or without modification), either in other protocols or multiple times within a single protocol. Its values and behaviors can then be recalled in other protocols or in other Lists within the same protocol. Use Import From File and Export To File in the File menu of the List Configuration Dialog to do this. The list files that are created in this way are not used at Run-Time or saved in a protocol. They are separate entities used for offline storage of list configurations.

Graphic State Coulbourn Instruments
23
The Global State The Global State is a special state, running in parallel with the main State sequence. At the beginning of the session, at the same time that the Ready state is entered, the Global is entered as well. When one or more of the Global GoTo’s hits and triggers a State Exit, the Global State’s counters are reset as usual, and then the Global state is re-entered, again, in parallel with the main State sequence. At the same time, the current State in the main sequence is forced to exit and proceed to the Target specified by the Global state. The Global State is useful in many different circumstances. Here are a few examples.
1) A Global State GoTo that counts Time and targets FIN after 30 minutes. This will simply end the session after 30 minutes.
2) A Global that counts lever presses through the duration of a session and targets FIN after a fixed number of responses on the lever. If the lever delivers a drug or food in the main sequence, such a Global GoTo would effectively track total dose or the total delivered amount of food delivered and end the session when a fixed limit was reached.
3) A Global that triggers a stimulus at random intervals, using rand(x) in a Math Expression and Register to reset its Exit Criterion on each Global State entry. To do this, have the Global target set to a State that triggers the stimulus. That State can proceed to a new State or use the BACK target to resume what was in process when the Global hit.
Note that both the main sequence and the Global can count events on an Input simultaneously. When an event occurs, both the counters in the main sequence and in the Global get incremented. The alternative to the Global State in these cases would be to add an additional GoTo to every State in the protocol that counts time or inputs on an External counter and targets FIN when a fixed exit criterion was reached. The Global State, then, greatly simplifies the protocol. Math operations can be employed in the Global state. At start-up, or when a GoTo hits and the Global State is exited and entered again, Math Expressions will be evaluated on State entry, just as in States in the main sequence. Global stimuli act differently from main sequence stimuli. The settings of the Global Stimuli (whether they are On or Off and whether they are steady or pulsing) effectively act as default settings for the States in the main sequence. That is, when a stimulus button is changed in the Global State, the new value is set in ALL States of the main sequence. Turn on the House Light in the Global State, for example, and it will then be set ON in all the States of the Main sequence. In addition, when any new State is created in the main sequence, the House Light in that State will be set to ON. The “default” values set in the Global State can be manually over-ridden in any State, by selecting a State and setting the stimulus to a different value from the one set in the Global State. In other words, the setting of the Global Stimuli only affects the settings of stimuli in the main sequence during Protocol configuration. At run-time, the Global Stimuli have no direct effect. To summarize, the Global State automatically starts up at the beginning of a session, and when it exits targets itself. When the Global State exits, the Global State triggers the currently occupied State in the main sequence to terminate and proceed to the target specified in the Global GoTo that triggered exit from the Global State. If that target State if FIN, the session ends.
Debugging a Protocol The State status indicators to the left of the State list provide a first-pass check on whether there are errors in a protocol. They will tell you whether the GoTos in the State are properly configured, and whether each State is properly targeted by other States. But even a protocol that resolves correctly can have underlying errors. The best tool for testing a protocol is to run it and track its performance in response to different inputs.

Graphic State Coulbourn Instruments
24
- Even without hardware connected to a computer, you can run a protocol in test mode and simulate the response of a subject using the on-screen inputs.
- Watch the Current and Previous State indicators in the Run-Time display to follow the progress of a protocol.
- Add Registers with diagnostic information about the progress of protocol and display them in the Run-Time display.
- Slow the protocol down during the testing phase so you can track its performance in real time. Add delay States or increasing the Exit Criterion of Time GoTo’s.
- The Event Log from a test run of a protocol will provide a detailed record of the execution of a protocol – States visited and changes in Register values – and can point you to any errors that occurred.
RUNNING AN EXPERIMNT To begin a session, start the Graphic State Run Time (GraphicStateRT) program (Figure 18). The first time you start this program with the USB interface connected a window displaying the serial number will be displayed. You will need to enter the password that was provided with the system. If you did not receive a password for any reason, contact Coulbourn Instruments and provide the serial number. A password will be e-mailed to you. You can continue without entering the password and you will be able to run the program in the Test Mode, where inputs can be simulated using buttons on the computer screen. From the File menu, select “Log File Directory”. This will identify the folder where the data files will be stored. Choose a folder or create a new folder. You can change this folder at any time.
FIGURE 18
The 16 tables correspond to the 16 ½-Lincs of the Habitest Hardware. If you are running fewer than eight (8) Habitest Lincs you can change the display to show only the number of Habitest Lincs you are using by selecting the “Lincs Displayed” option from the “Settings” menu. Choose the number Lincs you want to display. For example, if you choose four (4) Lincs, the Run Time display will appear as displayed in Figure 19.

Graphic State Coulbourn Instruments
25
FIGURE 19
Loading Protocols. To load a protocol, right-click on one of the tables and select “Load Protocol…”. (“Load Protocol…” is also the default operation for the table when the table is empty, so you may also simply double-click on the table.) Us the dialog that appears to select the Protocol file you wish to run, click the OK button in the Protocol File window and the name of the Protocol will appear in the first line of the Run Time display. Note that there must be enough free space in the tables to accommodate the protocol. For example, a protocol that uses one full Linc must be loaded into a ½-linc on the left side of the window, and the ½-Linc on the right side of the window much be free. If you are running a protocol that requires 4 ½-Lincs, the Linc below the one you are loading the protocol into must be free, and so on. Once a protocol is loaded, the table will show the display items the were specified in the protocol builder along with the starting values for any registers. Setting Register starting values. At this point, if there are any Registers for which you want to set starting values, right-click on the line displaying that register and select Starting Value… Enter the desired value into the dialog. As noted above, starting values for subject weight can be used in the protocol to scale drug doses, previous performance in a session can be used to set new performance criteria, and so on. Copying Protocols. To run the same protocol at multiple stations, with the cursor still in the area of the first Linc, right click the mouse again, choose the “Copy” option and specify the number of stations you want to add to run this protocol. The requisite number of ½-Lincs underneath the currently loaded protocol must be free. It is possible to run different protocols at different stations. Protocols can be loaded at any free station even while other stations are running sessions. Subject Names. Before a session can be run, the name of the subject must be entered. The name will appear in the name of the data file that stores the information from the session (log file). Right-click on a station where a protocol is loaded and use the dialog that appears to enter the subject name. (“Subject Name…” is the default operation for the table once a protocol is loaded, so you may also double-click on the table to set the name.) Note that multiple names can be entered into multiple stations using the dialog, so it is possible load the protocols into multiple stations and then enter the names all at once. Two options are available for simplifying name entry.
1) The first is cut-and-paste from a spreadsheet or text document. You can go to Excel, for example, and copy a list of names from a table, then open the Subject dialog in Graphic State RT and select Paste from Clipboard. The names taken from the spreadsheet will be sorted into the active protocols. The Paste item in the dialog’s menu or the CTRL-V performs the same action.

Graphic State Coulbourn Instruments
26
2) The second is the Assign Random Subject Names option in the Settings menu. When selected, names consisting of random strings of letters and numbers are automatically assigned when a protocol is loaded. The feature is useful for testing protocols, when named subjects are not being tested.
Running a session. Once the protocol and subject name are specified, the protocol can be run by right-clicking on the table and selected the Run item. (“Run…” is the default operation for the table once a subject name is set, so you may also double-click on the table to run.) To Start multiple protocols at once, select the Start All item from the Stations menu in the program. All properly configured Stations (with loaded protocol and specified subject name) will start. When a protocol is running, the display of Register values, current state, previous state, time and so on will be displayed. The current stimuli being sent to the Lincs will also be displayed on the indicators to the right of the program window. Activation of inputs on the Lincs are also indicated on the 2x2 array of red buttons at the upper right of each ½-Linc display. Note that all screen displays are updated at approximately 30 times per second. So while the appearance of stimuli or the occurrence of inputs on the Lincs are timed precisely to within 1 ms, the timing of the display on the screen may not be quite as precise. Similarly, stimuli or inputs to the Lincs that are shorter than 30 ms may not appear at all if they fall between two screen updates. Simulating inputs. When a protocol is running, the program detects inputs from the Lincs and passes these events to the protocol. If no Lincs are present (test mode), you can simulate inputs by clicking on any of the 4 red input buttons at the upper left corner of the Linc displays. (You must have the “Allow User Inputs” option in the Settings menu checked in order to allow screen-generated events.) These events are recorded in the data file but are tagged as “user events” rather than normal hardware-triggered input events. Even with Lincs present, the user input buttons on the screen can be operated. They can be used to prompt a subject, or inputs can be set aside in the protocol for specific user-triggered events. Pause and Resume. Sessions may be paused and resumed by right-clicking on the Station table and selecting Pause or Resume. These two options are the default actions of the table when the session is running or paused, so double-clicking a running session will pause it, and double-clicking a paused session will resume. To Pause or Resume ALL running sessions, select the Pause All or Resume All menu items from the Station menu (program main menus). When a session is paused, all counters of events and time are frozen. Pause and Resume events are recorded in the data file so that a record of any pauses is kept. Note that all events in a session are tagged with the real elapsed time from the Start of a session. The counter that keeps track of the time since the start of the session is NOT halted during a pause. If, for example, a session runs for 45 seconds, is paused for 10 seconds, and then an input occurs 5 seconds after the session resumes, the time of the input will be reported as being 60 seconds after the start of the session (not 50 seconds). Comments. To add a note to the data file for a session, right-click the station table and select Comment… Enter the comment text and click OK (or Cancel if you decide against a comment). The comment will be recorded in the data file as a comment event with accompanying text and a time stamp as the time the OK button was pressed. The session proceeds normally while the Comment dialog is open; entering comments does not interfere with session timing or responses to subject inputs. Halting a session. Sessions will halt automatically when they reach the FIN state. They can be stopped prematurely by right-clicking the station table and selecting Stop. A Stop event will be recorded in the data file. To Stop ALL running sessions, select the Stop All item from the main Stations menu. Reloading. Once a session stops, either manually or through reaching the FIN state, it can be Reloaded, a new subject name entered, and run using the right-click menu for the station table. Alternatively, the current protocol can be Cleared and a new protocol loaded. Yoking. In some experiments, a yoked procedure is necessary where one or more subjects are “yoked” to a master station. In these protocols, all stations are running the same protocol but only the actions of the subject in the “master” station have any effect on the protocol. Load the protocol in the master station. Yoked stations can only follow the master station in sequence so with regard to station number, the master station must be the lowest addressed Habitest Linc. For example, station 16 can never be the master. Station 15 can only ever have one station yoked (station 16) while serving as a master.

Graphic State Coulbourn Instruments
27
Once the protocol is loaded into the master station, with cursor in the area of that station on the left side of the display, right click the mouse, choose “Yoke…”, and a window will appear requesting the number of stations that will be yoked. Enter the number of yoked stations to be tied to this station as the master. For example, if three stations are to be yoked to the master station enter a 3. The background color of yoked stations will change from gray to blue. You can yoke other stations to another master. For example if you want to yoke three stations to a master, you could run as many as four master stations with a system consisting of 8 Habitest Lincs.
Program menus Setup files. Once you load, copy or yoke a group of protocols into their stations, you can use the Save Setup… item in the program’s File menu to save the configuration for later reuse. Use the Open Setup… menu item to load the all the associated protocols to the correct stations. The Setup File that you create must be located in the same folder as all of the protocols it uses. Show Hardware Status. This item in the Settings menu displays diagnostic information about the U90-10 and attached Habitest Lincs. Clock Speed. This dialog determines how often Graphic State checks for input events, and checks the exit criteria for Time GoTos. After each check, the program determines immediately whether the current State is to be exited and performs that exit and the subsequent State entry immediately. The maximum Clock Speed is 1 ms. Older computers, or laptops that get hot with heavy processor use might benefit from a slower setting. Context Help. As in the Protocol Builder (GraphicState.exe), selecting the Show Context Help menu item opens a floating window that displays information about any control. Hold the cursor over a control to see its contex help text.

Graphic State Coulbourn Instruments
28
DATA ANALYSIS For data analysis, Graphic State currently has three components. All are accessed through the Protocol Builder, (GraphicState.exe). The default system that the program uses for creating data files is to name them sequentially in time, with the name format YEAR-MO-DAY_HR-MN-SEC_SUBJ.gslog. A second option (Settings menu) puts the subject name first before the date and time so that files can be sorted easily by subject name.
Data format Data are stored in the file in binary format. If you are interested in accessing the data in gslog files directly, contact Coulbourn for specifics on the format. Briefly, the files contain three main components.
1) A copy of the protocol used to run the session. This protocol appears when you open the data file. It is, however, locked and so cannot be edited. This way, the exact protocol that was used to collect the data is always available with the data itself.
2) A header includes date, time of day that the session started, protocol name, subject name, the station on which the session was run, how many ½-Lincs were used, whether the station was yoked to another station, and whether any other stations were yoked to it.
3) A list of events. Each event includes the time of occurrence (in milliseconds relative to the start of the session), event type, and any data associated with that event. Event types include: - Session Start - Session Pause - Session Resume - Session Stop - Session End - State Entry - State Exit - Input (onsets and offsets) - User input (generated from the on-screen input buttons) - Master Input (generated in a yoked session from the Master Station) - Register (the value of a register generated by a Math expression on State Entry) - List (the value of the item drawn from a List) - Outputs (the value placed on one of the Programmable analog outputs) - Comments (text entered by the user)
Data Log Display The first analysis component is the Data Log, which is an ordered list of events that occurred during a session. In GraphicState (not GraphicStateRT), use the Open item in the File menu to open one of the data log files (extension .gslog) that are stored during a session. Data files are initially located in the LogFile Directory specified in the GraphicStateRT program, but can be moved or copied anywhere on the disk after they are created since they are stand-alone files. Once a data file is opened, you will see the full protocol used to run the session. You can view any component of the protocol, but it cannot be edited. To indicate that log file and not a protocol is being viewed, a small “Locked” indicator appears near the top of the window, and the background color of the window changes slightly. Open the Log by selecting the Log… item from the Analysis menu. A table of Events will appear with their times and data (Figure 20). You can choose to display the data in two different formats using the Settings menu. GS3 format sort the input events into different columns for each input and should be compatible with legacy spreadsheets and macros used for analysis of GS3 data. GS4 format list the events in a single set of columns with each event labeled according to its type and data. With GS4 format, you can filter the display using the checkboxes to the left of the display table. Click on the checkboxes for each type of event to toggle their display on and off. Right-click on any of the checkboxes to turn them all on or all off. In addition, you can Highlight in color different subsets of events using the Highlight drop-down menu. When you choose to highlight States entries or exits, or Inputs, or Register value changes, you can
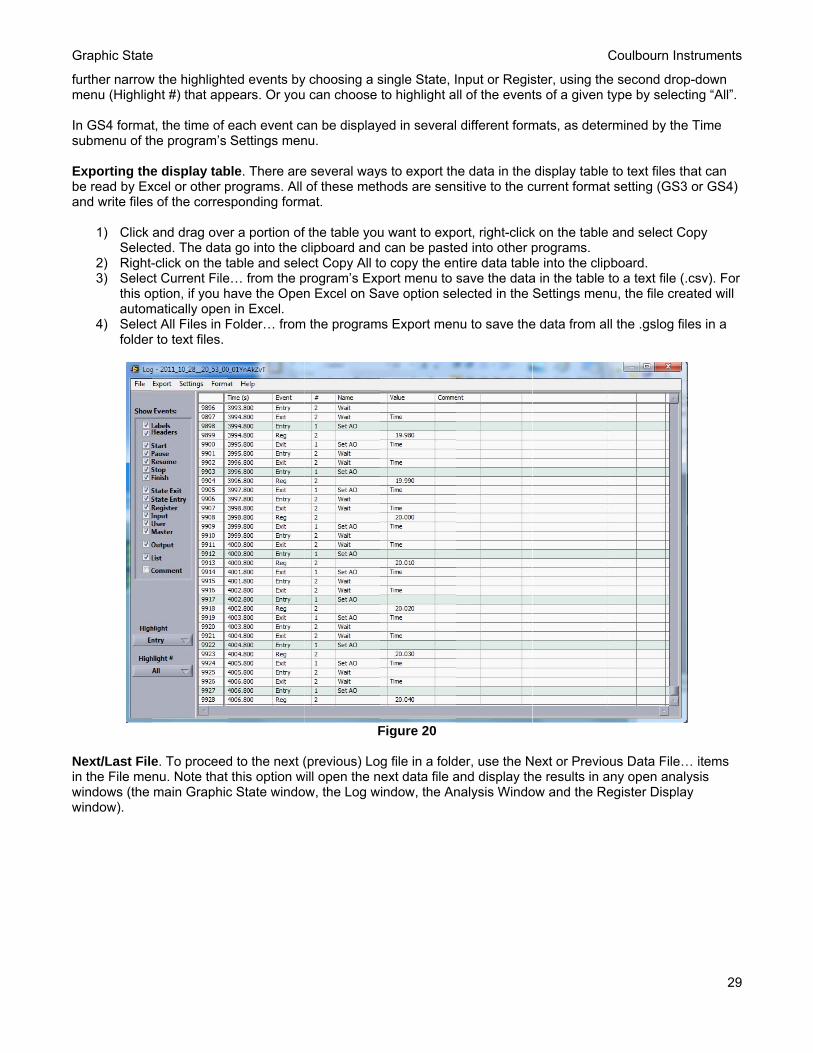
G
fm Is Eba
Ninww
Graphic State
further narrowmenu (Highlig
n GS4 formatsubmenu of th
Exporting thebe read by Exand write files
1) Click Selec
2) Right-3) Selec
this oautom
4) Selecfolder
Next/Last Filen the File mewindows (the window).
e
w the highlightght #) that app
t, the time of he program’s
e display tabxcel or other ps of the corres
and drag ovected. The data-click on the t
ct Current Fileption, if you h
matically openct All Files in Fr to text files.
e. To proceednu. Note that main Graphic
ted events bypears. Or you
each event caSettings men
ble. There areprograms. All sponding form
er a portion ofa go into the ctable and selee… from the phave the Openn in Excel. Folder… from
d to the next (this option w
c State windo
y choosing a su can choose
an be displaynu.
e several wayof these meth
mat.
f the table youclipboard andect Copy All toprogram’s Expn Excel on Sa
m the program
F
(previous) Lowill open the now, the Log w
single State, Ito highlight a
yed in several
ys to export thhods are sen
u want to exp can be pasteo copy the enport menu to ave option se
ms Export men
Figure 20
g file in a foldext data file aindow, the An
Input or Regisll of the event
different form
he data in the sitive to the c
ort, right-clicked into other pntire data tablsave the data
elected in the
nu to save the
der, use the Nand display thnalysis Windo
C
ster, using thets of a given t
mats, as dete
display tablecurrent format
k on the tableprograms. e into the clip
a in the table Settings men
e data from al
Next or Previohe results in aow and the Re
Coulbourn Ins
e second droptype by selec
rmined by the
to text files tht setting (GS3
and select C
pboard. to a text file (
nu, the file cre
ll the .gslog fi
ous Data File…any open analegister Displa
struments
29
p-down cting “All”.
e Time
hat can 3 or GS4)
Copy
.csv). For eated will
les in a
… items lysis
ay

G
A TwmtSisb Cp(COwotn
Tpcd
TlaR
Graphic State
Analysis D
The second dwindow can bmeasures on hat was run uState 2 and ths activated. Tbeing displaye
Counts and Rplot, right-clickhere, Onset T
Counts or RatOn1A1 for thewhere the seleoccurrences (he interval (8number of eve
The second apress of the inchosen, and Iduration are s
The settings fatency measuResponse (wh
e
Display
ata analysis ce used to viewthe frequency
using a very shen State 3 wThe “subject” ied.
Rates. The firk on the list oTime). The dete in the Analye specific inpuected events Counts = 43)5 ms). If Rateents per seco
nalysis is thenput button. Tnput On1A1 i
shown. The su
for the Latencure starts on thich waits for
component acw the timing, y, latency andsimple protoco
waits for a singin this case w
rst is analysisf Analyses anetails of the aysis drop-dow
ut to be analyoccurred. Th
), the mean ane is chosen inond instead of
duration of thThe settings lois selected foubject held th
cy analysis reqthe Trigger eva single pres
ccessible fromlatency and d
d duration of eol: A cue lightgle input on Inwas a human
s time of occund select Newnalysis are sewn menu (topzed. A plot ofe statistics thnd median int
nstead of Couf the total cou
F
he response. ook for this anr viewing. Foe button dow
F
quire a few mvent, which th
ss of Input 1).
m the Log meduration of evevents. Threet comes on innput 1. The sepressing the
rrence of eacw, and give thet in the clust
p left in the cluf points appea
hat appear in tter-event inte
unts, the grapunts. No mean
Figure 21
That is, the inalysis are shr durations, th
wn for 88 ms o
Figure 22
more controls his case has bEach latency
enu in Graphicvents graphicae analyses aren State 1 for oequence starton-screen inp
ch press of thee analysis a ner of drop-do
uster). Select ars in the top the analysis trval (1.382 seh is the samen, median or S
nterval betwehown in Figurehe mean, medon average wi
that Duration been chosen y measure en
C
c State is the ally, and to vie shown in Fi
one second, thts again at Stput button. Th
e Input buttonname in the Dwn menus to Inputs for theline of the an
table include tec), and the se, but the numSD are given
een the onset e 22. A Duratdian and stanith SD of 32 m
of Counts (Fto be an entr
nds one the T
Coulbourn Ins
Analysis Disew statistical igure 21 for ahe cue light gtate 1 when thhree analysis
n. To create sDescription dithe right. Sel
e Type, and thnalysis graph the total num
standard deviambers reporte
in that case.
and offset fotion analysis indard deviatioms.
Figure 23). Eary into the Starigger event,
struments
30
play. This
a session goes off in he Input plots are
such a alog lect hen to show ber of ation of d are the
r each is on of the
ach ate called which in

G
tm
CscwS SbctIincb
Esc AeaYSit ScrA Ninww
Graphic State
hs case has bms, with a sta
Contingencieselected evencan be filteredwhich they ocState or an inp
Session subsbuttons at thecontrols expanrial length (%n addition, yontervals (# Intcluster of contbeing displaye
Exporting Anstatistics and cluster, statist
An image of thexport to a draand save the You’ll likely finSome elementem from the
Saving Analycumbersome.recalling analyAnalysis Set…
Next/Last Filen the File mewindows (the window).
e
been chosen andard deviati
es. In the illusnts were graphd by the Stateccurred (In Staput event.
set: By defau left of the cond as shown
%) or by seconou may cut thetervals), and trols. Note thaed. You can d
nalyses: To mselect Copy ttics will be inc
he graph can awing programimage to a file
nd that the elents will also haObject menu
ysis settings You can avoyses to and fr
…
e. To proceednu. Note that main Graphic
to be the Onsion of 111.
strated examphed and anal
e they follow (ates:). When
ult, the analysnfiguration pain Figure 24.
nds (Sec). Sete selected pothe currently at a scroll-bardrag the scrol
move the analto Clipboard. cluded for the
be exported m like Illustrae. Open the fements are grave clipping m.
. Setting up coid have to recrom the disk.
d to the next (this option w
c State windo
set event on
F
ples, the Contyzed. Use the
(After State:), a contingenc
es are performanel allow youSelect wheth
t the Start andortion of the sedisplayed inter appears undl bar to view o
F
lysis results inNote that if m full session i
by right-clickator (for makfile in Illustratorouped togethmasks, which
complex analyconstruct theUse the Save
(previous) Lowill open the now, the Log w
Input 1. Here
Figure 23
tingency conte Contingencthe Input evey is selected,
med on the fuu to select a sher you want td End controlession into Inerval (Intervaderneath the gother portions
Figure 24
nto a spreadsmultiple interva
n addition to
ing on the graing high qualior. All of the eher. Use Illustyou can rem
yses with mulm each time ye Analysis Se
g file in a foldext data file aindow, the An
the mean res
trol was set toy control to fi
ent they follow a pull-down
ull duration ofsubset of the to select a pols accordingly
ntervals of equal) with the pugraph to indics of the graph
sheet, right-clals have beenstatistics for e
aph and selecity figures for elements of thtrator’s Ungroove by select
ltiple lines andyou open the
et… item in th
der, use the Nand display thnalysis Windo
C
sponse latenc
o All, meaninglter the analyz
wed (Triggeremenu appear
f the session. trial. When S
ortion of the try to select a pual length. Sell-down menucate which poh.
ick on the nun set using theach interval.
cting Export Spublication),
he drawing wioup function toting the Clipp
d contingenci Analysis wine File menu,
Next or Previohe results in aow and the Re
Coulbourn Ins
cy of the subj
g that all of thzed events. E
ed by:), or thers for selectin
The All/SubsSubset is chosrial as a perceportion of the elect the numus at the bottoortion of the se
merical displae Subset con.
Simplified Imause the EPS ill then be edio separate thing Mask -> R
ies can be ndow by savin
along with O
ous Data File…any open analegister Displa
struments
31
ect is 343
e Events State in
ng either a
set radio sen, the ent of the session. ber of om of the ession is
ay of the ntrol
age. For format
itable. hem. Release
ng and pen
… items lysis
ay
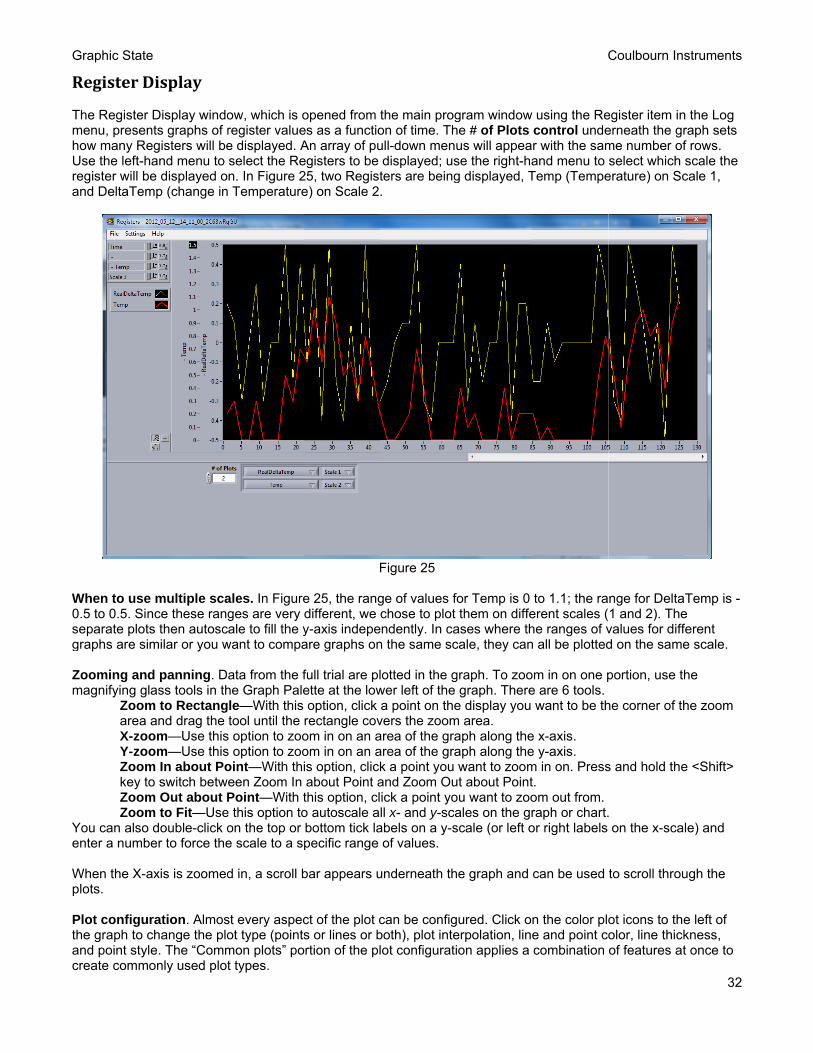
G
R TmhUra
W0sg Zm
Ye
Wp
Ptac
Graphic State
Register D
The Register menu, presenhow many ReUse the left-haregister will beand DeltaTem
When to use 0.5 to 0.5. Sinseparate plotsgraphs are sim
Zooming andmagnifying gla
Zoomarea aX-zooY-zooZoomkey toZoomZoom
You can also enter a numbe
When the X-aplots.
Plot configurhe graph to cand point stylecreate commo
e
Display
Display windonts graphs of registers will beand menu to e displayed o
mp (change in
multiple scance these rangs then autoscmilar or you w
d panning. Dass tools in th
m to Rectangand drag the om—Use thisom—Use this
m In about Poo switch betwm Out about Pm to Fit—Use
double-click oer to force the
axis is zoomed
ration. Almoschange the ploe. The “Commonly used plot
ow, which is oregister valuee displayed. Aselect the Ren. In Figure 2 Temperature
ales. In Figureges are very ale to fill the y
want to compa
ata from the fhe Graph Palele—With this tool until the
s option to zoos option to zoooint—With thieen Zoom In Point—With t
e this option toon the top or e scale to a sp
d in, a scroll b
st every aspecot type (pointsmon plots” pot types.
opened from es as a functioAn array of puegisters to be 25, two Registe) on Scale 2
F
e 25, the rangdifferent, we y-axis indepeare graphs on
full trial are plette at the lowoption, click rectangle covom in on an aom in on an ais option, clickabout Point athis option, clo autoscale abottom tick lapecific range
bar appears u
ct of the plot cs or lines or b
ortion of the pl
the main progon of time. Thull-down mendisplayed; usters are being.
Figure 25
ge of values fchose to plot
endently. In can the same sc
lotted in the gwer left of the a point on the
vers the zoomarea of the graarea of the grak a point you and Zoom Ouick a point yoll x- and y-sca
abels on a y-sof values.
underneath th
can be configboth), plot intelot configurati
gram windowhe # of Plots us will appease the right-hag displayed, T
for Temp is 0 them on diffe
ases where thcale, they can
graph. To zoograph. There
e display you m area. aph along theaph along thewant to zoom
ut about Pointou want to zooales on the grscale (or left o
he graph and
gured. Click oerpolation, lineion applies a
C
using the Recontrol under with the samand menu to Temp (Tempe
to 1.1; the raerent scales (he ranges of vn all be plotted
om in on one pe are 6 tools. want to be th
e x-axis. e y-axis. m in on. Presst. om out from. raph or chart.or right labels
can be used
n the color ploe and point cocombination
Coulbourn Ins
egister item inerneath the grme number ofselect which
erature) on Sc
nge for Delta1 and 2). Thevalues for diffd on the same
portion, use th
he corner of th
s and hold the
. on the x-sca
to scroll throu
ot icons to theolor, line thickof features at
struments
32
n the Log raph sets f rows. scale the cale 1,
Temp is -e ferent e scale.
he
he zoom
e <Shift>
le) and
ugh the
e left of kness, t once to

Graphic State Coulbourn Instruments
33
Scale configuration. The Scale Legend at the top left corner of the graph is used to configure the appearance of the graph scales. There is one line for the X-scale (time) and for each of the available Y-scales. Click the Scale configuration button for any one of the scales to set the mapping (linear or log), precision (how many digits in the labels), format of the labels, and whether the scale elements (label and ticks) are visible. Exporting the graph. Right-click on the graph and select Copy Data to Clipboard in order to … copy the numeric data of the graph to the clipboard. Select Export Image to put a copy of the graph image into a file or the clipboard. Several formats are available.
For export to a drawing program like Illustrator (for making high quality figures for publication), use the EPS format and save the image to a file. Open the file in Illustrator. All of the elements of the drawing will then be editable. You’ll likely find that the elements are grouped together. Use Illustrator’s Ungroup function to separate them. Some elements will also have clipping masks, which you can remove by selecting the Clipping Mask -> Release item from the Object menu. Next/Last File. To proceed to the next (previous) Log file in a folder, use the Next or Previous Data File… items in the File menu. Note that this option will open the next data file and display the results in any open analysis windows (the main Graphic State window, the Log window, the Analysis Window and the Register Display window).

Graphic State Coulbourn Instruments
34
APPENDIX A Valid Functions for Register and List Math Functions likely to be particularly useful are highlighted in blue. abs(x) - Returns the absolute value of x. acos(x) - Computes the inverse cosine of x in radians. acosh(x) - Computes the inverse hyperbolic cosine of x. asin(x) - Computes the inverse sine of x in radians. asinh(x) - Computes the inverse hyperbolic sine of x. atan(x) - Computes the inverse tangent of x in radians. atanh(x) - Computes the inverse hyperbolic tangent of x. ciel(x) - Rounds x to the next higher integer. (Ceil is short for Ceiling.) cos(x) - Computes the cosine of x, where x is in radians. cosh(x) - Computes the hyperbolic cosine of x. cot(x) - Computes the cotangent of x (1/tan(x)), where x is in radians. csc(x) - Computes the cosecant of x (1/sin(x)), where x is in radians. exp(x) - Computes the value of e raised to the x power. expm1(x) - Computes one less than the value of e raised to the x power ((e^x) – 1). floor(x) - Truncates x to the next lower integer. getexp(x) - Returns the exponent of x. getman(x) - Returns the mantissa of x. int(x) - Rounds x to the nearest integer. intrz(x) - Rounds x to the nearest integer between x and zero. ln(x) - Computes the natural logarithm of x (to the base of e). lnp1(x) - Computes the natural logarithm of (x + 1). log(x) - Computes the logarithm of x (to the base of 10). log2(x) - Computes the logarithm of x (to the base of 2). max(x, y) - returns the larger of x and y. min(x, y) - returns the smaller of x and y. rand(x) - Produces a floating-point number between 0 and 1 exclusively. The value of x has no effect on the
result. “Exclusively” means that rand will return numbers arbitrarily close to 0 and 1, but never 0 or 1. sec(x) - Computes the secant of x, where x is in radians (1/cos(x)). sign(x) - Returns 1 if x is greater than 0, returns 0 if x is equal to 0, and returns –1 if x is less than 0. sin(x) - Computes the sine of x, where x is in radians. sinc(x) - Computes the sine of x divided by x (sin(x)/x), where x is in radians. sinh(x) - Computes the hyperbolic sine of x. sqrt(x) - Computes the square root of x. tan(x) - Computes the tangent of x, where x is in radians. tanh(x) - Computes the hyperbolic tangent of x. gamma(x) - Evaluates the gamma function for x. pi(x) - Computes pi * x ci(x) - Evaluates the cosine integral for any real nonnegative number x. si(x) - Evaluates the sine integral for any real number x. spike(x) - Generates the spike function for any real number x. 1 if x is greater than or equal to 0 and less than 1;
0 for all other values of x. st(x) - Generates the step function for any real number x. 0 for x less than 0; 1 for all other values of x. square(x) - Generates the square f

Graphic State Coulbourn Instruments
35
APPENDIX B If you would like to copy the example protocols, open the folder titled, “Sample GS4 Protocols” and copy the files to your hard drive. We suggest organizing your protocols so you might want to create a folder putting them in a subfolder of the “Program Files\Graphic State” folder. You will be able to access protocol files in GS4 regardless of where they are stored on your computer. GS4 includes a Context Sensitive Help window that can be turned on and off. To activate and remove the Context Sensitive Help window from any of the programs, select the “Help” menu and choose “Show Context Help” or hold the “Ctrl key” and strike the “H” key. A check mark next to the “Show Context Help” in the Help menu indicates the window is being displayed. If a check mark is displayed but the Context Sensitive Help window does not appear remove the check mark (select “Show Context Help” from the Help menu or hold the “Ctrl” key and strike the “H” key) and then activate the Context Sensitive Help window by selecting “Show Context Help” from the Help menu or holding the “Ctrl” key and striking the “H” key. Once the Context Sensitive Help window is displayed you can drag Context Sensitive Help window and place it wherever you like on the screen. Using the cursor, hover any part of the main Graphic State window and information pertaining to that specific entry or area of the screen will be provided. Move the cursor to another area of the screen and the size of the window will automatically adjust to accommodate the new text that is displayed. We have created two movies that can be seen on You Tube providing instructions for using Graphic State (the protocol builder) and Graphic State RT (the run time program). These videos can be seen at the following links: Contact your Sales and Applications Specialist for access to these movies.